
Abstract
The purpose of this project was to evaluate the safety effectiveness of Dynamic All-Red Extension (DARE) systems. North Carolina Department of Transportation has used DARE to combat red light running (RLR) crashes on major road approaches of selected rural, isolated traffic signals since 2011. Sixteen intersections were included in the before–after analysis. DARE systems in this study were implemented to target a specific crash type: frontal impact crashes (angle, left turn, right turn, head on) caused by vehicles traveling through the intersection and running the red light. Although there was some variability in the magnitude and significance of the results among treatment groups, there was a general reduction in the frequency of target RLR crashes. The crash modification factor (CMF) using empirical Bayes (EB) methodology was 0.93 (7% reduction in target RLR crashes) for all 16 treatment sites; for seven multilane at two-lane sites where DARE was the sole treatment, CMF was 0.65 (35% reduction in target RLR crashes), which was statistically significant at the 95% confidence level. The benefit–cost ratio of the treatment was 143:1, realized from low installation cost and the high cost of RLR crashes. The treatment appeared promising as a systemic safety treatment applied to isolated intersections with higher speed limits, especially for intersections with multilane major roads. Safety professionals should consider adding this safety countermeasure to the limited list of tools available to treat RLR crashes. DARE was inexpensive, demonstrated safety benefits, and caused minimal delays in rural applications without creating driver habituation.
According to a 2019 report from the AAA Foundation for Traffic Safety, the number of red light running (RLR) crashes is on the rise in the United States with a reported 939 fatalities resulting from RLR crashes in 2017 ( 1 ). Most people killed are not the drivers who ran the red light. Others suffer the consequences for the error of the at-fault driver. Nearly half of fatalities were passengers or people riding in other vehicles. Pedestrians and bicyclists represented more than 5% of fatalities associated with RLR.
There are a limited number of tools to effectively address RLR crashes, especially for rural, isolated intersections where red light cameras might not be feasible. Police enforcement can be difficult in locations where violations are very rare. For some rural, isolated locations there may be only a handful of RLR events in a day ( 2 ). Engineering countermeasures such as signal backplates, double indicating the red signal display, and applying advance warning systems with flashers may provide some benefit by increasing the conspicuity of the traffic signal, but do not provide any protection against vehicles entering the intersection on red.
A typical 1-s all-red clearance interval creates a safety cushion for vehicles entering the intersection on red before an opposing movement receiving a green indication. Whereas roughly 80% of RLR is captured with a 1-s all-red clearance interval, the remaining 20% enter after the first second of red with the chance of another vehicle entering the intersection from an intersecting approach ( 3 ). Another treatment option is to extend the all-red clearance interval by a static amount for every cycle, but transportation agencies are reluctant to do so on a wide scale because it can have negative implications for delay, and drivers could potentially adapt to a static, extended all-red clearance interval over time, undoing any safety benefits.
The Dynamic All-Red Extension (DARE) system is a safety countermeasure designed to reduce crash risk from RLR by providing additional protection when an RLR vehicle is detected. The system intervenes in the operation of a traffic signal when it senses a vehicle is likely to violate the red indication by holding the signal controller timing in the all-red clearance interval before switching right of way, thus allowing the offending vehicle time to clear the intersection before the next phase receives a green indication. The all-red extension is variable depending on how late in the yellow and red clearance timing interval the offending vehicle is detected. The intent is for DARE to reduce the crash potential caused by vehicles entering the intersection during the first few seconds of red, without causing driver adaptation ( 2 ). North Carolina Department of Transportation (NCDOT) has used DARE as a safety countermeasure on the major road approaches of select rural, isolated traffic signals across the state since 2011.
Figure 1 shows vehicles captured on video running the red light at two intersections in North Carolina before DARE was installed. Cameras were installed at some of the initial DARE sites for monitoring purposes. In Figure 1a, the pickup truck was observed to enter the intersection approximately 3 s into red, causing an angle crash. Figure 1b shows a commercial motor vehicle that entered the intersection approximately 2 s into red.
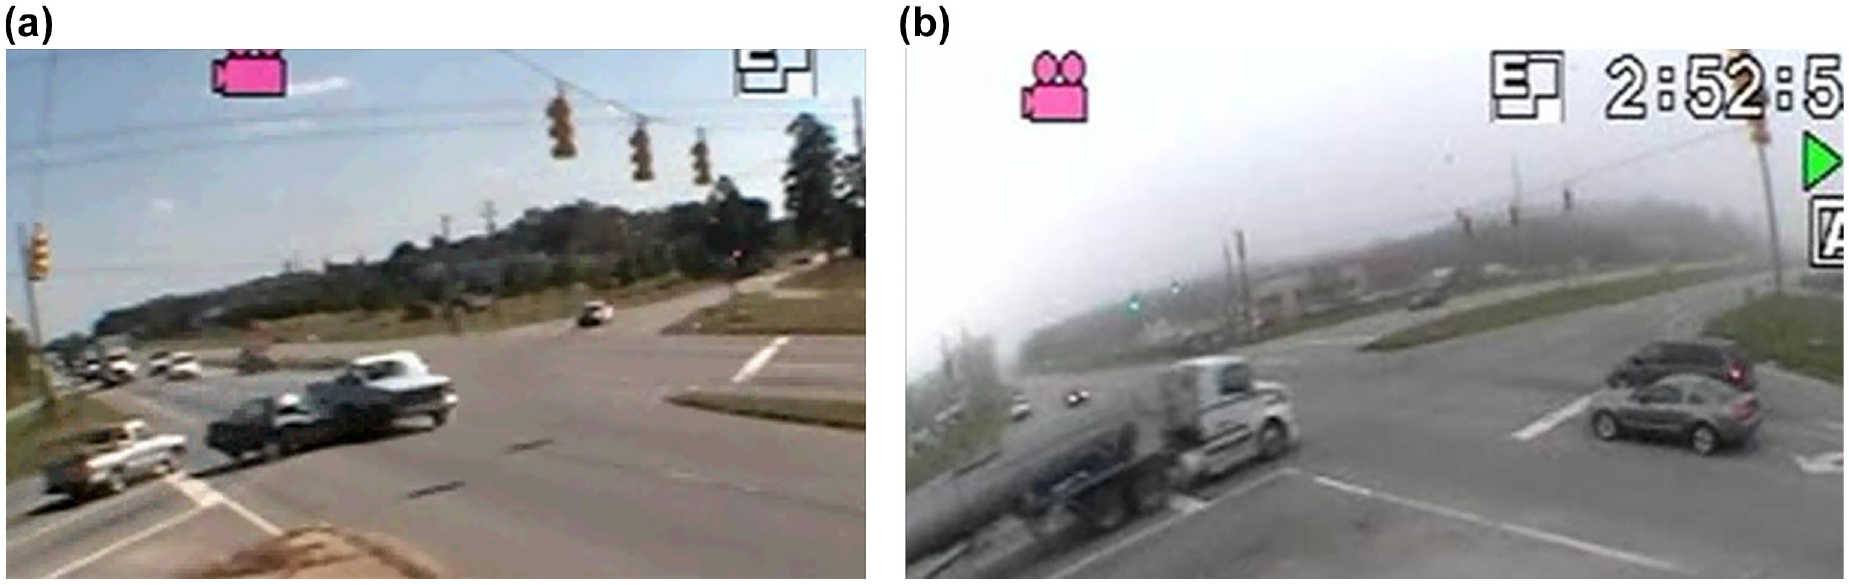
Video-captured red light running vehicles at traffic signals in North Carolina: (a) pickup truck causing an angle crash and (b) commercial motor vehicle entering the intersection while the cross street signal was green.
The purpose of this project was to determine whether the installation of DARE systems reduced the number and severity of crashes related to RLR at a group of treated signalized intersections.
Literature Review
DARE systems, also called red clearance extension or dilemma zone protection systems, have been implemented in Europe for decades. In the United States, only a small number have been installed in several states over the last 15 years, including North Carolina, Maryland, and Oregon. Published research on installed sites is limited, and no conclusive safety studies have been performed. No safety results can currently be found in the Crash Modification Factors (CMFs) Clearinghouse, which is a central, web-based repository of CMFs from safety research conducted around the world ( 4 ).
The most comprehensive safety study, conducted in 2012, examined the safety effectiveness of red extensions installed at eight intersections in Portland, OR, between 2005 and 2009 ( 5 ). Unlike the rural and isolated sites being studied in this paper, the sites were urban and higher volume. The annual average daily traffic (AADT) ranged from roughly 15,000 to 50,000 vehicles per day. Ten comparison group intersections were included in the analysis. Results showed a reduction in angle crashes using simple before and after, comparison group, and empirical Bayes (EB) methodology; however, multiple other signal upgrades were implemented at the treated intersections over the course of the study periods. The CMF for angle crashes using EB methodology was 0.64, with a 95% confidence interval of 0.36 to 0.92. The author was not able to obtain an accurate log of the changes made to each of the treated intersections over the years and concluded “without an accurate history, it is difficult to know accurately the effect of a singular treatment like red extension on safety” ( 5 ).
Anecdotal evidence from a sole dilemma zone protection system in Maryland suggests that “right-angle crashes have been dramatically reduced” since the system was deployed ( 6 ). The rural intersection had experienced 89 reported crashes before implementation from 2000 to 2010, 40 of which were angle crashes.
Simpson et al. studied the operations of installed DARE systems at nine initial pilot implementations in North Carolina in 2017 (
2
). This research provided full details on the DARE system design and on how the systems affected driver behavior and delay when installed. An abbreviated version of the NCDOT DARE system design parameters is provided here: The NCDOT DARE system is a hybrid composed of two different sub-systems: Oasis/2070 controller and Northstar Controls model NQ4 Speed Advisory System. The NQ4 speed advisory system uses two six-foot by six-foot inductive loops spaced approximately 10 feet apart to detect the speed of approaching vehicles. The loops provide outputs, which feed into inputs of the NQ4 logic unit and determine if the preset speed threshold has been violated. The speed threshold is generally equal to 5-mph below the design speed of the treated approaches. If the speed threshold has been violated, the NQ4 triggers an alarm output, the duration of which is calculated based on the loop closest to the stop bar getting a vehicle completely through the intersection at the DARE speed threshold. The stop times are typically rounded to 5 seconds. The Oasis/2070 controllers’ logic processor scheme allows the controller to place a stop time only if the controller is currently timing the red clearance interval of the violated approach and any concurrent phase yellow clearance indications are “off.” If all conditions are met, the stop order is placed while the alarm output from the NQ4 is active. Since the alarm output could have initiated during the yellow change interval, the stop order would only be placed for the remaining alarm output time while in the red clearance interval. The system is termed “dynamic” because the amount of time the red clearance is increased can vary from one cycle to the next. The system has failsafe components built into its operation where the controller will transition into flash mode (either for “stuck” operation or lack of alarms in a 24-hour period), which ensures the Department is promptly aware of the malfunction.
Figure 2, which is replicated from the pilot implementation research, provides a simplistic example scenario of DARE operation in which the yellow interval is 5 s and the default all-red interval is 1 s. The loop placement varies based on the calculated braking distance for the design speed. In the example scenario the design speed for this approach is 55 mph; therefore, the first loop is located 240 ft from the stop bar. The vehicle crosses the loops at 3 s into the yellow interval and is traveling at least 50 mph to meet the speed threshold. A 5-s stop time is placed on the red interval when the vehicle crosses the loops, which means the vehicle has 2 s of remaining yellow, 1 s of default all-red, and 2 s of red extension. Therefore, the total all-red interval for this approach during this cycle is 3 s.
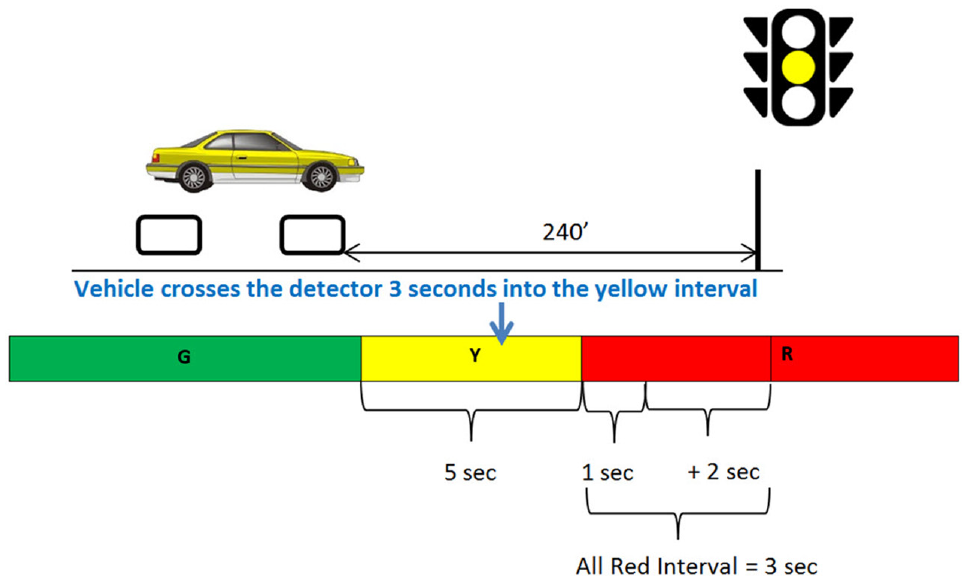
Example dynamic all-red extension illustration ( 2 ).
In the initial phase of the NCDOT project, RLR violations were studied as a measure of whether drivers would adapt to the DARE systems over a 12-month period. Additionally, the frequency and duration of red extensions over a 3-year period were studied as a measure of system operation and performance. The following outcomes were observed:
The results suggested there was minimal driver habituation to DARE when comparing the preinstallation to the 12-month postinstallation vehicle compliance data results.
DARE operated successfully over a 3-year period and remained in operation with minimal surveillance at the study locations.
The dynamic lengthening of the all-red interval was not associated with noticeable increases in delay at the rural and isolated study locations. The results showed the additional delay created by unnecessary red extensions was likely trivial, possibly ranging from 0 to 8 s/h per treated approach at the pilot sites ( 2 ).
Study Locations
The crash data from 16 signalized intersections treated with DARE were studied. The locations spanned 9 of the 14 divisions in North Carolina. There were six coastal sites, nine piedmont sites, and one mountainous site. The sites from the coastal and piedmont areas had relatively flat topography. The signals included a mixture of multilane at two-lane- and two-lane at two-lane intersections. Figure 3 provides aerial views of two representative treatment intersections.
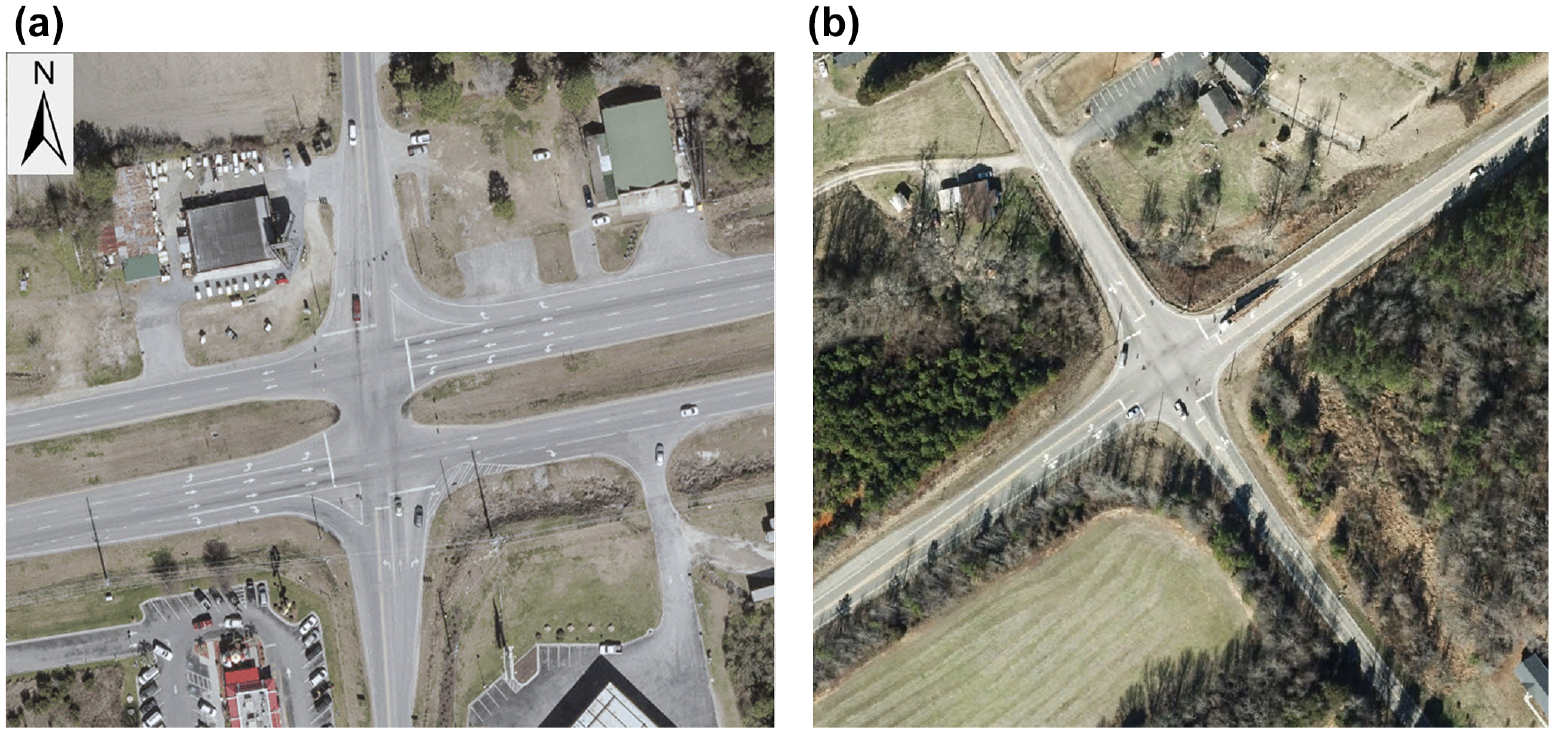
The sites were all rural and isolated with design speeds on the major road ranging from 45 to 65 mph. DARE installations took place between 2011 and 2018. The average before period was approximately 4.9 years and the average after period was approximately 3.3 years.
This effort focused on extending the red time when vehicles were detected on the major approaches. Both major road approaches were treated at most sites, except for three sites where only one mainline approach was treated owing to a strong directional crash pattern. DARE was the sole countermeasure for 11 of the 16 intersections. In the remainder, other signal conspicuity- and RLR-focused treatments were implemented in addition to DARE during the same installation year. Other treatments included activated advance warning flashers, rest in red signal phasing, double red signal indication, and signal backplates. Table 1 provides a summary of the intersection site and crash characteristics.
Treatment Locations
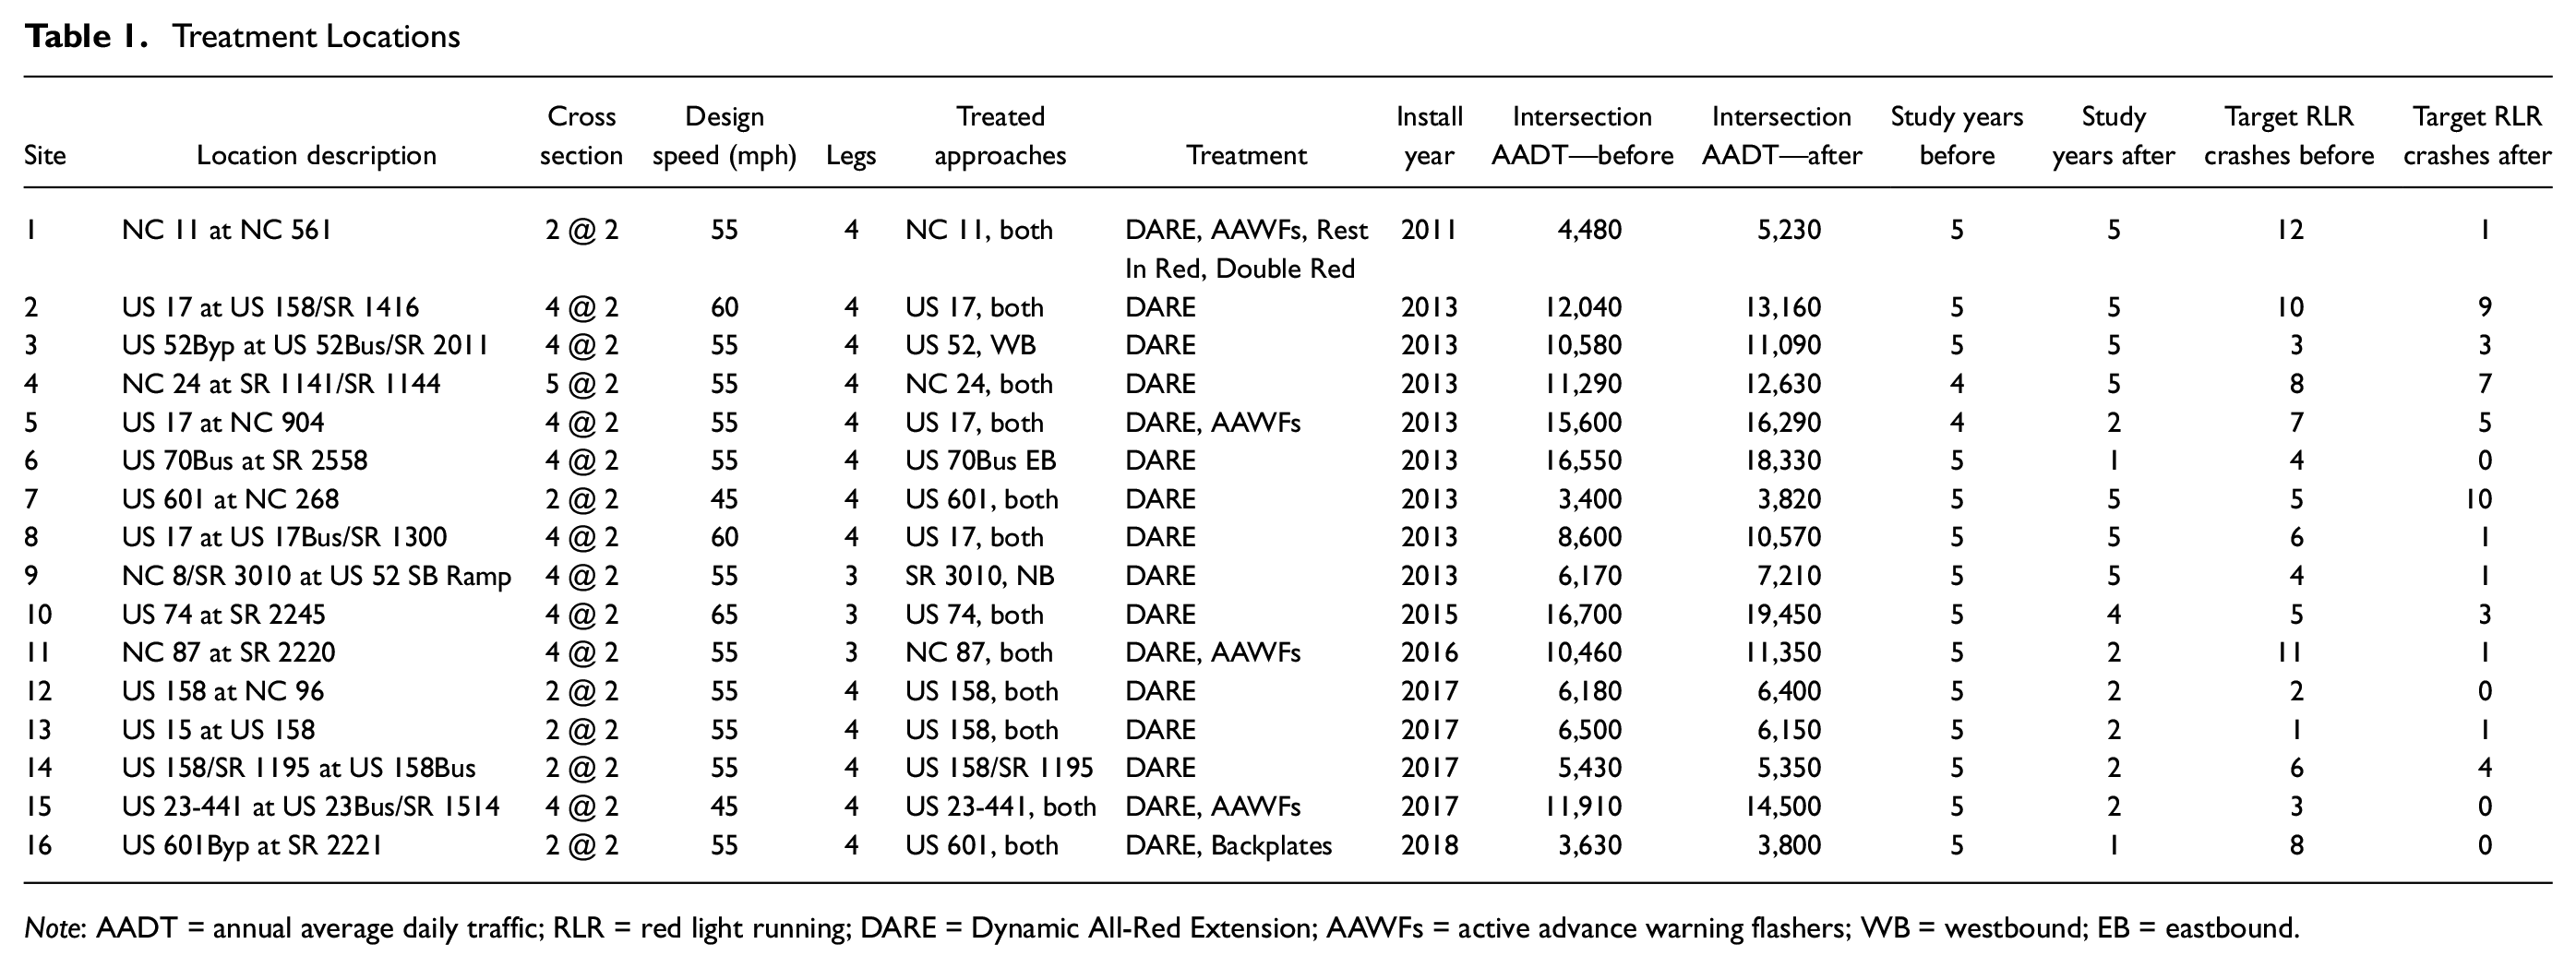
Note
Study Methodology
A before and after crash analysis was performed at each intersection utilizing the Traffic Engineering Accident Analysis System software developed by NCDOT’s traffic engineering branch. The software accesses the North Carolina Traffic Records Database, which contains all reported crashes in the state since 1990. The current threshold for police officers reporting crashes in North Carolina is $1,000. The study time periods varied depending on the installation date, with the earliest study year beginning in 2006 and the latest study year ending in 2019. Five years of crash data were obtained in the before and after period where feasible; however, time periods were shortened if other changes were made at a treatment site or if the treatment site was a newer installation.
The DARE systems included in this study were implemented to target a specific crash type; therefore, the analysis conducted in this study was limited to frontal impact crashes caused by a vehicle on a treated major road approach traveling through the intersection and running the red light. Crash reports for all frontal impact crash types (angle, left turn, right turn, and head on) were manually reviewed to determine whether the crash involved an RLR vehicle and whether the at-fault vehicle was on a treated approach. Fault was determined by manually reviewing the crash narrative, diagram, and citations issued. Fault could be determined for nearly all crashes. Crashes for which fault could not be determined were included in the sample, with the assumption that they did involve the predominant pattern of an RLR vehicle on the major road. The data consisted of all crashes within 150 ft of the treatment intersections.
There are notable limitations to using a naïve before and after analysis because this assumes that nothing has changed from the before period to the after period except for the treatment and exposure, to which any changes in crashes can therefore be solely attributed. Therefore, both naïve before and after and EB before and after techniques were utilized. EB methodology helps to account for selection bias and to overcome the threat of regression to the mean, along with other potential deficiencies in a naïve before and after analysis. Regression to the mean is the presumption that a site will return to its long-term mean crash frequency after an extraordinarily high or low period. Regression to the mean was a threat in our case because crash history was a factor in the selection of treatment.
The safety performance functions (SPFs) used in the EB approach are shown in Table 2. The rural, four-leg signalized intersection SPFs were sourced from the Highway Safety Manual (HSM) ( 9 ). The rural, three-leg signalized intersection SPF was sourced from National Cooperative Highway Research Program (NCHRP) Document 297 and was developed for consideration in the second edition of the HSM ( 10 ). The parameters a, B1, and B2 were utilized to derive Nspf, the SPF estimate of the predicted crash frequency for the base conditions. AADTmajor is the AADT (vehicles per day) on the major road and AADTminor is the AADT on the minor road. k is the overdispersion parameter of the SPF.

Parameters Used in SPF Formula
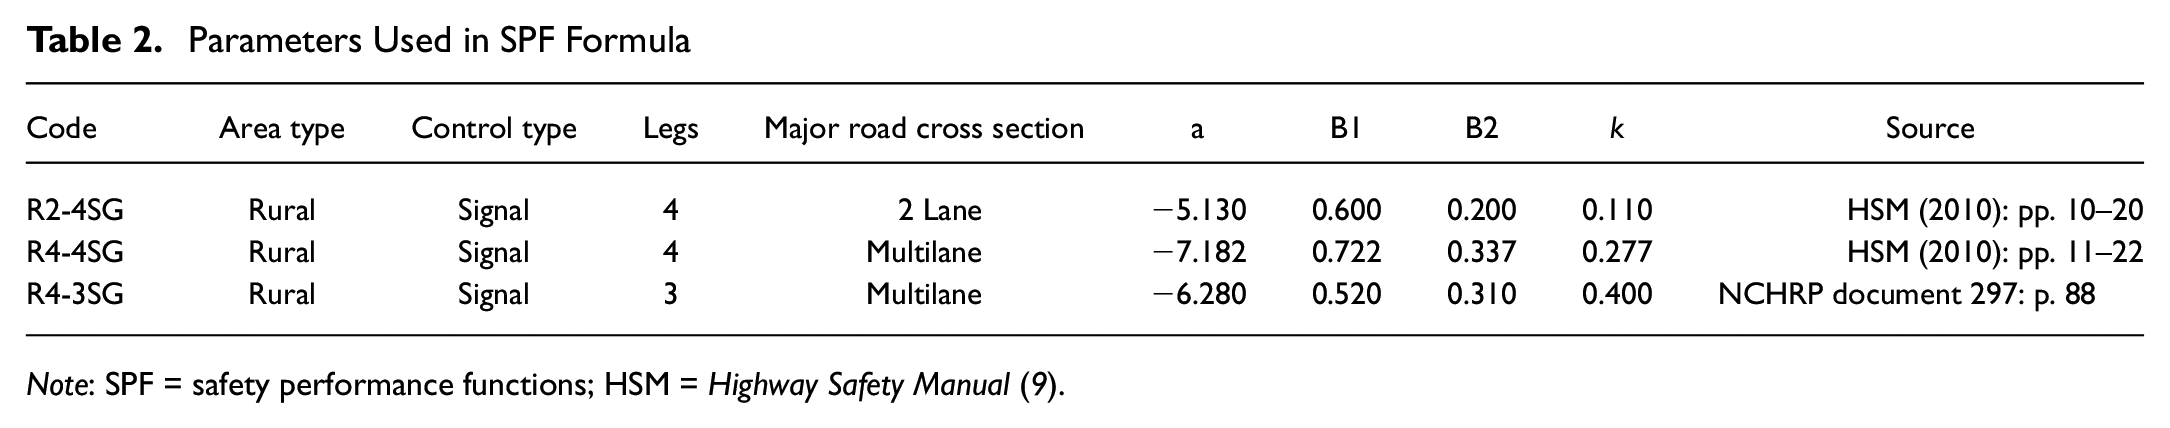
Note: SPF = safety performance functions; HSM = Highway Safety Manual ( 9 ).
The EB approach requires the use of crash data from untreated reference sites to calibrate the SPFs. Approximately five reference sites per treatment site were chosen, which included 58 multilane at two-lane reference sites and 25 two-lane at two-lane reference sites. The reference sites were rural, high-speed intersections under signalized control for the duration of the study period and without major changes made during the study periods. Reference sites were chosen based on general proximity to treatment sites and falling within similar AADT ranges. Various aerial and streetside maps, signal plans, and traffic volume maps were used in the selection of reference sites and to confirm they met these criteria. The annual calibration factors, C, derived from the total reference group varied from 0.33 to 0.60 during the study time frame.
Many of the locations treated with DARE were selected for treatment based on an observed crash pattern in the before period. The average frequency of target RLR crashes in the before period was 1.2 crashes per year, with a range of 0.4 to 2.4 crashes per year among the treatment sites. This was compared to an average frequency of 0.6 target RLR crashes per year for the group of 83 nontreated reference sites.
The associated CMFs for each SPF were sourced from the HSM and NCHRP Document 297 and used to adjust the base SPF estimate for the effects of site-specific geometric design and lighting features. CMFs were used to account for intersection skew angle (CMF1i), left-turn lanes (CMF2i), right-turns lanes (CMF3i), and lighting (CMF4i). CMF1i is 1.00 for all cases since the risk of crashes related to skew angle is limited at signalized intersections ( 9 ). CMFs are not available for rural four-leg multilane signalized intersections in the HSM as the SPF has no specific base conditions; therefore, a CMF of 1.00 was applied for this intersection type.
All SPFs used in the analysis were at the total crash level. The reference sites were used to determine the target RLR crash proportion. This was computed as the ratio of target RLR crashes to total crashes in the reference group sample. Like the treatment sites, all frontal impact crashes for the reference sites were manually reviewed to determine target RLR crashes on the major road approaches. The proportion of crashes was applied to the SPF formula to determine the results specific to target RLR crashes. The proportion of crashes for the two-lane at two-lane intersections was 0.12 and the proportion of crashes for the multilane at two-lane intersections was 0.13, meaning the percentage of target RLR crashes from the reference group was 12% to 13% of total crashes.
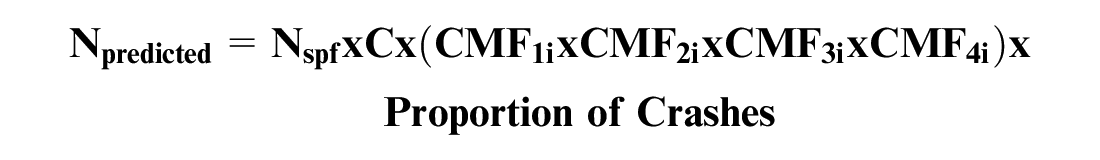
The North Carolina calibrated SPFs were used to estimate the predicted crash frequency of the treatment sites had no improvements been made, Npredicted.
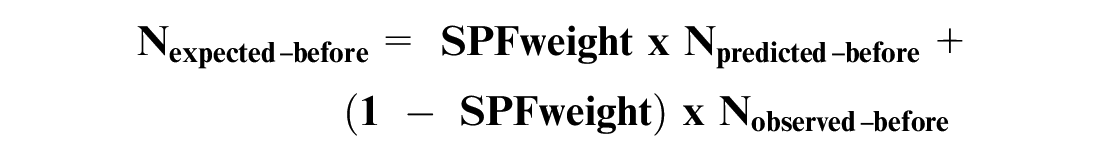
The observed before period crashes at the treatment sites, Nobserved_before, were weighted with the predicted before period crashes at the treatment sites, Npredicted_before, to estimate the expected number of before period crashes at the treatment sites, Nexpected_before. The SPF weight was derived using the overdispersion parameter from the SPF. The following equations were sourced from the EB before–after studies section of A Guide to Developing Quality Crash Modification Factors ( 11 ).
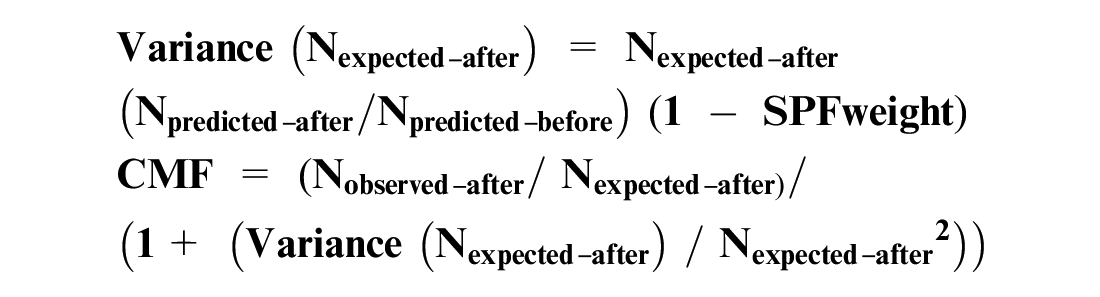
The expected number of after period crashes at the treatment sites, Nexpected_after, were estimated by multiplying the expected number of before period crashes at the treatment sites, Nexpected_before, and the ratio of predicted after period crashes at the treatment sites, Npredicted_after, to predicted before period crashes at the treatment sites, Npredicted_before.

The CMF was approximately equal to the observed after period crashes at the treatment sites, Nobserved_after, divided by the expected after period crashes at the treatment sites, Nexpected_after, with a small adjustment based on the value of the expected after period crashes and its variance.
Results
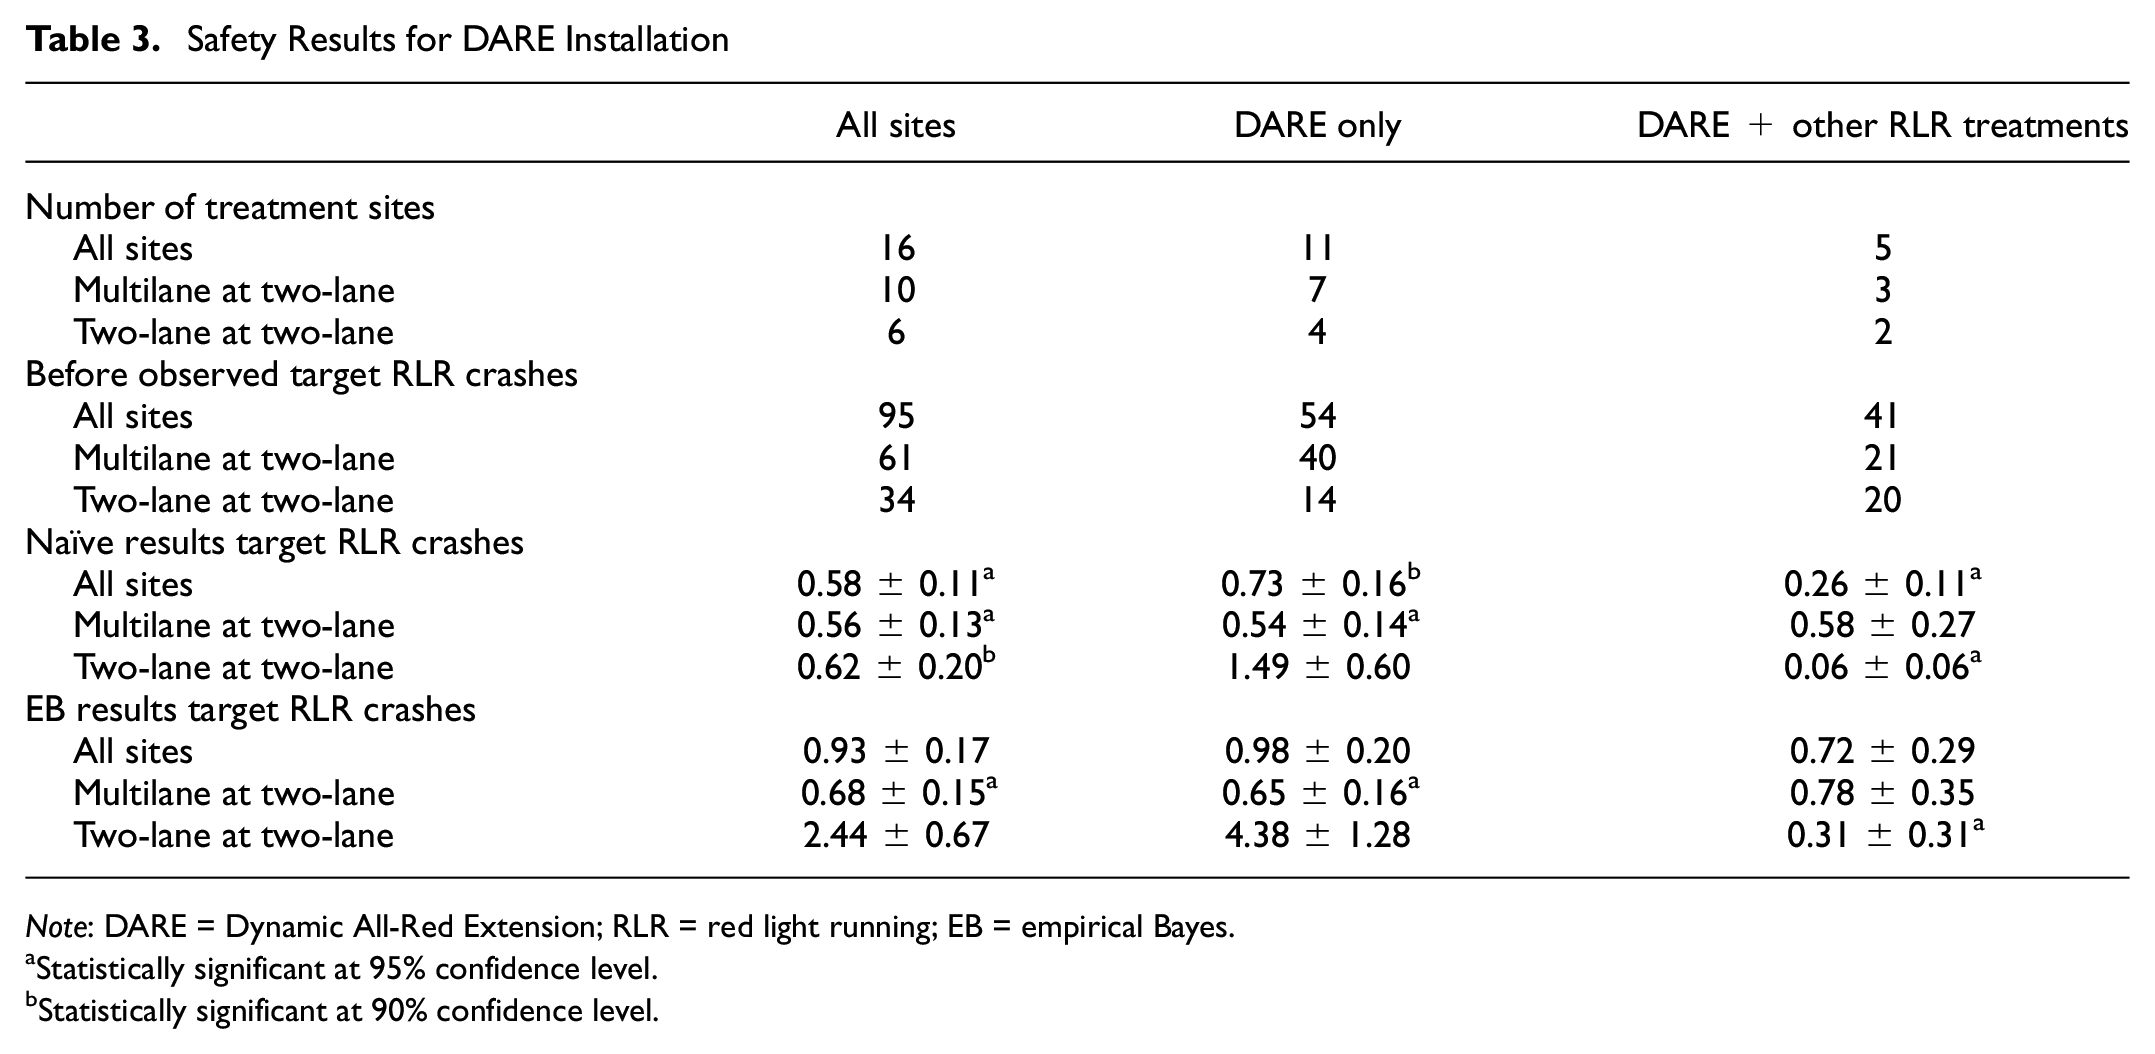
Table 3 provides the safety results. The 16 treatment sites are grouped by the intersection type (multilane at two-lane or two-lane at two-lane) and treatment type (DARE was the only treatment installed or DARE was installed along with other RLR treatments). For each group, the number of treatment sites, sample of before period observed crashes, naïve CMF results, and EB CMF results are provided. The value after the “±” notation indicates the standard error of an estimated value. Although the results are provided in CMF form in Table 3, the following discussion will refer to the results in crash reduction factor (CRF) form for ease of digestion. The CRF is calculated as (1-CMF) × 100.
Safety Results for DARE Installation
Note
Statistically significant at 95% confidence level.
Statistically significant at 90% confidence level.
The naïve results showed a 42% reduction in target RLR crashes for the 16 sites that received the DARE system, which was statistically significant at the 95% confidence level (95% confidence interval for a CMF of 0.37 to 0.80). The naïve results showed improvements in eight of nine treatment groups, with five of nine groups showing a statistically significant reduction in target RLR crashes at the 95% confidence level.
The EB results showed a 7% reduction in target RLR crashes for the 16 sites that received the DARE system, which was not statistically significant at the 95% confidence level (95% confidence interval for a CMF of 0.60 to 1.27). The EB results showed improvements in seven of nine treatment groups, with three of nine groups showing a statistically significant reduction in target RLR crashes at the 95% confidence level.
Although there was some variability in the magnitude and significance of the EB results, it appeared there was generally a reduction in the frequency of target RLR crashes. The EB results were especially promising for the group of 10 sites where the DARE treatment was applied at multilane at two-lane intersections, which saw a statistically significant 32% reduction in target RLR crashes (95% confidence level for a CMF of 0.39 to 0.97). The EB result for the seven multilane at two-lane sites where DARE was the sole treatment was a 35% reduction in target RLR crashes, which was statistically significant at the 95% confidence level (95% confidence level for a CMF of 0.34 to 0.96). Although only comprising two sites, the two-lane at two-lane intersections that received DARE and other RLR treatments performed very well, which suggests potential benefits from a synergistic application of treatments.
For the naïve results, the sole group that did not show improvement was the two-lane at two-lane sites that received the DARE treatment only. For the EB results, the two groups that did not show improvement were all the two-lane at two-lane sites and the two-lane at two-lane sites that received the DARE treatment only. Site 7, a two-lane at two-lane site, appeared to have a negative influence on the safety results in these groups. This site showed a particularly high increase in after period target RLR crashes, doubling from five crashes in the 5 years before treatment to 10 crashes in the 5 years after treatment. However, there are several unique conditions at Site 7 that may explain why it differed from the other treatment sites: the loops for one treatment approach were placed between driveways for a corner gas station, which could have caused issues with vehicles entering the roadway from the driveway and either missing the loop or not traveling fast enough to activate the system; the design speed (and speed limit) was 45 mph, which was lower than most treatment sites; the intersection AADT was one of the smallest of the treatment groups; and the RLR activity was the lightest of any site studied in the initial phase of the project (e.g., at 6-months post installation, Site 7 averaged 0.12 RLRs/h, whereas the other sites in the initial phase of the project averaged 0.74 RLRs/h) ( 2 ).
If Site 7 is removed from the EB results, the remaining 15 treatment sites showed a 25% reduction in target RLR crashes, which was statistically significant at the 90% confidence level (90% confidence level for a CMF of 0.50 to 0.99). The point of discussing Site 7 and the results without this site is twofold. First, it is to demonstrate that the sample of target RLR crashes was relatively small and the removal of this one site had a dramatic impact on some of the results. Despite having 16 treatment sites in the study, because the frequency of RLR crashes was relatively low (making up 12% to 13% of total crashes), the crash samples were relatively low. For all 16 sites, there were 95 observed crashes in the study before period. When the data were further divided into subgroups for disaggregate analysis, the samples became even smaller with 14 to 61 observed crashes in the before period. Second, it is to point out that unfavorable results for the two-lane at two-lane group may be related to characteristics beyond the intersection geometry, such as speed, volume, topography, and other site-specific factors.
Though the results presented here focus on the effect of DARE on target RLR crashes, the author did evaluate the effect of DARE on total crashes at the treatment sites. The results showed either no significant change or modest reductions in total crashes. This supports the case that DARE could be implemented to reduce target RLR crashes with no adverse effect on other crash types.
Severity Analysis
Although RLR crashes can occur with relatively low frequency, they can be especially severe because of the typical collision angles of frontal impact crashes, particularly when the RLR vehicle is traveling at higher speeds. Figure 4 provides the severity of observed target RLR crashes per year for all treatment sites before and after treatment. The majority of target RLR crashes resulted in injury, both before and after treatment; however, reductions in target RLR crashes per year were seen for all injury levels. Before implementation, 0.8 target RLR crashes per year (or roughly 4%) were fatal and 1.1 target RLR crashes per year (or roughly 5%) were disabling Class-A injury crashes. Postimplementation, there were no fatal or Class-A injury crashes. Samples were small but the results suggest that the safety cushion provided by DARE may have contributed to an improvement in safety for the higher-level severity crashes.
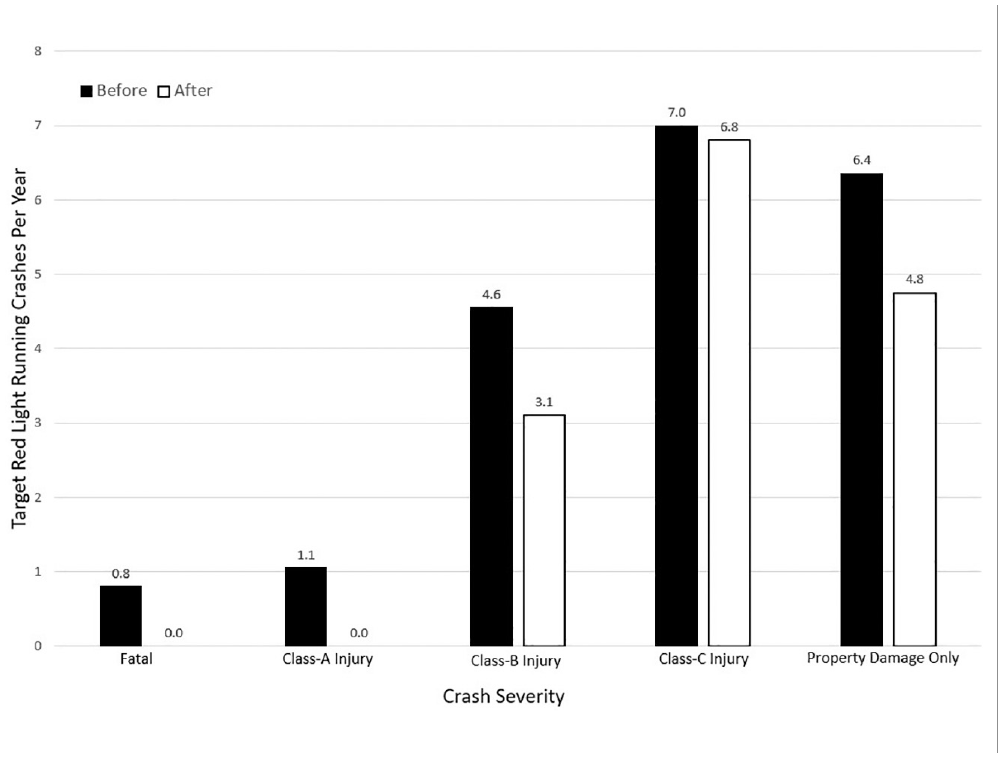
Before and after crash severity distribution of observed target red light running crashes.
Benefit–Cost
Benefit–cost was computed using before and after target RLR crash severity data for the 11 treatment sites where DARE was the sole countermeasure. The 2019 standardized crash cost estimates for North Carolina were used ( 12 ). The cost per crash for frontal impact crashes is $3,288,000 for fatal and Class-A injury crashes, $166,000 for Class-B and Class-C injury crashes, and $12,500 for property damage only crashes. The annual crash cost saving for the 11 treatment sites where DARE was the only implemented countermeasure was $1.98 million.
DARE is a relatively low-cost solution as designed in North Carolina. The average installation cost was approximately $5,000 per treated approach. Inductive loops were used for detection and in many cases the existing Oasis/2070 controller could be tweaked, keeping costs low. A total project installation cost of $95,000 was estimated to treat the 19 major road approaches for these 11 sites.
The maintenance costs associated with DARE have been minimal. We observed some maintenance issues when monitoring the initial pilot treatment sites, but they appeared to be general signal maintenance issues, and not specifically related to the DARE system. An annual maintenance cost of $125 was assumed per approach. A 10-year service life was used. The calculated benefit–cost ratio was 143:1, which is the ratio of the median annual benefits to the median annual cost.
Conclusions
The EB results showed a 7% reduction in target RLR crashes for the 16 sites that received the DARE system. Disaggregate analysis revealed the conditions under which the treatment appeared most effective. Because of the limited number of treatment sites within each bin, groupings were limited to the intersection geometry (multilane at two-lane or two-lane at two-lane) and treatment type (DARE was the only treatment installed or DARE was installed along with other RLR treatments).
DARE application for the multilane at two-lane signals was especially promising, with results from the EB analysis demonstrating a statistically significant 32% reduction in target RLR crashes for 10 treated intersections. Specifically looking at the seven multilane at two-lane signals where DARE was the only treatment implemented, the EB results showed a similar statistically significant 35% reduction in target RLR crashes.
For the multilane at two-lane sites, there did not appear to be a large distinction in results between sites that received the DARE treatment only and those where DARE was applied with other RLR treatments. All EB results for the multilane at two-lane sites showed similar improvements ranging from 22% to 35% reductions in target RLR crashes.
Application of DARE for two-lane at two-lane signals may also have promise, however, mixed results were observed. Given the variability in the two-lane at two-lane results, it is advised that only the multilane results be used and the two-lane at two-lane results should be viewed as preliminary until more research can be performed on a larger sample. The overall results, as well as the results for the two-lane at two-lane intersections, were influenced by Site 7 in the EB analysis, a two-lane at two-lane site that experienced a doubling of target RLR crashes in the after period. It should be noted that severity decreased for Site 7, with the highest-level injury being Class-B in the before period and the highest-level injury being Class-C in the after period.
For the two-lane at two-lane sites, there was a difference in results between sites that received the DARE treatment only and those that received DARE applied with other RLR treatments. Although only comprising two sites, the two-lane at two-lane intersections that received DARE and other RLR treatments performed very well. Site 1 in this group was the first DARE installation in North Carolina and came with a slew of additional treatments such as improvements to the “Be Prepared to Stop When Flashing” signing, double red signal indication, and rest in red signal phasing. This combined set of treatments appears to have had an overwhelmingly positive effect at this intersection, which had a 20-year history of experiencing one fatal or Class-A injury RLR crash every other year: it experienced no fatal or Class-A injury crashes in the 5-years postinstallation. The synergistic application of DARE and other treatments appears to have quelched RLR crashes at this intersection.
The DARE system will not capture all crashes related to RLR events, but it does provide extra protection against angle crashes caused by a specific group of mainline RLR vehicles. DARE targets the group of RLR vehicles that enter the intersection after the default all-red interval (typically ranging from 1 to 2 s) and generally captures vehicles entering the intersection up to 4 to 5 s into red. The safety results generally aligned with or exceeded what was anticipated based on observations at the pilot DARE implementation sites. In prior research by Simpson et al., 17% of RLR violators entered the intersection between 1 and 5 s into red during the postinstallation periods and 12% of RLR violations were specifically targeted by DARE ( 2 ). Assuming similarity between the percentage of violations and crashes targeted by the treatment, we had anticipated target RLR crash reductions in the 10% to 20% range.
DARE has great potential to improve safety at several signalized intersections, especially in rural, isolated areas where enforcement or other countermeasures may be difficult to implement. The 143:1 benefit–cost ratio realized by DARE is particularly promising owing to the low installation costs and the high costs associated with fatal and severe-injury RLR crashes. Transportation agencies should consider this safety countermeasure for systemic application across isolated intersections with higher speed limits. DARE is inexpensive, causes minimal delay in rural applications, does not create driver habituation, and provides demonstrated safety benefits. Prevention of one fatal or severe-injury crash by having the system in place could justify hundreds of DARE installations for an agency.
The results are promising but additional research is needed to solidify the anticipated safety outcomes. We hope this research will serve as a catalyst for transportation departments within the United States and elsewhere to consider DARE as a viable safety countermeasure. Given a larger and more diverse group of U.S. sites to study, researchers could expand on this work and develop better safety estimates for a variety of conditions. The impacts of location characteristics such as speed, volume, topography, and other site-specific factors could be analyzed. Given the increasing trend in RLR and the challenges RLR crashes pose, solidifying this as an effective safety countermeasure across multiple agencies would be a worthy endeavor.
DARE in North Carolina has focused on rural applications, although other agencies such as Portland, OR appear to have successfully utilized similar tools in urban environments. Caution should be exercised at sites in urban areas or in a more congested environment where the system may be triggered on a much more frequent basis. There may be more delay and a higher likelihood of driver adaptation. Enhanced detection methods would need to be utilized to minimize false positives.
NCDOT focused efforts on major road approaches as this was typically where most RLR crashes were observed, especially for the multilane at two-lane intersections. Although typically not as frequent, RLR crashes did occur on nontreated minor road approaches. Future applications could expand DARE to all approaches if RLR violations and crashes are occurring from the minor roads as well.
Footnotes
Acknowledgements
The author thanks NCDOT Traffic Safety Unit staff, specifically Shawn Troy for providing guidance, Tim Nye for assistance with building the reference group and reviewing the paper, and Daniel Carter, Daniell Bagley, and Lee Cowhig for reviewing the paper. The author thanks Mark Harrison and the signal design staff for designing the systems for implementation in North Carolina. The author also thanks all the folks who helped get this initiative off the ground by recommending, funding, installing, and maintaining the systems.
Author Contributions
The author confirms sole responsibility for the following: study conception and design, data collection, analysis and interpretation of results, and manuscript preparation.
Declaration of Conflicting Interests
The author declared no potential conflicts of interest with respect to the research, authorship, and/or publication of this article.
Funding
The author received no financial support for the research, authorship, and/or publication of this article.
The work reported in this paper was performed while the author worked at NCDOT. The contents of the paper do not represent the views or opinions of that institution, and any errors in the paper are those of the author.