
Abstract
Transportation agencies across the U.S. are increasingly looking to the Safe System approach as a path toward achieving Vision Zero and other similar road safety performance goals. Vision Zero and the Safe System approach seek to eliminate traffic fatalities and serious injuries. The Federal Highway Administration (FHWA) funded an effort to create a Safe System for Intersections (SSI) method to provide a technical basis by which road planners and designers could apply Safe System principles on intersection projects, detailed in the report A Safe System-Based Framework and Analytical Methodology for Assessing Intersections. Applying the SSI method results in a set of SSI scores for each intersection design under consideration. The SSI scores characterize the extent to which an intersection alternative aligns with Safe System principles. This paper builds on the content presented in the FHWA report and describes how the key SSI method components of user exposure, conflict point severity, and intersection movement complexity are combined to produce the SSI scores. This additional background and detail on the development of the SSI scores will support future applications of the method and the identification of future research needs and method improvements.
Keywords
The Safe System approach represents a paradigm shift in road safety management. The Federal Highway Administration (FHWA) has identified the Safe System approach as a means for realizing the goals of programs and partnerships such as Vision Zero and the Road to Zero: eliminating fatalities and serious injuries from the U.S. road system ( 1 ). The Safe System approach is based on the reality that humans make mistakes and the human body is vulnerable. Because of this, it recognizes that crashes will occur and focuses on managing the mechanical forces in those crashes to a level that will not result in fatalities and serious injuries to the people involved ( 2 ). This concept of managing the kinetic energy in a crash is foundational to the Safe System approach. It also underscores that responsibility to eliminate traffic fatalities and serious injuries is shared among all participants in the transportation system—from road users to managing agencies, designers to vehicle manufacturers—and that the safety of that system must be pursued proactively. Figure 1 depicts the six Safe System principles and five key elements, as identified by FHWA.
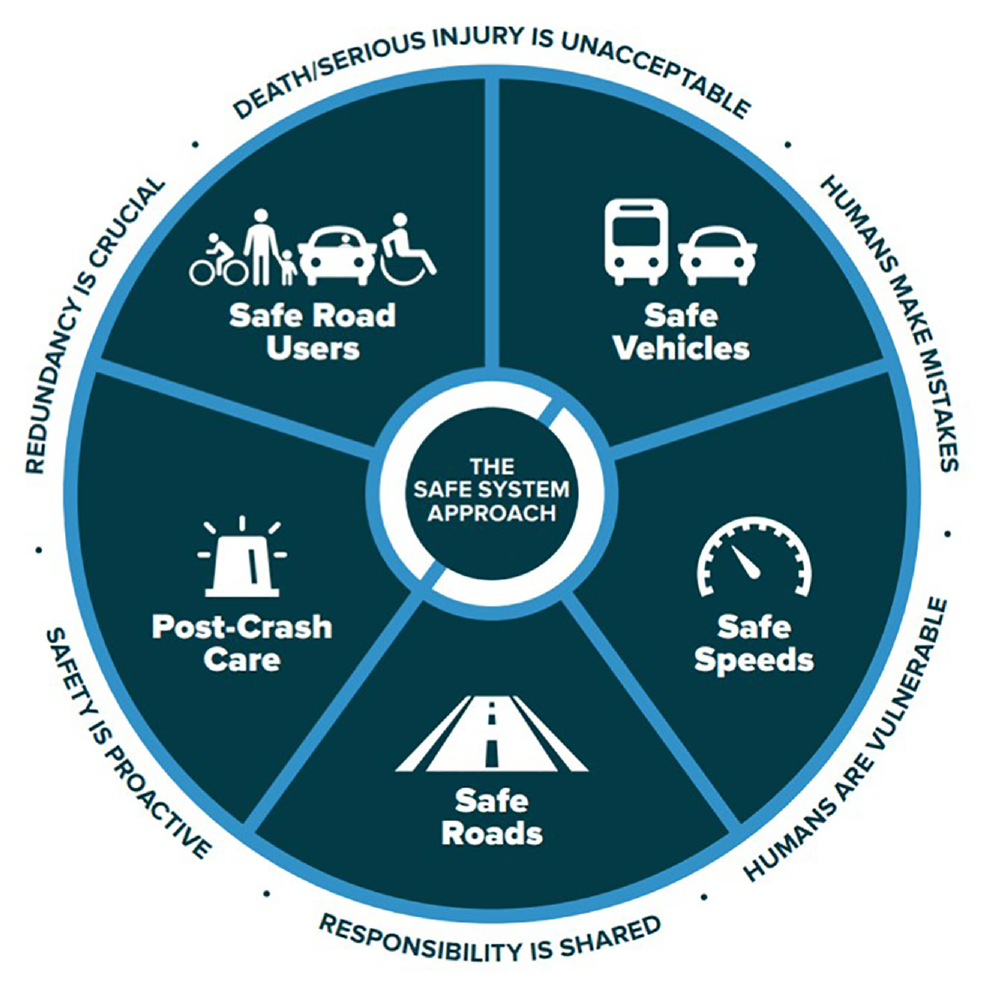
The Safe System approach incorporates six principles and five elements ( 1 ).
Some Safe System principles have become part of the state of practice in U.S. road safety management, to some extent, over the last several decades. However, much of the early experience in developing and implementing the Safe System approach has occurred elsewhere. Sweden was among the first countries to implement a Safe System approach to national road safety management, passing the Road Traffic Safety Bill in 1997. The bill was founded on Vision Zero and based on the idea that a zero-fatality target was the only ethically justifiable target for road safety ( 3 ). Early Vision Zero documentation identified the foundational concept that mobility and safety cannot be “traded off” against each other, but instead the level of mobility follows from achieving the desired level of safety. This is a key paradigm shift in implementing Vision Zero.
The Safe System approach also contends that the desired level of safety cannot be attained using traditional road safety management techniques. Road design has historically accounted for mistakes on the part of road users, for example by widening roadways to allow drivers more space to recover in the event of a deviation in trajectory. However, research shows that wider roads often lead to higher vehicle speeds, increasing the kinetic energy in the occasion of a crash and thus the likelihood of a fatality or serious injury ( 4 ). Safe-System-based roadway design also seeks to accommodate road user mistakes—albeit in a different way—through managing the kinetic energy that is generated in and transferred to the human body in a crash. Belin et al. noted that this kinetic energy management approach is rooted in established scientific research, citing foundational kinetic energy research by DeHaven, Haddon, and Robertson ( 5 – 8 ). Sweden made this scientific framework the basis of its road design and management programs through the Road Traffic Safety Bill and Vision Zero.
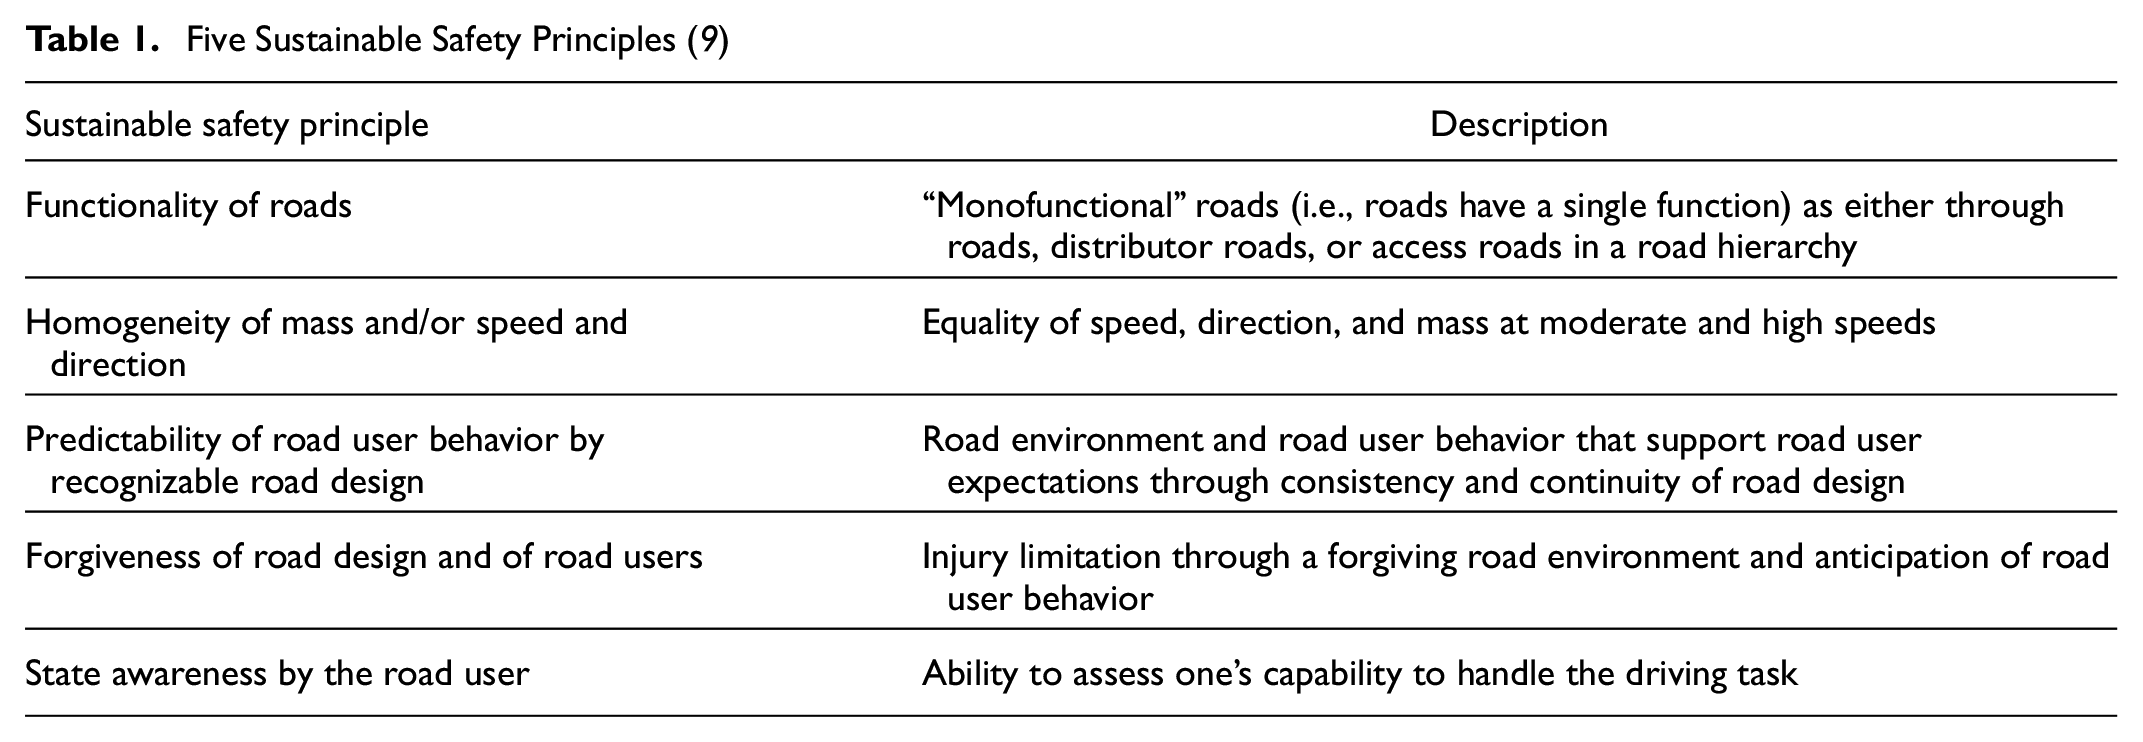
Similarly, the Netherlands developed a vision for a Safe System approach, called Sustainable Safety, in the early 1990s. It was enacted through the Sustainable Safety Start-Up Program in 1997 ( 9 ). The goal of Sustainable Safety is to prevent traffic fatalities and serious injuries and it has five fundamental principles, as summarized in Table 1.
Five Sustainable Safety Principles ( 9 )
The Australian Safety Council adopted the principle of the Safe System approach in 2004, based on Vision Zero and Sustainable Safety ( 10 ). To advance the understanding of the importance of kinetic energy management, Corben et al. developed the conceptual Kinetic Energy Management Model (KEMM) ( 11 ). KEMM featured five “layers” as shown in Figure 2. New Zealand subsequently drew on experience in Australia to develop Safer Journeys 2020: New Zealand’s Road Safety Strategy 2010–2020, based on a Safe System approach ( 12 ).
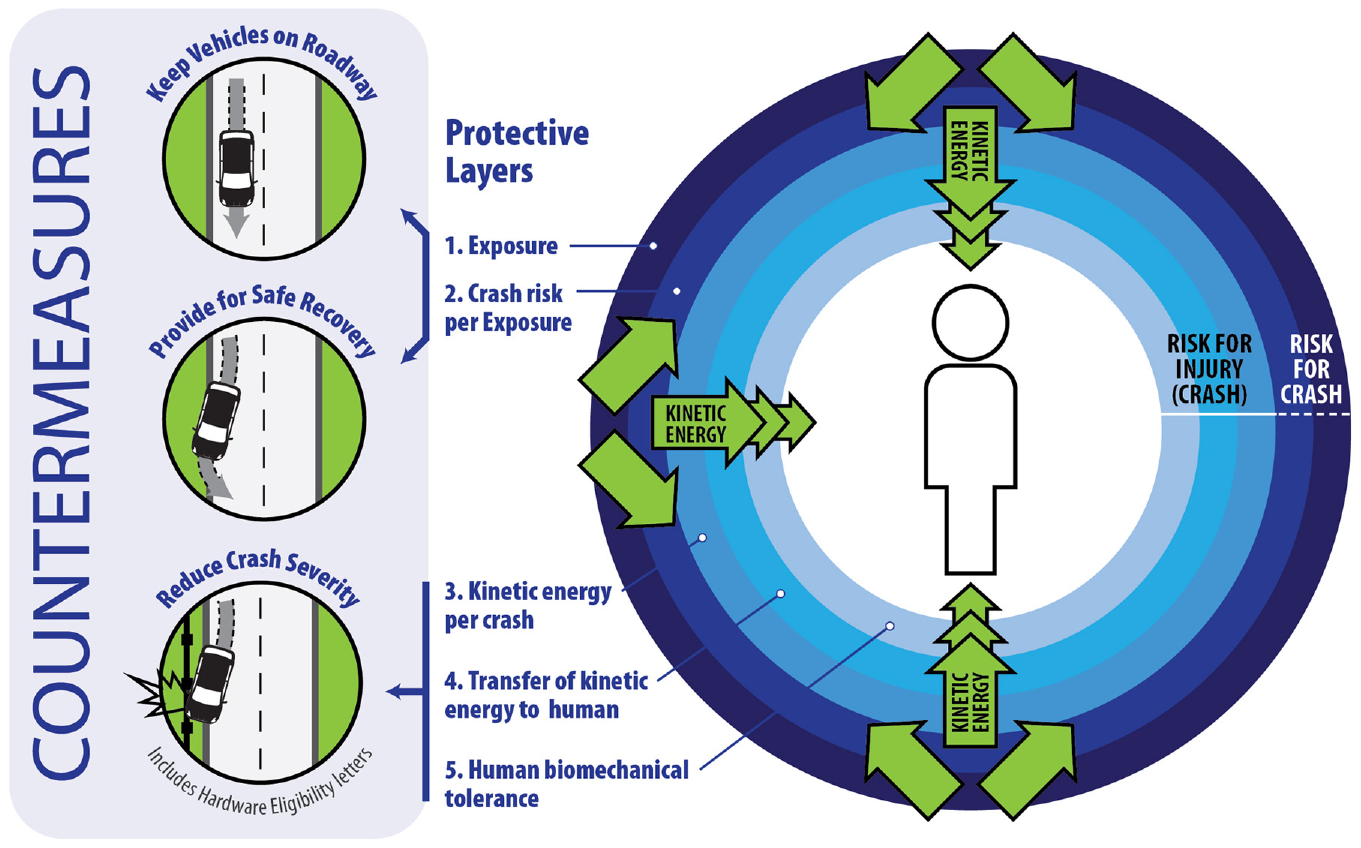
The five layers of protection in the Kinetic Energy Management Model (KEMM), as adapted from Corben et al. ( 11 ).
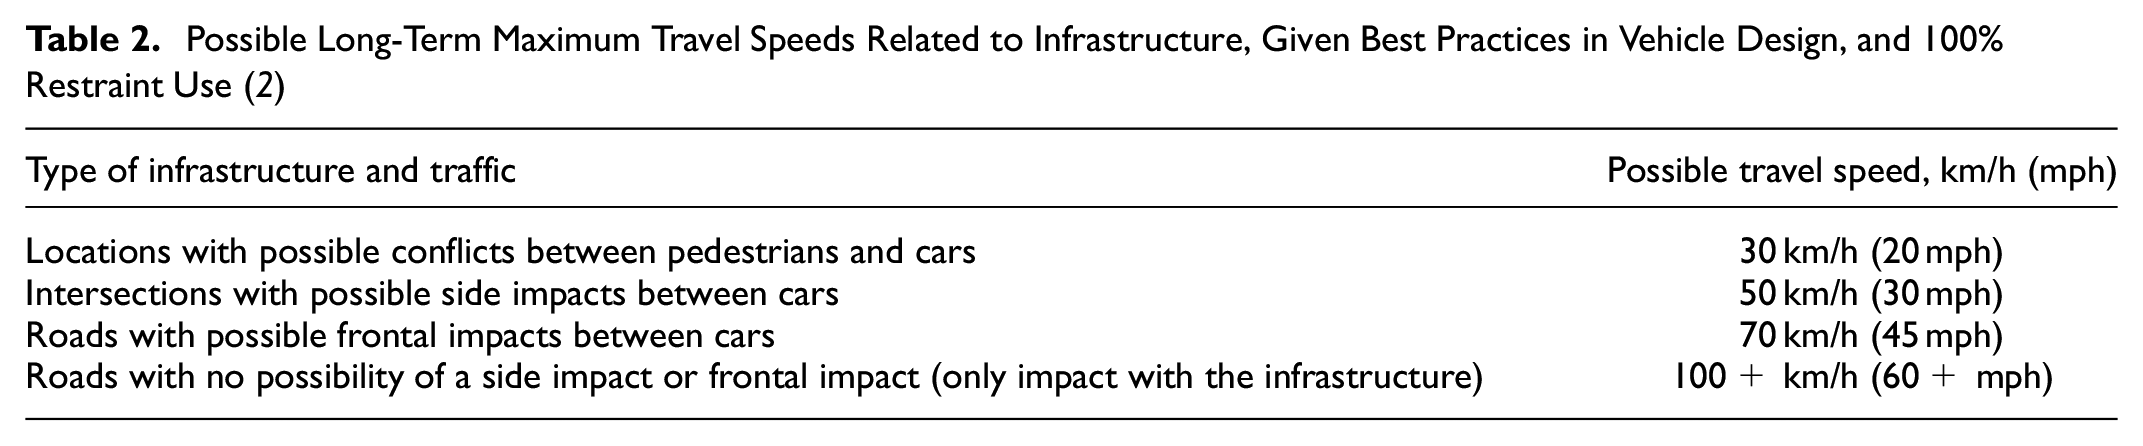
Speed and speed management—along with other factors such as collision angle, road user behavior, vehicle characteristics, and roadway characteristics—are critical determinants of the extent to which a Safe System can be realized. Collision speed is the key determinant of kinetic energy in a crash; kinetic energy is related to mass and the square of velocity. Consolidating concepts of Layers 1, 2, and 3 of KEMM, Tingvall and Haworth provided the speed thresholds shown in Table 2 as representing an “inherently safe system” ( 2 ).
Possible Long-Term Maximum Travel Speeds Related to Infrastructure, Given Best Practices in Vehicle Design, and 100% Restraint Use ( 2 )
As locations with concentrations of planned points of conflict between different road users, at-grade intersections are particularly significant in the overall landscape of safety performance across the U.S. transportation system. In 2019, 28.2% of traffic fatalities in the U.S. happened at intersections, equating to 10,180 fatalities ( 13 ). To provide a technical basis by which intersection planners and designers can apply Safe System principles as part of intersection project planning and alternatives screening, FHWA funded the development of the Safe System for Intersections (SSI) method in 2021. The SSI method is documented in the research report A Safe System-Based Framework and Analytical Methodology for Assessing Intersections ( 14 ). As this report notes, the SSI method was designed to be readily implementable within typical U.S. project development processes and to use commonly available data inputs. It incorporates the concepts of conflict point identification and classification, exposure, conflict point severity based on the estimated level of kinetic energy transfer and management in a crash, and movement complexity. Applying the method produces a set of SSI scores that practitioners and researchers can use to assess how a given intersection alternative aligns with Safe System principles. The SSI method is not based on observed or predicted crash occurrence. Rather, it is designed to complement existing crash-based safety methods or to provide metrics that consider safety in cases where it is not possible to conduct crash-based analyses, such as for atypical or emerging intersection concepts that are not yet addressed by crash-based methods. The SSI method represents the first objective analysis approach that captures key Safe System concepts and is readily implementable in common intersection planning and design processes.
Objective and Scope
The objective of this paper is to present the approach by which the SSI method combines the concepts and resulting metrics related to user exposure at conflict points, conflict point severity, and movement complexity to create an interpretable SSI score. The paper begins with an overview of the method itself, drawing on the content originally presented in the FHWA report A Safe System-Based Framework and Analytical Methodology for Assessing Intersections ( 14 ), and then describes the steps behind the production of the SSI scores and presents an example application of the scoring methodology. The FHWA report that originally presented the SSI method provides detailed content on the concepts surrounding the method, its practical application (including thorough example calculations), and how to interpret its results ( 14 ). However, it did not describe the process used to develop the resulting SSI scores. This paper provides practitioners and researchers with additional background and detail on the mechanics of the SSI scores to support future applications of the method and the identification of future research needs and method improvements.
SSI Method Overview
This section of the paper provides a high-level overview of the SSI method to set the stage for the main purpose of the paper. Readers can reference the full FHWA report for additional detail and explanation ( 14 ).
The SSI method provides a way for intersection planners and designers to apply the concepts of the Safe System approach and kinetic energy management to intersection projects, with the goal of informing project decisions that contribute to reducing fatalities and serious injuries for all road users. As the first such method developed in the U.S. (i.e., a “version 1.0”), it will likely spur additional method expansions and enhancements. This first method focused on implementation within a Stage I Intersection Control Evaluation (ICE), when design alternatives are assessed to determined how well they align with a project’s purpose and need. The SSI method uses commonly available project-level data inputs to be easily implementable by practitioners at this early stage of project development. These include annual average daily traffic (AADT) volume in vehicles per day (vpd), posted speed limit, and number of through lanes on each of the intersecting roads. There are several other optional inputs that are central to Safe System principles but have not historically been as utilized or explored by the research and practitioner communities. If available, the optional inputs will improve the precision of the analysis. They include daily turning movement counts, nonmotorized AADT estimates, vehicle speeds for individual movements, left turn traffic signal phasing, and others. The SSI method offers default assumptions for these optional inputs if they are not available to the method user.
The SSI method has four main components that include different analysis steps: (1) conflict point identification and classification, (2) conflict point exposure, (3) conflict point severity, and (4) movement complexity.
The SSI method identifies conflict points as any points where road user paths coincide ( 15 ). Since this first version of an SSI method is intended for use in alternatives screening, when exact lane arrangements may not be known, the SSI method identifies conflict points on a movement basis as opposed to a lane-by-lane basis. The method assigns conflict points to one of four categories: crossing, merging, diverging, and nonmotorized. Figure 3 depicts the identification and classification of movement-based conflict points for a median U-turn (MUT) intersection.
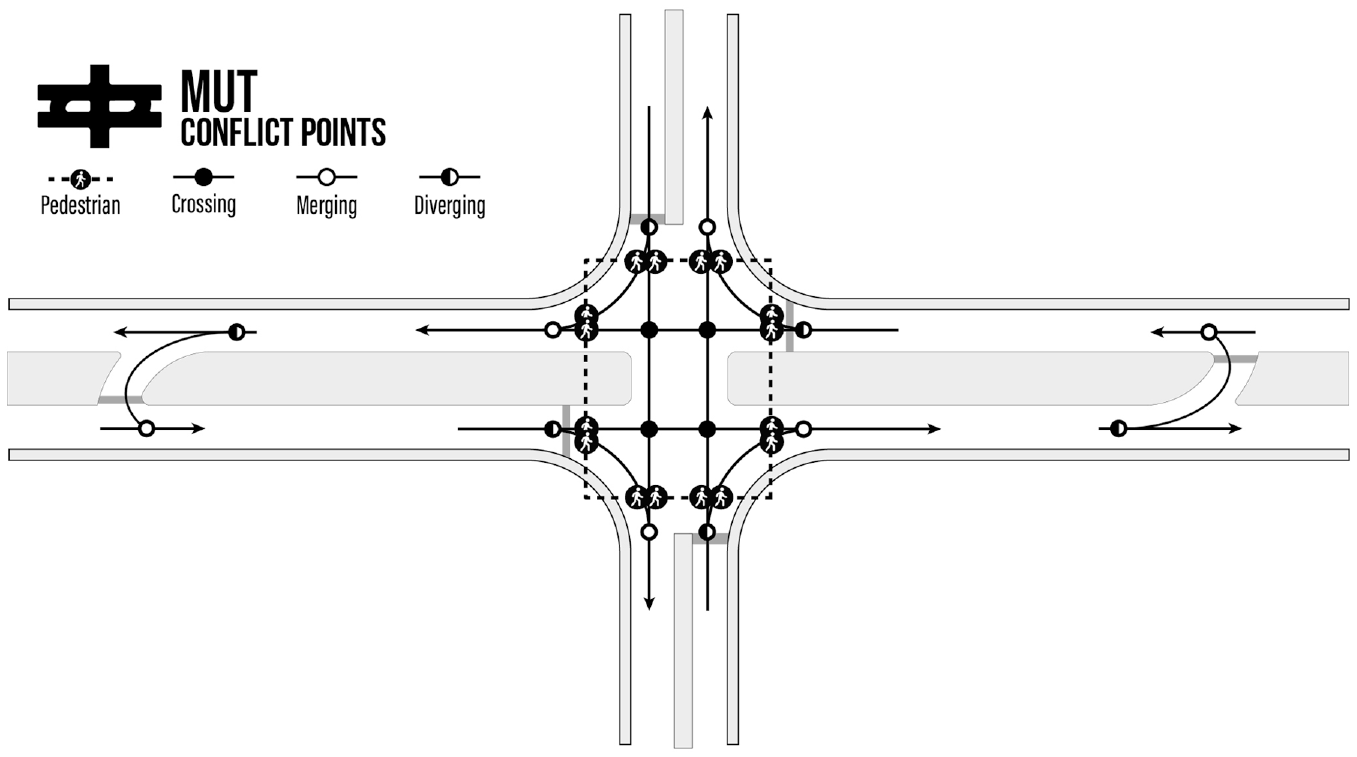
Diagram of movement-based conflict points for a median U-turn (MUT) intersection ( 14 ).
Once the conflict points are identified and classified, the next step of the SSI method estimates the exposure through each conflict point. The SSI method computes an exposure index for each conflict point based on work by Hakkert and Mahalel (
16
). The exposure index,
Conflict point severity in the SSI method is the estimated probability that a crash at a given conflict point involving the conflicting users making typical movements though that conflict point will result in a fatal or serious injury. The SSI method defines this as
The final component of the SSI method includes a set of steps to characterize the complexity of different movements for all users of the intersection. These steps capture user behavior and workload for different movements through the intersection, and how these concepts are affected by the intersection design and operational characteristics. User behavior includes all the actions (both intentional and unintentional) that a driver performs while using the transportation system. User workload reflects the mental resources required to execute the tasks associated with navigating the transportation system. The SSI method includes two movement complexity factors,
The components of the SSI method lead to a set of SSI measures of effectiveness (MOEs). These include the relative exposure at each intersection alternative through each conflict point type, the average severity—i.e., average
SSI Method Scoring
The SSI method combines the concepts of exposure, conflict point severity, and movement complexity to create the SSI scores. The SSI scores can range from zero to 100, where scores closer to 100 represent project contexts and intersection designs that are closer to a Safe System (i.e., low probability of fatality or serious injury for users considered by the method). The method produces an SSI score for each conflict point type at an intersection alternative, as well as an SSI score for the overall intersection alternative.
Exposure-Severity-Complexity Product
Following the application of the method outlined in previous sections of the paper, each conflict point has an exposure index, a conflict point severity, and either one (for vehicle-vehicle conflict points) or two (for nonmotorized conflict points) movement complexity factors. The first step in creating the SSI scores is to calculate the sum of the exposure-severity-complexity products for all conflict points of a given type
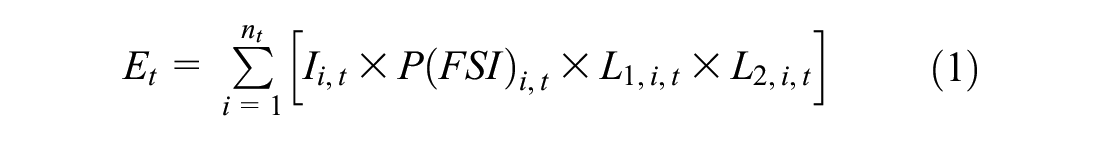
where
Detailed information on computing each of these variables, as well as example calculations, can be found in the FHWA report ( 14 ).
The sum of exposure-severity-complexity products for each conflict point type,
Conflict Point Type SSI Scores and Intersection SSI Score
While the sum of the exposure-severity-complexity products,
Once the sums of the exposure-severity-complexity products for each conflict point type have been obtained, SSI scores are computed for each conflict point type

The primary input in Equation 2 is
The use of the exponential transformation function means that the slope (or rate of change) of the respective SSI scores at a given input value of the sum of the exposure-severity-complexity products is nonlinear. In other words, a difference of one percentage point in the
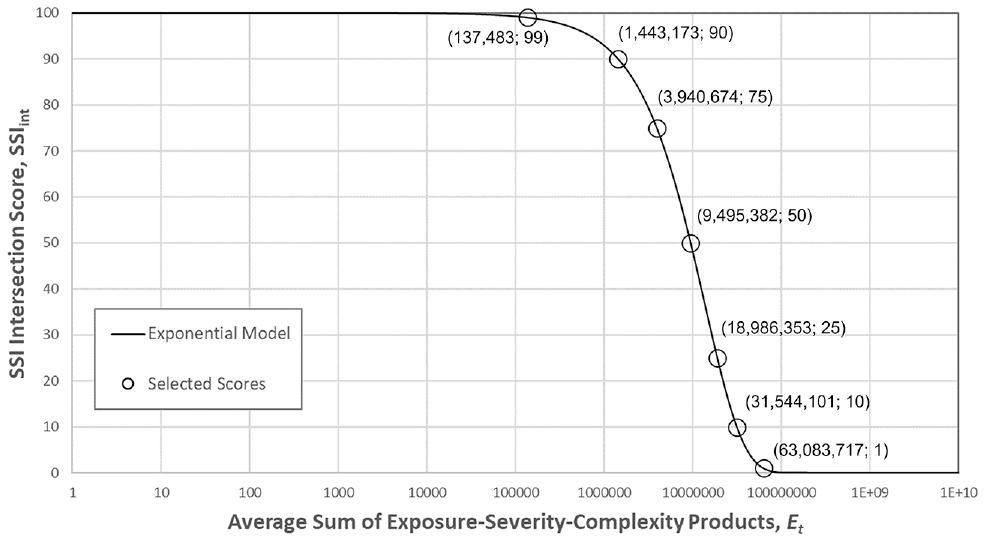
Exponential model for transforming the sum of the exposure-severity-complexity products into Safe System for Intersections (SSI) scores.
In addition to the conflict point type SSI scores from Equation 2, the SSI method also produces an intersection SSI score,
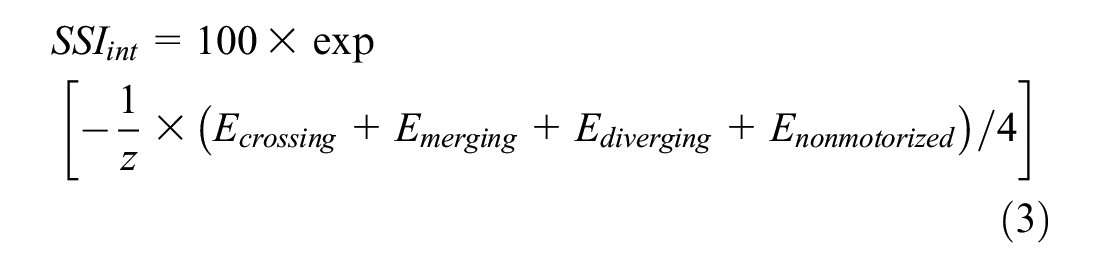
The addition of the four conflict-type exposure-severity-complexity sums (i.e.,
The process for conducting the SSI computations and producing the conflict point type and intersection SSI scores is summarized in Figure 5.
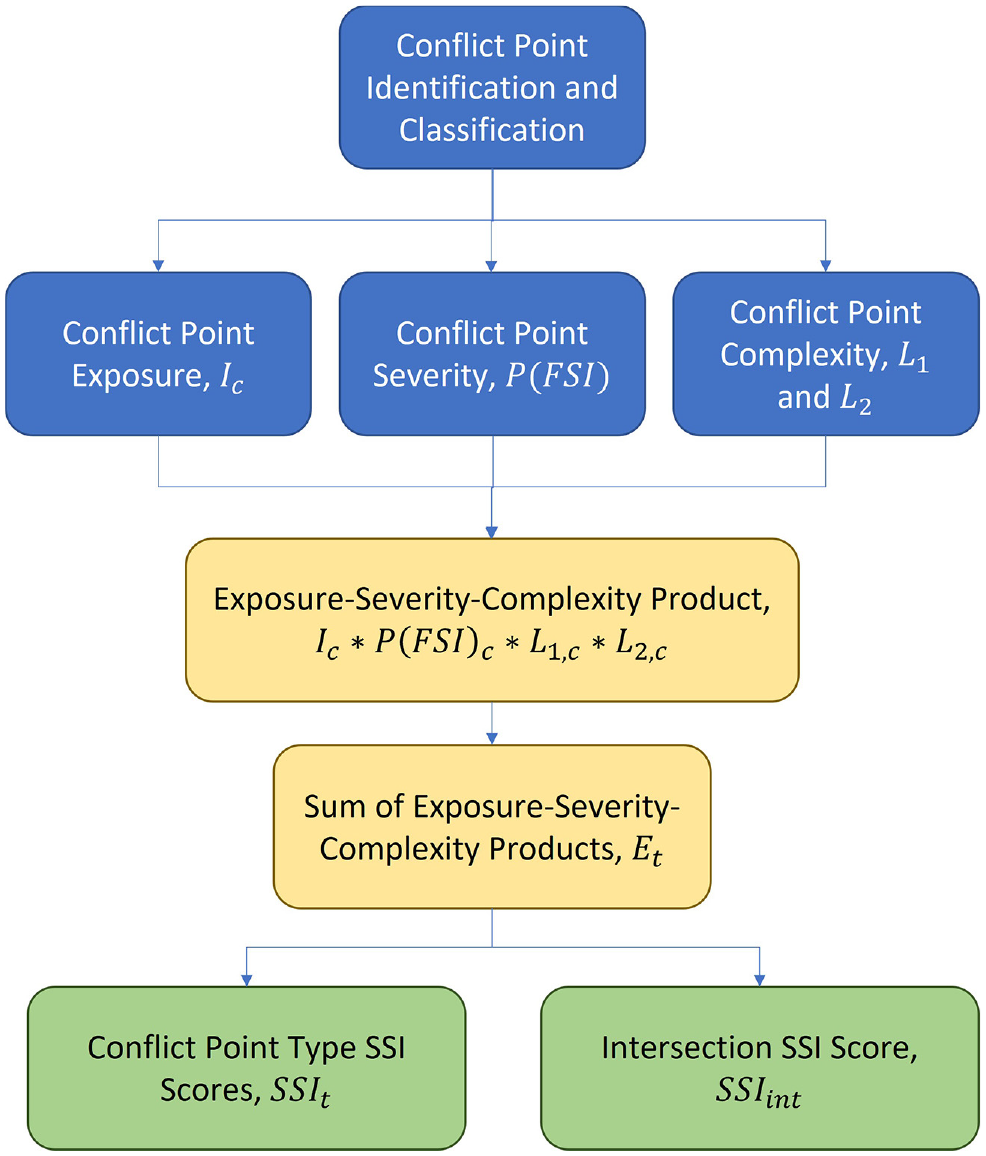
Flowchart illustrating the process for computing the Safe System for Intersections (SSI) scores.
Development of the SSI Scoring Equations and Scale Parameter
The development of the exponential transformation scale parameter introduced in the previous section was performed as follows. First, a batch test analysis was conducted on a range of intersection input values to obtain a representative distribution of potential
Batch Test Analysis
The purpose of the batch test analysis was to obtain a representative distribution of
Batch Input Conditions
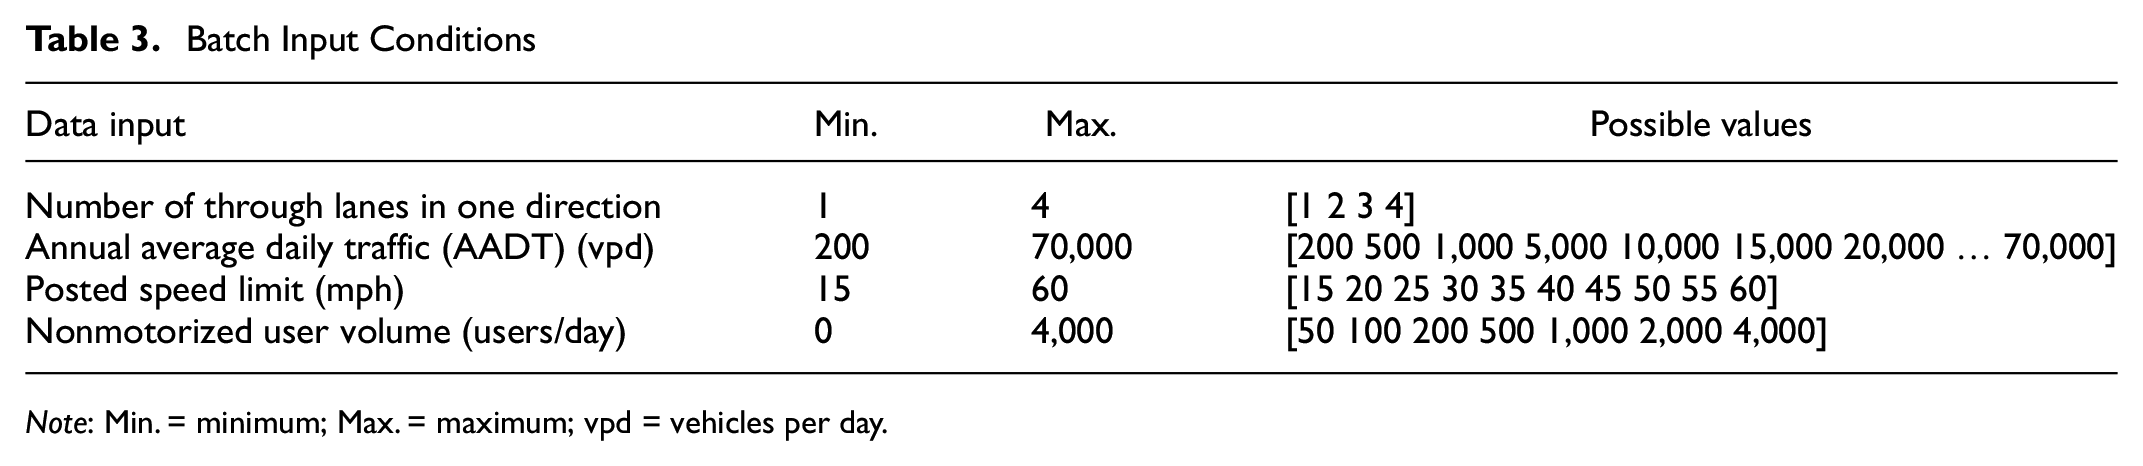
Note: Min. = minimum; Max. = maximum; vpd = vehicles per day.
The process for selecting the batch inputs was as follows:
1. Randomly select major road volume.
2. Randomly select major road number of through lanes in one direction, satisfying the following conditions:
a) If major road volume is less than 20,000 vpd, number of through lanes in one direction is either one or two.
b) If major road volume is greater than or equal to 20,000 vpd and less than or equal to 40,000 vpd, number of through lanes in one direction is either two, three, or four.
c) If major road volume is greater than 40,000 vpd, number of through lanes in one direction is either three or four.
3. Randomly select major road posted speed limit.
4. Repeat steps 1 to 3 for the minor road, satisfying the following conditions:
a) Minor road volume must be less than or equal to 50,000 vpd.
b) Minor road volume must be less than or equal to major road volume.
c) Minor road number of lanes must be less than or equal to major road number of lanes.
d) Minor road posted speed limit must be less than or equal to major road posted speed limit.
5. Randomly select total volume of nonmotorized users at the intersection, satisfying the following conditions:
a) If major road volume is less than 20,000 vpd, nonmotorized user volume is less than or equal to 200 users per day.
b) If major road volume is greater than or equal to 20,000 vpd and less than or equal to 40,000 vpd, nonmotorized user volume is less than or equal to 2,000 users per day.
c) If major road volume is greater than 40,000 vpd, nonmotorized user volume is less than or equal to 4,000 users per day
This process was used to select SSI method inputs for 3,000 random intersection scenarios. The inputs for these 3,000 different scenarios were run through the SSI method calculations to produce a representative universe of possible sums of the exposure-severity-complexity products (i.e.,
Exponential Function Determination
The results of the batch test analysis showed that the
Optimizing the Scaling Parameter
The SSI scaling parameter,

By design, this
Since the average
The value of
Example Scenario and Calculations
This section presents an example scenario designed to illustrate the computation of the SSI scores. For the purposes of this paper, the example will not go into detail on the early steps in the SSI method to compute the results of each method component (i.e., the exposure index
This example scenario involves a suburban signalized intersection of a four-lane arterial and a two-lane collector and is depicted in Figure 6. The intersection is being studied as part of a broader corridor planning effort. Design year traffic volumes are estimated at 25,000 and 20,000 vpd, respectively, for the major and minor roads. The posted speed limits are 45 mph on the major road and 35 mph on the minor road. The intersection serves a moderate number of nonmotorized users, estimated to be 2,400 users per day.
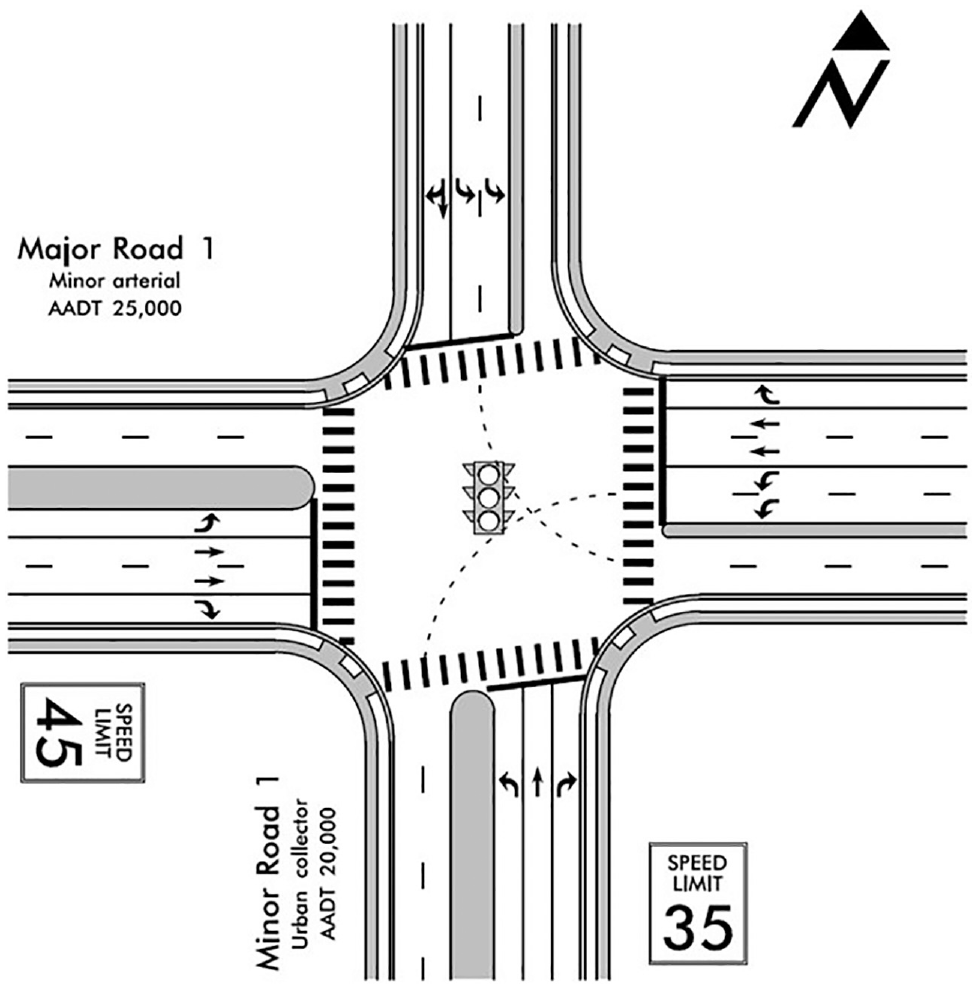
Illustration of scenario intersection conditions.
A Stage I ICE analysis was conducted for this intersection as part of the corridor planning study. This involved a capacity-based operational review and a crash-based safety performance review in addition to the SSI analysis. Based on a volume-to-capacity analysis using the Capacity Analysis for Planning of Junctions (CAP-X) tool, the minor road stop control (MRSC) traditional, all-way stop control (AWSC) traditional, and 1 × 1 roundabout alternatives are dropped from further consideration. The crash-based safety performance review used the Safety Performance for Intersection Control Evaluation (SPICE) tool and determined that all the intersection types for which there are predicted methods available have fewer predicted crashes (both total and fatal/injury) than the existing signalized traditional intersection design. This example will examine the SSI method results for the signalized traditional, signalized RCUT, MUT, 2 × 1 roundabout, and 2 × 2 roundabout intersection designs.
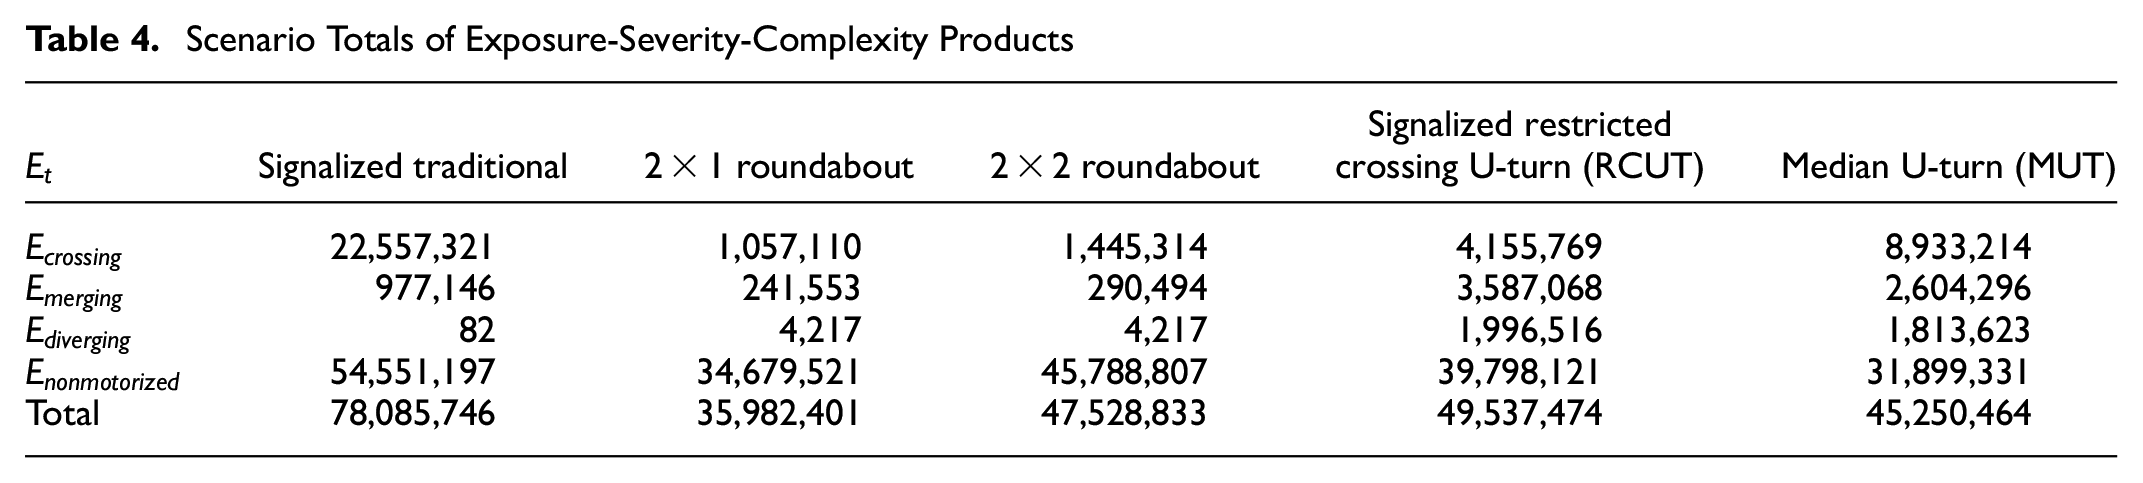
Once the exposure, severity, and complexity calculations have been performed for all the conflict points at each intersection alternative, the SSI scores can be computed according to the approach outlined previously in this paper. In this case, these prior calculations result in sums of the exposure-severity-complexity products as shown in Table 4. The bottom row of the table contains the total of each column.
Scenario Totals of Exposure-Severity-Complexity Products
The overall intersection SSI score,
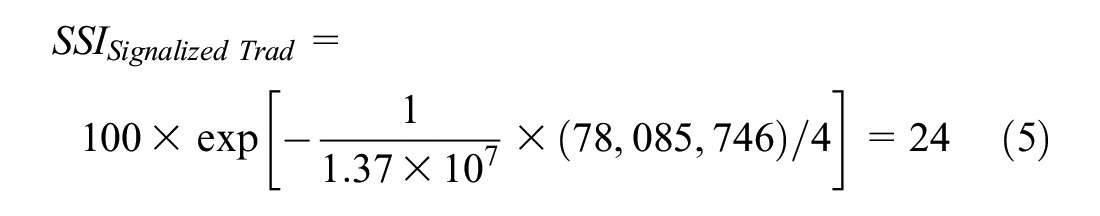
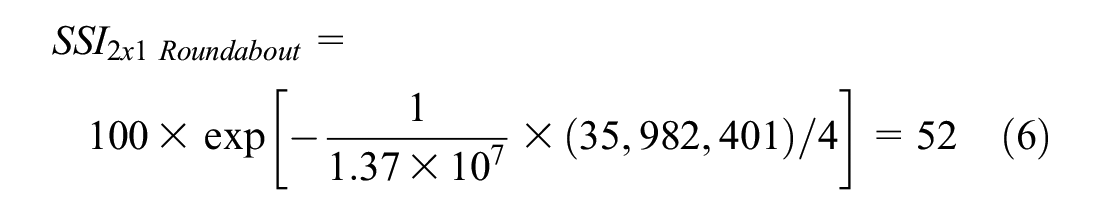
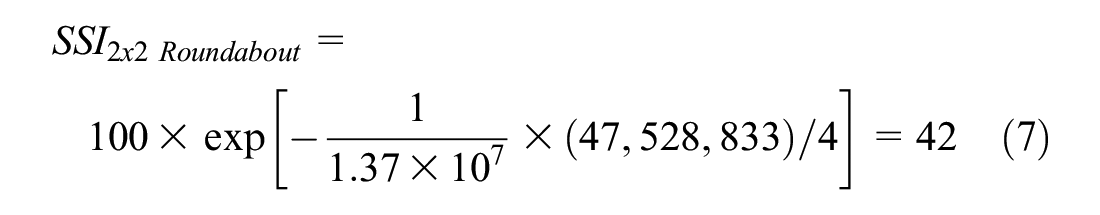
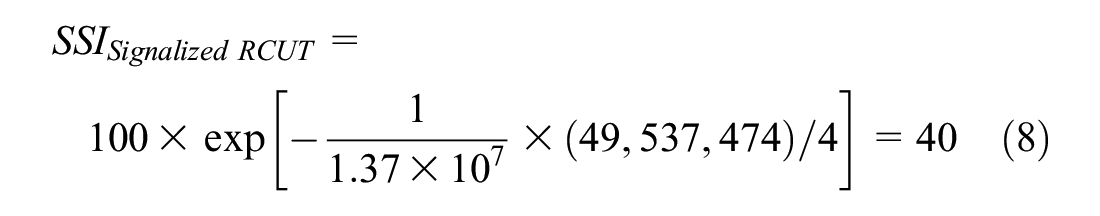
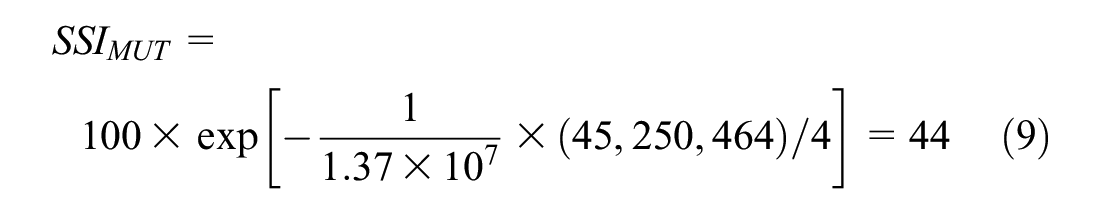
The overall intersection SSI Scores shown in Equations 5 through 9 show that the 2 × 1 roundabout has the highest (i.e., best) SSI score at 52. The four intersection alternatives shown here (2 × 1 roundabout, 2 × 2 roundabout, signalized RCUT, and MUT) indicate an improved SSI score compared with the existing signalized traditional intersection.
These
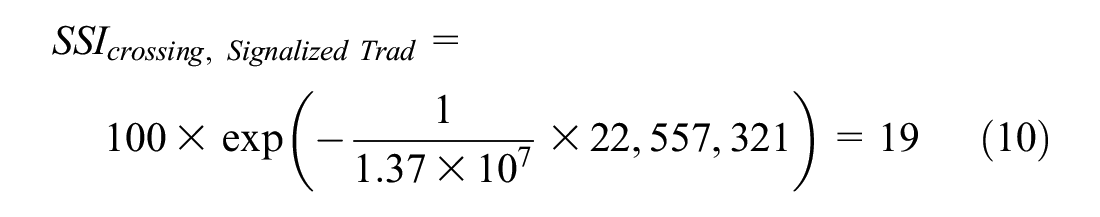
Table 5 summarizes the conflict point type SSI scores for the four intersection alternatives.
Scenario Conflict Point Type Safe System for Intersections (SSI) Scores
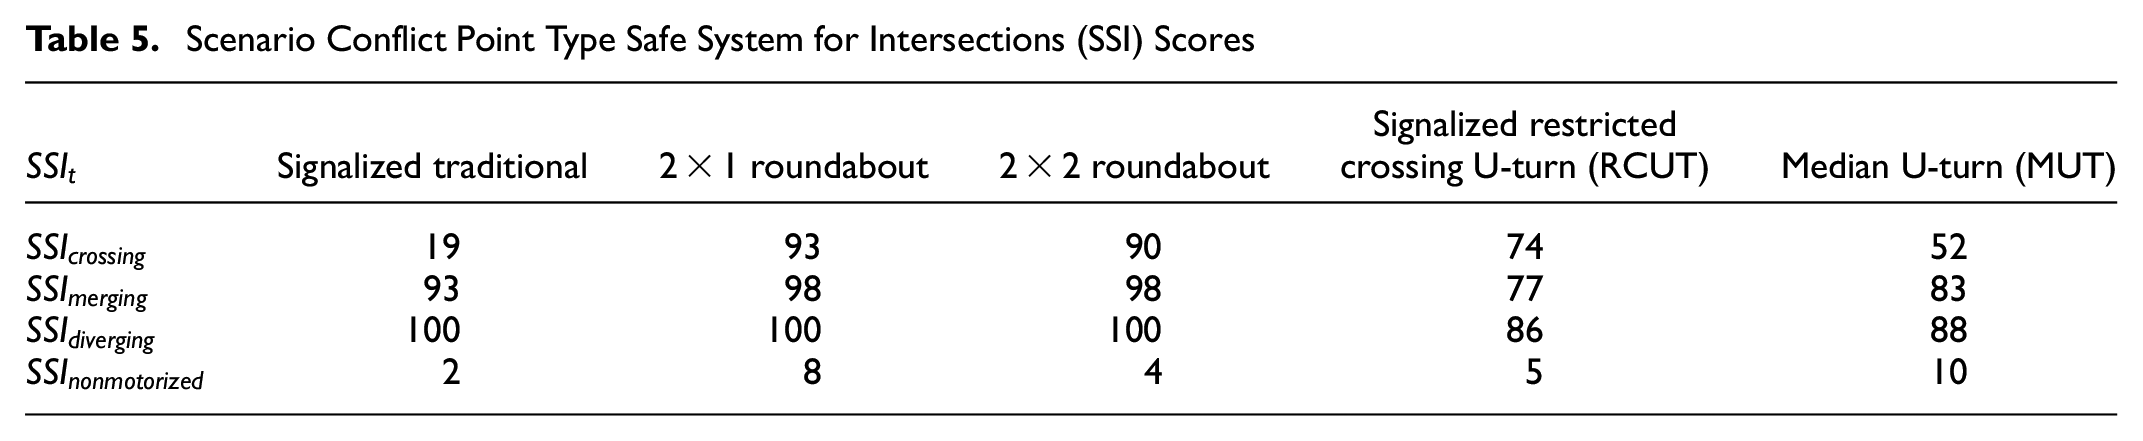
Some additional context explaining these overall intersection SSI scores can be derived by examining Table 5. The four alternatives to the existing condition shown here have improved conflict point type SSI scores for the nonmotorized conflict points and crossing conflict points compared with the existing signalized traditional intersection. These designs reroute one or more movements at the intersection, removing crossing conflict points and reducing vehicle speeds and angles at crossing conflict points, or both. Several of these designs, such as signalized RCUT and MUT, have lower merging and diverging scores than the signalized traditional intersection. This is because the rerouting of movements involved in these designs removes crossing conflict points but introduces additional merging and diverging conflict points. As expected, the range of nonmotorized and crossing conflict point SSI scores is lower than the merging and diverging scores, indicating that nonmotorized and crossing conflicts are more likely to lead to fatalities and serious injuries than merging and diverging conflicts.
Summary and Conclusion
The SSI method provides practitioners with a tool to integrate Safe System principles, such as exposure, kinetic energy management, and movement complexity, into the intersection project development process. Application of the method results in a set of SSI MOEs and SSI scores. The SSI scores are designed to bring together the exposure-severity-complexity factors addressed in the SSI method and package them into a single metric that is easy to understand, compare, and communicate. While the FHWA report associated with this research details the working of the method and its application to intersection projects, this paper provides supplementary background on the reasoning and process behind the development of the SSI scoring system. This additional background and detail on the development of the SSI scores will support future applications of the method and the identification of future research needs and method improvements.
The SSI score uses an exponential function to transform the sum of the exposure-severity-complexity products to a scale ranging from zero to 100, where 100 represents a situation approaching a Safe System. The shape of the exponential function, as influenced by the scaling parameter
Increasing application of the SSI method to real-world intersection projects will continue to reveal the effectiveness of the SSI scores in informing agency decision-making. This may lead to new opportunities for adjusting the SSI scores or calibrating them to local conditions. For example, the SSI method currently applies typical pedestrian paths and assumes that bicyclists follow the same paths as pedestrians (i.e., sidewalks or shared-use paths). Additionally, the SSI method does not currently consider rear-end conflicts that result from speed differentials caused by traffic congestion or traffic control devices. Similarly, it does not consider merging and diverging conflicts caused by lane changing, including weaving movements. Future research efforts should focus on incorporating more refined identification and analysis of pedestrian and bicyclist conflict points as well as rear-end and sideswipe conflicts. These additions may benefit from further refinement of the SSI score computation and calibration.
The exposure-severity-complexity products that lead to the SSI scores contain the same general components as would be expected in an intersection crash predictive method for fatal and serious injury crashes:
• Characterization of exposure
• Movement complexity factors that, in addition to exposure, are expected to be associated with higher or lower crash likelihoods
• The probability (or proportion) of crashes that occur resulting in a fatality or serious injury
Future efforts to validate and calibrate the SSI method using crash data could take multiple approaches:
• One approach could seek to establish statistical associations between the SSI MOEs and SSI scores and the average number of intersection crashes.
• A second approach could try to maximize the statistical associations between the SSI MOEs and SSI scores and the average number of intersection crashes. This could include calibrating some of the parameters that are part of the exposure-severity-complexity product using observed crash data.
Such efforts could further enhance the complementary nature of Safe System metrics and crash-based metrics and support steps toward future versions of resources such as the HSM incorporating the SSI method and other types of Safe System assessments.
Ideally, efforts to validate and calibrate the SSI method with crash data would be based on fatal and serious injury crashes, with serious injuries determined on an abbreviated injury scale (AIS) by trained medical professionals following an assessment of a patient’s injuries at the hospital. Such an approach, however, would require a traffic injury surveillance system in the state where police-reported crashes are linked to hospital records, which is rare. In the absence of such a system, it is possible that validation and calibration could occur using K and A crashes on the KABCO injury classification scale, where K corresponds to “fatal injury,” A to “suspected serious injury,” B to “suspected minor injury,” C to “possible injury,” and O to “no apparent injury.”
Footnotes
Acknowledgements
The research described in this paper was conducted as part of FHWA Office of Safety Task Order DTFH61-16-D-00005, A Safe System Approach to Intersection Planning & Design in the United States. The authors would like to express their gratitude to Mr. Jeffrey Shaw and Mr. Mark Doctor from the FHWA Office of Safety for their guidance.
Author Contributions
The authors confirm contribution to the paper as follows: study conception and design: R.J. Porter, I. Huang, M.R. Dunn; data collection: I. Huang, R.J. Porter, M.R. Dunn; analysis and interpretation of results: I. Huang, R.J. Porter, M.R. Dunn; draft manuscript preparation: M.R. Dunn, I. Huang, R.J. Porter. All authors reviewed the results and approved the final version of the manuscript.
Declaration of Conflicting Interests
The author(s) declared no potential conflicts of interest with respect to the research, authorship, and/or publication of this article.
Funding
The author(s) received no financial support for the research, authorship, and/or publication of this article.
Any opinions, findings, conclusions, or recommendations expressed in this publication are those of the author(s) and do not necessarily reflect the view of the Federal Highway Administration