
Abstract
Promoting battery electric buses (BEBs) can reduce fuel consumption and air pollution from the transit system. A complete transition from the current diesel fleet to BEBs is costly and time-consuming. Thus, the intermediate solution is a combination of diesel, hybrid, and BEBs. Therefore, a planning framework is required that simultaneously tackles three contiguous aspects of transit electrification and their interconnections, namely charging infrastructure, fleet configuration, and scheduling. Accordingly, this study considers a mixed fleet of diesel and BEBs. It aims to concurrently find (i) the optimal location and capacity of charging infrastructure, considering micro-grid specifications, the impact of distributed energy resources, and time-of-use electricity rates and (ii) optimum operation and refueling strategies. Another objective of this study is to capture the impacts of adverse weather conditions on transit electrification. A mixed-integer problem is proposed and solved using a metaheuristic algorithm based on simulated annealing to minimize system costs, including infrastructure, fleet, and operation costs. A subnetwork of transit in Worcester, Massachusetts, is selected as a case study, including three routes, five candidate charging locations, and three bus types. Findings suggest that BEBs can operate and serve the passenger demand with sufficient charging infrastructure. Sensitivity analyses show that even though high-power chargers are more expensive per piece, they reduce the overall cost as fewer chargers are required. The cost rises for chargers with power of 350 kW or more. It is worth noting that the benefits of BEBs are more significant in smaller buses and are heavily affected by adverse weather conditions.
Keywords
During the last decade in the USA, transportation has been the sector with the highest energy consumption share. In 2020, the transportation sector was responsible for 35% of the USA’s total energy consumption ( 1 ). On the other hand, 28% of the greenhouse gas (GHG) emissions in the US were caused by the transportation sector in 2018 ( 2 ). Therefore, alternative fuel vehicles (AFVs) have been introduced as an option with lower GHG emissions to reduce the dependence of vehicles on fossil fuels. In the USA, transit buses annually consume an average of 13,329 gal of fuel for 43,647 vehicle miles traveled (VMT) per vehicle ( 3 ), and they contribute up to 34% of emissions generated by vehicles ( 4 ). Therefore, deploying fleets of buses running with an alternative fuel can help to reduce these emissions and increase fuel efficiency. Among different AFVs, battery electric vehicles (BEVs) are preferable as they entirely run on electricity with zero tailpipe emissions. Electricity is known as a low- to zero-emission fuel. In fact, BEVs can further reduce the environmental drawbacks caused by fossil fuel vehicles if their electricity is supplied by a renewable source such as solar, wind, or water energy. However, there are still some issues with BEVs. The relatively limited range, high purchase price, limited infrastructure, and long charging time have delayed the growth of BEVs’ share in the market generally ( 5 ) and the percentage of battery electric buses (BEBs) in the transit sector, specifically. Thus, it is essential to provide supporting charging infrastructure to ensure that BEBs are able to comply with current or planned schedules. The compliance with schedule and trip feasibility improves the market acceptance of BEBs among transit operators. There are at least 24 BEB manufacturers worldwide, six of which have products ready for sale in the USA ( 6 ). Based on 2020 statistics, there are approximately 650 BEBs (out of total 2,255 zero-emission buses) running in the USA ( 7 ).
Charging infrastructures are generally classified into three types: (i) battery swapping stations, (ii) static charging stations (plug-in and overhead), and (iii) dynamic wireless charging ( 8 – 11 ). Previous studies indicate static fast charging as the most suitable option for public transit electrification (4, 12–14), considering the significant investment and battery standardization requirements for swapping stations and wireless charging ( 15 , 16 ). The characteristic distinguishing the operation of BEBs from private BEVs is that BEBs are required to maintain scheduled tasks to transport passengers, so they cannot be charged in the middle of their trips while passengers are on board. These characteristics require them to have designated exclusive charging stations. Thus, it is crucial to select an appropriate location for BEB charging stations. Since fast-charging stations generate additional load to the existing power grid, the location of charging stations is also restricted by power grid capacity and its distribution network ( 17 – 19 ).
The main factors to be considered for the operation of transit buses are bus type, bus size, fuel type, refueling schedule, and refueling stations’ locations and their impact on refueling time and detour. Most of these factors are interrelated, as shown in Figure 1. It is crucial to capture these interconnections toward an optimal planning framework for transit operations.
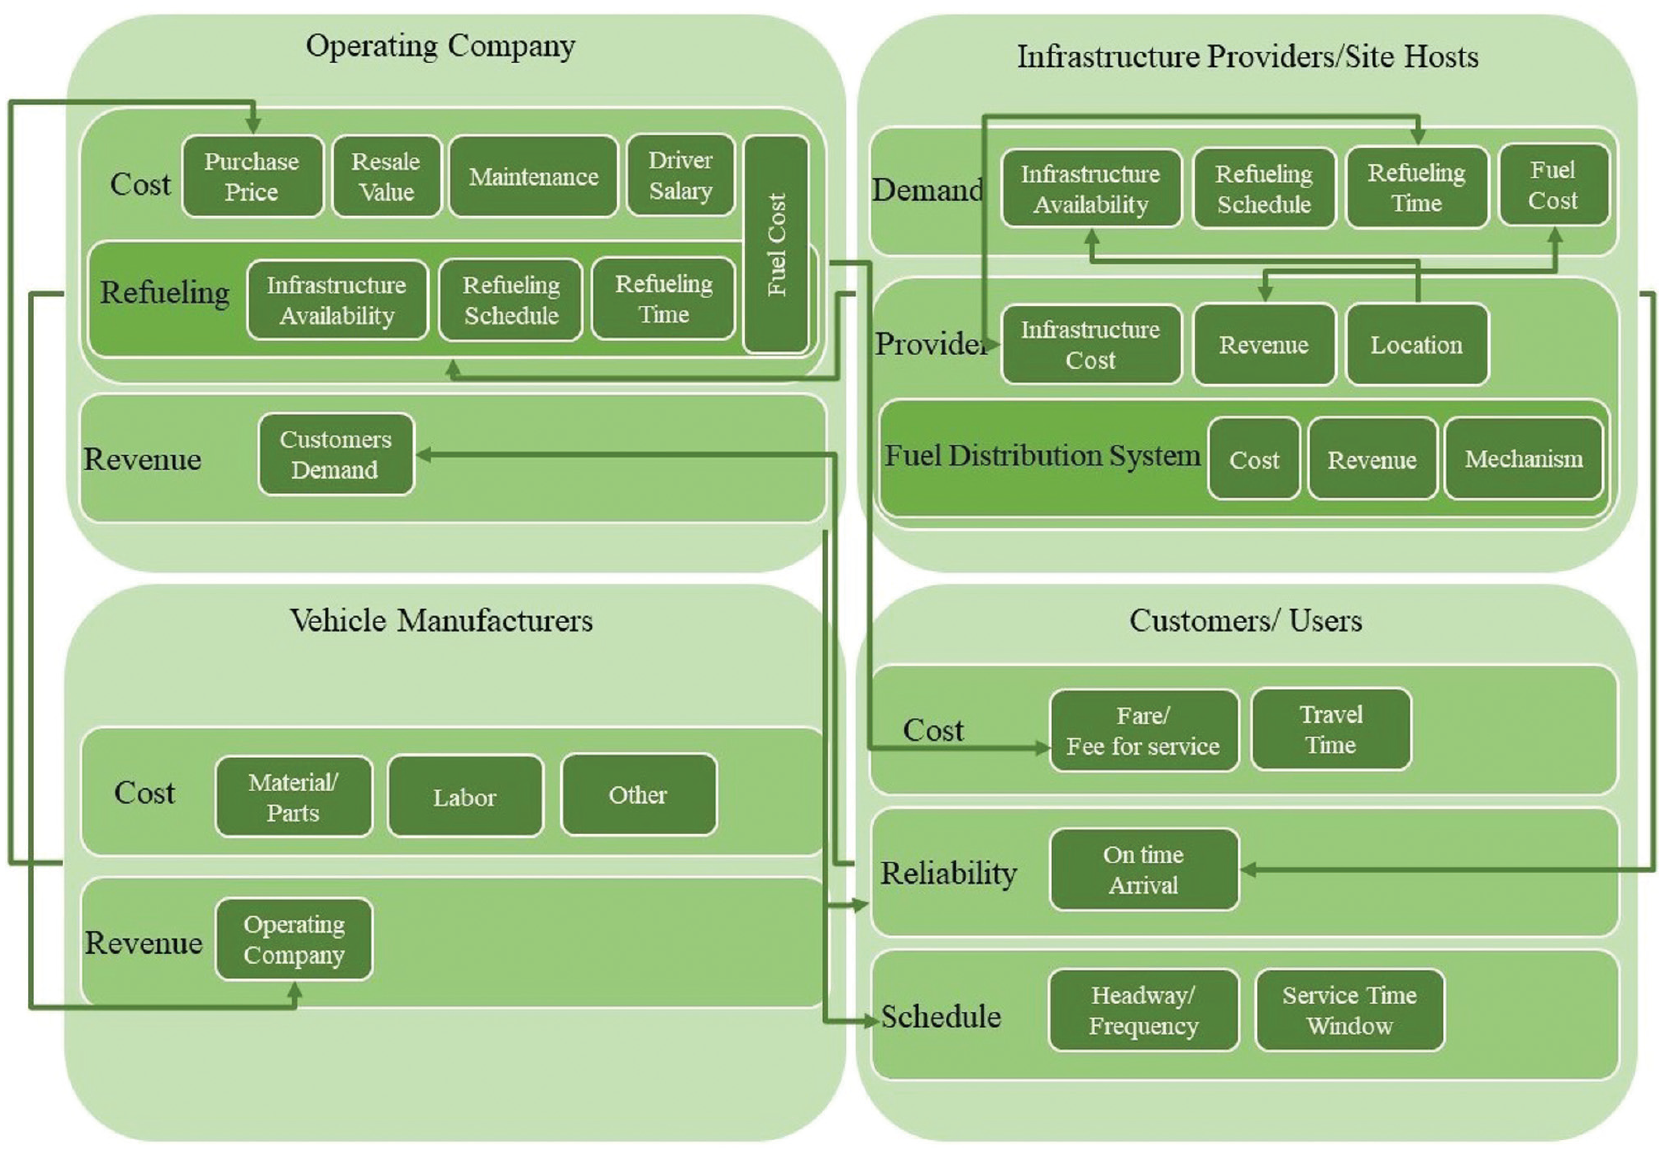
The interconnections among different stakeholders of a transit systems.
This study aims to propose a modeling framework for capturing the interconnections between stakeholders of a transit system to find the optimum fleet configuration (i.e., diesel buses and BEBs), charging schedule, and charging infrastructure placement simultaneously while maintaining a certain level of service. It also considers distributed energy resources (DER) to support the grid. As the market share of EVs grows over time, there will be an excess load on the electricity grid. The additional load can vary daily and seasonally. DERs can help to distribute this load more evenly over time to avoid demand charges. The solar panels and battery storage reduce the cost of electricity and thus the refueling cost for the BEBs. A subnetwork of transit buses in the city of Worcester, Massachusetts, operated by Worcester Regional Transit Authority (WRTA) is selected as a case study. Based on a community micro-grid feasibility study, three bus routes are selected on which BEBs are currently being used ( 20 ). These routes are selected based on the topography and route characteristics. This study considers three bus types: one type of diesel buses and two different types of BEB. The first type of BEB is a limited edition of Proterra buses called “Beta” buses which have a limited driving range of 38 mi, and the second type is the current extended driving range Proterra bus with a driving range of 195 mi. WRTA currently owns the limited-range BEBs from bus manufacturer Proterra. Thus, new BEBs with an extended driving range are also being considered by the same manufacturer to maintain consistency. WRTA has two facilities where its BEBs can be charged. However, the electricity demand of these chargers can be re-localized to other locations collocated with the BEB fleet stations leading to a peak demand reduction. WRTA is considering its current facilities and three schools, equipped with solar panels and battery storage, as candidate points for charging stations combined with a micro-grid study. The solar panels and battery storage reduce the cost of electricity, and thus, the refueling cost for the BEBs. The DERs also reduce the load on the grid, especially during peak hours. WRTA is not considering wireless chargers at this point because of the cost and implementation complications. The primary outputs include location and number of chargers, schedule of charging events, and the optimum number and type of buses for each route considering its operational characteristics. This study maintains the level of service and guarantees compliance with the current or planned schedule by considering backup buses operating in lieu of BEBs if they are out for charging during the service hours. The proposed framework minimizes the total system cost, which includes (i) costs of constructing charging infrastructure such as land acquisition costs and cost of chargers per installation, (ii) costs of purchasing new buses, and (iii) operational costs such as fuel and maintenance, including the refueling detours. To this end, the problem is formulated as a mixed-integer mathematical model with linear constraints.
The remainder of this paper is structured as follows. First, a literature review on transit operations, charging infrastructure planning, and transit electrification is provided, followed by the problem statement. The modeling framework and solution approaches are presented. Then, the results and the analysis are demonstrated, and finally, the conclusion, key findings, and recommendations for future research.
Literature Review
BEVs are receiving increasing attention within the transportation sector. Electrification is introduced to solve issues including but not limited to fossil fuel dependence, fuel price fluctuations, and GHG emissions from gasoline and diesel vehicles ( 21 – 25 ). However, the relatively high retail price, limited range, insufficient charging infrastructure, and long charging time of BEVs are the significant barriers against the further promotion of these vehicles (21–23, 26). The charging infrastructure planning and deployment process for BEVs has been a “chicken-and-egg” dilemma since drivers will not switch to BEVs unless sufficient charging infrastructure is available. On the other hand, energy suppliers will not invest heavily in charging infrastructure until there is an improved market acceptance with enough BEVs on the road ( 17 , 27 , 28 ). Governments and policymakers play a vital role in addressing such dilemmas and providing the means for BEVs to seize more widespread adoption. Public transit systems are run or subsidized by local or federal governments in many regions. They also have specific characteristics (e.g., fixed routes, scheduled operation time) ( 29 , 30 ). Thus, market uncertainty and planning stochasticity in transit planning is less significant than for the private vehicle market. Transit buses are mostly still powered by diesel engines while traveling more than 10 h for hundreds of miles on a daily average ( 31 ). Also, among public transit systems, transit buses are known to produce considerable amounts of pollutants ( 4 ). Thus, transit operations are considered a reliable urban mobility component in electrification ( 29 ).
Over the past decade, several studies have addressed BEV operation and management problems, such as planning and deploying charging infrastructures. Most studies addressing the charging infrastructure problem focus on private BEVs (5, 21, 22, 32–40). These studies have two main approaches; either the locations of charging demand are considered to be concentrated at some fixed points in the network ( 41 ) or they are modeled as traveling flows throughout the network ( 42 , 43 ). The flow-based models consider the demand as origin–destination flows and are more appropriate for long-distance trips.
However, fewer studies focus on charging infrastructure for BEBs (4, 8, 10, 13, 29, 44, 45). Mixed-integer optimization programming is the common approach in the latest studies ( 13 , 29 , 44 , 45 ). Kunith et al. ( 13 ) develop a mixed-integer linear optimization model to determine the optimum battery capacity for each bus route and the minimum required number of charging stations and their respective location. Wang et al. ( 44 ) propose a mixed-integer linear optimization model in which simultaneous planning decisions determine the charging station locations, number of chargers, and recharging schedule. There is only one type of bus and one type of location considered as the candidates in this study: BEBs and transit hub terminals, respectively. Xylia et al. ( 45 ) develop a model to optimize the distribution of charging stations for a transit system partially operated with BEBs and test their model with the real-world data from the bus network of Stockholm, Sweden, with 526 bus routes and 11,436 bus stops. One of the latest studies in this area proposes installing energy storage systems within the charging infrastructures, capturing the effects of the demand charge. The study formulates a mixed-integer linear model to minimize the total system cost, including battery, fast-charging station, energy storage system, and electricity demand charges ( 29 ). Another study develops a stochastic integer program to concurrently optimize charging station locations and bus fleet size under random charging demand; however the optimization of operational aspects, such as charging schedule, is not the focus of the study ( 46 ).
Studies also focus on solutions other than static charging stations, such as battery swapping stations or dynamic charging facilities. Chen et al. investigate the cost competitiveness of different charging infrastructures and propose separate optimization models for each infrastructure type minimizing battery size and construction cost. The study determines the most cost-effective type of infrastructure based on the operational characteristics of the network, such as length of route, service frequency, and operating speed, for one nominated bus rapid transit (BRT) route in 38 different cities around the world ( 8 ). An et al. investigate the application of battery swapping stations as a promising solution to recharge BEBs with minimum delays. Swapping stations require heavy capital investment on swapping robots, land acquisition to store reserved batteries, and so forth, while technology advancements are assisting with fast-charging time getting closer to battery swapping time ( 10 ).
As discussed, public transit buses operation logistics are different from those of private vehicles. Traditionally, much research was conducted on bus scheduling to optimize the number of vehicles, time-schedule, and total cost for networks of conventional diesel buses ( 47 , 48 ). Since a decade ago, scholars have been starting to study bus scheduling to investigate the potential implementation of a network of BEBs. In the earlier studies, the chargers are located at the bus terminal. Therefore, the charger’s placement issue is not addressed ( 49 , 50 ). In a later study, a framework is developed that can be applied to evaluate different battery capacities and charging strategies over a single bus route ( 31 ). Mahmoud et al.provide a comprehensive review of different electric buses and their advantages and disadvantages for replacing a diesel fleet. The study concludes that BEBs with overnight charging are the best option; however, it notes that the results are sensitive to the context ( 51 ). Some studies focus on developing models to predict BEBs’ energy consumption rates using a combination of machine learning and statistical techniques ( 52 , 53 ). Another study applies GIS-based analysis to select from a set of current diesel-powered bus routes the most suitable ones to convert into BEB routes. The proposed framework considers the characteristics of bus routes and the possibility of deploying charging infrastructures in bus terminals ( 54 ).
Wireless charger deployment for BEB networks is another topic being investigated during the past few years. Wireless charging can be provided either as a static facility (e.g., at a bus stop) or a dynamic facility (e.g., along a segment of a road). However, considering that they are still in their infancy stage and require significant capital investment, there are few real-world practices available (11, 55–57). As highlighted in the literature, wireless chargers are more cost-efficient when used on a segment of the road on which many bus routes travel or within a bus stop that is shared among multiple bus routes ( 57 ).
The detailed review of the literature revealed that current studies consider a portion of the current struggles and challenges at transit agencies. In addition to considering a mixed fleet of diesel buses and BEBs, as an intermediate solution resulting in lower infrastructure investment compared with the electrification of an entire fleet, this study improves the current literature by integrating novelties of previous studies and covering the current gaps. The improvements can be listed under three contiguous aspects, including charging infrastructure, fleet configuration, and scheduling (operation). Infrastructure-related gaps are investigated by considering various candidate locations for charging stations, considering DER and the micro-grid impact while minimizing detour trips. This alleviates the increased load on the grid with transit electrification. The proposed framework has the ability to concurrently consider all the three aspects and the interconnections between them. Electrifying a bus transit system requires a considerable investment. Thus, a combination of different bus types with varying levels of electrification (e.g., diesel, hybrid, electric) should be considered as an intermediate solution, which has not gained enough attention thus far. This study investigates operation-related gaps by considering scheduling requirements, different charging strategies (e.g., charging during service hours versus charging overnight), and introducing backup buses that replace BEBs when they are out for charging. Figure 2 shows the available literature as mentioned above and the gaps. The purple area in Figure 2 represents the gaps this study will cover, and the purple patterned regions are covered by variations of the proposed framework in this study.
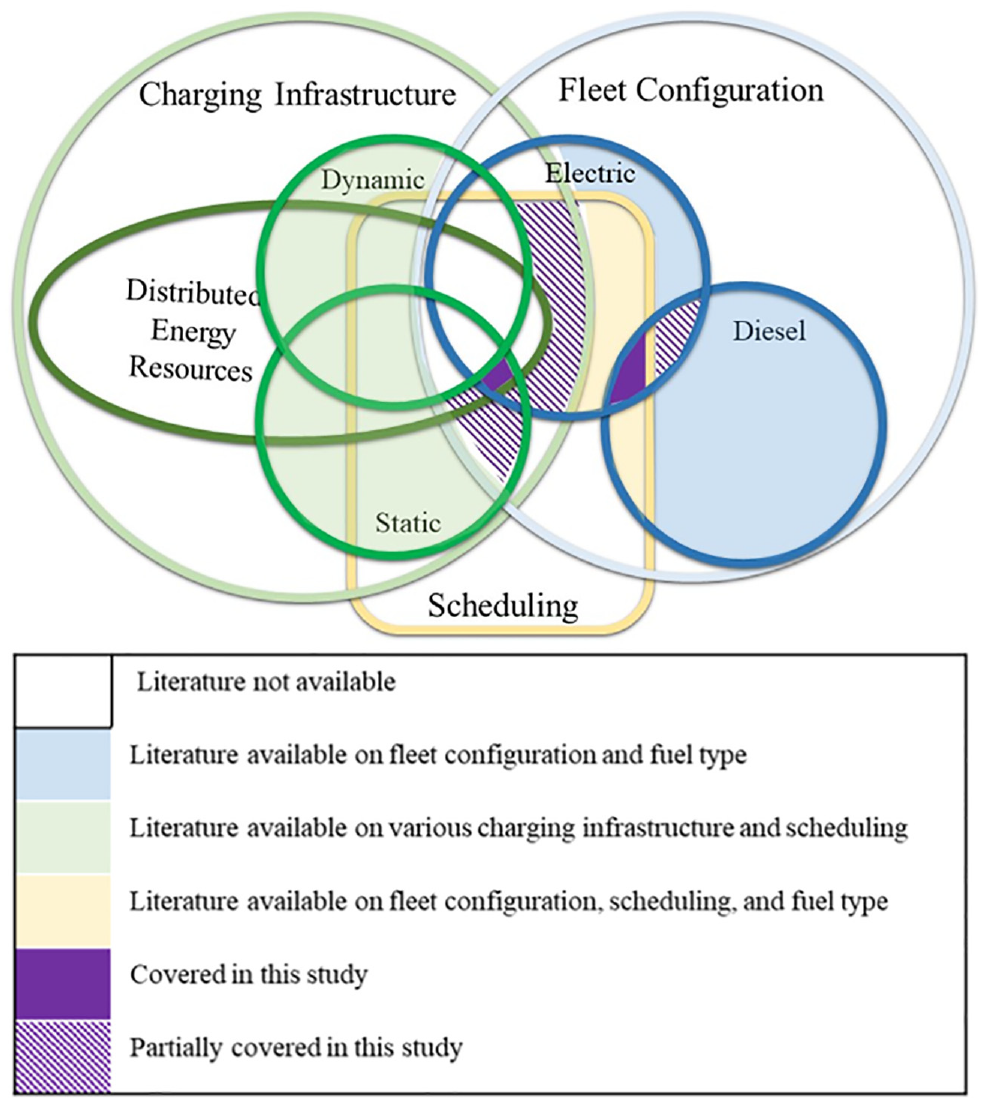
Current literature coverage of transit electrification and this study’s contribution. (This study considers scheduling, various fuel types, and static charging infrastructure in combination with distributed energy resources.)
Problem Statement
Transit agencies mainly operate in high-density urban areas to improve mobility. The goal of this study is to propose a sustainable solution for transit operations. In this study, the problem of interest is to (i) locate charging infrastructures within a transit network, considering the availability of DER (i.e., battery, solar), (ii) find the optimal number of chargers at each charging station, (iii) find the optimal combination of different bus types on each bus route, (iv) find the optimal number of backup buses required to keep compliance with the schedule, (v) find the optimum temporal charging strategy, and (vi) specify and organize the fleet’s renovation plan. In this problem, the objective is to minimize the total system cost, including charging stations investment cost, cost of purchasing new buses, and operation cost (e.g., fuel). Maintaining the current or planned operational schedule for each bus route is one of the main constraints of the problem. The main tasks of this study are:
Analyzing the fleet and infrastructure requirements as codependent variables while managing the operational requirements;
Evaluating the impacts of DER on infrastructure location and fleet acquisition plans;
Investigating the trade-offs between infrastructure, fleet acquisition, and operation investments toward a sustainable transit operation;
Capturing the impacts of adverse weather conditions on transit operations and BEBs’ requirements.
The modeling framework is introduced in the following section.
Modeling Framework
This section defines all sets, parameters, and variables used in the modeling process. Then, the optimization model is presented as a mixed-integer problem with linear constraints, followed by a brief explanation about each constraint.
In this problem, there is a set of candidate points for building charging stations (
Model Notations
Notations used in this paper for different sets, parameters, variables are available in Table 1.
Model Notations
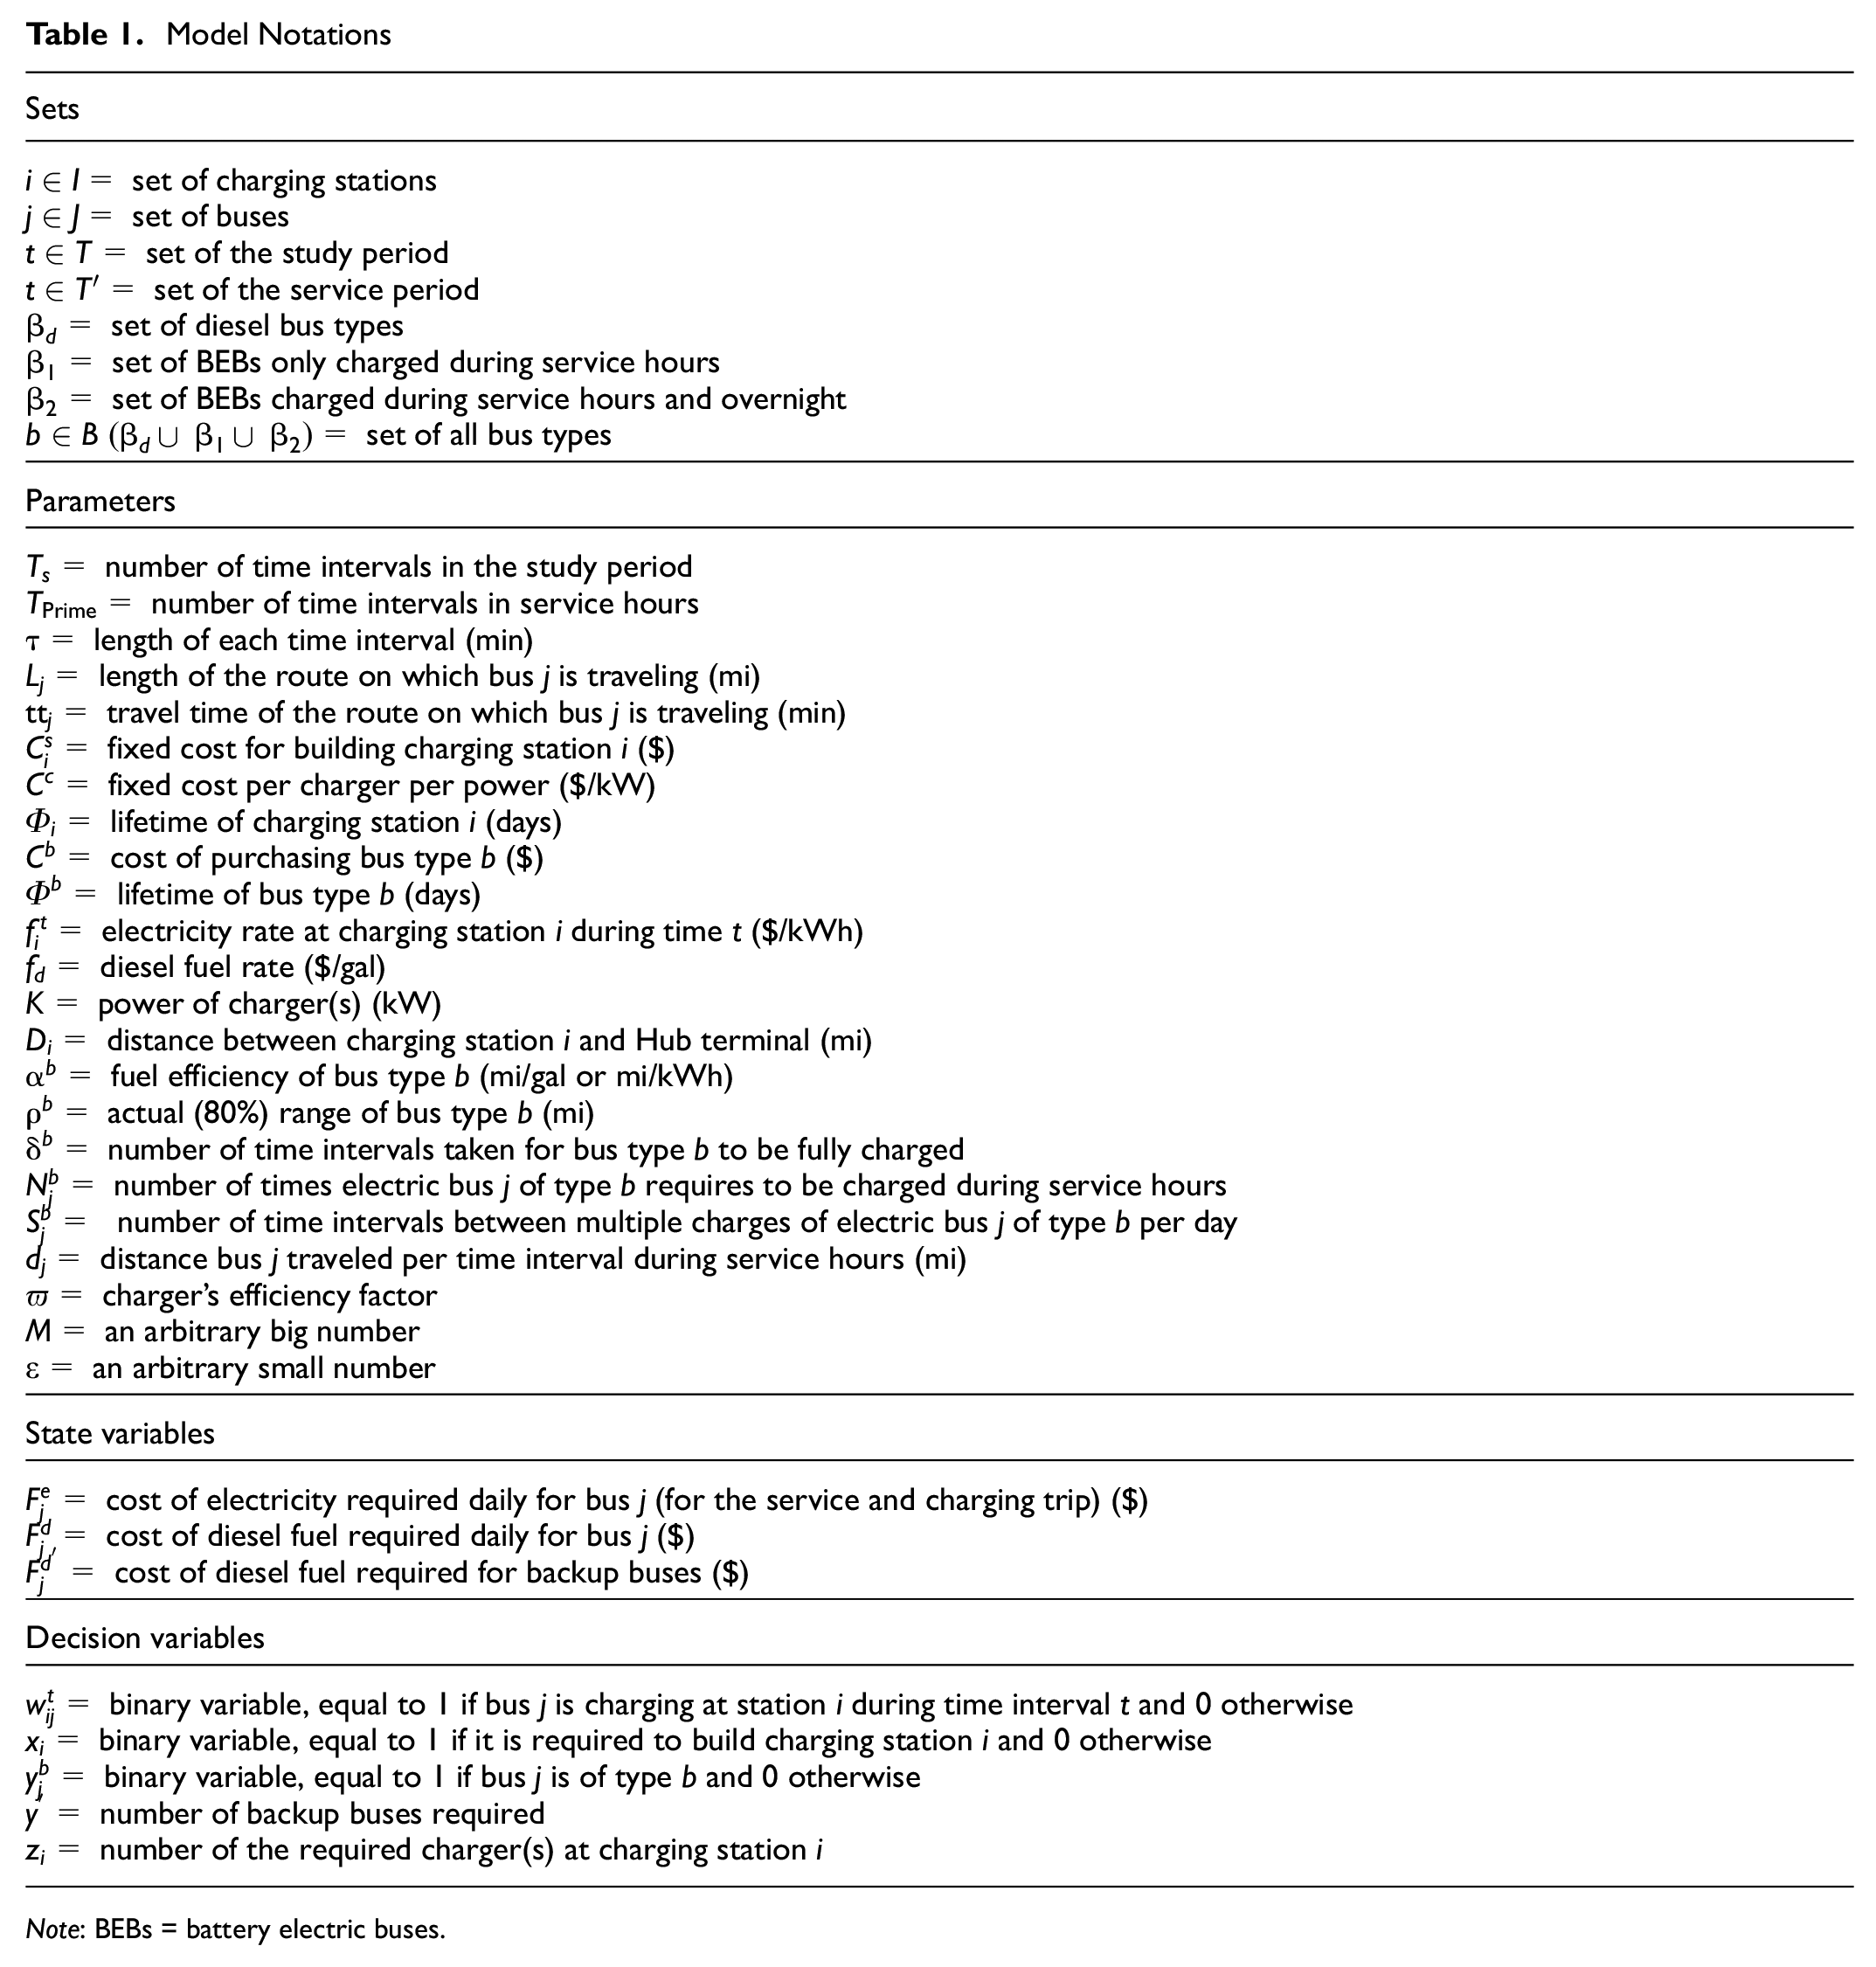
Note: BEBs = battery electric buses.
The main assumptions of this study are as follows:
Each bus finishes a round trip before returning to a charging station (no mid-route charging). Mid-route charging can be added to the modeling framework when transit agencies aim to consider cost-efficient wireless charging infrastructure.
During each charging event, BEBs will be fully charged to minimize the frequency of BEBs’ refueling.
If a BEB is charging during service hours, a backup diesel bus will serve the passenger trips.
The fuel consumption of buses is a function of traveled distance.
The number of time intervals for each BEB to fully charge is

The number of times each BEB requires to be charged during service hours is defined in Equations 2 and 3. Equation 3 represents bus types that will have their last round of charging overnight after the service hours.


Then, the number of time intervals between charging events for BEBs (i.e., time intervals that BEB can operate on route before charging) is as follows:

Also, the distance each bus travels per time interval during its service hours is defined as

Optimization Model
The proposed optimization model is formulated as follows. The objective function minimizes the cost of building charging stations, fleet acquisition cost, and the operation cost of a transit system. Transit fleets have been running on diesel for a long time; therefore, the refueling infrastructure has been available almost everywhere to support their operation. However, BEBs are relatively new in the transit industry and require charging infrastructure to be constructed to support their operation. So, it is expected that BEBs require higher infrastructure cost than do diesel buses. On the other hand, average electricity cost is much cheaper than average diesel cost in the USA ( 6 ). Therefore, the fuel/energy cost of BEBs is expected to be lower than that of diesel buses. Fleet acquisition costs of BEBs are higher, but this cost is reducing over time, through economy of scale. Thus, it is expected that the gap in the fleet acquisition cost of BEBs and diesel buses will be closed in the near future, and the main trade-off in the objective function to select between BEB and diesel is marked by comparing infrastructure and operation costs.

subject to:


The objective function, Equation (6), consists of three main terms. The first term represents infrastructure cost, including the fixed cost of building each charging station and a variable cost per charger. Charging station cost,
Constraint (7) states that there are enough backup buses to operate in lieu of BEBs when they need charging during the service hours (
Solution Approach
The problem is formulated as a mixed-integer linear model. The model is solved using CPLEX with AMPL for small case studies. However, as the size of the problem grows, the current commercial solvers are unable to solve the problem. This requires a metaheuristic algorithm to find an acceptable solution in a reasonable time. In this study, simulated annealing (SA) is proposed to solve this problem, as it is proven effective for similar problems ( 5 , 37 , 58 ). The metaheuristic is benchmarked against a commercial solver for small case studies, and the convergence pattern is tested for larger case studies to ensure accuracy. The SA algorithm starts with a current feasible solution and then moves to a neighbor feasible solution. Then the current and the neighbor solutions are compared, and based on the difference, the current solution is replaced with the neighbor solution with a probability. SA schemes allow larger objective function values to replace the current solution using the probability. This aims to assist in avoiding getting trapped in local optima. However, the probability reduces during consecutive iterations. Figure 3 shows the flowchart representing the SA-based algorithm proposed to solve the optimization model finding the optimal fleet configuration, location of charging stations, and charging schedule for transit operations. The strategies used to create the neighbor solution are also described in Figure 3.
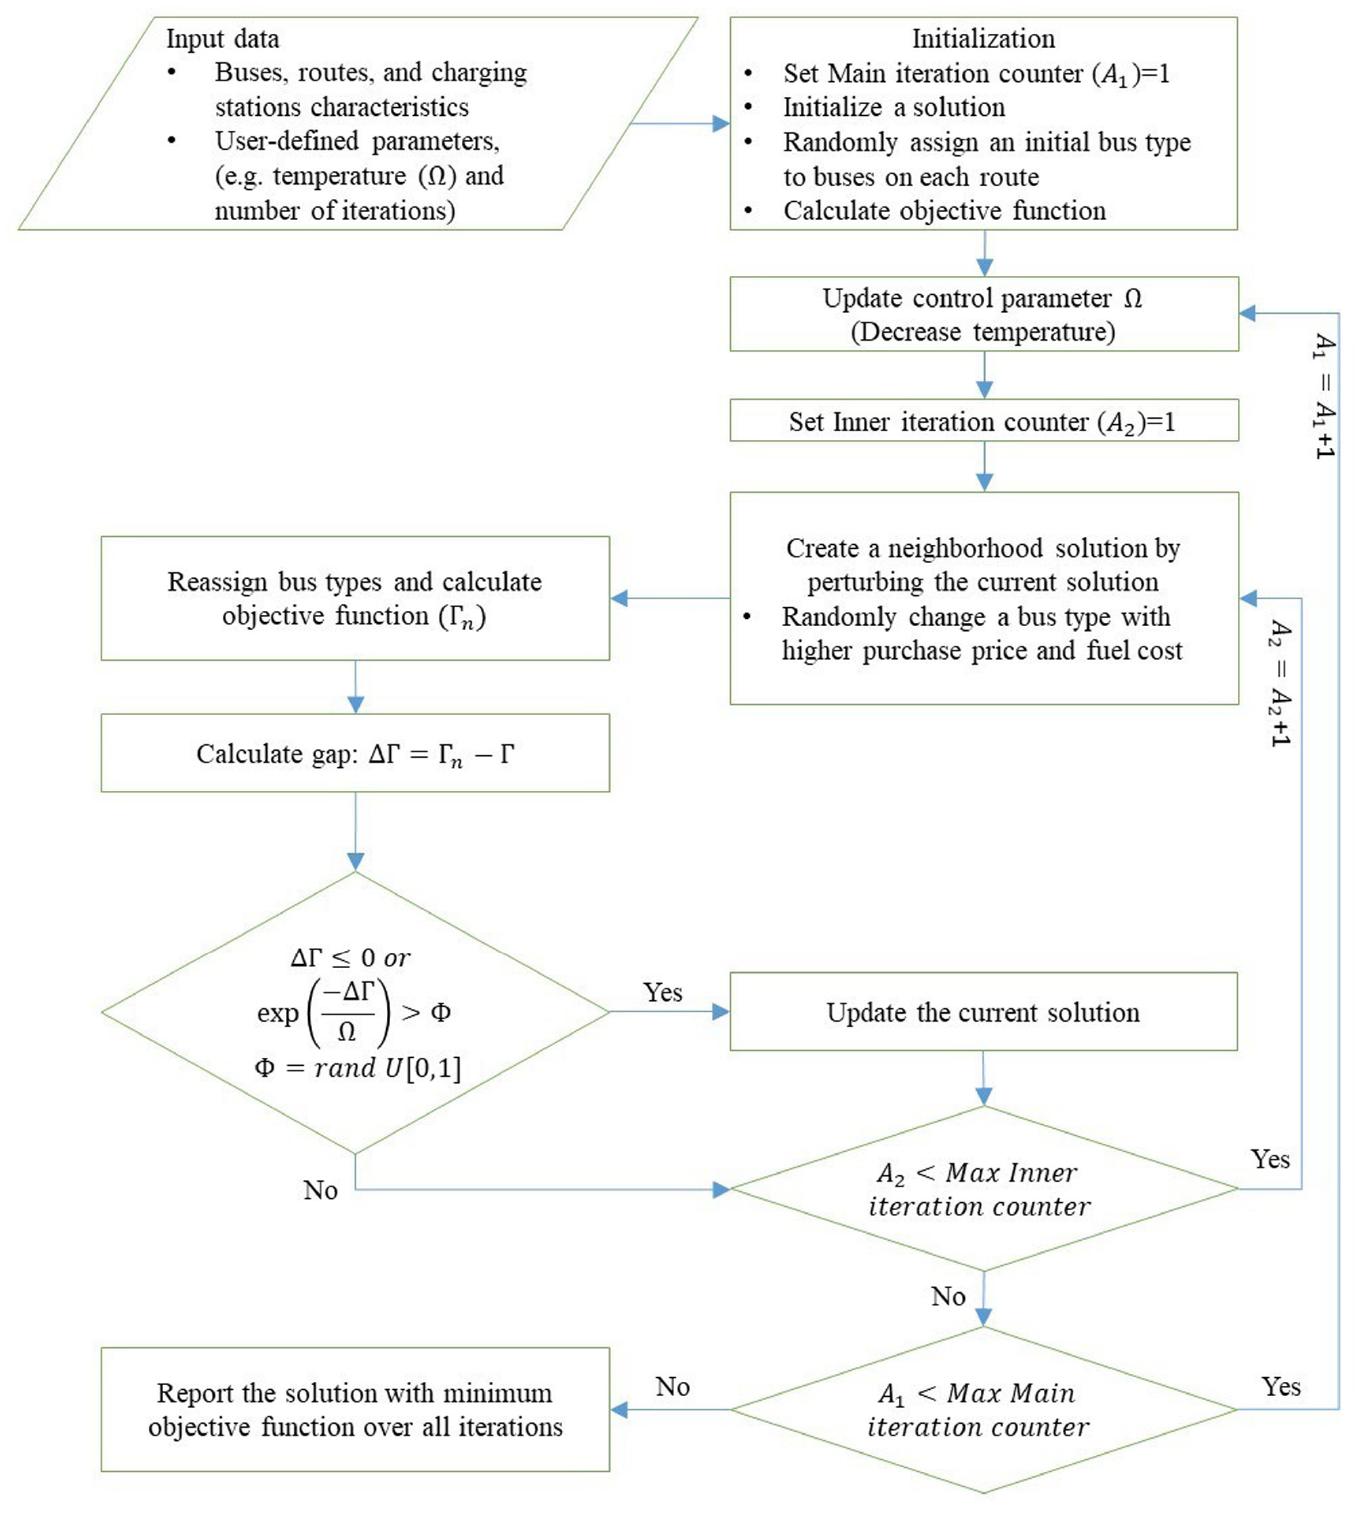
The SA-based solution algorithm to find the optimal fleet configuration, location of charging stations, and charging schedule for transit operations.
Case Study
This study focuses on finding optimum bus types, charging schedule, and location of charging infrastructure for a network of three bus routes for the city of Worcester in Massachusetts. WRTA operates the bus routes in the city of Worcester. WRTA has two facilities located in Worcester: the WRTA’s HUB, which is the central bus depot, and WRTA’s maintenance and operation facility (MOF), which services vehicles. There are three BEB chargers installed and currently operating, two level-2 chargers (up to 60 kW) at MOF, and one direct current fast charger (DCFC) at the HUB. The electricity demand of these chargers can be re-localized to other locations collocated with the BEB fleet stations leading to reduction of the WRTA peak demand. WRTA is considering these two facilities and some of the local schools, such as Worcester Technical High School (WTHS), the Belmont Community School (BCS), and the Roosevelt Elementary School (RES), as the potential locations for building charging stations.
These locations currently have solar panels with a plan to expand and also add energy storage to support the solar panels. Table 2 shows the current and proposed DER at each of these candidate locations. Since the energy currently provided through the solar panels is not exploited to the full capacity, adding the chargers will use the solar energy produced to a greater extent and thus increase the economics of the current solar panels installed at the schools collocated with the BEB charging stations. Stationary battery storage would add additional benefits, including energy security. The electricity price varies at different candidate locations, considering the availability of solar panels, grid configuration, and storage options. Different electricity rates and DER options are available in Table 2.
WRTA Candidate Charging Station Location Characteristics
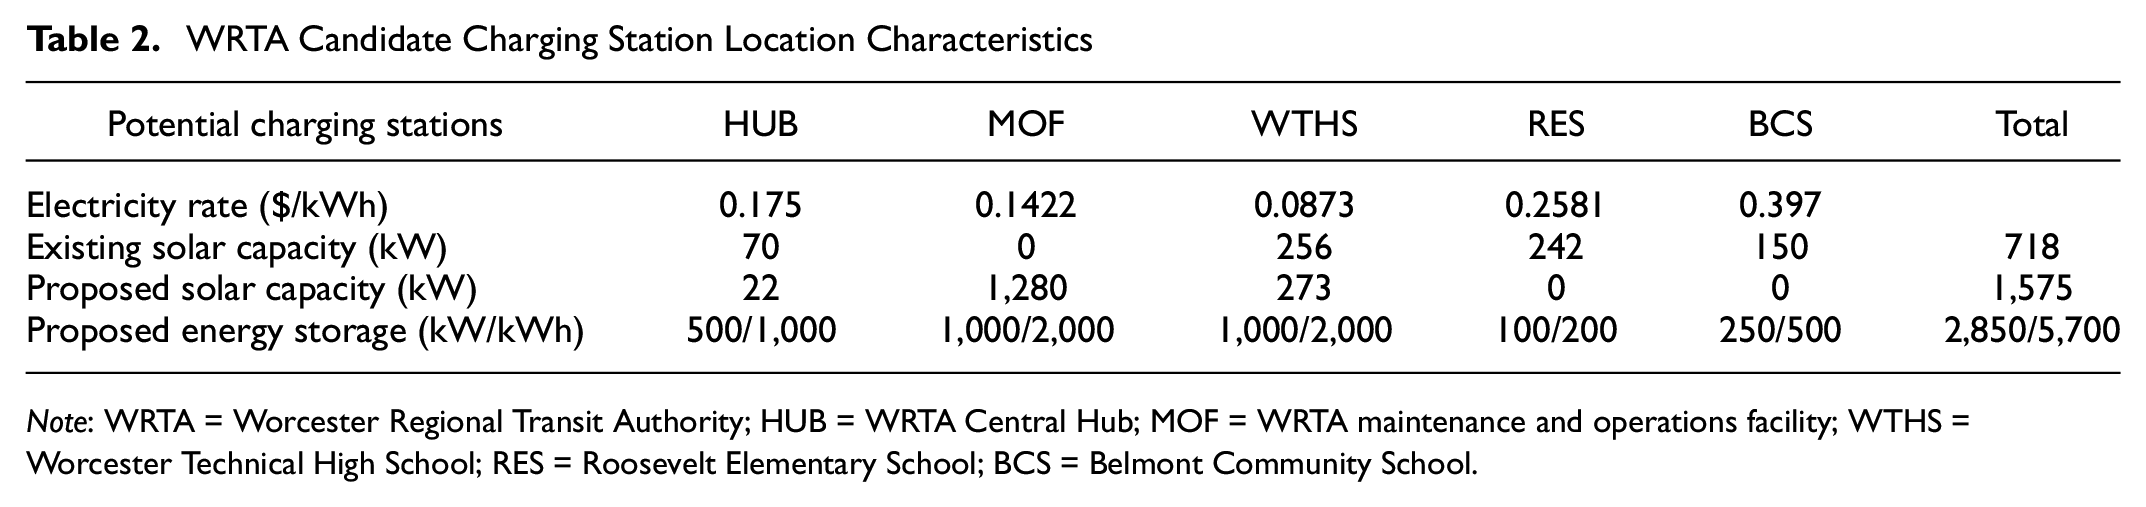
Note: WRTA = Worcester Regional Transit Authority; HUB = WRTA Central Hub; MOF = WRTA maintenance and operations facility; WTHS = Worcester Technical High School; RES = Roosevelt Elementary School; BCS = Belmont Community School.
The numbers from WRTA reports suggest the characteristics for each route, as listed in Table 3. WRTA is currently operating fully electric buses with a limited driving range, known as Proterra beta buses, which, for the remainder of this study, are called beta BEBs. For consistency purposes, the new BEBs are also considered from the same bus manufacturer. The new BEBs are the extended range BEBs currently manufactured by Proterra. The bus characteristics are listed in Table 4.
WRTA Candidate Routes’ Characteristics
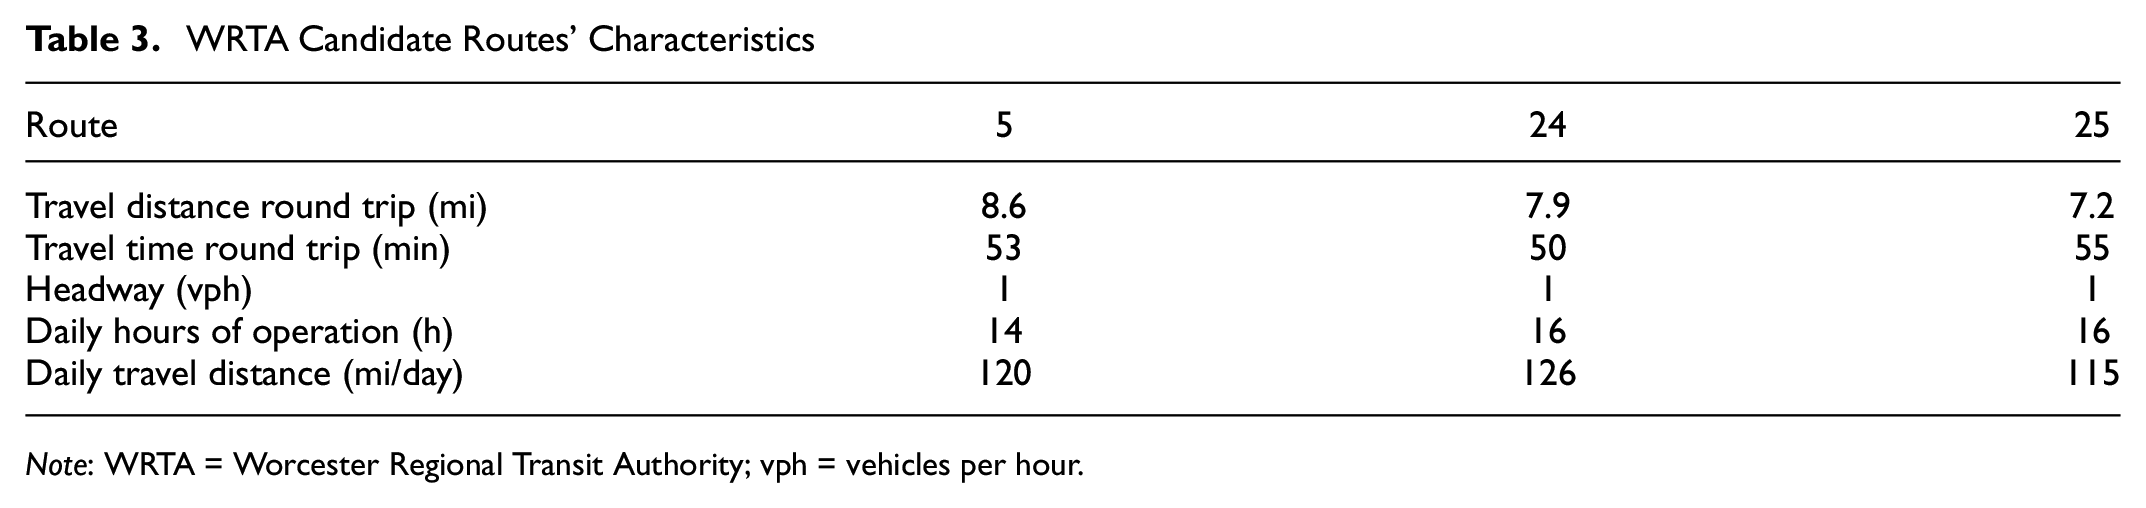
Note: WRTA = Worcester Regional Transit Authority; vph = vehicles per hour.
WRTA Candidate Bus Types’ Characteristics
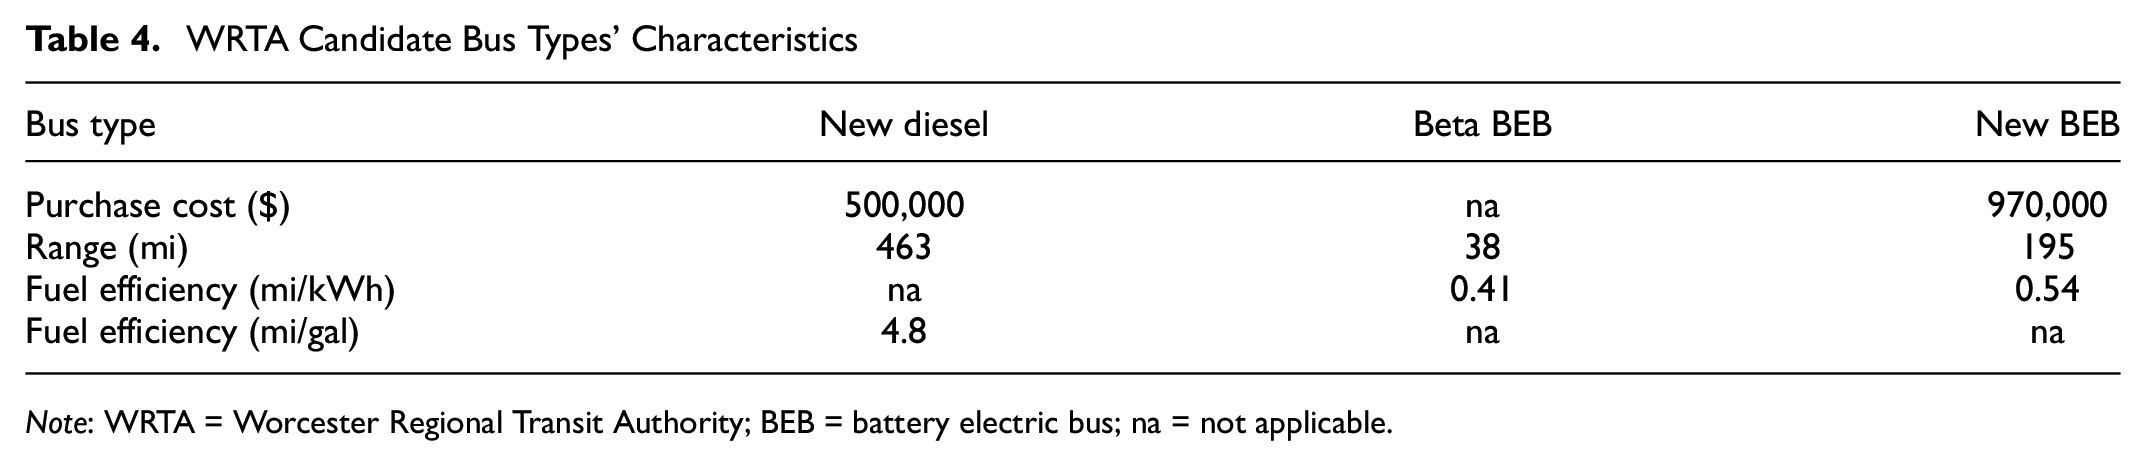
Note: WRTA = Worcester Regional Transit Authority; BEB = battery electric bus; na = not applicable.
It is also assumed that buses do not operate beyond 20% of their battery range remaining to avoid the risk of running out of charge during service hours. These assumptions and inputs from Table 5 create the “WRTA scheme” for this study, which will be used to compare with other scenarios.
WRTA Scheme Inputs
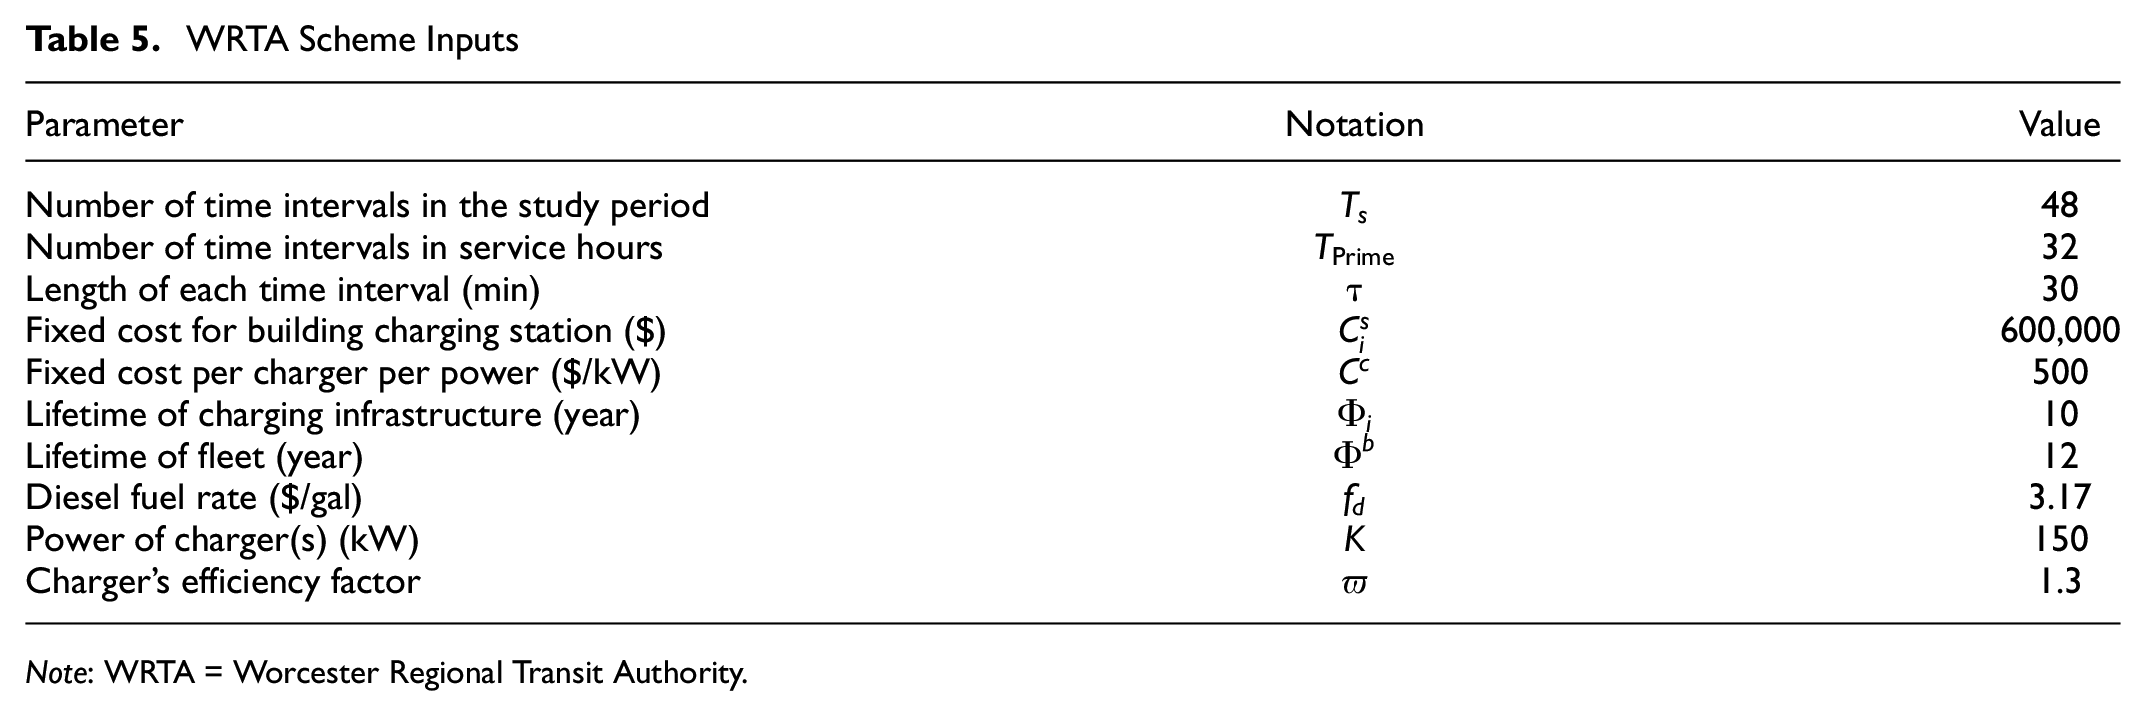
Note: WRTA = Worcester Regional Transit Authority.
Numerical Results
In this section, the goal is to (i) evaluate the performance of the metaheuristic algorithm (SA), (ii) find the optimum operational and investment strategies, and (iii) investigate the sensitivity of the optimum strategies to various input parameters.
Algorithm Performance
The proposed SA algorithm is evaluated for the WRTA scheme. Figure 4a demonstrates changes in objective function value for different main and inner iterations of SA algorithm. In this study, the numbers of main and inner iterations are set to 12 and 20, respectively, based on various sensitivity tests. Figure 4b shows the convergence of the metaheuristic method toward the optimal value provided by CPLEX. This confirms that the metaheuristic algorithm is capable of finding the optimal solution for small case studies and performs well for larger case studies when commercial solvers are unable to solve the problem.
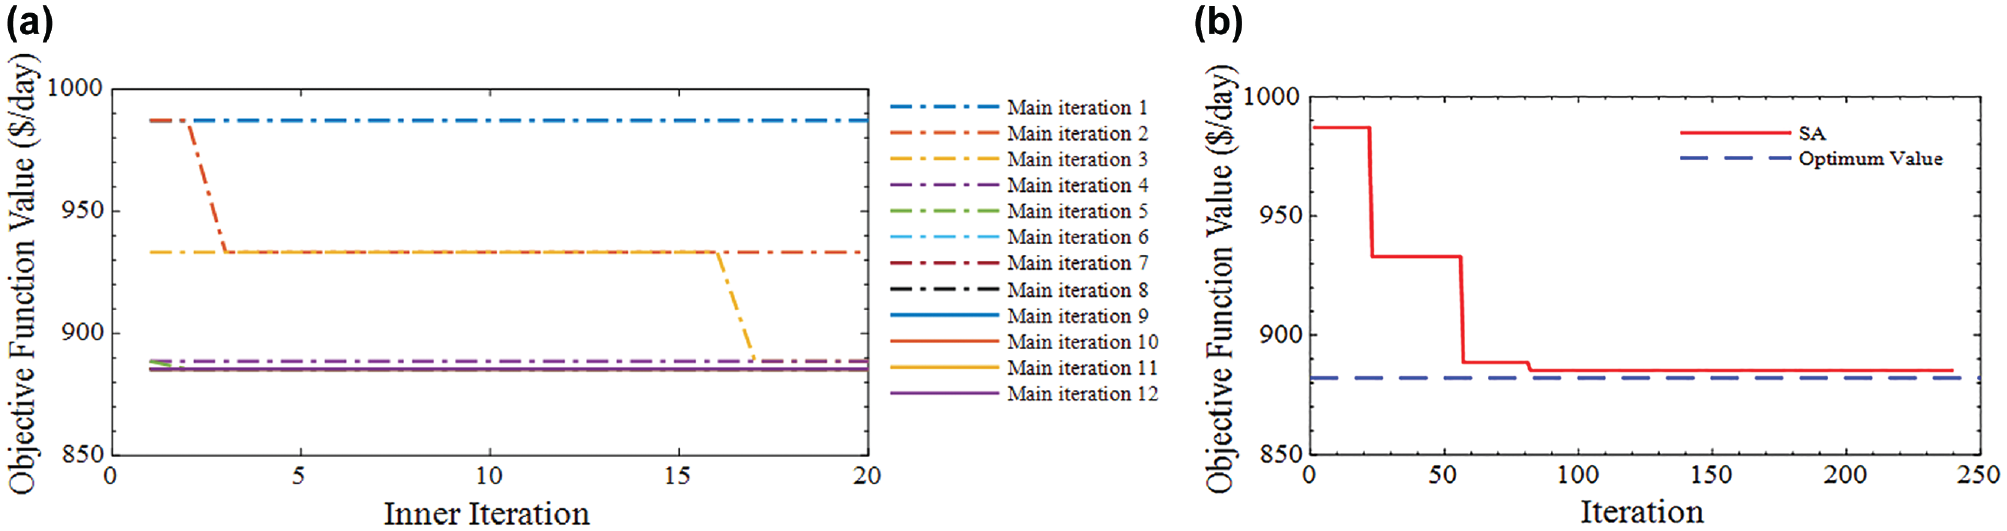
SA algorithm performance: (a) convergence of the main and inner iterations of SA algorithm and (b) convergence to the optimal objective function value provided by CPLEX.
WRTA Scheme
The optimum investment and operation costs for the WRTA scheme are presented in Table 6. The table shows the infrastructure location and cost, fleet type and purchase cost, and energy costs for the optimal solution in deploying a mixed fleet of diesel and electric buses. Infrastructure cost includes the cost of constructing a charging station at WTHS with five 150 kW chargers considering a 10-year lifetime for charging infrastructure. Since WRTA’s current beta BEBs are selected as the optimal bus type, fleet purchase cost only highlights the cost of purchasing backup buses. A 12-year service life is considered for the fleet. Daily energy/fuel cost includes the total cost of diesel and electricity, based on the electricity rates at WTHS, consumed on a daily basis. The infrastructure and fleet cost per day is calculated considering the life of charging infrastructure and fleet, 10-year and 12-year respectively, reported by National Renewable Energy Laboratory (NREL) ( 6 ). The optimum location for building a charging station is the WTHS, with considerable solar energy production and a plan to expand and add storage. These DERs reduce the unit cost of energy at WTHS, making it a favorable location for charging. Beta BEBs are selected as they are available, and thus no investment is required. However, because of the limited range of these beta BEBs, backup buses are required to ensure feasibility and compliance with the schedule. Details of the selected location for the charging station and the number of required chargers are provided in Table 6, followed by optimum bus type, number of backup buses, and cost of electricity and diesel for each route. It should be noted that the WRTA scheme includes beta BEBs, new BEBs, and diesel buses. The availability of current beta BEBs in the case study is a result of WRTA’s policy and decision to consider keeping or removing their current beta BEB fleet based on the results of the optimization model. Existing BEBs decrease the fleet investment which may raise the question whether BEBs remain the optimal bus type for transit systems without any existing BEBs or not. Therefore, the optimal solution is also compared with two other schemes in which either beta BEBs (scheme 1) or beta BEBs and new BEBs (scheme 2) are excluded from the bus type. Thus, in scheme 1, the type of main buses is bounded to only new BEBs plus new diesel as backup buses, and in scheme 2, bus type is bounded to only new diesel buses. It is observed that under the WRTA scheme inputs, the optimal solution can save up to 33% of total cost compared with the other two schemes.
Results for Optimum Solution under WRTA Scheme
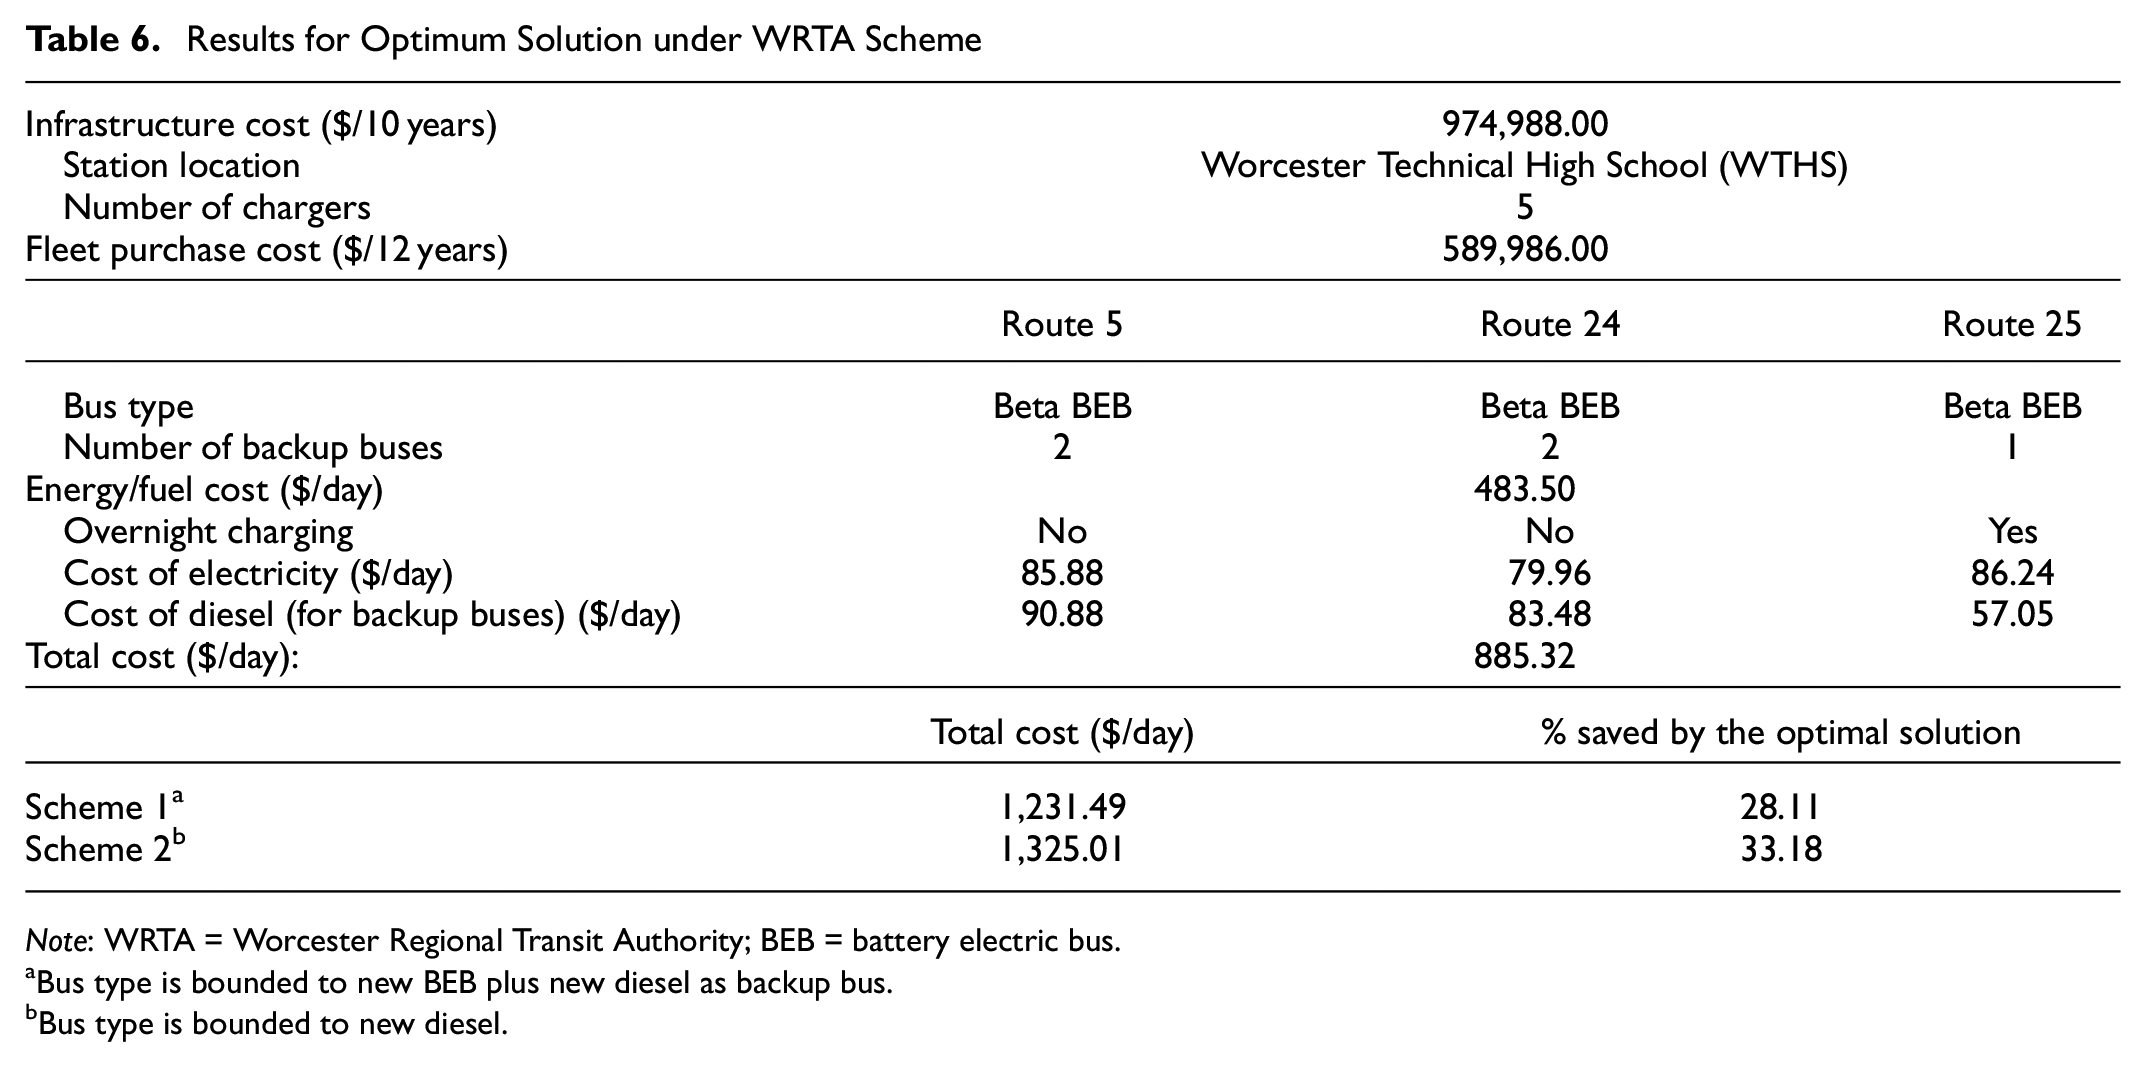
Note: WRTA = Worcester Regional Transit Authority; BEB = battery electric bus.
Bus type is bounded to new BEB plus new diesel as backup bus.
Bus type is bounded to new diesel.
Additionally, Table 7 represents a detailed comparison of the WRTA scheme and schemes 1 and 2. Results show that under the WRTA scheme inputs, even if there were no beta BEBs, new BEBs would still be superior to new diesel buses since they require about 7% less total investment (i.e., $1,231.49 per day for BEBs compared with $1,325.01 per day for diesel buses). According to Table 7, new BEBs need more investment in infrastructure and fleet purchase than do diesel buses; however, they will save a lot on energy, which totally compensates for the money invested in BEBs.
Comparing Optimal Solution with Other Schemes under WRTA Scheme Inputs
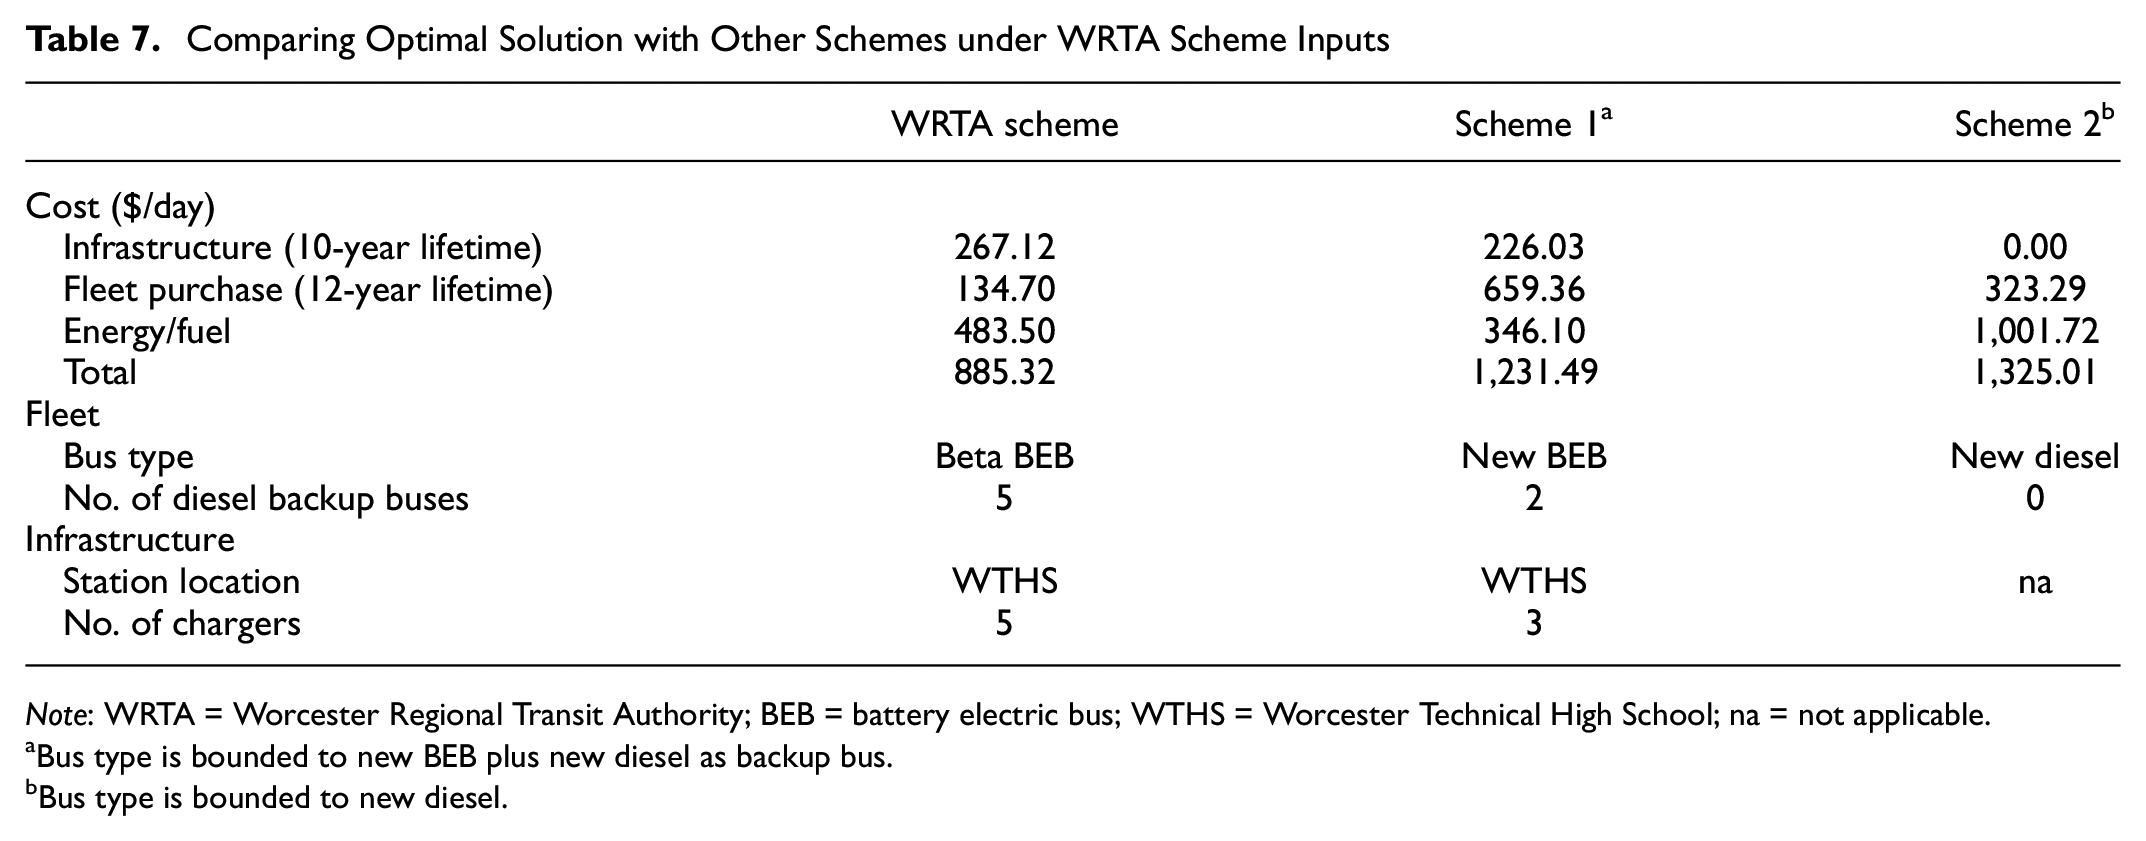
Note: WRTA = Worcester Regional Transit Authority; BEB = battery electric bus; WTHS = Worcester Technical High School; na = not applicable.
Bus type is bounded to new BEB plus new diesel as backup bus.
Bus type is bounded to new diesel.
Figure 5 represents the charging schedule for the optimal solution under the WRTA scheme. The green area shows the service hours (i.e., 6 a.m. to 10 p.m.22:00) in which main buses, in this case beta BEBs, are in service. The orange area displays the non-operational hours used for overnight charging (i.e., 10 p.m. to 6 a.m.), and amber cells indicate charging events during which backup buses are substituted. There is no time interval with more than five BEBs at the charging station concurrently, confirming the optimized number of required chargers. Each bus from routes 5 and 24 has four charging events during the service hours, while buses on route 25 have three charging events during service hours and one overnight.
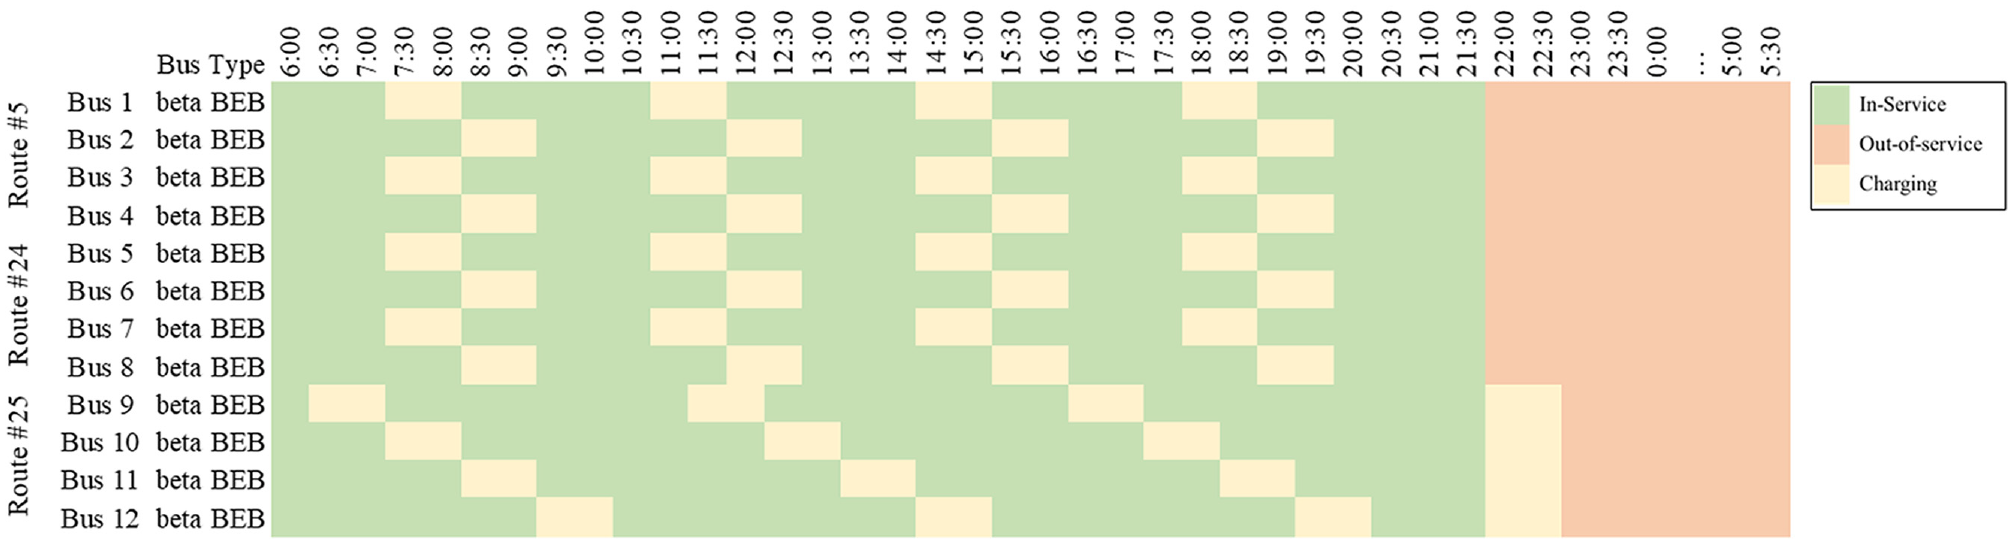
Charging schedule for the WRTA scheme.
Sensitivity Analysis
In the previous section, results are presented for the optimal solution under the WRTA scheme. In this section, multiple sensitivity analyses are conducted to provide insights into the impacts of different factors, namely bus size, charging power, maintenance cost, and adverse weather, on the optimum investment and operation strategy. Results of an analysis with beta BEBs being excluded are also provided wherever it is possible. Details of the inputs considered in scenarios under each sensitivity analysis are reported in Table 8.
Inputs for WRTA Scheme and Sensitivity Analysis Scenarios
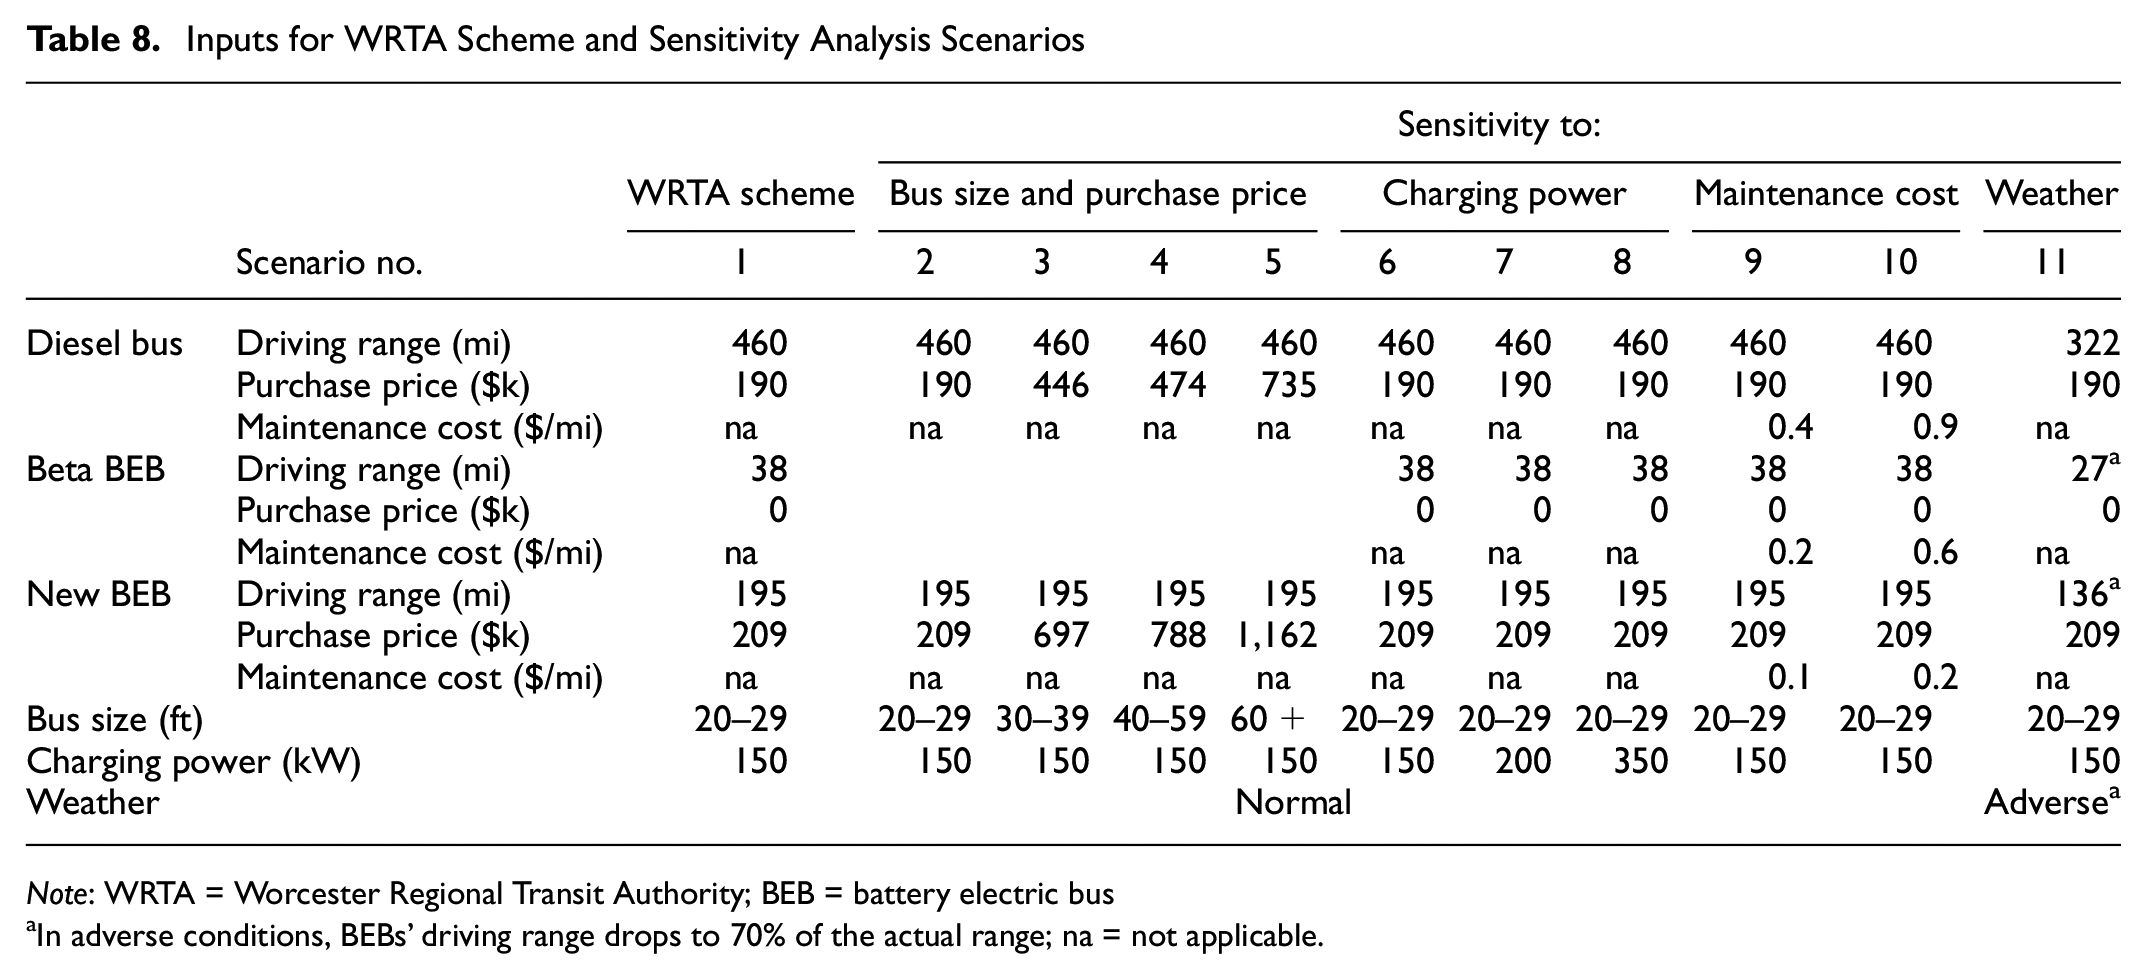
Note: WRTA = Worcester Regional Transit Authority; BEB = battery electric bus
In adverse conditions, BEBs’ driving range drops to 70% of the actual range; na = not applicable.
Bus Size and Purchase Price
Public transit operators seek to purchase buses of different sizes to serve the passengers, ensuring an acceptable level of service. In this section, the impact of bus size is investigated. It is assumed that different bus sizes have the same battery performance; as a result, the difference is only reflected in the cost of purchasing new BEBs or diesel buses if selected as main or backup buses (or both). Since current beta BEBs have a fixed bus size, this analysis only compares scenarios in which only new diesel buses or new BEBs are selected. Figure 6 shows how different bus sizes affect the total cost. In 20–29 ft size, BEBs are superior, but diesel buses are a better investment with a growing difference for the larger bus sizes.
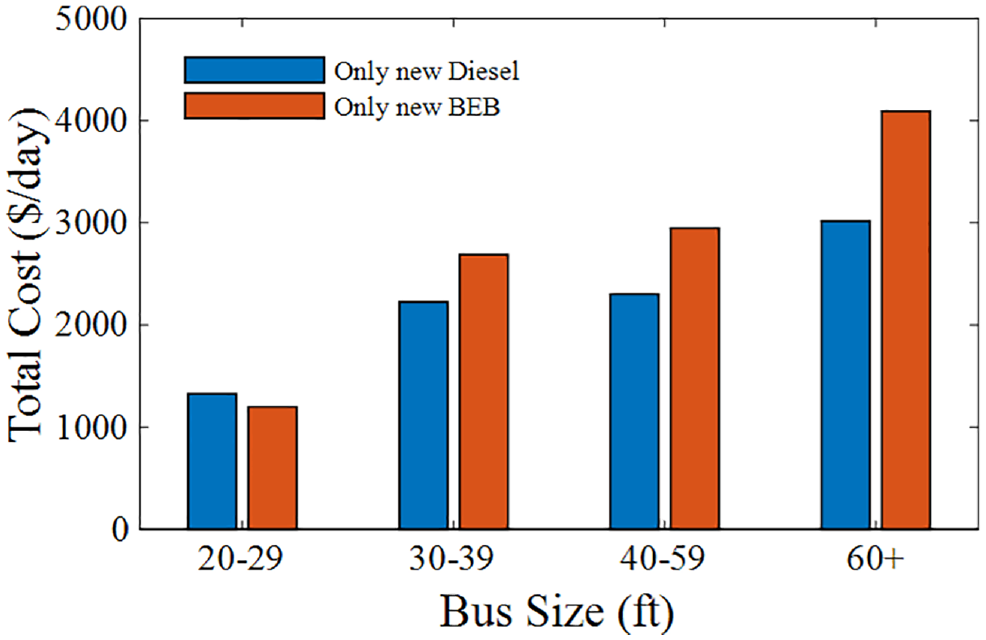
Effect of bus size (purchase price) on the total system cost (i.e., infrastructure, fleet purchase, and energy costs).
Charging Power
Improvements in charging power can lead to shorter refueling times. The impact of increasing charging power should be further investigated as higher charging powers increase the throughput at charging stations; thus, fewer chargers are required. Also, fewer backup buses are required as main BEBs can return from refueling to operation faster. From another perspective, higher charging power with newer technologies increases infrastructure costs. Therefore, it is essential to investigate the impact of different charging power on the total cost. As shown in Figure 7, higher power chargers can reduce the total cost by requiring fewer chargers and backup buses to support refueling time even though they are more expensive per piece. However, increasing charging power beyond 200 kW cannot continuously decrease the cost. For different scenarios, the optimal bus type remains the same as for the WRTA scheme (as shown in Table 6). Infrastructure cost includes 30%, 31%, or 35% of the total cost when 150, 200, or 350 kW charging power is deployed, respectively. Fleet purchase cost decreases by 60% when switching from 150 kW to 200 kW but remains unchanged by switching from 200 kW to 350 kW. The entire fleet spends 48 vehicle hours a day in a charging station equipped with 150 kW chargers (i.e., an average of 4 h per BEB). This drops to 28 vehicle hours for 200 kW or 350 kW chargers, indicating a 42% reduction in total time spent for refueling.
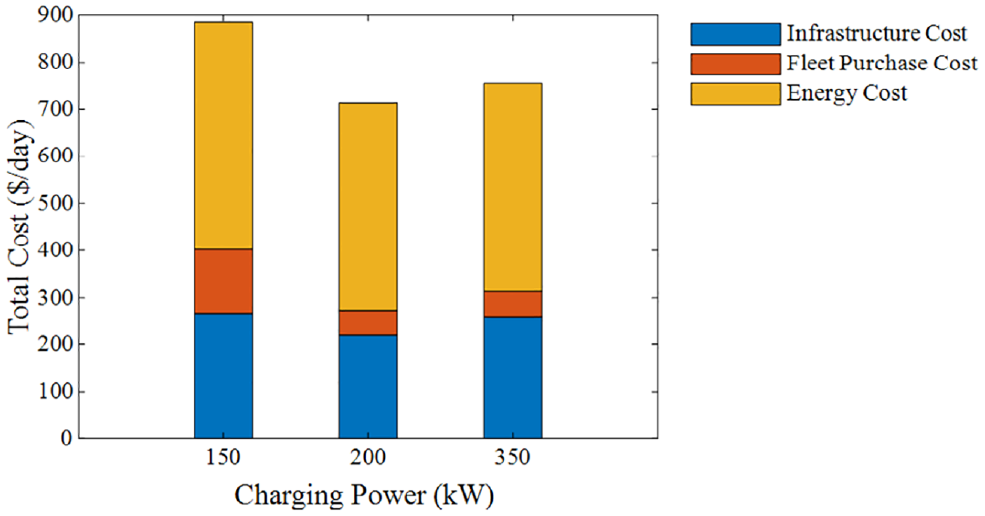
Effect of charging power on the total system cost (i.e., infrastructure, fleet purchase, and energy costs).
Table 9 shows the results for scheme 1 (i.e., beta BEBs excluded). Infrastructure cost increases with growth in charging power, even though the number of required chargers decreases by switching to 350 kW chargers. Fleet purchase cost remains the same by switching from 150 kW to 200 kW but it reduces 7% by switching to 350 kW since fewer backup buses are required. Cost of electricity/diesel decreases with growth in charging power since by switching to higher power, fewer detours are made to charging stations or less diesel is consumed by the smaller number of backup buses.
Details of Exploiting New BEBs with Different Charging Powers
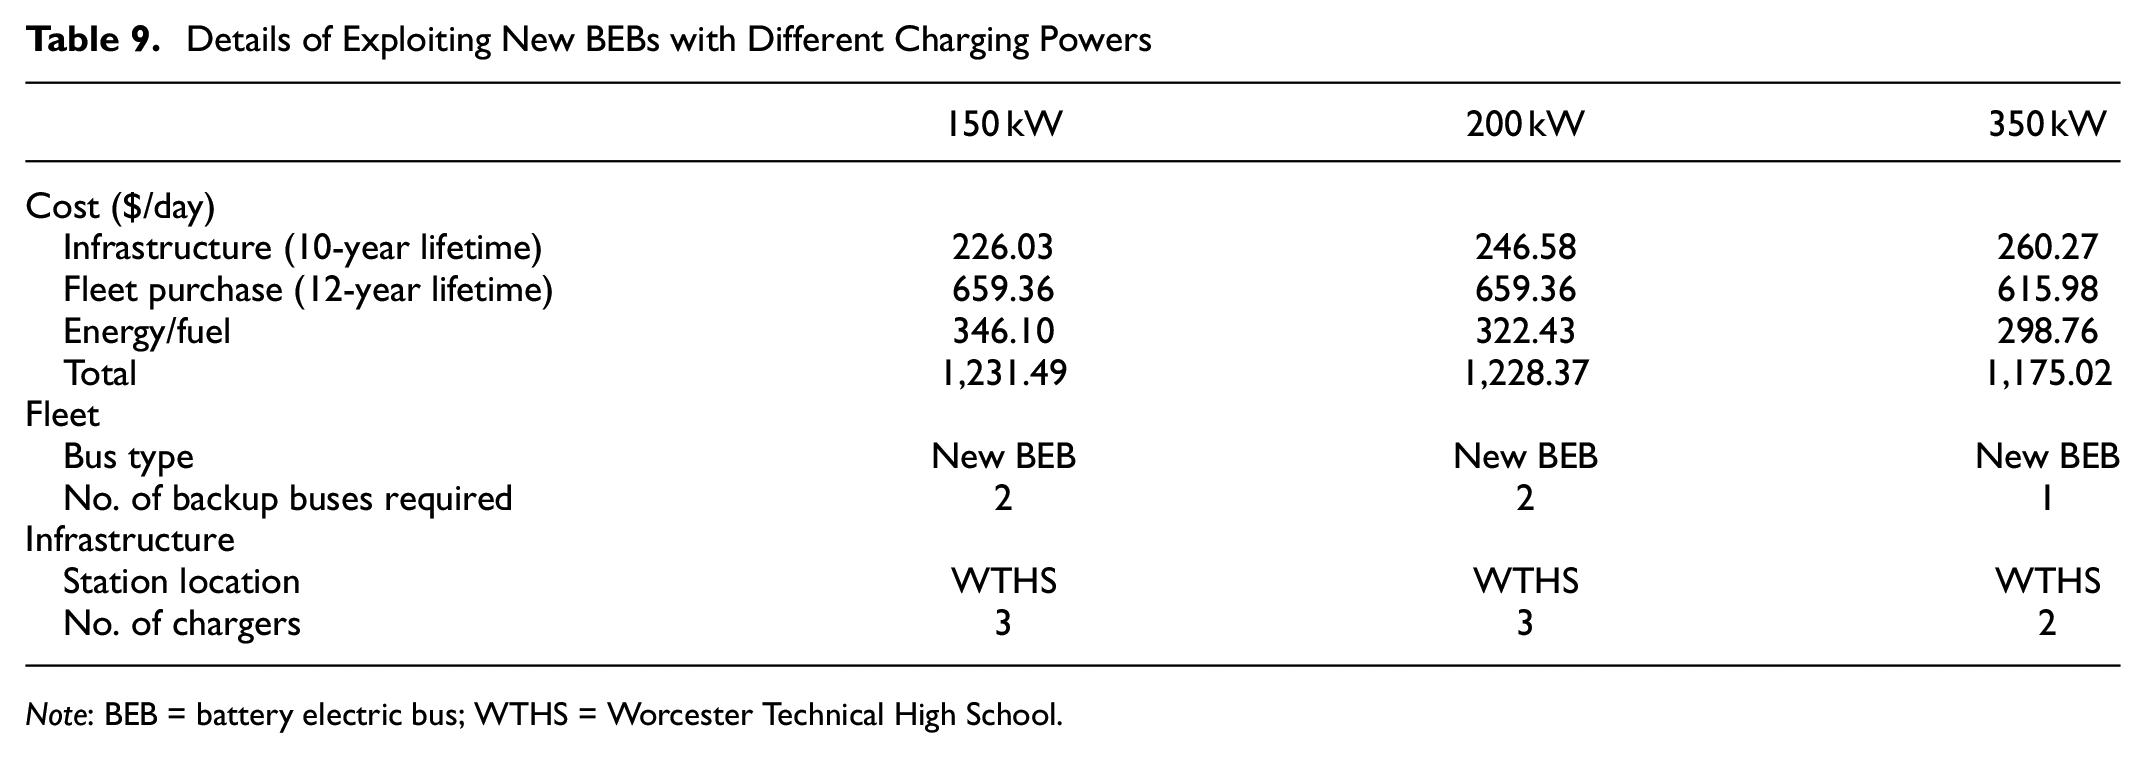
Note: BEB = battery electric bus; WTHS = Worcester Technical High School.
Maintenance Cost
The more miles transit buses travel, the more they cost to maintain. It is also important for transit operators to learn how the maintenance cost can affect their investment and operation strategies as well as the configuration of the fleet (i.e., a combination of diesel and BEB). To this end, a comparison is provided between the WRTA scheme (scenario 1) optimal results and two scenarios with different unit maintenance costs. Maintenance cost is added into the total system cost using unit maintenance costs reported by WRTA (scenario 9) and NREL (scenario 10) ( 6 ). As shown in Table 10, since unit maintenance costs reported by WRTA are lower than those from NREL, as expected, the results of the scenario using WRTA unit maintenance costs are more similar to the WRTA scheme (scenario 1). For instance, optimal bus types selected for routes 24 and 25 remain the same. NREL data shows a greater difference between the unit maintenance cost of new BEBs and both beta BEBs and diesel buses. As a result, the optimal solution of this scenario is more inclined toward selecting new BEBs. Comparing against the WRTA scheme, the total cost is increased by 43% and 94% using unit maintenance cost reported by WRTA and NREL, respectively.
Results for Optimum Solution under Scenarios with Maintenance Cost
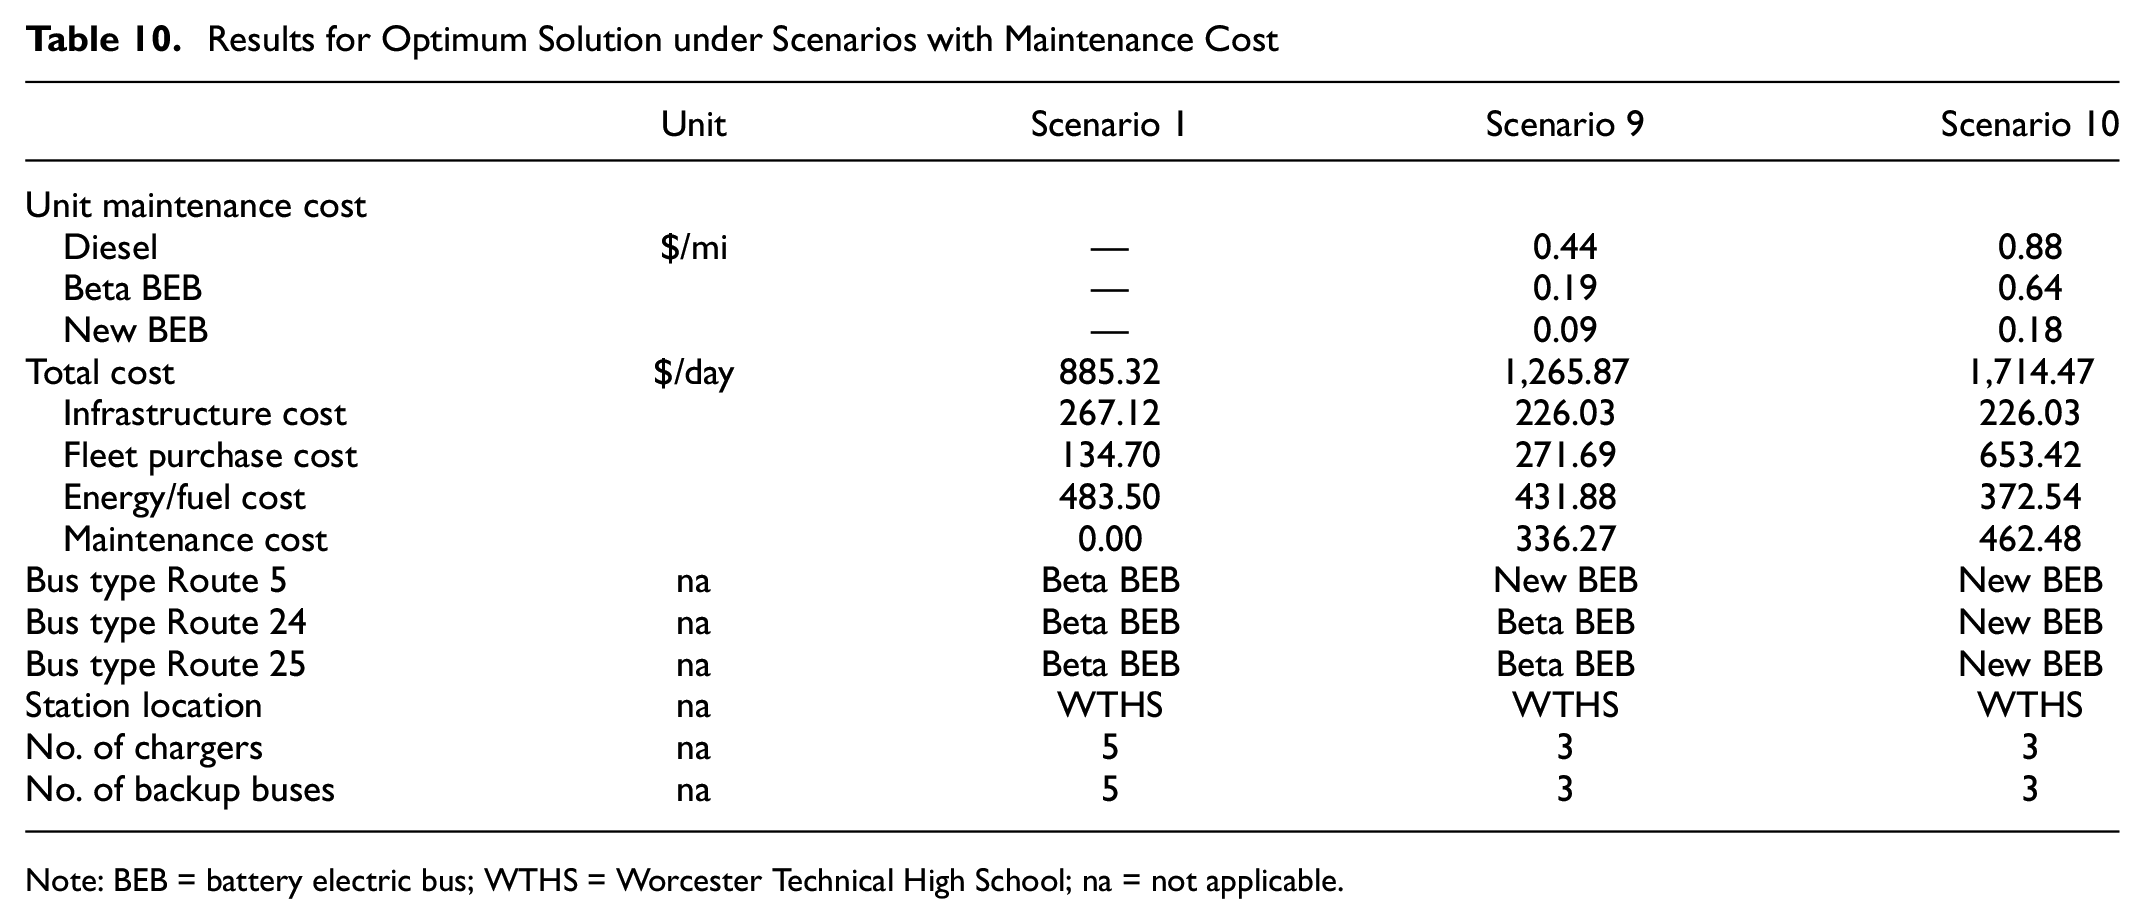
Note: BEB = battery electric bus; WTHS = Worcester Technical High School; na = not applicable.
Impact of Weather
The city of Worcester is located in the East Coast area of the USA and experiences cold winters and warm summers. In this section, the impact of adverse weather conditions on investment and operation strategies is studied. It is assumed that in such conditions, BEBs’ range would drop to 70% of their actual range ( 37 , 39 , 59 , 60 ). Therefore, they require more frequent charging events. Therefore, more chargers and more backup buses are required to keep compliance with the schedule. Figure 8 shows a comparison between the WRTA scheme (scenario 1) in normal and adverse weather conditions. Adverse weather slightly affects the infrastructure cost (i.e., 8% increase), but it has the greatest impact on fleet purchase and energy costs (i.e., 20% and 18% increase, respectively). In adverse weather, BEBs spend 72 vehicle hours daily refueling compared with 48 vehicle hours in normal weather conditions. It can be observed that planning for normal weather conditions may result in underdevelopment of infrastructure and increased delay, thus affecting the reliability and level of service.
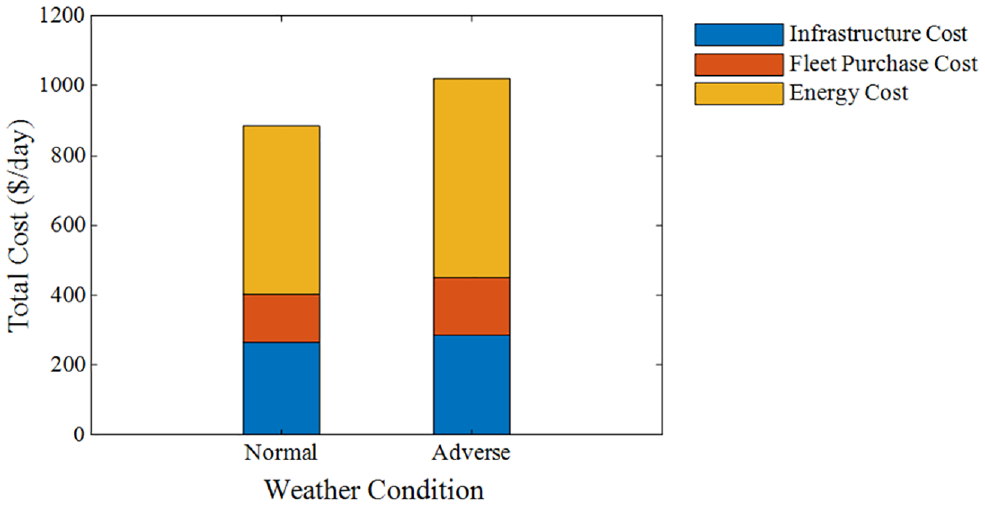
Impact of weather conditions on the total system cost (i.e., infrastructure, fleet purchase, and energy costs).
Conclusions
This study proposes a mixed-integer problem with linear constraints to optimize the operation strategies and infrastructure planning for a transit network, including a mixed fleet of diesel and electric buses. The objective function minimizes the total cost, including infrastructure, fleet purchase, and energy costs, to find the optimum charging station locations, number of chargers, bus type(s), number of backup buses, and charging schedule. A metaheuristic algorithm is proposed based on SA to solve this problem for large-scale networks. The numerical results for the WRTA show a successful application of the proposed methodology. Key findings from numerical experiments and sensitivity analyses are:
WRTA’s current BEBs can support their needs and comply with the schedule if sufficient charging infrastructure is provided. The application of solar panels in charging stations reduces the cost of electricity and makes charging stations more cost-efficient.
Savings as high as 33% in total investment are reported in the WRTA scheme by keeping its current BEBs, while having diesel buses as backup, compared with routes entirely operated by diesel buses.
Findings of this study show new BEBs require about 7% less total investment than do new diesel buses. Thus, even for transit systems without any existing BEBs, new BEBs are still optimum.
By increasing bus size and purchase price, BEBs are no longer superior to diesel buses. This is a sign that transition to BEBs can start from routes in which smaller buses can serve the passenger demand.
Higher power chargers can reduce the total by requiring fewer chargers and backup buses to support refueling time even though they are more expensive per piece. Switching from 150 kW chargers to 200 kW chargers can decrease fleet purchase cost and total time spent refueling by 60% and 42%, respectively; however, switching from 200 kW to 350 kW chargers does not have a notable impact.
The adverse weather conditions affect the performance of the battery in BEBs significantly, but BEBs provide more savings than diesel buses. However, more infrastructure and backup buses are required to support adverse weather conditions. Thus, it is crucial to consider this impact in planning for transit service to maintain an acceptable level of service.
Future Research
For future research, the impacts of several phenomena or technologies can be considered as follows:
Battery degradation, grid overloading, demand/delivery charges, electrical upgrade costs, and time-of-use electricity rates.
Deployment of wireless charging facilities, specifically for the cases that BEBs can be charged mid-route.
Additional cost components, including, but not limited to, resale value and emissions cost.
Spatiotemporal variation of passenger demand and the impact on the outcomes of the modeling framework for optimal bus size and compliance with the schedule.
Stochasticity in technology advancements, the impacts on the battery and charging infrastructure performance, and costs.
It is worth noting that the modeling framework presented here can be adopted by transit agencies operating in different weather conditions. However, minor adjustments might be needed based on the transit agency’s plans and requirements.
Footnotes
Acknowledgements
The authors appreciate the assistance of Todd Isherwood (Willdan), Dennis Lipka (WRTA), and Ariel Horowitz (MassCEC) through the data collection process.
Authors’ Note
The first author is a young investigator, who is 35 years old or younger.
Author Contributions
The authors confirm contribution to the paper as follows: study conception and design: A. Soltanpour, M. Ghamami, M. Nickman, M. Ganji, W. Tian; data collection: A. Soltanpour, M. Ghamami, M. Nickman, M. Ganji, W. Tian; analysis and interpretation of results: A. Soltanpour, M. Ghamami, M. Nickman, M. Ganji, W. Tian; draft manuscript preparation: A. Soltanpour, M. Ghamami, M. Nickman, M. Ganji, W. Tian. All authors reviewed the results and approved the final version of the manuscript.
Declaration of Conflicting Interests
The author(s) declared no potential conflicts of interest with respect to the research, authorship, and/or publication of this article.
Funding
The author(s) disclosed receipt of the following financial support for the research, authorship, and/or publication of this article: This material is based on work supported by the Massachusetts Clean Energy Center.
The authors naturally remain solely responsible for all contents of the paper.