
Abstract
Traffic safety is a critical aspect of transportation. Transportation agencies and researchers have been continuously making an effort to ensure minimal error margins in the road system. There is a growing interest in the Southeast Michigan region because of the active role of original equipment manufacturers in spurring research in the new mobility field and autonomous vehicle technology. As new jobs are created and commuting trips increase, traffic safety becomes even more important. Thus, this study presents one of the first efforts to study crash patterns for Southeast Michigan using machine learning models to analyze and predict crash severity in the region based on various contributing factors. We combine a three-step method of correlation analysis, machine learning predictive models, and spatial analysis to develop a rigid schema for crash prediction. Results show that decision tree classifiers provide accurate predictions and rapid computations. Also, spatial plots of predicted injury severities reveal disproportionate errors in model predictions at intersections prompting the need to stratify the crash data for further analyses. This significantly improves severe injury predictions at non-intersection locations and highlights pedestrians as a main important feature. The converse holds for intersections that identify motorcycles as the main feature for severity prediction. Further results are elucidated in this paper.
Roadway safety is a critical component of transportation and one of the main focal points of research in the field. Over the last decade in the U.S.A., records indicate that the high occurrences of traffic crashes result in property damage, injuries, and fatalities ( 1 ). For this reason, it is essential to enhance research methods for predicting crash severity to determine the causes of crashes. In addition to this, it is also of great importance to identify locations with high crash occurrences to enact mitigating measures.
Over the years, a wide variety of statistical and data-mining methods have been used to assess the severity of crash injuries. From one perspective, the analysis of crash injury severity can be divided into two main categories: choice models and machine learning-based methods. Ordered probit, binary, and multinomial logit models are among the most frequently used choice models to predict crash injury severity. The main advantage of these approaches lies in their interpretive capabilities resulting from clear technical formulations between the dependent (i.e., class of the injury severity) and the explanatory variables. Kockelman and Kweon ( 2 ), for example, leveraged ordered probit models for evaluating injury levels under different crash types. One of the conclusions from their work was that pickups and SUVs are not as safe as passenger cars for the driver in single-vehicle crashes. In another study, Abdel-Aty ( 3 ) used ordered probit models and reported that driver’s age, gender, seat belt use, point of impact, speed, and vehicle type were significant in analyzing driver injury severity.
Other perspectives of crash severity analysis include statistical choice models and probability estimation for vehicle damage and injury severity based on various contributing factors ( 4 ). Although widely used for crash analysis, statistical choice models suffer from erroneous predictions, mainly because of the violation of models’ intrinsic assumptions about the endogenous and exogenous variables. Analyzing crash records indicates that less severe crashes are more likely to be underreported. Therefore, non-random samples of dependent variables are usually the case, violating the basic assumption of econometric models ( 5 ). In addition, the spatial and temporal correlation between crashes ( 6 ) and the endogeneity of model predictors ( 5 ) can significantly affect the performance of choice models in predicting the levels of crash severity. Despite substantial progress in addressing these problems, they still pose significant challenges in the field, leading to incorrect parameter estimations and erroneous statistical inferences ( 7 ).
As discussed earlier, there is an increasing interest toward using artificial intelligence techniques and machine learning models to predict crash severity. Several studies indicated that these models outperform traditional statistical methods in accurately predicting severity level in traffic crashes. On the other hand, many recent research works have focused on comparing the performance of different machine learning techniques in crash severity analysis. In their study, Zhang et al. ( 7 ) proved the higher performance of machine learning techniques in characterizing crash severity compared to multinomial logit and ordered probit models. In a similar study, Iranitalab and Khattak ( 8 ) illustrated that the three machine learning techniques of K-nearest neighbor (KNN), support vector machine (SVM), and random forest (RF) classifiers outperform the widely used multinomial logit models in regard to correct predictions. Alkheder et al. ( 9 ) also developed an artificial neural network structure to predict the severity level of traffic crashes that occurred in Abu Dhabi over six years. Results indicated noticeable improvements in the model’s prediction power compared to ordered probit models.
A review of these studies suggests that tree-based modeling structures often provide higher prediction accuracies compared to other machine learning techniques when predicting crash severity level. For example, Zhang et al. ( 7 ) compared the performance of four machine learning models, including decision tree (DT), RF, KNN, and SVM, and indicated that the RF model had the highest overall predicting accuracy. Their results are also consistent with the findings of Iranitalab and Khattak. Mafi et al. ( 10 ) also proved the higher performance of RF models in predicting driver injury severity at signalized intersections. In the present study, we also detected a similar pattern in the performance of adopted machine learning models. Our results indicated that the two tree-based modeling structures, DT and RF classifiers, provide a more balanced and accurate prediction of crash severity level in Southeast Michigan.
A promising example of efforts to enhance predictive modeling concepts for traffic crashes using machine learning techniques is a recent study by Mafi et al. ( 10 ), who leveraged instance-based and RF machine learning models for injury severity prediction for intersection safety. In this study, Mafi et al. ( 10 ) proposed a cost-sensitive approach that accounted for monetary cost penalization for inaccurate injury severity predictions during the development of the algorithms: cost-sensitive models indicated better prediction and minimized bias. In another study, Wahab and Jiang ( 11 ) investigated the severity level of motorcycle crashes using three different machine learning techniques. A relative importance analysis was also conducted to evaluate the effect of each model predictor on injury severity prediction. Safety strategies were then suggested to reduce the severity level in motorcycle crashes based on the most critical determinants identified by the model. Furthermore, machine learning models have been proven in several studies as superior to conventional methods for predicting crash severities in mountainous freeways ( 12 ), work zones ( 13 ), and freeway diverge areas ( 14 ).
With the focus on the Southeast Michigan region, the present study adopts machine learning techniques to predict crash injury severity. The region is regarded as an important area for the future of mobility. The transition from a rust-belt region to a location of increased high-tech activity began about a decade ago and is still witnessing restructuring ( 15 ). As such, we expect to see an increase in economic and industrial activity over the next couple of years. The presence of original equipment manufacturers and their involvements in autonomous vehicle research also means that there is anticipated growth in job opportunities and traffic congestion in urban centers. It is worth mentioning that the Ford Motor Company purchased and is currently remodeling the otherwise washed-out Michigan Central Train Depot located in the Corktown area in Detroit ( 16 ). It is expected that these developments will usher in thousands of commuting trips to the area. General Motors has also announced its decision to invest millions of dollars into expanding its plants in Southeast Michigan. While these developments are essential for socio-economic growth, they also imply increased commuting trips and traffic volumes. Already in 2019, reports indicate that more fatalities were recorded in Michigan than at the same time last year. Traffic safety is an important aspect of transportation to consider in the advent of Southeast Michigan’s growth. Even though statistics exist for traffic safety trends in the region, there have not been extensive studies in recent years for predicting crashes by severity. Such studies will serve as a basis to enact proactive/preventive measures. For this reason, in this study, we undertake a rigorous crash analysis for Southeast Michigan. The overarching objective of this paper is to predict the severity of crash-related injuries for the Southeast Michigan region using machine learning methods. Thus, we seek to answer the following research questions with this study: (i) what are the important contributory factors to crash severity in Southeast Michigan; (ii) how can we leverage spatial techniques to refine crash severity analyses to enhance model predictions; and (iii) which machine learning modeling provide superior performance in predicting crash severity? The structure of the paper is as follows. After this introduction, the second section discusses the methodology for this study, where we introduce the dataset, the machine learning models leveraged in our analyses, as well as initial correlation analyses to select variables of interest for our study. The third section highlights the results with discussions of our findings, and the final section of this paper details our conclusion and recommendation for future studies.
Methodology
To answer the abovementioned research questions, we develop and utilize a three-stage analytical schema that considers descriptive statistics and correlation analysis, injury severity predictive modeling using machine learning models, and spatial representation of model predictions using geographical information system (GIS) tools to guide analytical decisions for improved predictions. This approach ensures that we obtained a streamline set of important and relevant variables to crash severity, as well as refine the data stratification process for more focused analyses to arrive at results that are robust and can inform practical policy interventions.
Overview of Dataset and Data Preparation Methods
Data used for this study is from the Southeast Regional Council of Government (SEMCOG) database ( 17 ). The SEMCOG region is a seven-county region in Michigan with a total population of approximately 4.7 million, according to the region’s July 1, 2018, estimate. The seven counties in the area are Livingston, Macomb, Monroe, Oakland, St. Clair, Washtenaw, and Wayne. The crash database provides historical crash data over six years from 2013 to 2018. There are approximately 800,000 crashes recorded in this database. Furthermore, with anticipated growth in activity in the area, caused by projected developments, there is a chance that trends would escalate if the transportation authorities do not endorse proactive preventive measures.
As part of the initial data analysis, this study chooses several features as potential factors that may impact the crash severity. It includes explanatory variables such as alcohol, drug involvement, weather condition, crash type, and road condition. As a preprocessing method, these categorical variables are flattened into binary dummy values to better evaluate their individual impact on crash severity.
For severity level, the dataset classifies crashes into “Fatal Injury, Suspected Serious Injury, Suspected Minor Injury, Possible Injury, and No Injury” according to the KABCO injury classification scale produced by Federal Highway Administration ( 18 ). Previous literature showed that similar approaches that attempt to classify crash severity into multiple classes (greater than 2) tend to suffer low prediction accuracy, especially for high severity crashes. The low accuracy may result from the relatively small sample size and additional computational complicity for multiclass classification ( 8 ). In this study, the preprocessing step groups the KABCO injury severities into a binary variable “Severe.” It takes the value of “1” as severe for fatal injury and suspected serious injury, and “0” as non-severe for suspected minor injury, possible injury, and no injury. Other pertinent variables in the dataset are described in Table 1.
Descriptive Statistics of Variables
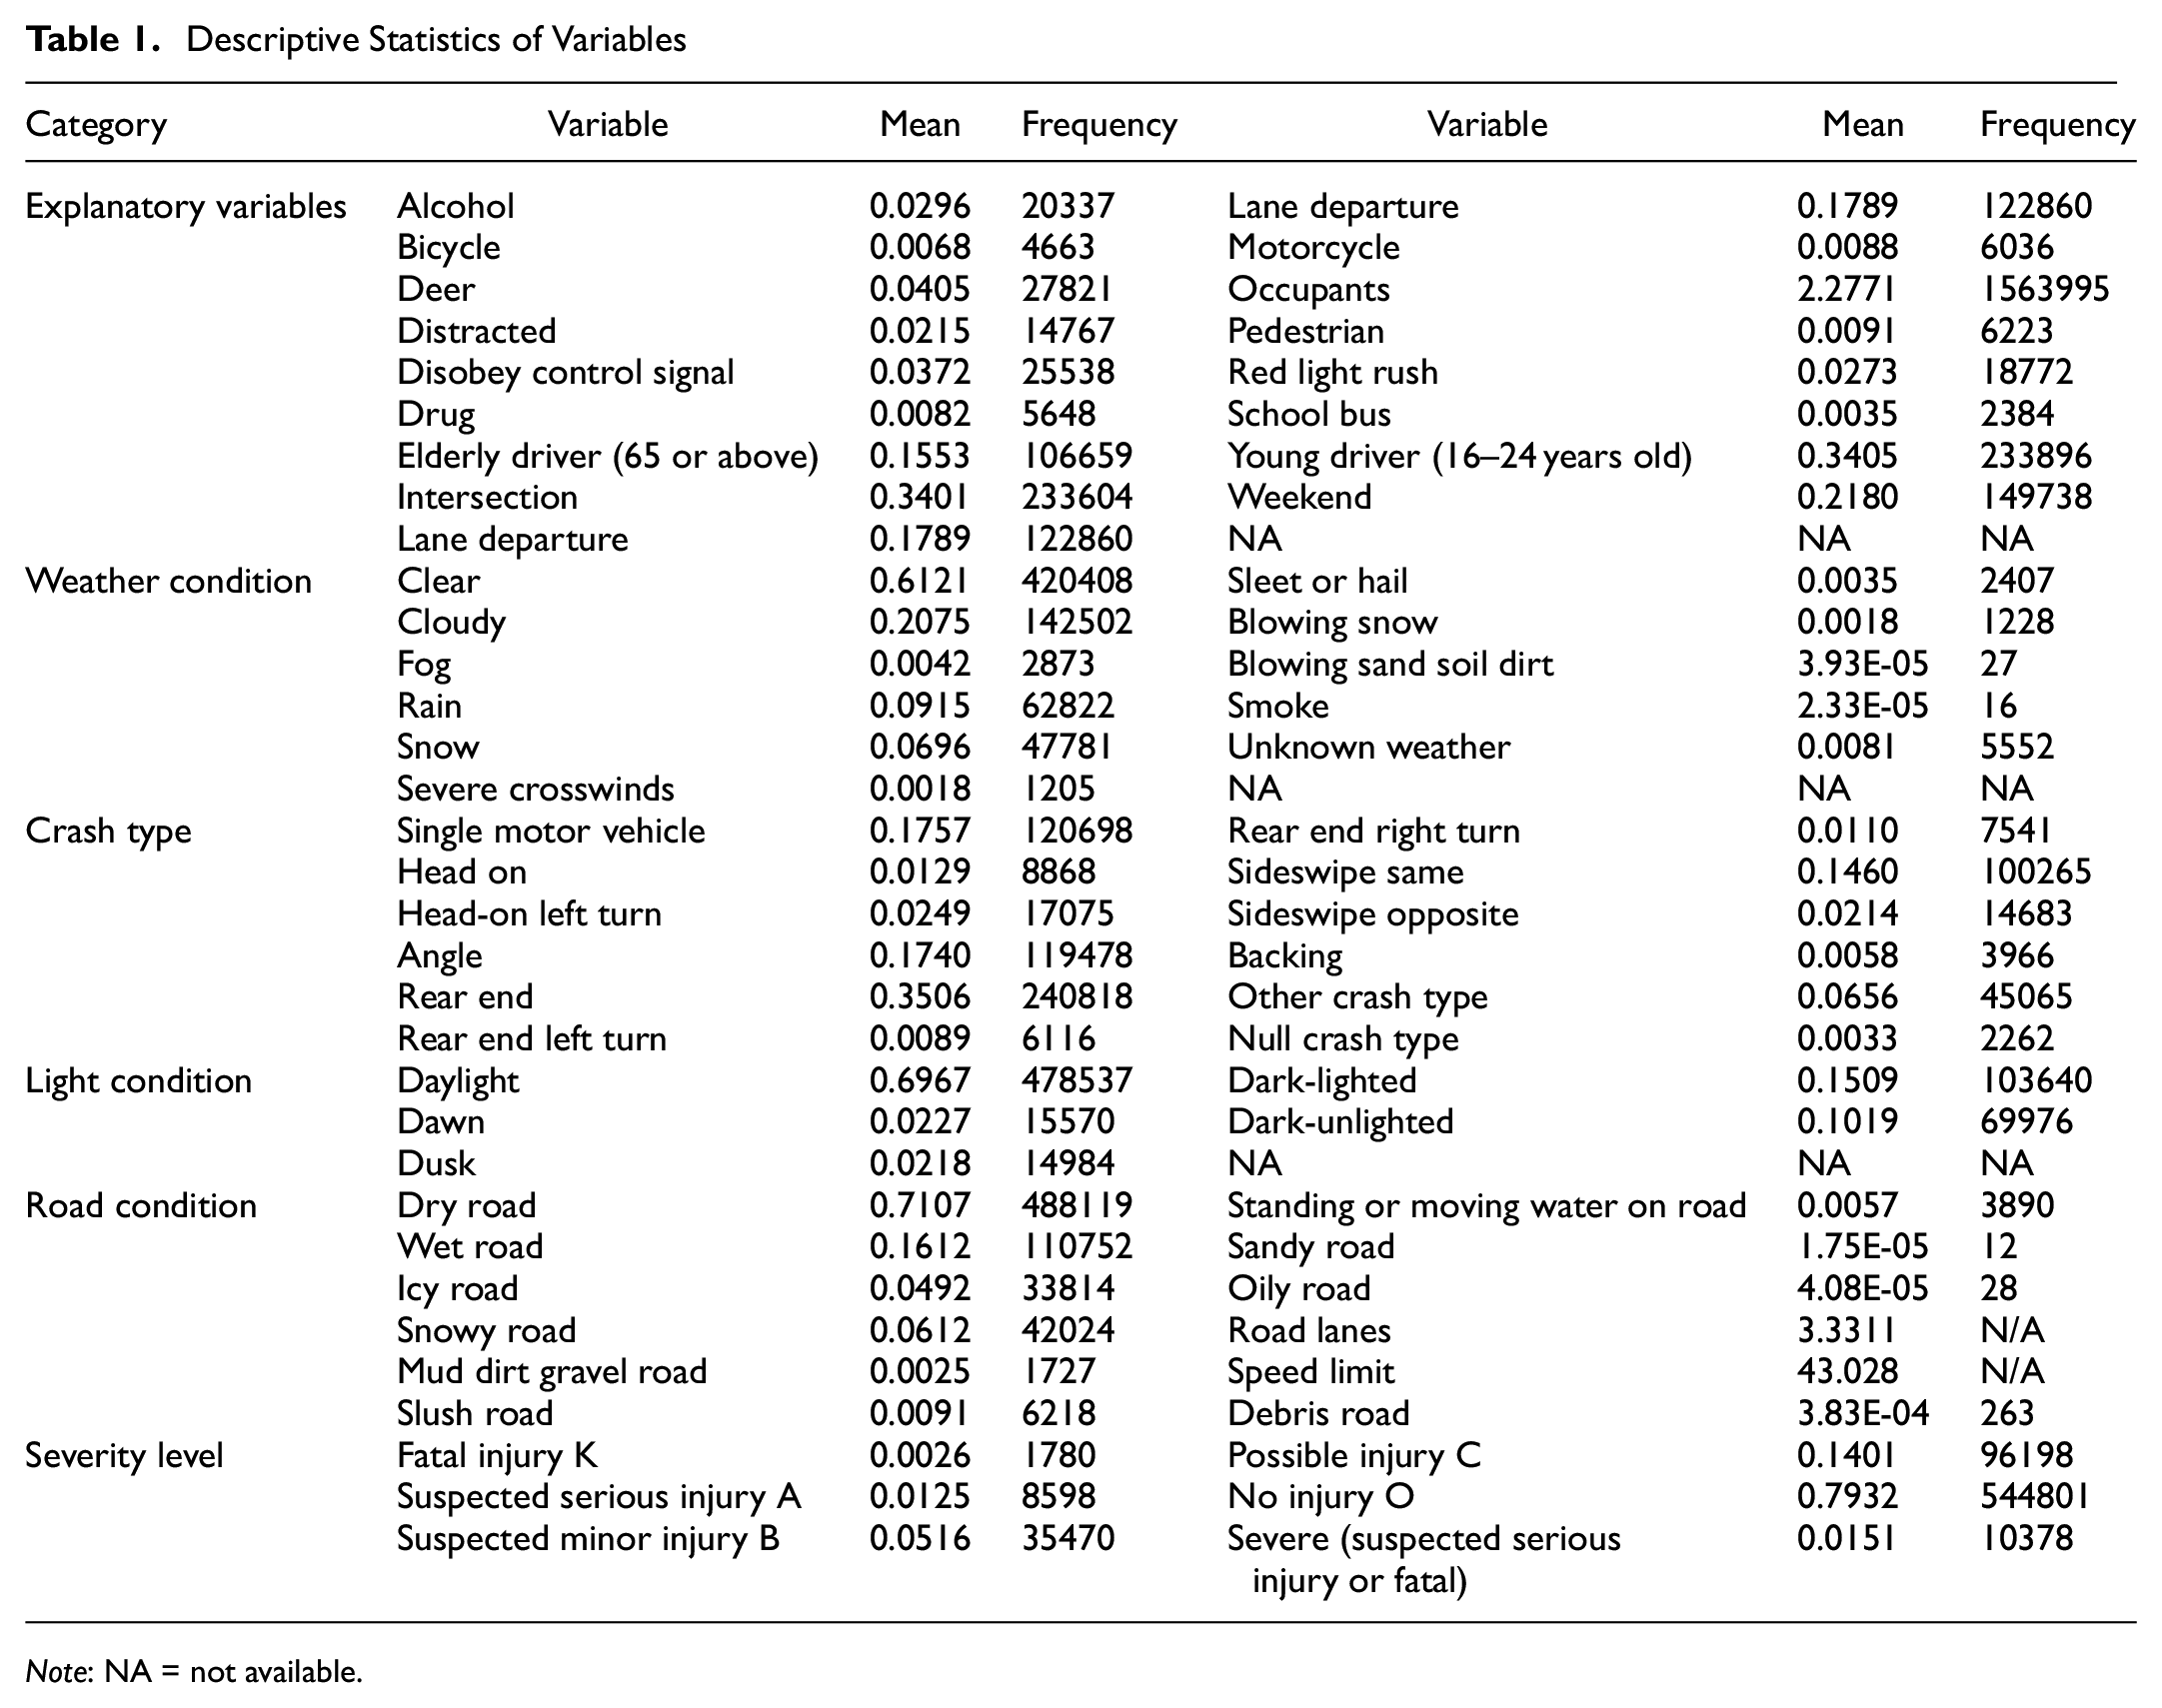
Note: NA = not available.
While some machine learning algorithms can work with categorical data, most require input or output variables to be numeric. Input data such as “Lighting” that does not have any ranking for category values can lead to poor performance or less accurate results. To prepare data and get improved prediction each categorical value has been converted into a new unique variable and assigned a binary value of 1 or 0 (0 indicates nonexistent while 1 indicates existent). These new columns are used as features to train the model.
Machine Learning Models for Crash Severity Prediction
Different machine learning classification methods are developed to predict the class of a sample based on its features. Some learning methods require a dataset with both features and their known classes to train the classifier. These methods are known as supervised learning. This study used the supervised classification methods of DT, RF, SVM, artificial neuron network (ANN), Logistic Regression (LR), KNN.
DT
DT’s name presents rules of classification that are simple and interpretable by humans ( 19 ). The internal nodes/branches represent test conditions, and leaf nodes that represent the final classes. The tree starts from the root nodes, which contain all sample sets, moves down internal nodes, and get classified at the leaves. Each internal node divides the observations into classes based on the features that best divide that node’s set of samples into subsets. It computes the information gain from the split by evaluating the change of entropy. The algorithm picks out the attribute with the largest information gain to split the data at each node. DT repeats this procedure until the subset’s size is small enough, or all the samples in the current subset belong to the same class. In this work, the normalized information gain at each node, which can evaluate a feature’s importance, is also used to support the feature selection for the data.

where T is current state, and X is selected attribute.
RF
RF is an ensemble learning method (use multiple classifiers and aggregate their results) ( 20 ). It consists of a collection of DT classifiers with independent identically distributed random vectors. Each node of RF is split using the best among a subset of tree classifiers randomly chosen at that node. This method has performed very well compared to many other commonly used classifiers and is robust against overfitting ( 21 ).
SVM
SVM is a machine learning approach developed by Vapnik ( 22 ). It is a system for efficiently training the linear learning machines in the kernel-induced feature spaces while utilizing the generalization theory and the optimization theory. It includes a set of related supervised learning methods used for prediction and regression. Structural risk minimization is one of the key theoretical foundations for the learning algorithms of SVMs. In this study, the author selects the linear support vector classifier (LSVC). The preprocessing step flattens most of the inputs into binary dummy variables, and LSVC provides high computational efficiency.

ANN
ANNs are machine learning methods that are inspired by biological neural networks. It consists of a collection of connected units (neurons). Each neuron can receive, process, and pass along information and their network become a parallel processing system. It can adapt different learning rules. This study chooses multilayer perceptron, which is one of the most commonly used learning rules. It can approximate any finite nonlinear functions with very high accuracy ( 23 ).
LR
LR uses a logistic function to model a binary dependent variable. It is a widely used discrete choice model. Many previous approaches in the literature have used its multiclass form, multinomial LR for crash severity analysis ( 8 ). This study classifies the severity as a binary variable (severe/non-severe), so LR will suffice. In the logistic model, the logarithm of the probability of that value being “True” is a linear combination of the observation’s feature variables. The classifier can then mark the data with the calculated probability.

where b is the base of logarithm, and βi is the parameters of the model.
KNN
KNN classifies a target observation by looking at the closest k observations. It will classify the observation based on the classification of the majority of the k closest samples. To implement KNN, it needs to decide the value of k and distance function for nearest neighbor. This study determines k value by cross-validation accuracy. For distance function, we choose Euclidean distance, which can be interpreted as the physical distance between two high dimensional points ( 24 ).
Feature Selection
In this study, we adopt two initial feature selection processes to reduce the data size to improve classification results: correlation analysis and DT feature importance. The selected feature is then used in the machine learning models as input for severity prediction. In the first step, we compute a correlation matrix for all the potential features and the severity levels. The correlation is used to estimate the plausibility of a feature to result in a severe crash. Table 2 shows the highest-ranking features based on their correlation values.
Correlation Analysis and Decision Tree Feature Importance
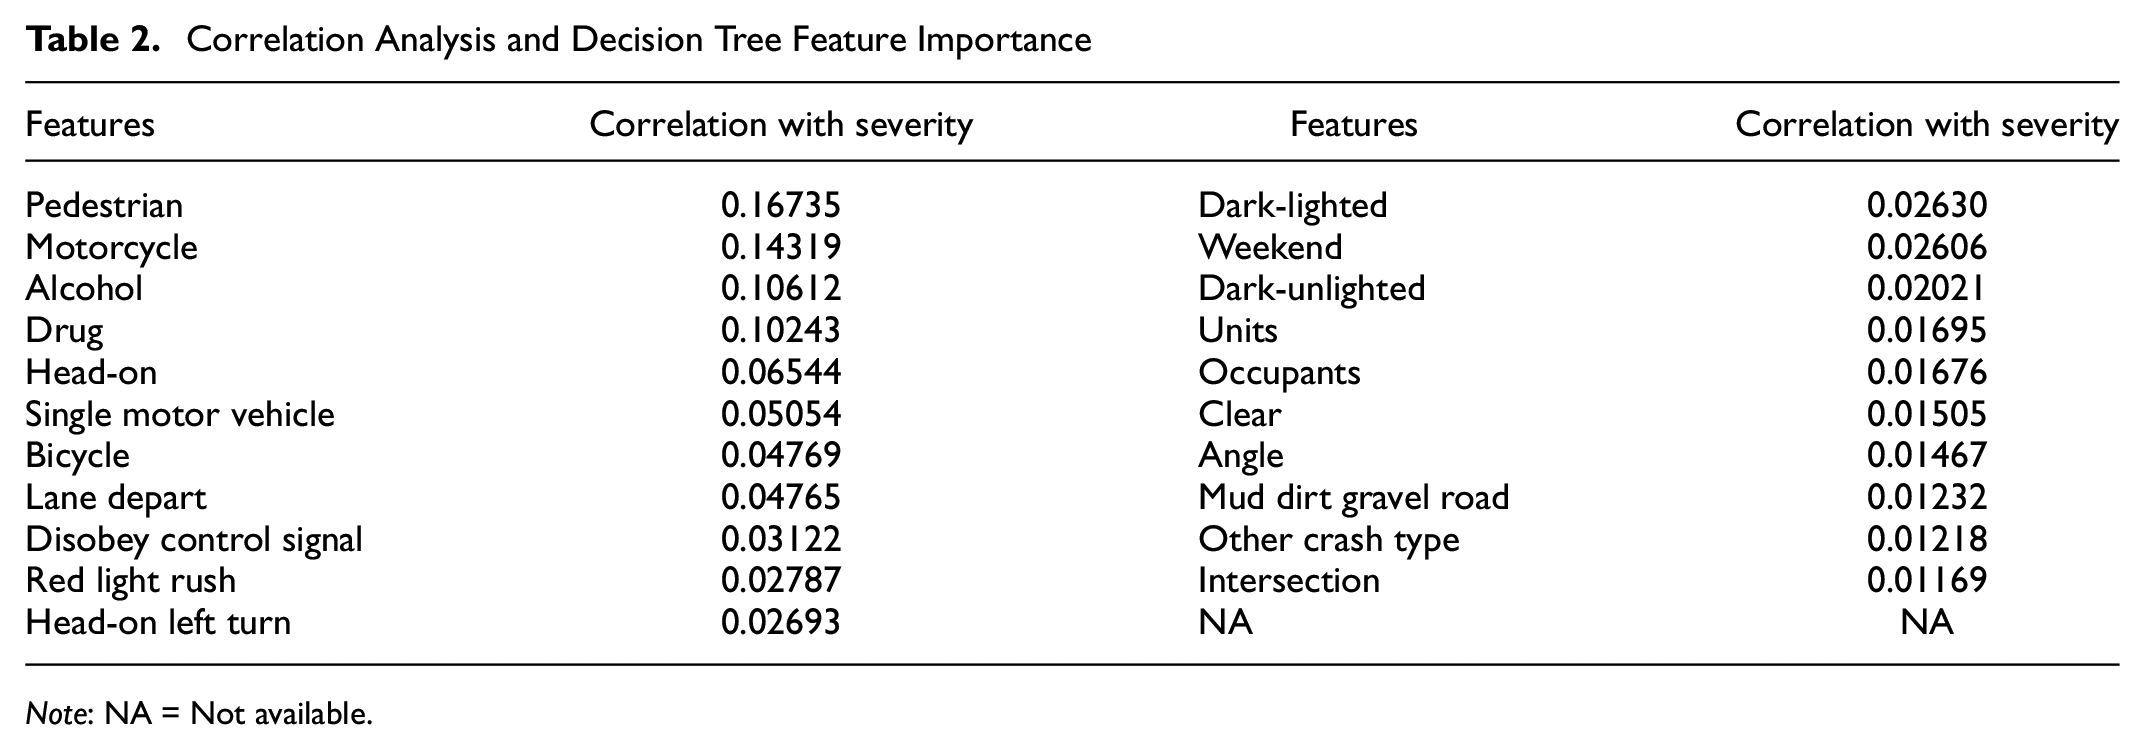
Note: NA = Not available.
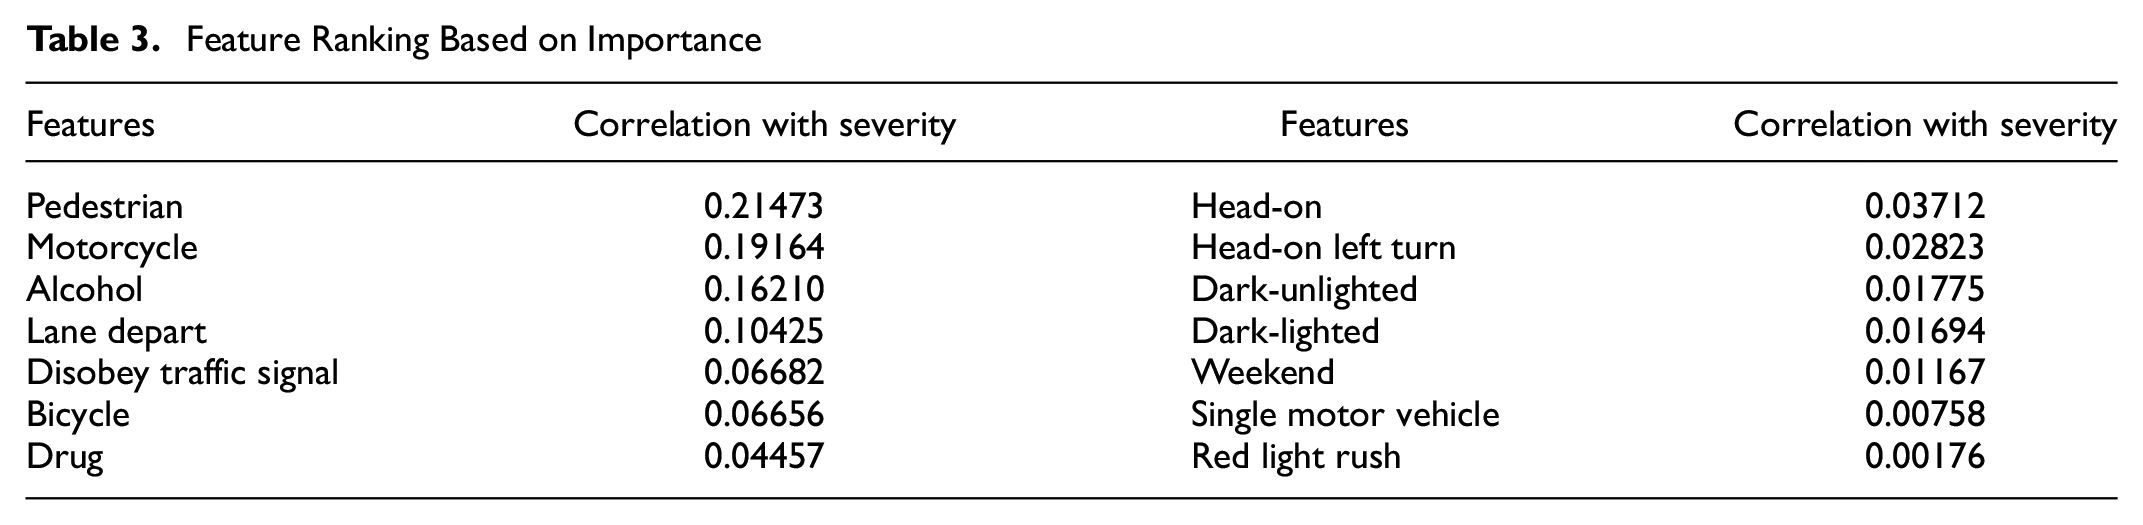
We selected the highlighted features in Table 2 based on their correlation value (>0.02) for further analysis. One observation from the table is that the correlation values are overall quite low (<0.2). We attribute this to the nature of the crash events because each feature will not directly impact crash severity; however, the likelihood of a severe crash may increase. Since the selected features are all binary values, we use a DT classifier to extract the normalized network gain to assess how impactful it is to involve each feature in the classifier. The illustration in Figure 1 shows that the DT first selects the feature split that leads to the largest entropy change at each node: the normalized entropy change is considered as feature importance. These values are computed and extracted with the DT classifier and can indicate a feature’s impact on crash severity. We then use 10 training sets (each 75% of all crash data) chosen randomly to train the DT classifiers and compute the average value of normalized network gains for each parameter as feature importance. Table 3 shows the ranking of features based on their importance: the highlighted features are used as input to train/predict with different machine learning classifiers.
Feature Ranking Based on Importance
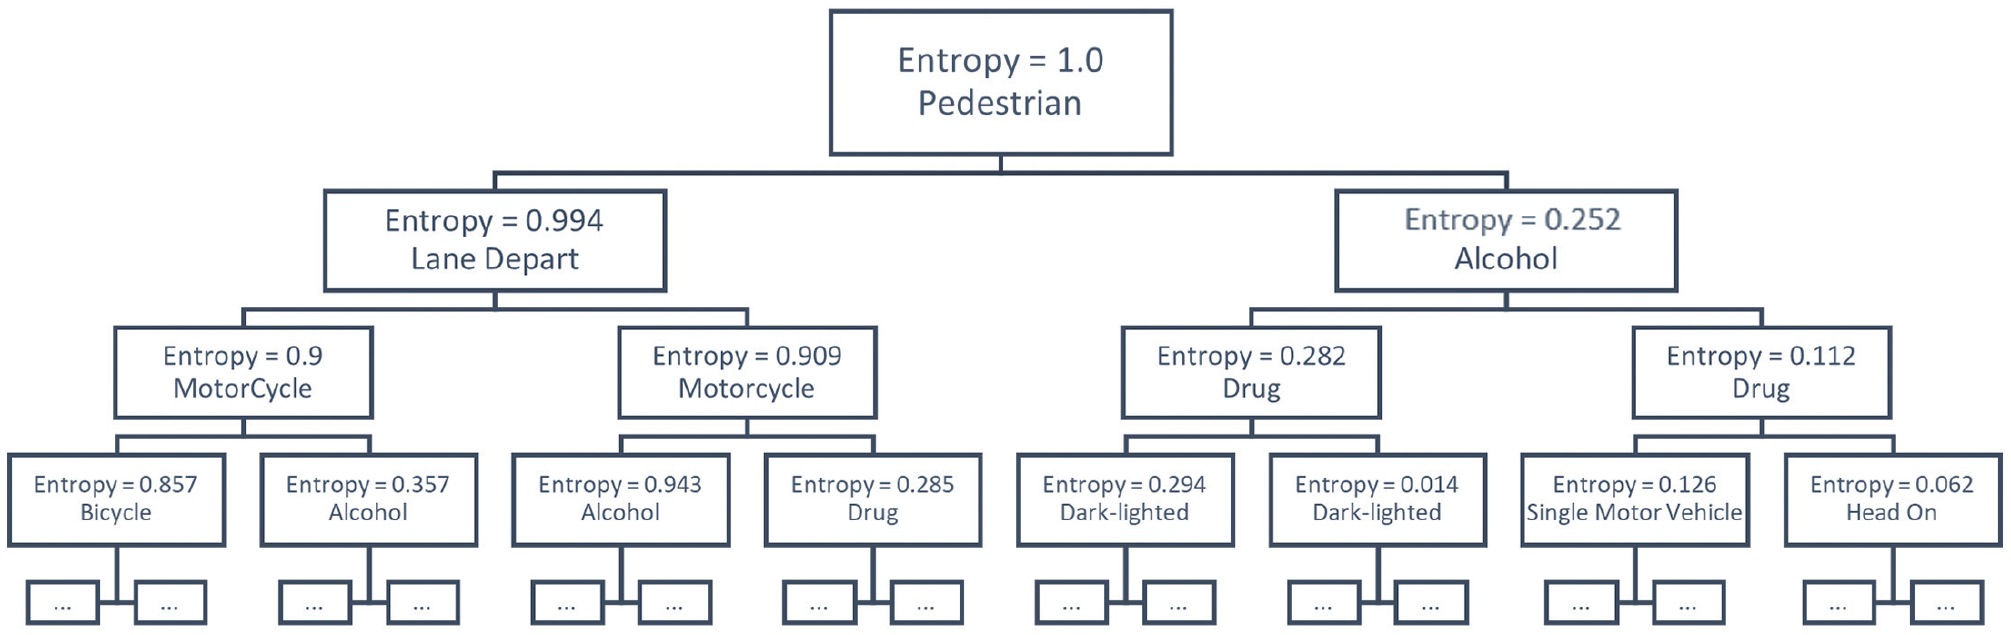
Decision tree model structure.
Spatial Analyses
For additional treatment of data in the analytical process, we conduct a spatial analysis to identify where misclassifications and inconsistencies occur in our analyses relative to the roadway construct. This is important for refining our analyses and making policy recommendations. Observations in the initial results are used to stratify our dataset for further analyses as seen and discussed in next section.
Results and Discussion
Balancing the Biased Data
Because of the nature of traffic crashes, most data collected are non-severe: out of 6,86,847 crash data collected through 2013 to 2017, only 10,378 is classified as severe, which is 1.51% of the dataset. It indicates that any classifier that would label all crashes to be non-severe will reach over 98% overall accuracy. The result would be heavily biased toward the non-severe class, and such performance is not desired. This study tries to peruse a balanced performance for accuracy in predicting both severe and non-severe crashes. Thus, it uses a weight balancing technique that oversamples the small size class by duplicating the severe crash samples to increase the cost of wrongly predicting these crashes until both classes have a similar number of samples (balanced weight) for the classifier. This method can improve the accuracy of predicting a rare-occurring event (severe crash in this case) for machine learning problems ( 18 ). In the literature, some other approaches, such as cost-sensitive learning, tie the cost of the wrong prediction to the cost of a crash at that severity level, which can achieve a similar effect ( 10 ). The drawback of such approaches is that they may reduce the overall prediction accuracy for all samples, which can be expected as the distribution of each class in the training data is changed.
Classifier Training and Validation
Cross-validation was run to test the performance of each machine learning algorithm with their accuracy at each severity class. The classifiers’ parameters are calibrated for better performance. The average accuracy of 10 cross-validation scenarios is used to compare between different classifiers.
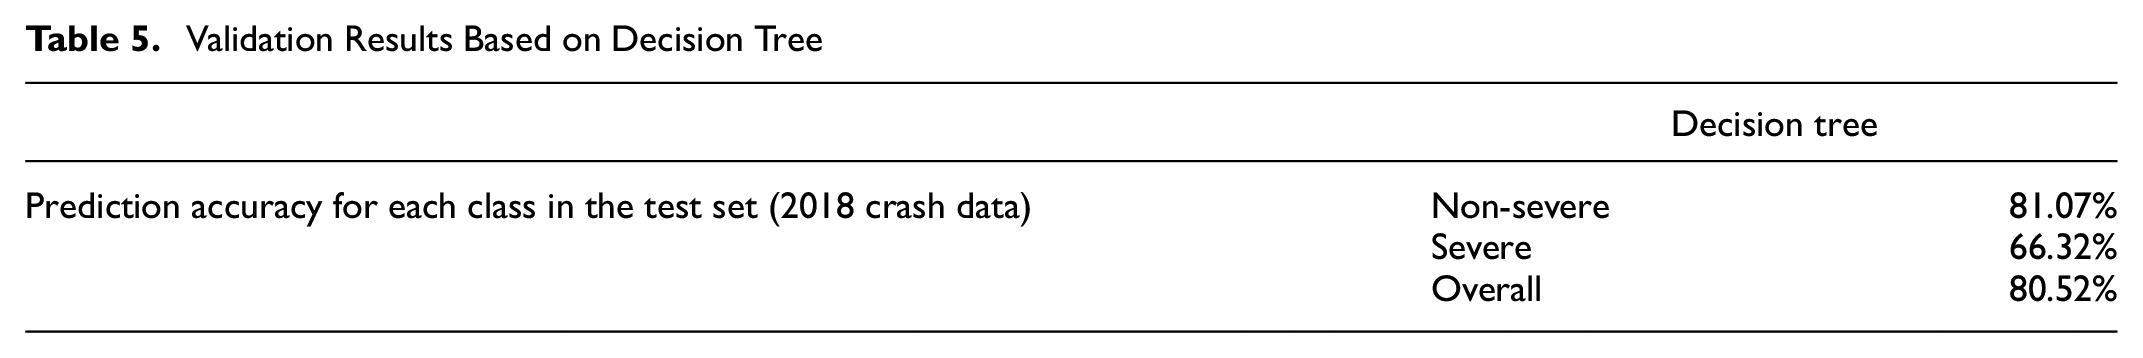
The results as observed in Table 4 show that all six classifiers provide varied prediction accuracies for severe and non-severe cases. Based on the results, DT, RF, and ANN are the preferred classifiers as the accuracy for each class is more balanced, with approximately 78% accuracy rates for validation sets with non-severe and severe crashes with f1 score of 0.78. Even though SVM, KNN, and LR produced higher accuracies of about 86% for non-severe crashes, the false predictions for severe crashes are more frequent, especially for KNN. Considering the trade-off between model accuracy and computational time, we observed that the DT classifier runs the fastest compared to RF and ANN, while all three have similar accuracy. The impressive performance of the DT, RF, and ANN can be attributed to the selected features for classifications all being binary variables, which fits well with the tree like structure and the neural network structure. The DT classifier is trained with SEMCOG crash data from 2013 to 2017 and used to predict the severity of the 2018 crash data for the SEMCOG region. The accuracy for non-severe crashes is 81.07% and for severe crashes is 66.32% as is shown it Table 5. The test accuracy is reasonably close to the validation results, which indicates that the pattern of crash severity is relatively consistent over the years. Compared to the existing literature, these results gives a similar performance for overall accuracy (70%∼90% in reviewed literature), yet a superior prediction accuracy for severe crashes (10%∼35%), ( 7 , 8 ). Note that the reviewed literature classifies the severity into 3∼5 different levels. This study simplifies it and combine them into two levels (severe or non-severe), which may also contribute to the improved result.
Prediction Accuracy Based on Machine Learning Models
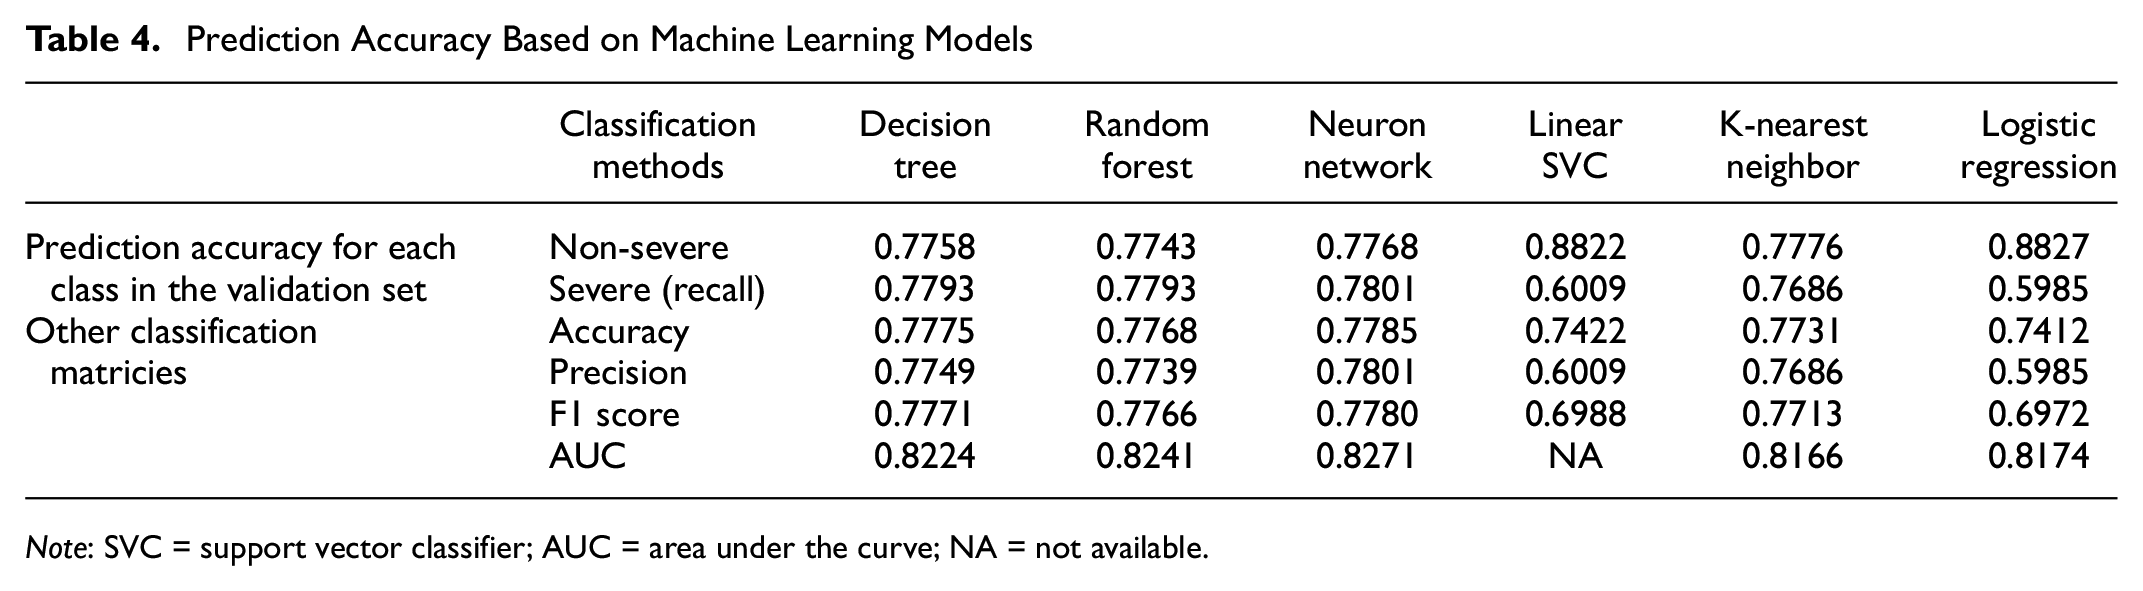
Note: SVC = support vector classifier; AUC = area under the curve; NA = not available.
Validation Results Based on Decision Tree
Spatial Analyses
In addition, we analyze the relationship between crash location and its prediction accuracy. The figures below indicate a section of the roadway network east of Detroit. Here we highlighted the observed crash data points by injury severity in Figure 2a and the predicted data in Figure 2b. These figures identify no-injury crashes by a green point layer and severe-injury crashes by red. While most crashes are accurately predicted, some no-injury crashes are wrongly predicted as severe. This is expected because of the disproportional frequency, denoted with a red point layer in Figure 2c. Even though we identified some falsely predicted crashes clustered at certain intersections, the overall prediction accuracy was impressive as previously discussed. The general observations we made in regard to higher clustering of crashes at or close to intersections are not atypical; however, visualizing the data allowed us to identify areas where most wrong predictions occurred. The locations of inaccurate predictions were predominant at intersections, and this informed further analyses to investigate how we can improve predictions by considering intersections and non-intersections distinctly.
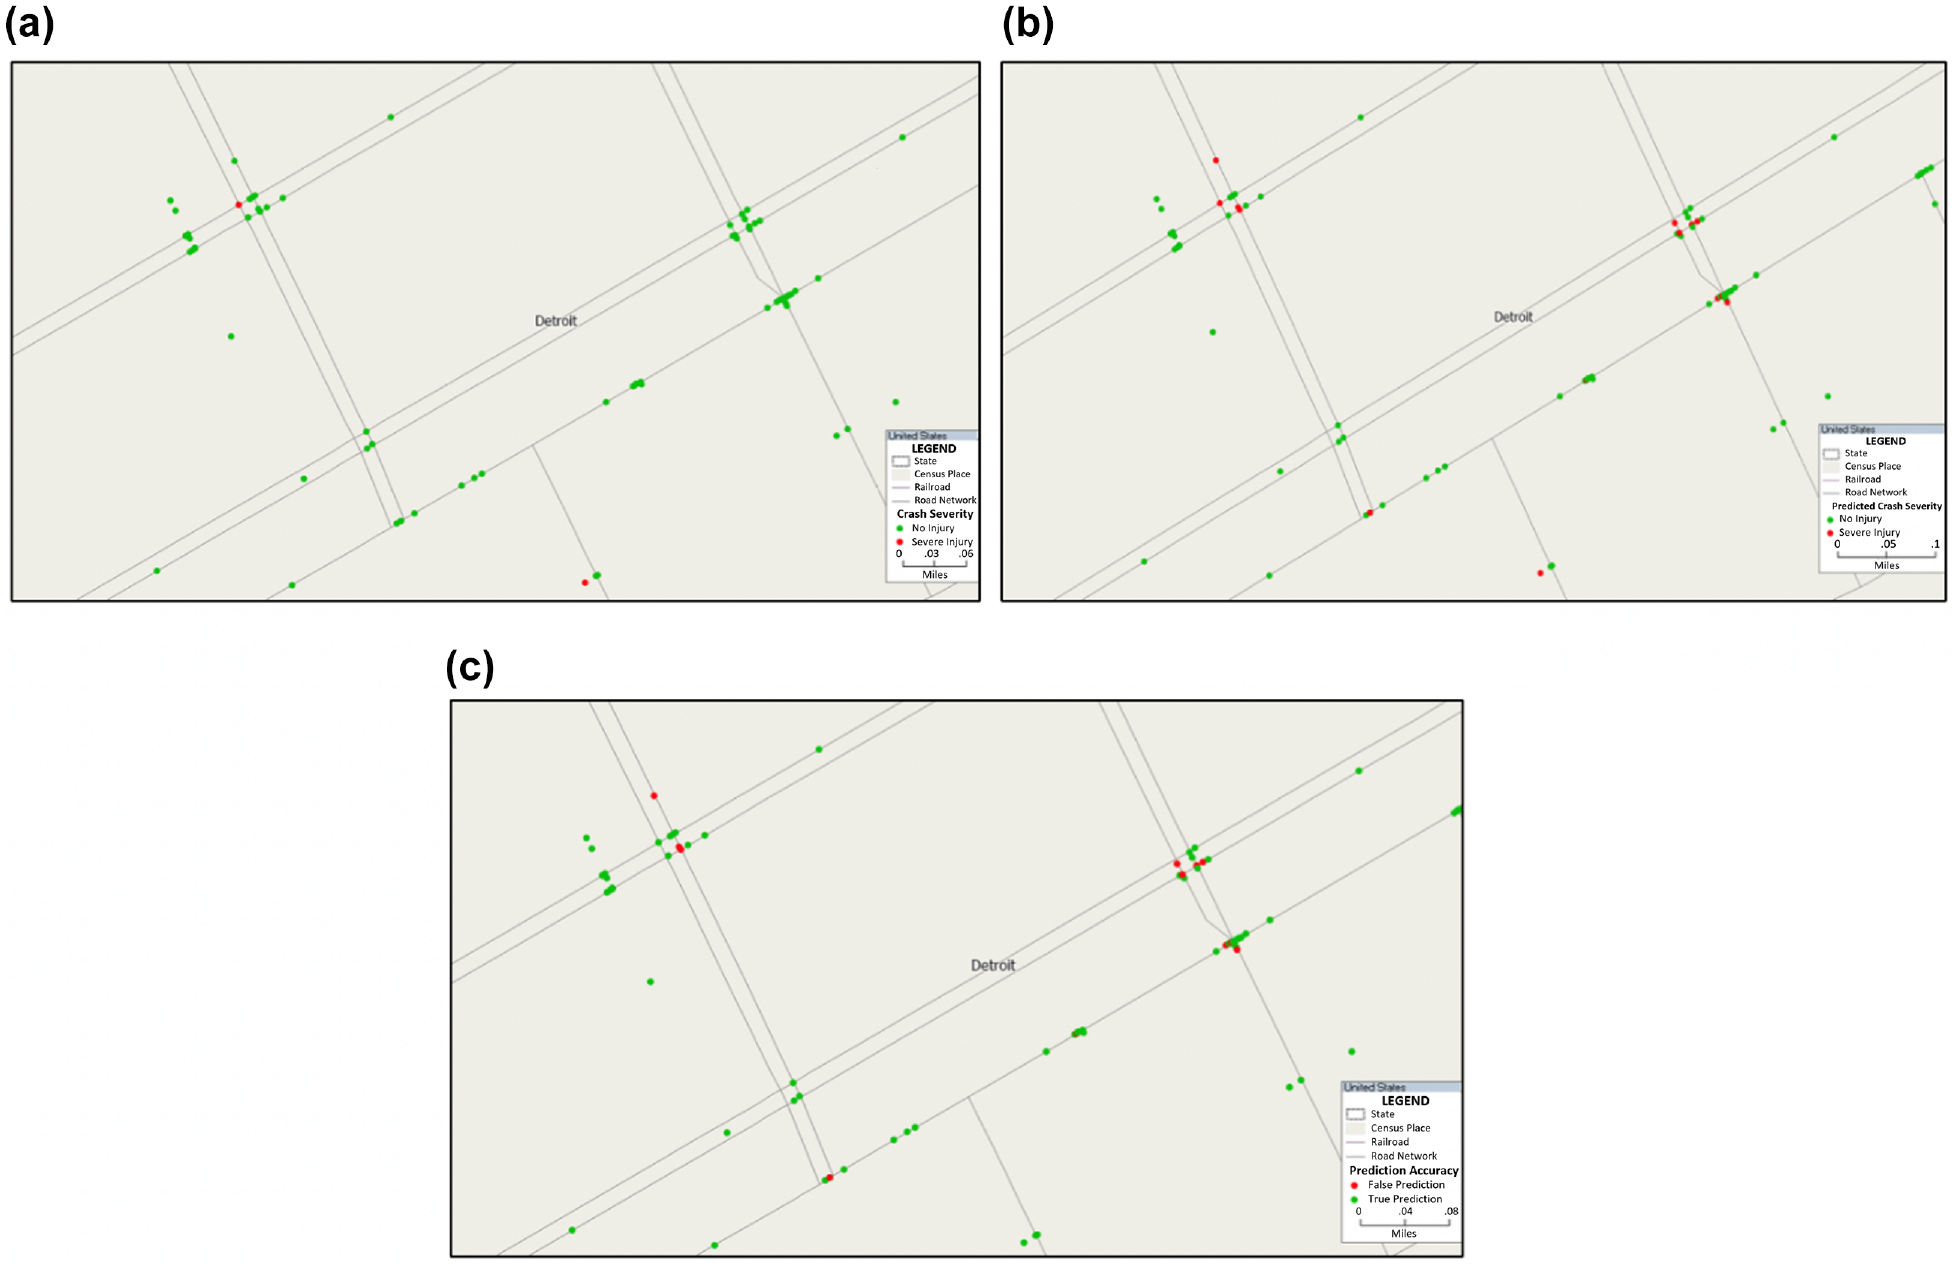
Map showing crash locations for: (a) recorded crashes, (b) predicted crashed using the decision tree, and (c) accuracy of predicted crashes.
This finding reveals that the current approach does not suffice to spur policy decisions. Consequently, we identified patterns in the DT analyses, pedestrian, motorcycle, and alcohol involvements as the highest determinants of crash severity predictions in decreasing order of importance. Taking an in-depth look at pedestrian crash patterns (Figure 3a), we observed clustering of severe-injury related crashes along major arterials and highways. High-speed vehicles on these roadways would cause severe injuries to pedestrians in most cases. Additionally, most major roadways do not have the requisite infrastructure for pedestrian mobility, increasing pedestrian risk to crash-related injuries. When considering denser city centers such as downtown Detroit and Ann Arbor, indicated in Figure 3, b and c , respectively, we noticed that pedestrian-related crashes are more clustered at intersections—however, with fewer records of severe injuries. We attribute this to slower-moving vehicles in those areas. Additionally, pedestrian injury severity tends to increase closer to major arterials and other suburban regions. These trends are consistent in both Ann Arbor and Detroit geographic areas.
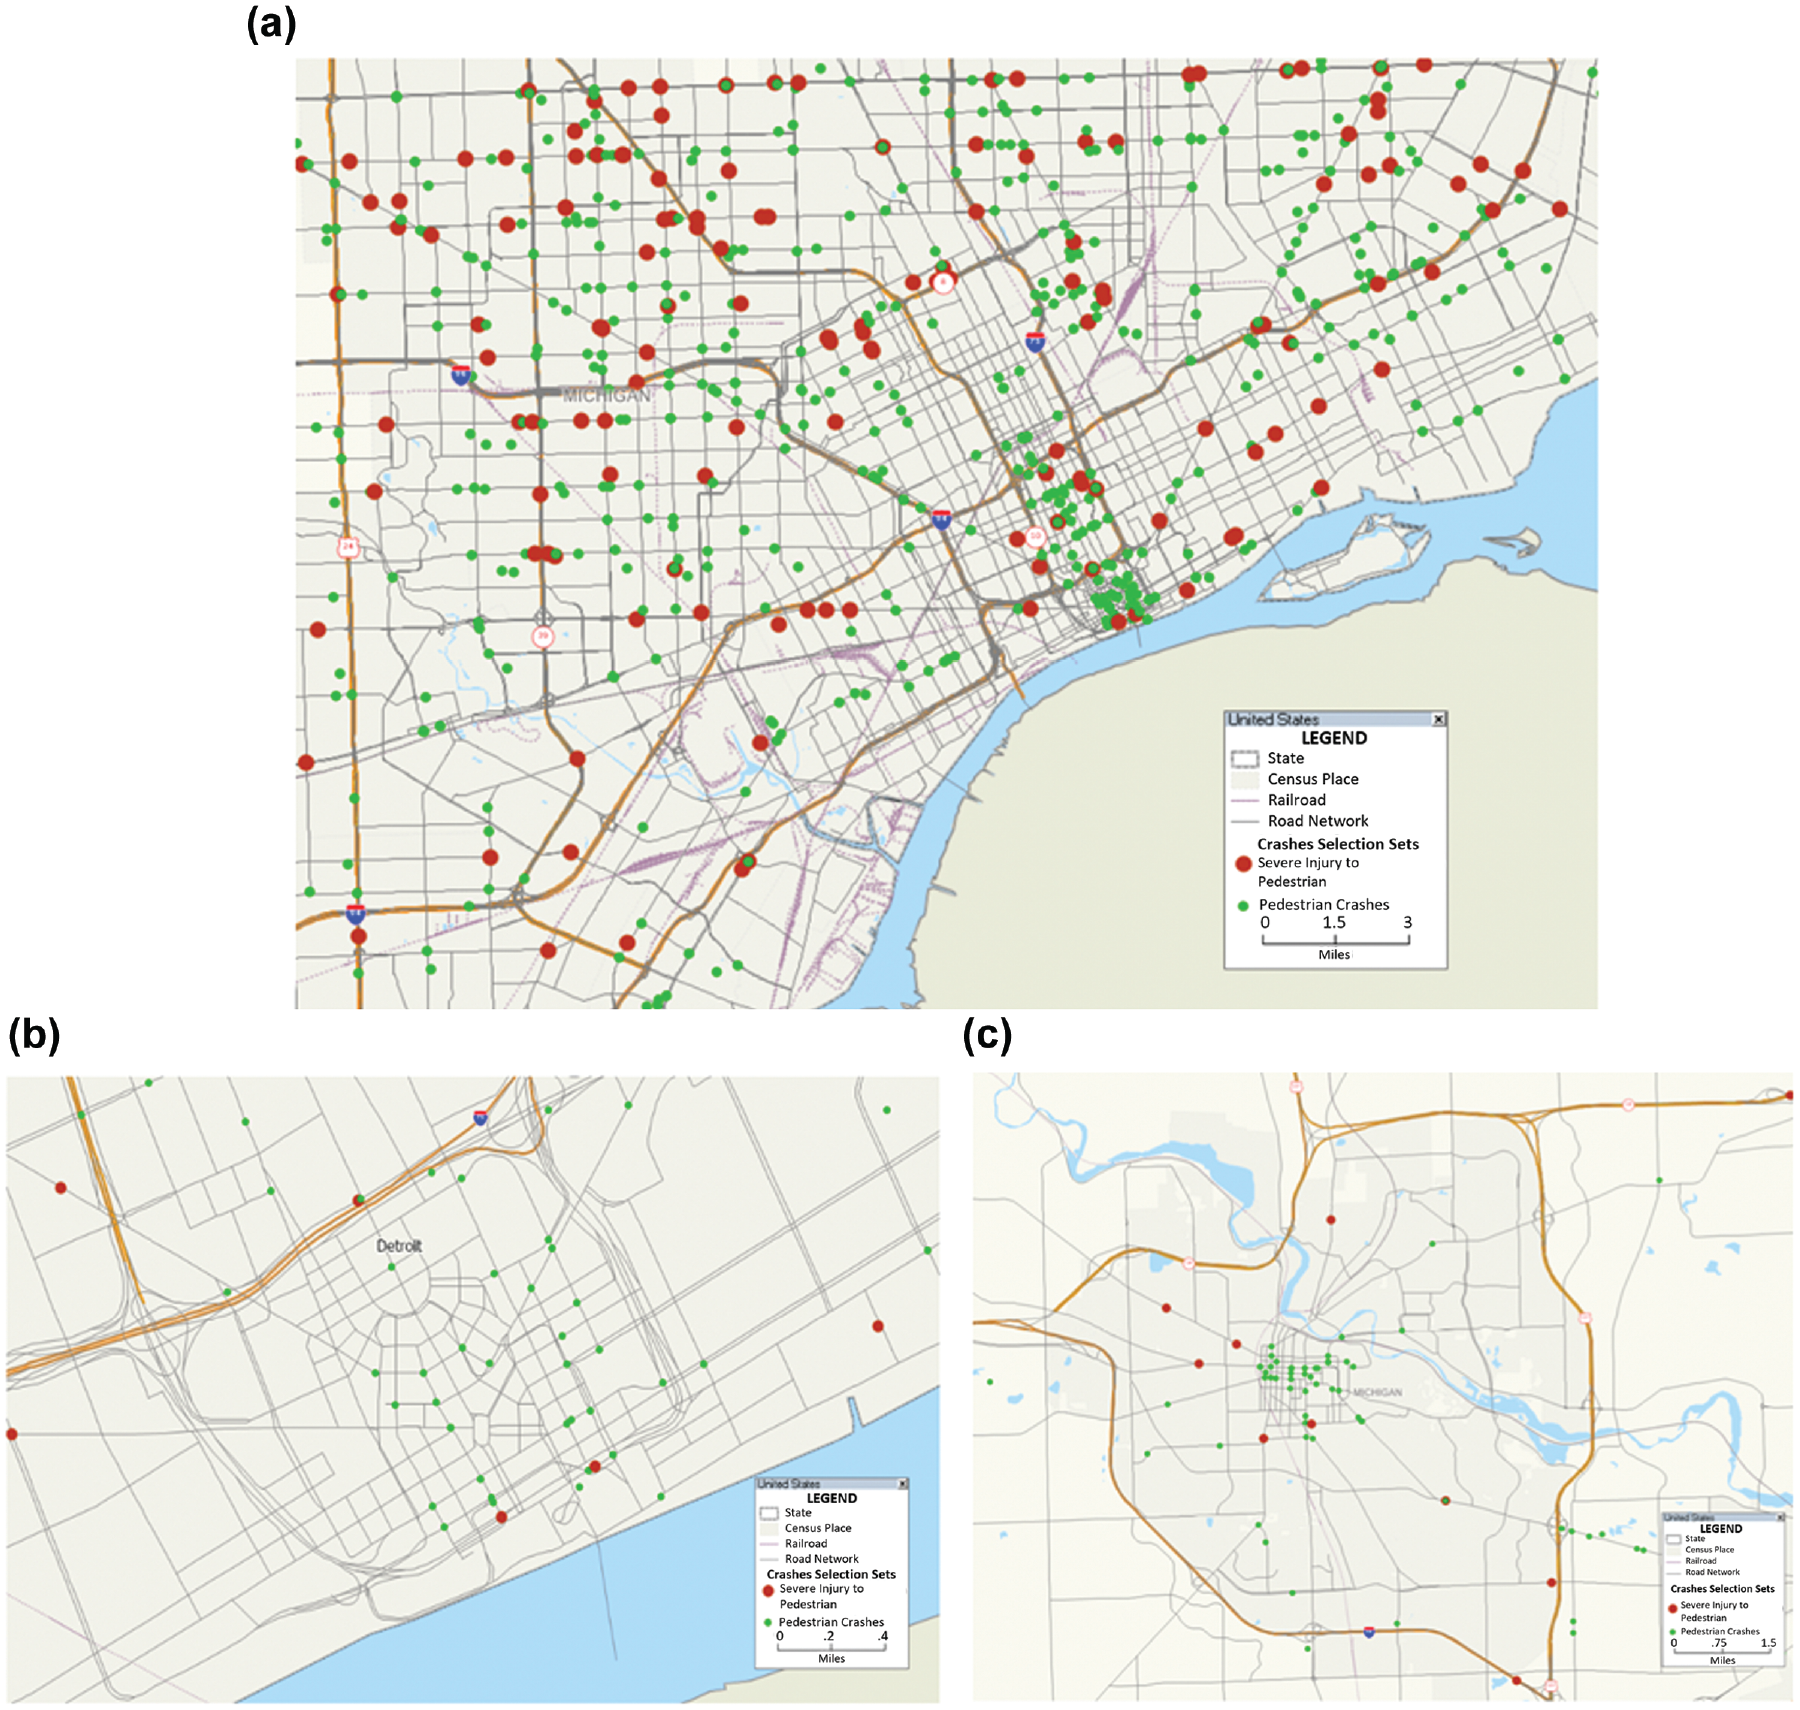
Maps showing the location of pedestrian crashes by severity in: (a) Wayne County, Michigan, (b) Downtown Detroit, and (c) City of Ann Arbor.
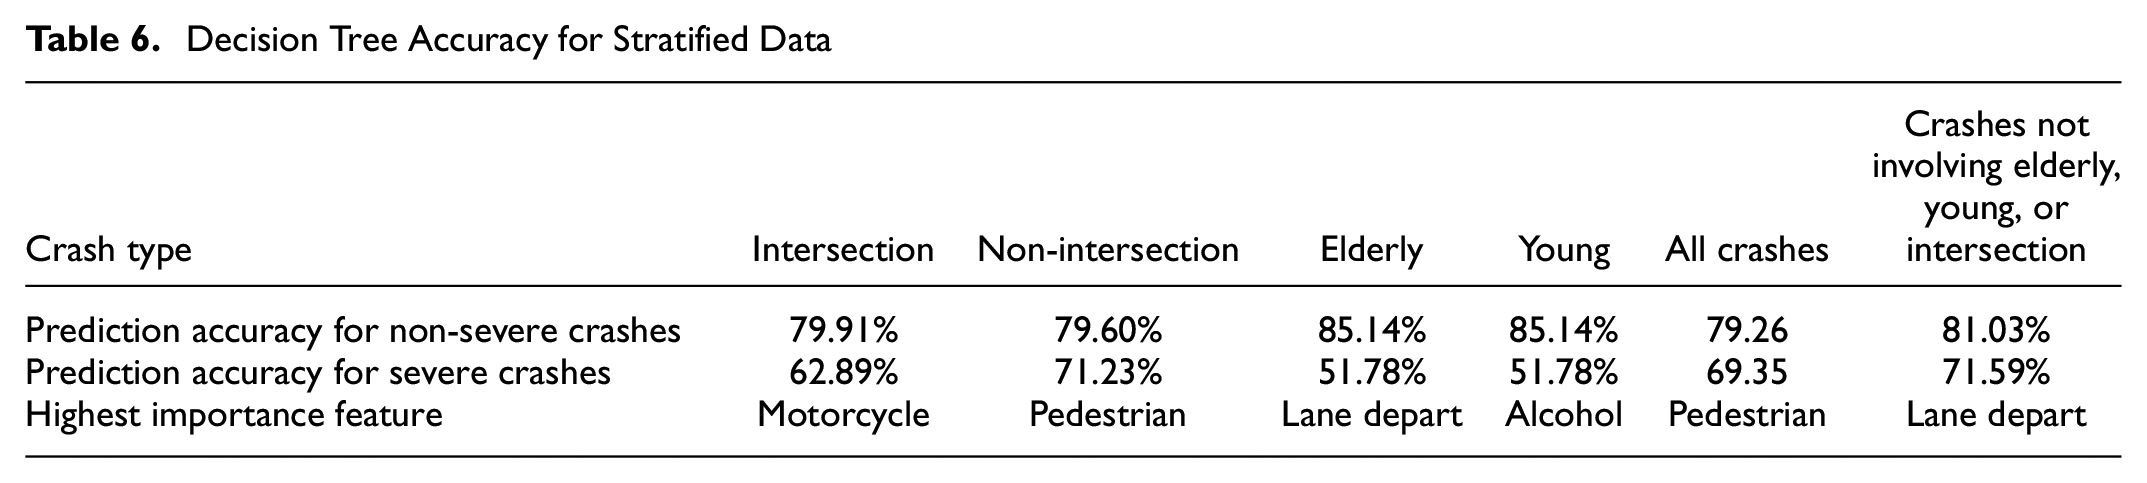
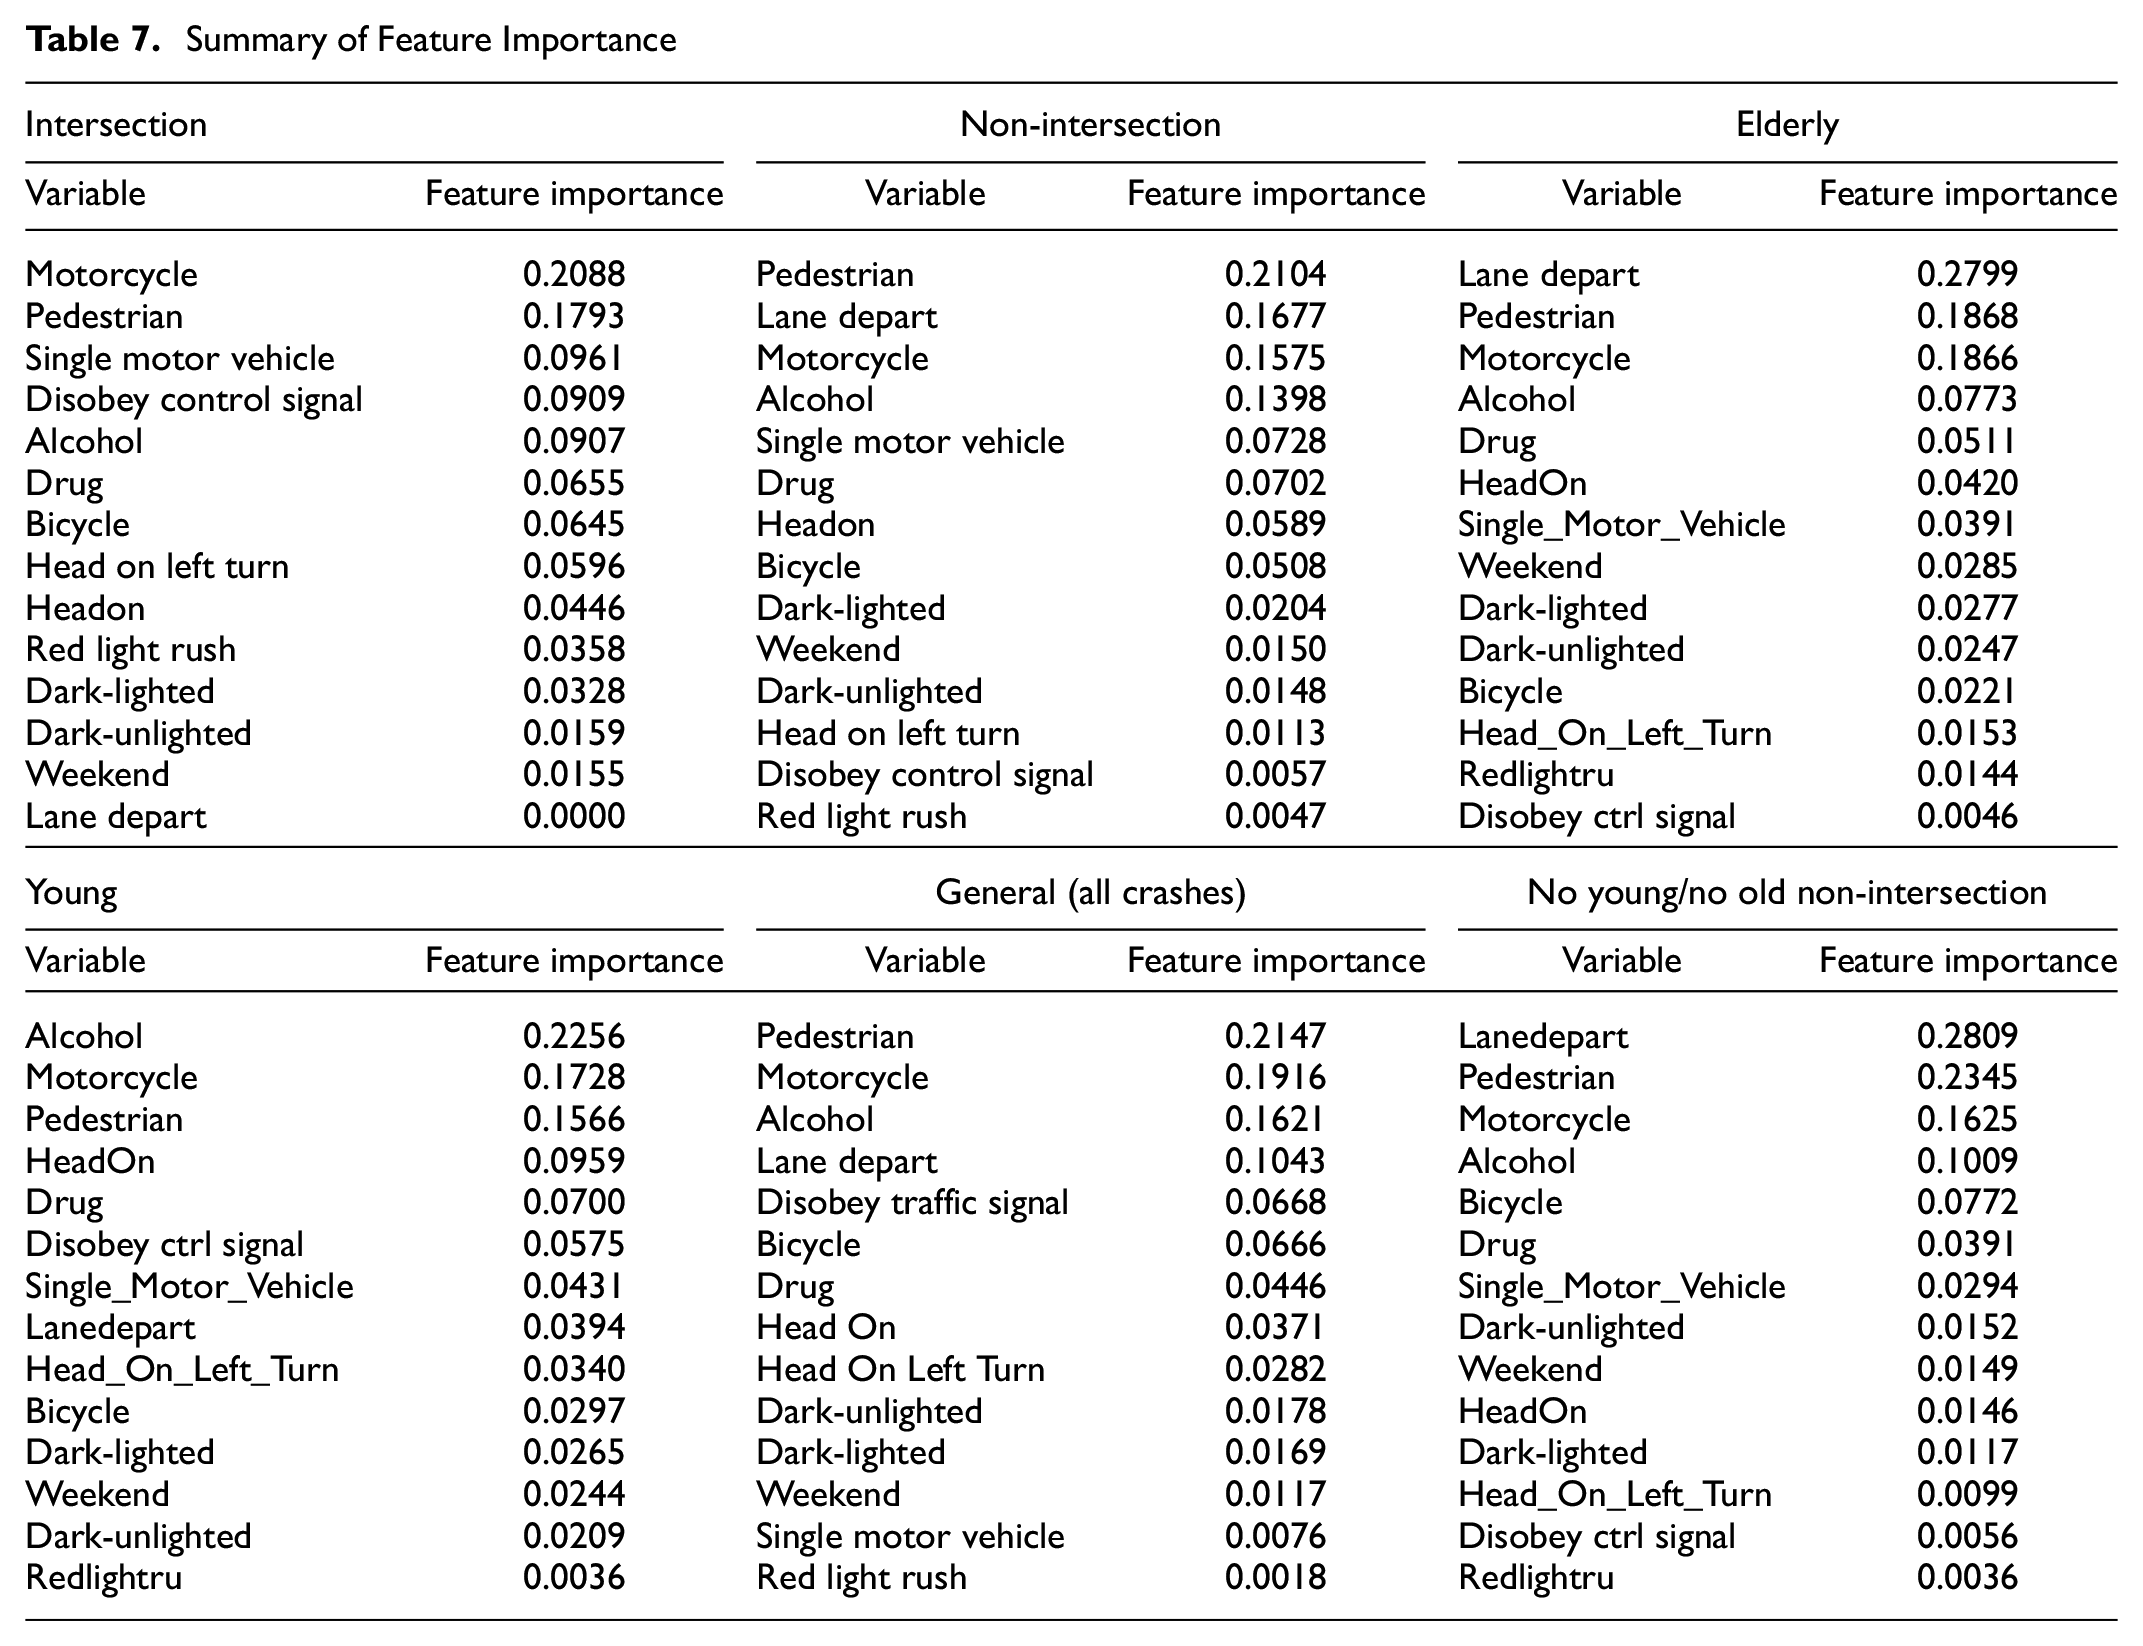
To improve crash prediction accuracies, we stratify the data by considering crashes that occur at intersections distinctly from those that occur on other roadways. We then applied the DT classifier to the data strata. Results for non-intersection crashes show significantly improved prediction accuracies for severe injuries, with further improvements seen when using different cohorts as reported in Table 6. For example, we observe that prediction accuracies are improved when applying a DT classifier to a cohort of crashes involving people between 20 and 60 years at a non-intersection area. Conversely, we observe relatively lower accuracies when predicting severe injuries at intersections. Improving prediction accuracies at intersections will require more rigorous studies by leveraging additional data because of the variance in the causations of intersection-related crashes. In further analyses, we noticed that the order of high-importance features predicted alternate with each data strata. For instance, the variable of highest importance for severity prediction at intersections only is motorcycle, while that for non-intersection is pedestrians. This finding echoes the previous discussions on pedestrian crashes. Similar observations are made for tests for crashes involving young drivers only and elderly drivers only (not stratified by roadway location): the prediction accuracies for severe crashes are less accurate (see Table 6). Complete results for feature importance for data strata in Table 6 are reported in Table 7.
Decision Tree Accuracy for Stratified Data
Summary of Feature Importance
As alluded to, analysis of important features in crash severity prediction indicated that pedestrian crashes were predominant at non-intersections arears, while motorcycles affect crash severity at intersections. Indeed, a significant finding of the present study is to highlight the importance of complementing spatial data analysis with machine learning models to achieve a better understanding of the nature of traffic crashes as well as the determinant variables in different crash types/locations. Reviewing the results of variable importance analysis for different crash types/locations in previous studies further supports this idea.
Mafi et al. ( 10 ), for example, followed a similar approach to identify key determinants of driver injury severity at signalized intersections across different age/gender group combinations. While some factors, like area type and median width, were important in all driver groups, authors discovered substantial differences in injury severity determinants for different driver cohorts. Zhang et al. ( 7 ) also adopted a linear sensitivity analysis approach to investigate important variables affecting the overall crash severity in freeway diverge areas. While the number of lanes, ramp length, and land type were found to be the most important variables according to the proposed statistical models, large differences were observed in the way these variables affect the prediction accuracy of the adopted machine learning models.
The key takeaways from the above discussion is that predicting crash severity needs a deep analysis of the environment and the associated geographic region to extract primary determinants of crash severity at each location. In addition, special attention should be paid to analyzing determinant factors when working with machine models. Different machine learning models use distinct mechanisms to explore inherent patterns in datasets and this can, in turn, lead to assigning different importance values for same model variables.
Conclusions
The role of Southeast Michigan as a hub for mobility research now and in the coming years makes this an area of prime interest for socio-economic development and growth. With such change comes an increase in commuting trips and traffic flows on our roadways. This is an area of concern since the increase in congestion and vehicle miles traveled tends to correlate positively with traffic crashes. For this reason, the present study addresses traffic safety issues by undertaking a rigorous crash analysis for Southeast Michigan. This work presents one of the first studies to apply such methods to this important area experiencing rapid industrial and technological resurgence.
More specifically, we predict the severity of crash-related injuries for the Southeast Michigan region using machine learning methods by complementing the predictive modeling with GIS spatial observations. Results indicate that while all models have similar performance in predicting crash severity, DT and RF estimates provide the best predictions with DT preferred because of the computational ease and accuracy. Combining the machine learning methods with GIS analyses revealed crash patterns to be useful in guiding streamlined model executions for intersections and non-intersections distinctly. In this paper, we observed that pedestrian crashes are clustered at non-intersection locations and are the primary determinant of crash severity at those locations.
The results were promising as non-intersection-only analyses showed improved accuracy while intersection-only analyses provided worse predictions. The important features in the models also changed as pedestrian crashes were predominant at non-intersections while motorcycles affect crash severity at intersections. The results in this study echo the importance of machine learning models in crash severity prediction and highlight that when complemented with GIS spatial analysis, methods can be refined to better comprehend observed patterns. One limitation of the study is that the crash data origin from police reports lacks detailed traffic operation and road geometry data such as curvature and traffic control signal, which may also impact crash type and severity. We recommend further studies to incorporate more data and improve model predictions, and we recommend that measures be enacted to protect pedestrians, motorcyclists, and the elderly significantly affected by crashes in the SEMCOG region.
Footnotes
Acknowledgements
The Ford Robotics and Mobility Research team would like to acknowledge SEMCOG officials for making their data available to us for research purposes.
Author Contributions
The authors confirm contribution to the paper as follows: study conception and design: X. Cai, R. Twumasi-Boakye, Y. Rahmati, S. Jain, J. Fishelson; data collection: X. Cai, S. Jain; analysis and interpretation of results: X. Cain, R. Twumasi-Boakye, Y. Rahmati; draft manuscript preparation: X. Cain, R. Twumasi-Boakye, Y. Rahmati, J. Fishelson. All authors reviewed the results and approved the final version of the manuscript.
Declaration of Conflicting Interests
The author(s) declared no potential conflicts of interest with respect to the research, authorship, and/or publication of this article.
Funding
The author(s) received no financial support for the research, authorship, and/or publication of this article.