
Abstract
The goal of Complete Streets is to accommodate all road users and draw attention to the needs of those who are vulnerable. In the last 10 years, thousands of local/regional/state agencies in the U.S.A. have adopted Complete Streets policies. However, it is not clear how successfully these policies have been implemented and to what extent agencies have achieved related policy goals. Responding to the call from Louisiana, the research team reviewed the state’s practices and projects over 10 years to evaluate whether/how the state transportation agency has made progress toward the adopted policy goals. Based on the practice review results, much progress has been made compared with where the state started in 2010. However, shifting agency culture to balance multimodal needs is a long-term process. Continuous effort is needed to train and educate staff in both the state agency and local governments. Based on the project review results, improving the state’s project management system could facilitate periodic performance reviews on a more frequent basis. From the perspective of influencing the built environment, more attention should be given to preservation projects to improve routine integration of low-cost safety measures and support decision-making on roadway reconfiguration needs. Although the review was conducted for Louisiana specifically, the review procedure and recommendations may be applicable to other states and government agencies facing challenges in Complete Streets policy implementation.
Keywords
Complete Streets are streets for everyone, no matter who they are (regardless of age, ability, race, or income level) or how they travel (whether driving, taking transit, cycling, or walking) ( 1 ). The purpose is to provide all users with safe, convenient, and comfortable access through their transportation system. Over 1,500 agencies at the local, regional, and state levels have adopted Complete Streets policies in the U.S.A. in the last 10 years ( 2 ). However, we know relatively little about how successfully these policies have been implemented and whether agencies have achieved their policy goals. An evaluation of the effects of the Complete Streets policy (hereafter, “the Policy”) on agency processes and built environment outcomes is needed.
A growing number of state departments of transportation (DOTs) have formally adopted Complete Streets policies, reflecting a shift toward a multimodal approach to accommodating all users and all modes on the public right-of-way ( 2 ). State leadership has been identified as a leading factor in local policy diffusion and more widespread acceptance of Complete Streets principles in local communities ( 3 ). Although in most states, the majority of the public roadway mileage is locally owned and controlled, state routes represent key connections in both urban and rural communities. Nationally, nearly one-fifth of total road mileage is state owned ( 5 ). In cities, state highways often double as critical multifunctional arterials that connect neighborhoods and link residential areas to key civic and commercial centers. Historic small town main streets are also frequently state routes, for which design has often been found to favor highway traffic flow objectives over local access and community functions ( 4 ). In addition to roadways that are directly controlled, state DOTs play a critical leadership role in establishing the state’s transportation vision and priorities, including funding decision-making, design guidance, and an overall policy agenda that, in turn, can significantly influence local agencies and Metropolitan Planning Organizations (MPOs). This includes choosing which projects to approve among those submitted for consideration for a variety of competitive funding opportunities (many of which, particularly those focused on pedestrian and bicycle accommodation, may be applied to locally owned roadways), administering both the Local Technical Assistance Program and the Local Road Safety Program, providing design guidance through district administrators who work directly with local agencies, and providing training and technical assistance to local practitioners ( 5 ). State policies with regard to pedestrian and bicycle accommodation and design can, therefore, serve as guidance for local jurisdictions lacking established policies and/or design guidelines of their own or, conversely, can serve as barriers to implementation of local priorities in cases in which key local network connections are constrained by rigid state highway design rules ( 6 ). State leadership in relation to the Policy is a critical step toward facilitating interagency alignment and fostering flexibility and context-sensitive design that meets the (often competing) needs of stakeholders. Therefore, evaluating the implementation of the Policy at the state level will help state DOTs identify implementation challenges and potential improvements.
This study reviewed the way in which the Policy had been implemented by the Louisiana Department of Transportation and Development (DOTD) specifically. With theoretical guidance, the evaluation procedure and recommendations are expected to be applicable to other states and government agencies facing challenges in implementation. The paper consists of four sections. The first section reviews policy evaluation theory and practice in general. The same section also reviews implementation of the Policy, measurement, and evaluation in relation to current practice. Next, a summary of the changes to Louisiana DOTD’s policies, guidelines, and manuals in the last 10 years is provided to examine the “input” and “activity” components in the policy-monitoring logic model. This evaluation highlights the extent to which the Policy has been operationalized throughout the agency, as well as gaps and points of conflict that may inhibit or complicate effective implementation. Then, the construction project review process is described and major findings are summarized. This project review helps illuminate how updates to policies, guidelines, and manuals were reflected in practice, which responds to the “output” component in the policy-monitoring logic model. The review also informs our understanding of the extent to which the Policy has had an impact on project scoping as well as any persistent barriers to implementation that may limit its efficacy. Finally, the paper concludes with a discussion of what has been achieved, what implementation challenges persist, and what could be done in the future to ensure the Policy is implemented better.
Literature Review
This section first introduces a practical framework used for policy evaluation in general. Based on the general framework, the two subsequent sections discuss how implementation of the Policy in practice addresses the components in the policy-monitoring logic model. The last subsection summarizes gaps in the current practice of evaluating implementation of the Policy.
Policy Evaluation Theory and Practice
Evaluation is considered to be an integral part of policy development ( 7 , 8 ). Broadly, policy analysis may be described as consisting of six basic steps: problem definition; establishment of evaluation criteria; policy alternative identification; policy alternative evaluation; presentation of alternatives; and monitoring of implemented policy ( 9 ). There is a robust literature that outlines a multitude of methods for analyzing and evaluating policy, ranging from basic and pragmatic descriptive analysis to an idealized rational model of researched analysis contingent on significant resources and typically prolonged time horizons ( 9 ).
The public health, education, and environment sectors are perhaps more active than others in undertaking research on policy evaluation. Golden ( 10 ) reviewed the state of the art in education policy evaluation and provided several case studies to illustrate recent evaluation practice in education. Crabb and Leroy ( 11 ) reviewed approaches for conducting environmental policy evaluations. Among the three sectors, the public health sector carries out policy evaluation in practice more routinely ( 12 ). The following paragraphs introduce the policy evaluation framework designed and used by the Centers for Disease Control and Prevention (CDC) in practice ( 13 ).
CDC’s policy evaluation approach is applicable at both the state and local level ( 13 ). In CDC’s framework, there are three main evaluation types that fit different policy development phases as explained below. Evaluating policy content appears in the early phases of policy development: problem identification; policy analysis; and strategy development ( 14 ). When a policy reaches the phase of enactment and implementation, policy implementation evaluation begins and focuses on whether the policy is being implemented as expected ( 14 ). Evaluating the impact of policy takes place during/after policy implementation and considers whether the policy produces short- and long-term outcomes as expected ( 14 ). The current study conducted policy implementation evaluation for a state agency.
In CDC’s framework, policy implementation evaluation focuses on three interrelated perspectives ( 15 ). The first is examining components such as inputs, activities, and outputs in the policy-monitoring logic model ( 15 ). The second perspective is identifying factors that facilitate implementation and barriers to it. The third is evaluating stakeholders’ involvement, for example, their attitude toward the implemented policy and their awareness of it. Continuously engaging stakeholders in policy evaluation is the key to applying evaluation results successfully in practice ( 16 ). The current study adapted this practical framework from CDC to evaluate policy implementation in the transportation sector.
Document review and analysis is a qualitative research method used in collecting data for policy implementation evaluation ( 17 ). Document review helps understand how the implementing agency operates, determine whether policy implementation aligns with stated intent, corroborate statements made by stakeholders, and inform additional evaluation activities such as conducting stakeholder surveys and interviews ( 18 , 19 ). For a transportation agency, document review also helps in examining project development and delivery processes, which is one of the focus areas identified in Smart Growth America’s State Smart Transportation Initiative ( 6 ).
Implementing the Policy in Practice
Adopting policy is only the first step; follow-up actions are required to advance policy implementation ( 20 ). Most states that have adopted Complete Streets policies have identified initial steps to advance policy implementation, such as developing Complete Streets checklists, updating design standards, adjusting agency processes, and identifying performance measures ( 21 – 25 ). Some state agencies have conducted supporting research to identify best practices with implications for policy implementation, such as identifying network priorities, funding enhancements, and integrating Complete Streets into existing projects ( 26 ). Fewer agencies have advanced formalized processes for tracking and reporting process- and outcome-oriented metrics. Even fewer have engaged in comprehensive policy or program evaluation.
Updating design guidelines is widely acknowledged as a critical early step toward implementation. Types of facilities for which new design guidelines may be needed include traffic signals, crosswalk markings, landscape and tree guidelines, bicycle facilities, intersection design, and transit facilities ( 21 , 22 , 27 , 28 ). The development of a statewide pedestrian and/or bicycle plan also serves as an important guide for project identification and scoping and, in addition, may provide established implementation goals ( 29 ). Updating project funding evaluation criteria is a third key factor in integrating the concept of Complete Streets into state processes ( 22 , 29 , 30 ). Finally, a critical element of policy implementation is training, both within state DOTs and among local/regional partner agencies. The purpose of training is to ensure practitioners and decision-makers are versed in new design guidelines, policy goals, and agency procedures ( 22 , 23 , 31 ).
McCann and Rynne ( 31 ) outlined best practices in policy development adoption at various scales of governance through a series of case studies of early policy adopters, including Virginia’s DOT, which adopted a statewide pedestrian and bicycle accommodation policy in 2004. They observed that to succeed, policies must be institutionalized into planning and development processes, from comprehensive planning to minor street resurfacing projects. To illustrate this need, they included the Virginia DOT’s and Pennsylvania DOT’s accommodation checklists and decision trees as examples of implementation tools for state decision-making. In addition, they highlighted the need for training in policy application and identification of performance measures. They also noted that evaluating the impact on vulnerable road users often requires new data, metrics, or methods. Similarly, pedestrian and bicycle planning guidance issued by the Federal Highway Administration (FHWA) to state DOTs ( 32 ) addresses the relationship between statewide bicycle/pedestrian plans and policy (including Complete Streets), institutional processes, and performance measurement, highlighting the need to examine state DOT project development processes as a key step toward understanding barriers to supporting active transportation and opportunities available.
Complete Streets Performance Metrics
Performance measures are widely used in gauging the highway practices of state DOTs ( 33 ). Agencies measure performance through a combination of inputs, outputs, and outcomes. Input metrics (e.g., agency resources dedicated to implementation) are most easily measured, followed by outputs (e.g., miles of new facilities completed) ( 34 ). Outcomes are more challenging to measure and, therefore, less likely to be reported, but are the most likely to link directly to goals adopted by agencies ( 31 , 34 ). In some cases, principles for developing effective performance metrics have been identified, but specific indicators that agencies should adopt are not listed ( 21 , 31 ). This section introduces typical output and outcome measures.
Output Measures
Outputs are the features of Complete Streets projects that distinguish them from other public works. Counting the number of relevant projects is a prevalent measure in practice. Although the measure is relatively simpler than tracking facility characteristics and necessary contexts, it at least raises the awareness of agencies and the public with regard to the progress made in practice. Determining what outputs to measure was also considered an important step before understanding and evaluating outcomes ( 35 ). Complete Streets facilities appear in three of the six Model Inventory of Roadway Elements (MIRE) categories: segment; intersection/junction; intersection leg; interchange/ramp; horizontal curve; and vertical grade ( 36 ). MIRE is a guideline developed by FHWA in 2013 to help transportation agencies improve the quality and utility of roadway and traffic data for planning and performance measurement. Table 1 is a list of Complete Streets facilities mentioned in MIRE. FHWA’s most recent report in 2022 notes that pedestrian, bicycle, and transit infrastructure characteristics are incomplete in MIRE; the next edition of MIRE should be updated to support a consistent inventory ( 37 ).
Complete Streets Facilities as MIRE Elements
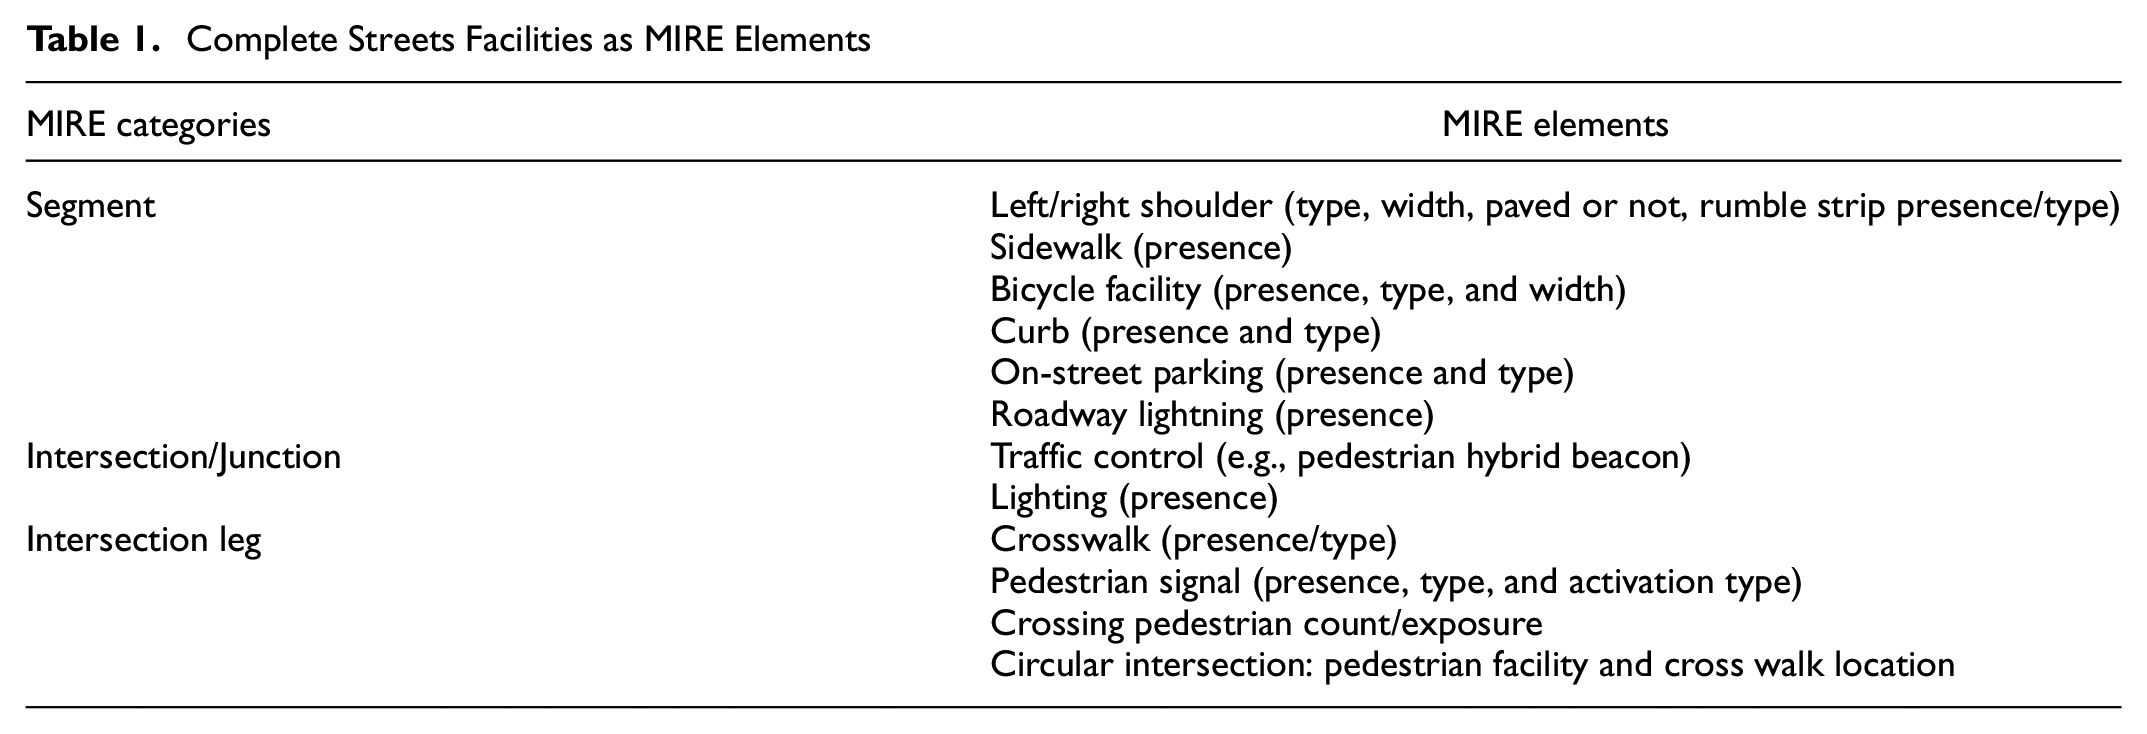
Urban street design guides typically include more elements ( 38 ). The National Association of City Transport Officials’Urban Street Design Guide also mentions curb extensions, vertical speed control elements (e.g., speed humps), transit streets (e.g., bus lanes and stops), and stormwater management (e.g., pervious strips and pavement) ( 38 ). The New York City Department of Transportation mentions even more elements in its street design manual: furniture (refers to bicycle share stations, city benches, etc.) and landscape (refers to tree beds, sidewalk plantings, etc.) ( 39 ).
In fact, Complete Streets outputs are collected less frequently and comprehensively across an entire transportation network than some other roadway infrastructure ( 40 ). For example, Highway Performance Monitoring System data (a database that includes information on operating characteristics, condition, performance, use, and extent of roadways within the national highway system) are collected and updated each year ( 41 ). In contrast, the time gap between data collection and data inventory in the case of Complete Streets facilities could be more than 10 years ( 40 ). In the early days, an inventory of Complete Streets facilities could be created from fieldwork or by consolidating data from districts, MPOs, or locals. In recent years, such an inventory is more likely to be created based on aerial imagery, LiDAR data, or recorded videos. For example, the Louisiana DOTD hired a third-party vendor, Fugro, to process the collected Automatic Road Analyzer data; with regard to Louisiana, sidewalks are included in the inventory along with other road assets.
Some states have made progress in creating an integrated inventory. For example, Kentucky has an integrated inventory of bicycle and pedestrian facilities ( 42 ); Florida not only pooled facility data (such as cycle lanes, sidewalks, trails, bus/rail stations) but also provided other relevant data (such as speed limit, cyclist/pedestrian crashes, and demographic data) on the same map platform ( 43 ).
Outcome Measures
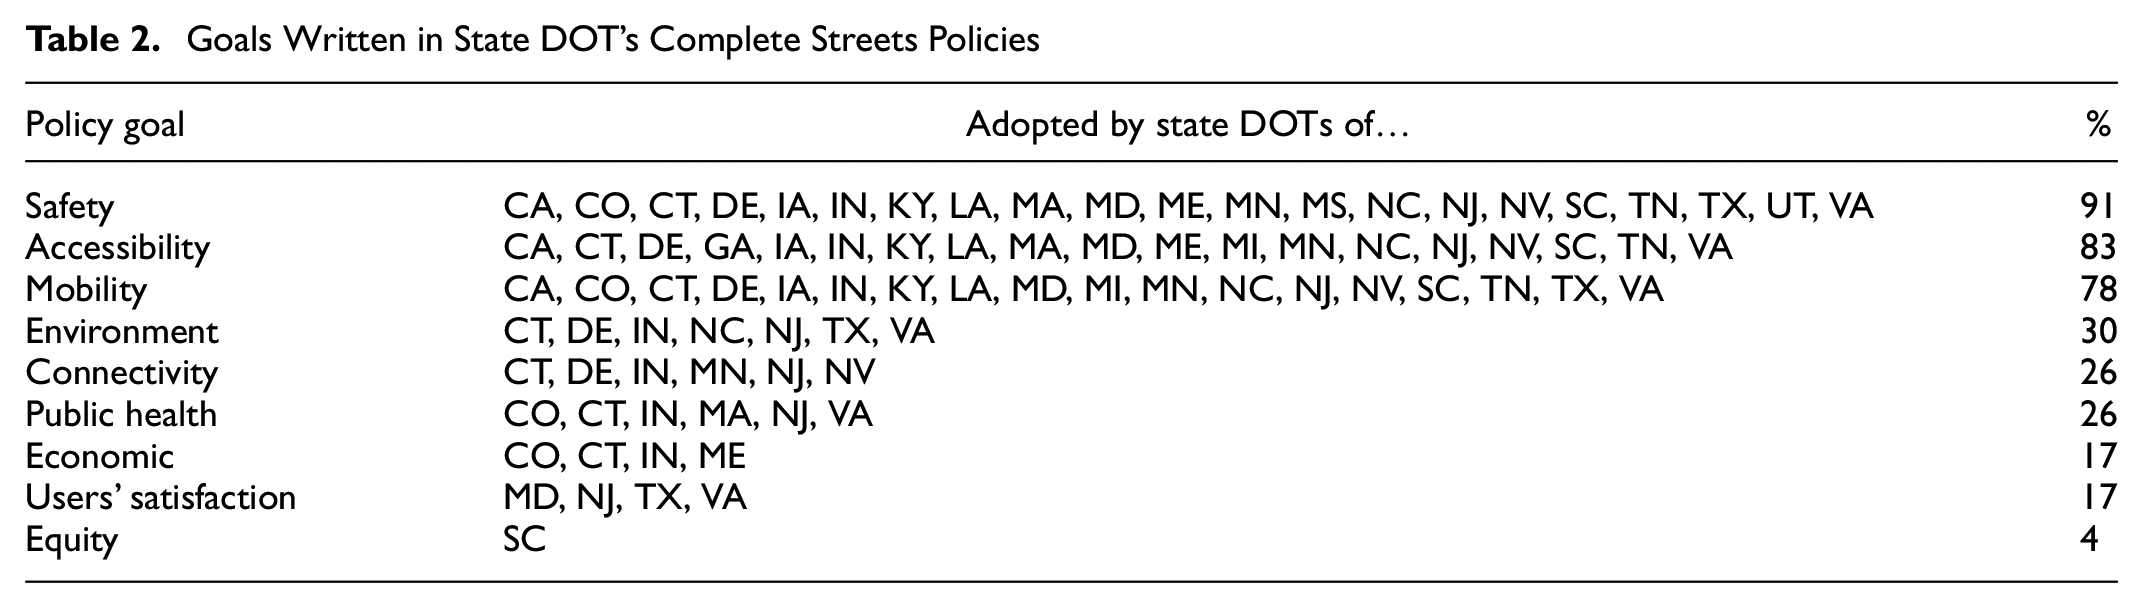
As of June 2021, 25 of the state DOTs in the U.S.A. have adopted the Policy ( 2 ). Among them, 23 states have goals written explicitly into their policies. Table 2 presents policy goals adopted by each state DOT. As shown, safety is the most common goal mentioned. Two other goals mentioned more frequently than the others are accessibility, which typically refers to accessing major destinations and buildings to standards laid down by the Americans with Disabilities Act (ADA), and mobility, which typically refers to reducing congestion. Sometimes, connectivity is clearly distinguished from accessibility. In such cases, connectivity refers to closing the active transportation network gap and creating integrated transportation networks. Some states’ policy goals go beyond safety, mobility, and accessibility; additional goals are considered, including environment, public health, economic, user satisfaction, and equity, which reflects a broader interpretation of the state DOT mission ( 29 , 34 , 35 , 44–46).
Goals Written in State DOT’s Complete Streets Policies
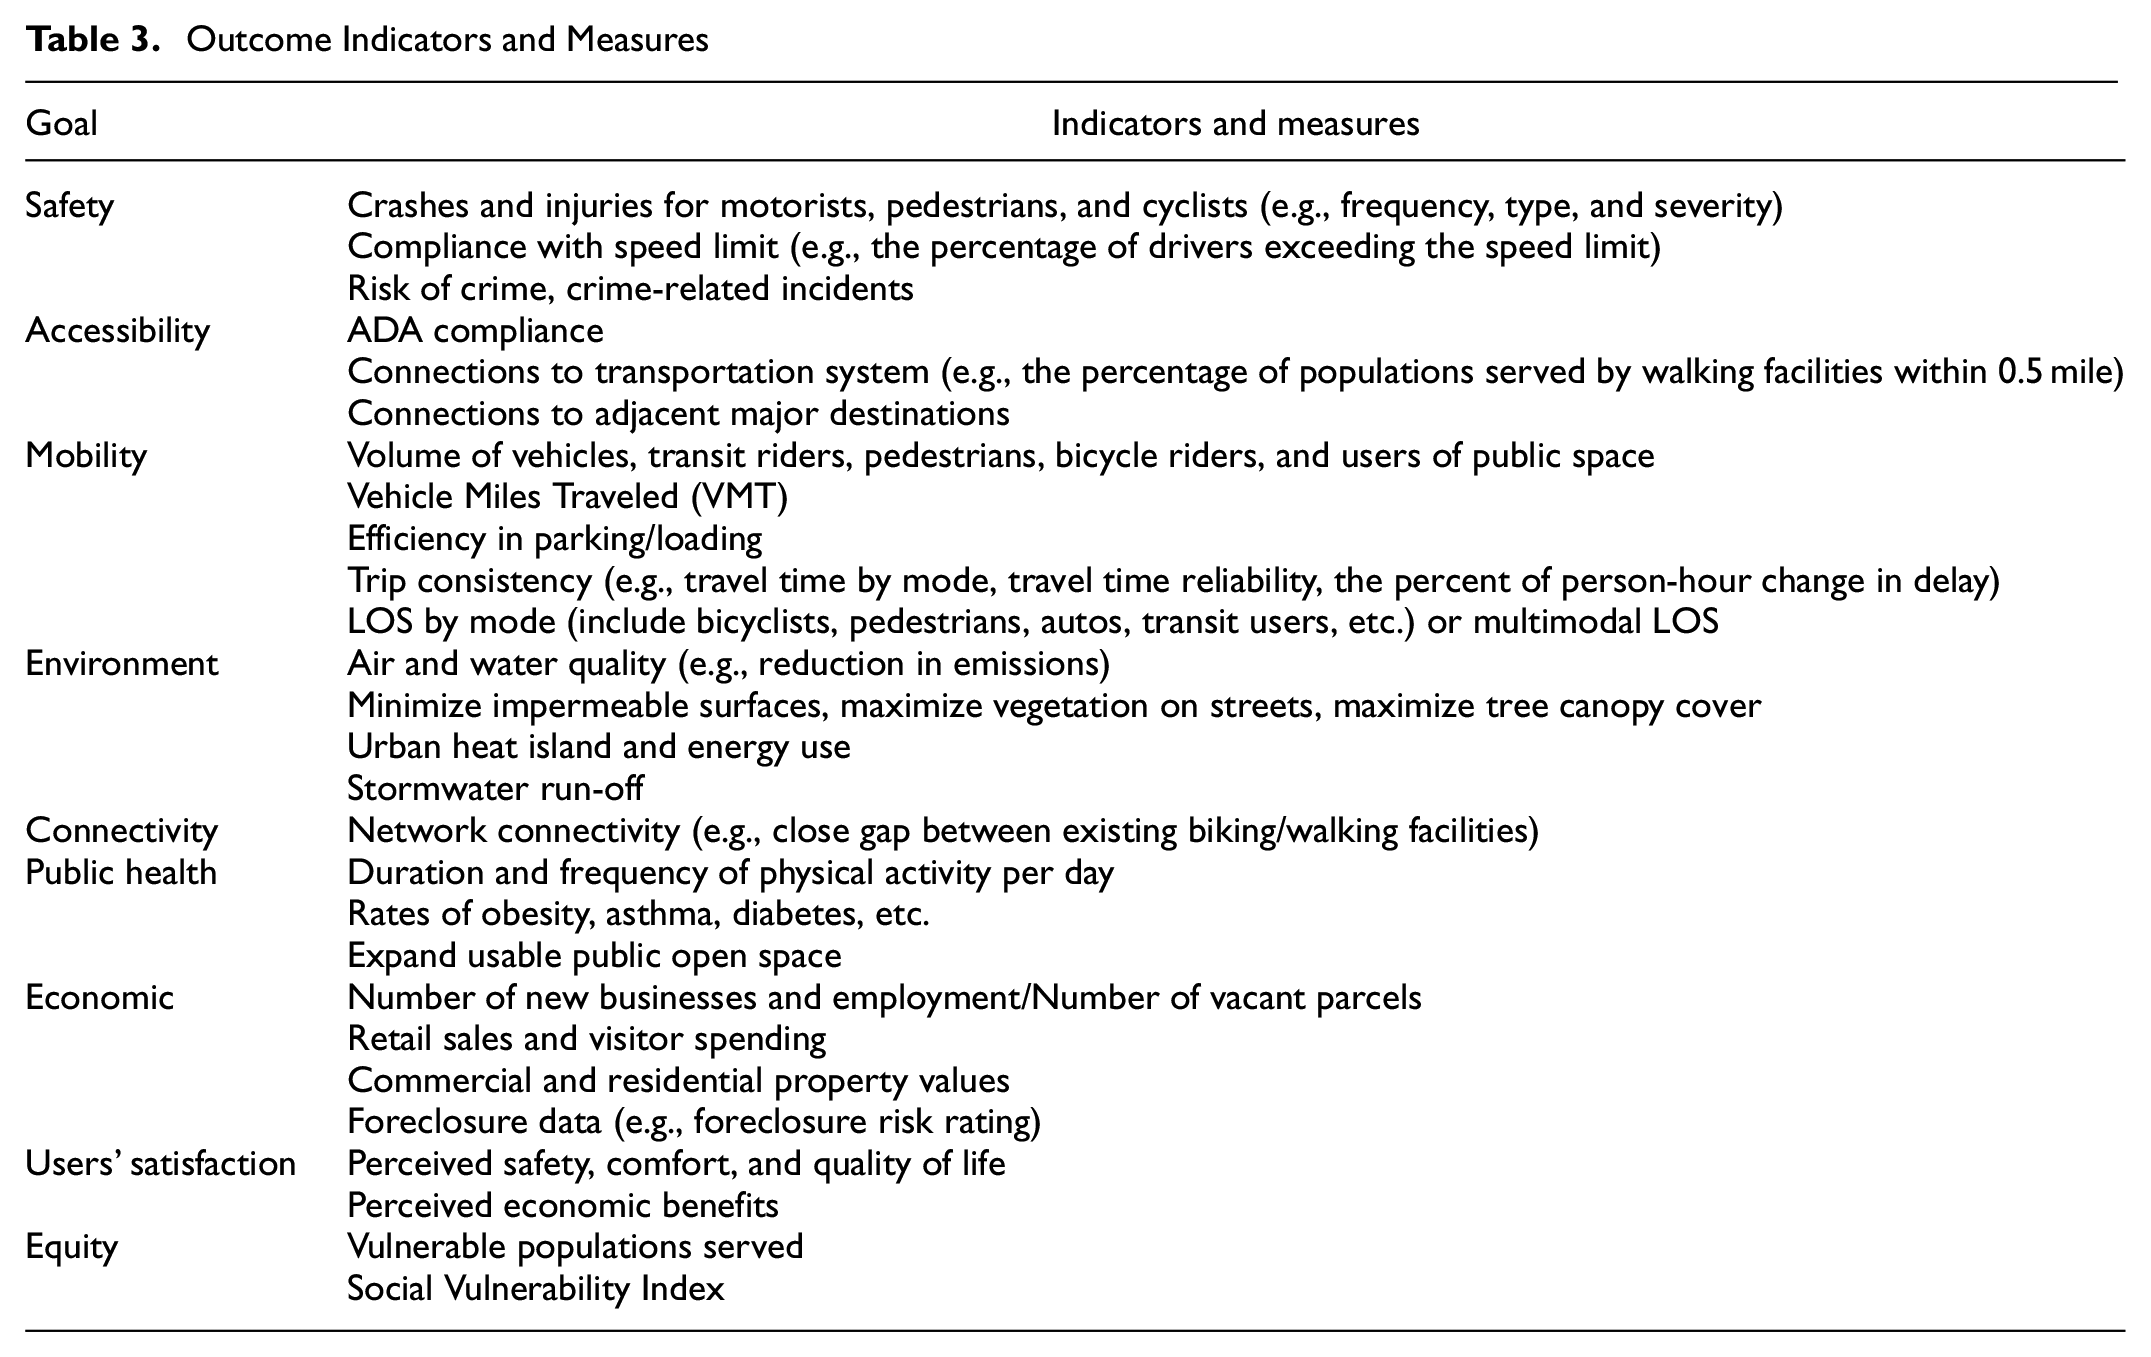
Measures tracking safety outcomes, user volumes by mode, level of service (LOS), and ADA compliance are more common than others ( 22 , 24 , 34 , 35 ). Ranahan et al. ( 35 ) conducted an exhaustive search of performance indicators and measures in 2014 that yielded 800 indicators. FHWA also provided a guidebook in 2016 to help local, regional, and state agencies select and apply pedestrian and bicycle performance measures ( 47 ). Table 3 is a list of common outcome indicators and measures associated with each policy goal.
Outcome Indicators and Measures
Gaps in Measuring Performance
Development of systems for tracking the impact of the Policy on the built environment is often an important prerequisite to evaluating policy outcomes; many state DOTs lack integrated and up-to-date databases with information about the location and characteristics of pedestrian, bicycle, and transit facilities statewide, except for a few such as Kentucky ( 42 ) and Florida ( 43 ). Insufficient data inhibit the ability to track progress toward policy goals ( 48 ). Various initiatives have begun to address gaps in data availability from existing systems, often of limited scope or involving labor-intensive field analyses. For example, Maryland DOT completed a field evaluation of 900 mi of sidewalk to develop a spatial layer of pedestrian facilities ( 49 ). New York DOT conducted an eight-corridor pilot evaluation of implementation of the Policy, featuring qualitative surveys, count and crash data, and economic and health impact metrics ( 50 ). Comprehensive assessments of the extent of the impact of the Policy on overall active transportation networks, and/or advancements toward state-level goals linked to implementation are limited. FHWA includes improving data collection and analysis as one of the five opportunity areas in its advancement of Complete Streets efforts ( 37 ).
Evaluation and Reporting of the Policy in Practice
Although several studies have analyzed the content ( 51 ) and diffusion ( 3 ) of the Policy at state and local level, there has been limited research on how the actual outcomes of implementation are documented. Several states have published at least one update on actions toward implementation of the Policy ( 21 , 52 , 53 ), including a review of progress to date, projects completed, key steps toward implementation, and anticipated future actions. Meanwhile, local and regional agencies have led the development guidance for Complete Streets evaluation, for example, Broward County, FL, which released a toolkit in 2015 outlining program-level performance measures ( 54 ). However, holistic evaluations of policy implementation and outcomes are uncommon. National guidance generally emphasizes methods of assessing individual project success relative to specific goals without addressing systemic evaluation ( 45 ).
The North Carolina DOT evaluated the Policy in 2018 ( 55 ). The evaluation involved a series of stakeholder interviews to assess implementation actions and obstacles, and a review of the DOT’s policies, manuals, and documents to understand how the Policy has been enacted in the state. Best practices from other states were reviewed to find elements that are essential to the success of the Policy. At the end of the study, performance measures were recommended to help evaluate the effectiveness of Complete Streets initiatives in the future. This evaluation process identified recommended enhancements to the Complete Streets implementation process, and suggested a standardized tracking system for measuring progress. However, it did not attempt to evaluate policy outcomes for projects that had been constructed, the built environment/transportation network overall, or for the impact of safety or mobility on road users within the state.
Overall, the literature reflects a lack of established best practice for aggregating, analyzing, and reporting implementation of the Policy in relation to project outcomes. The current study addresses this gap by summarizing a replicable process for synthesizing state DOT data from multiple sources to understand the extent to which the Policy is being applied, and how post-policy implementation actions affect project scoping and delivery outcomes.
Changes to Policies, Guidelines, and Manuals in Louisiana
Figure 1 shows the logic model developed for evaluation ( 56 ). This section reviews the “input” and “activity” components in the policy-monitoring logic model to identify the extent to which Louisiana DOTD has taken substantive steps toward agency-wide implementation of the Policy, and summarizes what Louisiana has accomplished to date The research team reviewed the legislative and executive actions taken after adoption of the Policy, and also dozens of guidelines, manuals, forms, and standard plans or specifications with potential implications for Complete Streets. Analysis consisted of documentation of the date, agency stakeholders responsible, and nature of any changes or updates made since 2010. A thorough reading of the documentation was undertaken to identify relevant passages of text (e.g., using key words related to the Policy) as well as sections or passages in which, according to policy language, references to Complete Streets may be applicable or expected but do not appear (i.e., gap analysis). This evaluation helps determine whether implementation of the Policy has occurred in a manner consistent with adopted policy language.
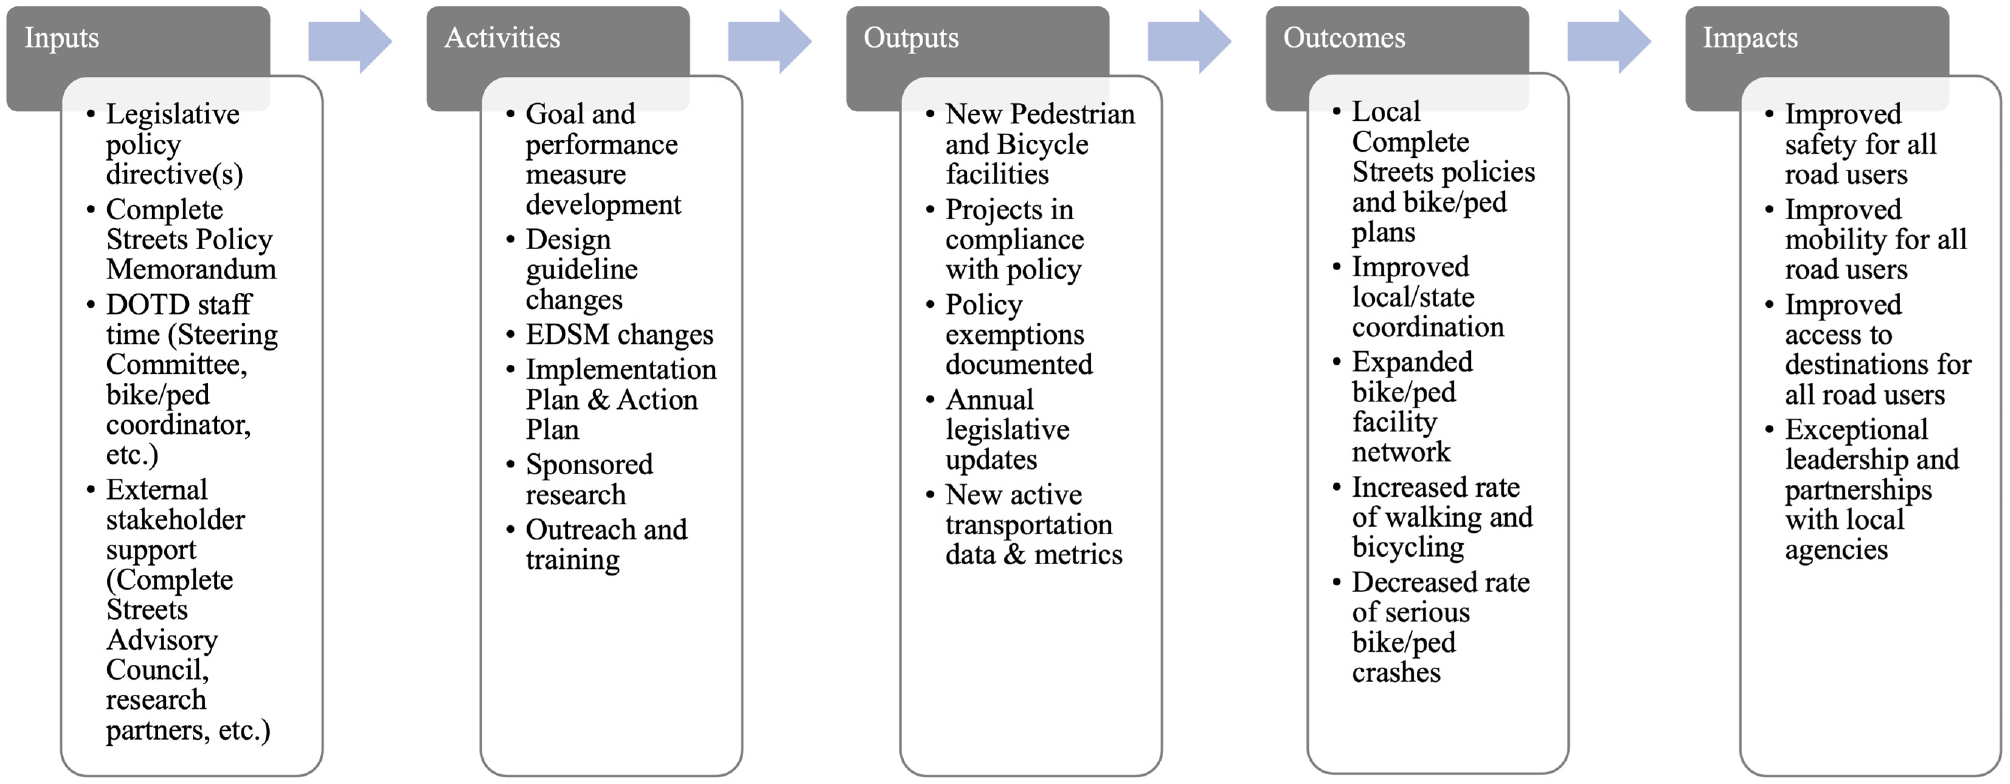
Complete Streets policy evaluation logic model.
Policy Implementation Process
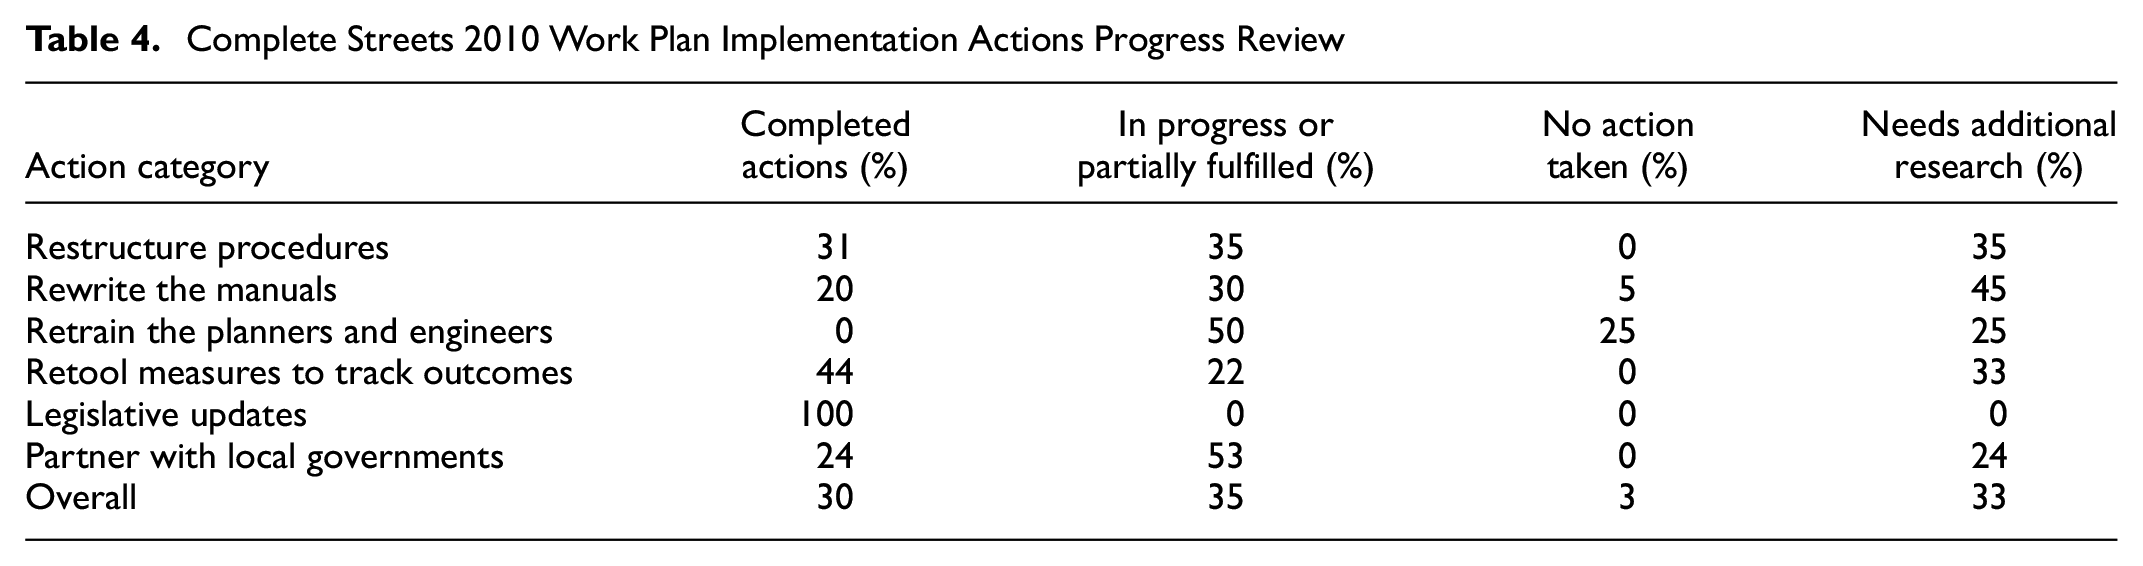
In response to a 2009 legislative directive to study the Policy, the Louisiana DOTD convened a working group to develop formal policy language and a report outlining recommendations for implementation in Louisiana ( 57 ). The report was submitted to the Secretary of Transportation and relevant legislative committees in January 2010. The Policy was formally adopted by the agency in July 2010. Since adoption, a variety of implementation actions have been taken to institutionalize multimodal accommodation on state routes and within state-funded programs. The 2010 Work Group Report outlines various actions needed across six broad categories to implement the Policy effectively, as well as the roles and responsibilities of stakeholders involved. Of the 80 recommended actions, 30% have been substantively completed over the last decade, whereas an additional 35% are in some state of implementation (Table 4). Except for legislative updates to align state law with policy intent, most of these actions were not appreciably initiated until 2015 or later. In many cases, additional research is required to understand the extent of activity and identify remaining actions needed. Many actions listed represent ongoing processes (e.g., partnering with local governments) that do not have a specific “completion” point. Only a few actions do not appear to have been implemented at all, including the following: (a) provision of bicycle detection at actuated traffic signals where appropriate; and (b) assignment of a pedestrian and bicycle liaison at each district office to ensure full implementation of the Policy.
Complete Streets 2010 Work Plan Implementation Actions Progress Review
In spring 2013, the Louisiana DOTD developed a formal legislative update to partially fulfill the request of the state legislature as per House Concurrent Resolution 100 of the 2012 legislative session ( 58 ). This document reflects updates since the 2010 Work Group Report, as well as proposed adjustments to the work group itself and the inclusion of a Complete Streets consultant to facilitate the process. The 2014 legislative session revisited the topic of Complete Streets with Act 470 ( 59 ), which called for maintenance of the Policy and the establishment of a standing advisory committee comprised of a variety of stakeholders to oversee and report on its implementation, including the development and adoption of process- and outcome-oriented performance measures. This led to the formation of the Complete Streets Advisory Council (CSAC) in 2015, which was initially tasked with advising on the development of goals and metrics for assessing implementation of the Policy. Throughout CSAC’s first year of meetings, the group developed a series of draft recommendations for goals, strategies, objectives, and performance measures intended to measure progress toward a safe and accessible network.
Performance Measurement and Benchmarking
Subsequent to delivery of the draft recommendations to the Louisiana DOTD by CSAC in 2016, the Complete Streets Steering Committee was formed to vet and adopt performance measures internally and advance progress on implementation of the Policy overall. Although CSAC continued to meet quarterly to discuss relevant items of interest, the internal Complete Streets Steering Committee developed final Complete Streets goals: (a) safely and efficiently accommodate all road users; (b) create a network that balanced context sensitivity, access, and mobility for all road users; and (c) provide leadership and establish exceptional partnerships with local public agencies with regard to implementation of the Policy.
Drawing on CSAC’s work, the Complete Streets Steering Committee then finalized a series of objectives and performance measures aligned under these three goals as part of the development of a working draft implementation plan, which identifies a need to automate reporting processes and periodically reevaluate performance measures to ensure that data provided are useful for advancing policy goals. Notably, this included developing a more nuanced understanding of crash rates and mode share, beyond data sources available at that time. The Complete Streets Steering Committee also developed a draft action plan, broken down into 24 specific actions, and citing the Louisiana DOTD division or entity responsible for implementing them, although some sections do not appear to have been completed, and target completion dates and lead individuals responsible for each action are missing in most cases. In addition, the current performance measures identified in the draft implementation plan lack specific target benchmarks or dates, which makes it difficult to evaluate whether policy implementation is progressing effectively toward desired outcomes.
Beginning in 2017, the Louisiana DOTD began to compile and publish an Annual Complete Streets Update intended for distribution to the state legislature as per the requirements of Act 470 ( 59 ). The annual update focuses on the following: (a) highlights from the preceding year (e.g., major new projects, initiatives, research, programs, and/or plans relating to Complete Streets); (b) statistics on crashes involving pedestrians and bicycles; (c) documentation of annual output based on performance measures; (d) assorted supporting attachments (e.g., list of documents to be reviewed for policy compliance, survey results, and supplemental visualizations of data); and (e) resolutions from CSAC approving the legislative update.
This update has included a compilation of local and regional Complete Streets plans and policies around the state as an indicator of the Louisiana DOTD’s efficacy as an “exceptional partner” to local public agencies. Since 2010, at least 18 cities, parishes, or MPOs (out of the 64 parishes and 11 MPOs in Louisiana) have developed pedestrian and/or bicycle plans, and at least six local or regional Complete Streets policies have been formally adopted. In addition, since 2018, the Louisiana DOTD has published a series of State Route Indicators, highlighting progress toward reducing the total mileage of state routes that do not meet DOTD’s Complete Streets Minimum Design Guidelines, as well as identifying the number and location of projects with clearly identifiable Complete Streets components by DOTD district, per year. However, these summary indicators do not clearly reflect the extent to which the Policy is being consistently applied across all agency departments, whether resulting projects align with adopted design guidelines, or whether the Louisiana DOTD’s actions to implement the Policy have accelerated progress toward agency goals.
Agency Document Updates
Another important step toward full and effective implementation of the Policy is the systematic review and updating of agency documents, including design guidelines, checklists, and manuals to ensure the Policy’s intent and language is reflected and that pedestrians, cyclists, and transit users are considered at every stage of project development and delivery. With support from personnel from the Louisiana DOTD, the team compiled a list of 60 documents that the Policy was likely to have an impact on, and reviewed these to determine the following: (a) the date of any updates; (b) whether the document references the Policy directly or indirectly (language pertaining to walking, cycling, or transit); and (c) whether the document aligns or conflicts with policy language. Most of these documents (67%) have been updated in the last decade since the Policy was adopted. However, only 37% directly reference it or clearly align with its intent to provide accommodation for all modes of transport and all users. Another 13% of documents have not been updated since 2010, and none of these were found to align with the Complete Streets approach. The remainder were either unavailable at the time of review, or were found to be inapplicable.
A new Complete Streets Engineering Directives and Standards Manual (EDSM) was developed and adopted by the Louisiana DOTD in 2016 ( 60 ), providing definitions of various active transportation facilities and terms, outlining how the Policy will be incorporated into all projects and processes, and defining a process for implementation. Subsequently, a complementary update was made to DOTD’s Complete Streets Minimum Design Guidelines ( 61 ), defining minimum acceptable facilities, as well as preferred accommodation for pedestrians and cyclists in urban and rural areas. The Complete Streets Minimum Design Guidelines are not exhaustive, providing “preferred” values only for sidewalk offsets from the travel lane, but not distinguishing “preferred” from “acceptable” values for sidewalk width or any bicycle facilities. Neither do the Complete Streets Minimum Design Guidelines differentiate between types of roadway functional classifications (other than Interstate highways), or provide guidance for all types of facilities. In some cases, the language in the EDSM and the Complete Streets Minimum Design Guidelines conflicts. Despite these limitations, the two documents form the foundation for implementation of the Policy, providing for the first time definitive guidance on how, specifically, it should be incorporated into project scopes and roadway designs.
In addition to these key updates, a project scoping (Stage 0) checklist has been updated to include a section referencing the Policy. Several manuals used by practitioners to guide various stages of project delivery have also been updated. In addition, several other EDSMs and standard plans that deal in whole or in part with pedestrian or bicycle facilities have recently been updated. Finally, application guidelines and templates for several key competitive grant programs that fund many active transportation projects have been updated to include a specific Complete Streets section or to solicit information about multimodal accommodation that closely aligns with policy goals.
Eight documents reviewed have not yet been updated and do not appear to align with the intent of the Policy, notably the Stage 0 – Manual of Standard Practice ( 62 ), which is the document guiding the early stages of project scoping and planning, and the Pavement Preservation Manual, which directs the design and planning of major and minor rehabilitation projects into which low-cost Complete Streets enhancements could be integrated ( 63 ).
Among the 18 documents that have been updated, but do not reflect a clear alignment with a Complete Streets approach, 50% were updated between 2011 and 2015, before the EDSM and the Complete Streets Minimum Design Guidelines were adopted. Among those updated more recently, certain documents include some references to either pedestrian or bicycle accommodation, but do not explicitly reference the Policy and/or do not provide guidance for specific design or operational elements important for effective multimodal accommodation, something that might be expected within the document’s scope.
Collectively, the review of agency documents indicates that although the Louisiana DOTD has made significant progress toward institutionalizing the Policy in both project scoping processes and competitive funding cycles, additional reviews and updates are needed to ensure consistent policy application, particularly with regard to projects that are not inherently focused on active transportation. In addition, even among documents that have been updated to reflect a Complete Streets approach, additional guidance may be needed to clarify more explicitly how the Policy should be applied in relation to the particular type of project or aspect of design. Finally, even among updated documents that have facilitated meaningful change in the agency’s approach to project scoping, design, and delivery, stakeholder interviews reflect a recognition that additional review and revision may be needed to ensure application of the Policy is improved and to encourage more flexible, contextually appropriate facility design. These findings reflect the following: (a) clear Complete Streets design guidance should be one of the first major steps toward completed implementation following adoption of the Policy, so that, subsequently, other agency documents may be reviewed and updated to check for alignment; and (b) implementation of the Policy is an iterative and ongoing process and key documents should be revisited regularly to ensure they are meeting practitioner needs and leading to desired outcomes on the ground.
Project Review and Analysis
This section reviews the “output” component in the policy-monitoring logic model (see Figure 1). Specifically, transportation projects funded by the state since the Policy was adopted were reviewed to assess its effects on project outputs. This evaluation helps determine whether actions aimed at guiding implementation have resulted in changes to the state’s transportation infrastructure. The Louisiana DOTD’s seven project delivery stages are introduced ( 64 ), critical project documents for review are identified, the project review plan implemented is described, and the results are summarized. The focus of a project review is to find out whether Complete Streets components are being systematically included or excluded from projects and how this varies across program/funding type. Although Complete Streets includes a wide variety of components, here, the research team refers to sidewalks, cycle lanes, and multiuse paths, and so forth. Overall, this review focused on projects involving construction because (a) these are more likely to include the above-mentioned components, which promote multimodal accommodation in their project scope and (b) the Policy does not include clear guidance on how to incorporate a Complete Streets approach into signage, signal, or other projects focused on operation.
Project Delivery Stages
Stage 0 investigates project feasibility. A critical stage document is the “Stage 0 Preliminary Scope and Budget Checklist,” which explicitly asks a question about the feasibility of implementing the Policy. The checklist became effective in practice in 2011.
Stage 1 (planning and environmental process) consists of the following: (a) a better definition of project scope and selection of a preferred alternative during the environmental process; and (b) the establishment of more detailed project costs. According to the stage manual, Stage 1 should not be an obstacle for projects dedicated to Complete Streets or other projects focusing on “minor widening/adding shoulders (no additional lanes)” ( 65 ).
Stage 2 (funding) consists of the following: (a) an update of the cost estimate developed in Stage 1; (b) identification of funding sources, obtaining approvals, and setting up the budget; and (c) setting the project delivery date. If a project remains in Stage 2 for over three years with no action, a reevaluation of the Stage 1 documents is required.
Stage 3 (final design process) consists of the following: (a) management of scope to avoid “scope creep”; (b) setting up a budget for all aspects of the project with appropriate funding sources; and (c) adhering to and monitoring the budget. The project scope, schedule, and estimated cost are finalized in Stage 3. A project is not expected to have major changes in the rest of the project development stages. Therefore, reviewing documents after Stage 3 is not necessary. Critical documents for Stage 3 are the “Preservation, Rehabilitation, and Replacement (PRR) Report,” the “Final Design Report,” and the “Design Exception Form.” However, these stage documents did not come into effect until 2013 or later, so are not available for all projects within the review period. In addition, a question with regard to the implementation of the Policy was added even later (i.e., 2020 for the PRR report and 2018 for the other two). To remedy this issue, the research team reviewed the “Final Construction Plan,” which has the lowest document missing rate among all documents under review. This strategy helped flag projects that did not meet the Complete Streets Minimum Design Guidelines. Stage 3 documents for these projects were then collected and reviewed to identify what the design obstacles might be.
The following section describes the project review process, which is based on project delivery stages, stage document availability and completeness, document transfer time/manpower minimization, and output maximization. Although the specific systems, documents available, and data points extracted will vary at other agencies, it is intended to be a transferable, replicable methodology for evaluating state DOT project outputs.
Construction Project Review Process
Figure 2 shows the entire project review process. The project review pool was constructed by retrieving project records from the Louisiana DOTD’s bidding system, with additional information added from other project management systems. The bidding system shows that a total of 3,234 projects were funded (typically called “let” within DOTD) between January 1, 2011 and December 31, 2020. Most are from the road or bridge preservation programs (40%). About 20% of the projects from preservation programs were randomly selected (based on year and Louisiana DOTD district) to control the workload and generate unbiased review results. Other major programs include safety (9%), enhancement (3%), and urban system (6%). All the projects from these programs were reviewed. Other programs (such as road transfer, maintenance, and operation efficiency) are less relevant to the study purpose and, thus, were excluded.
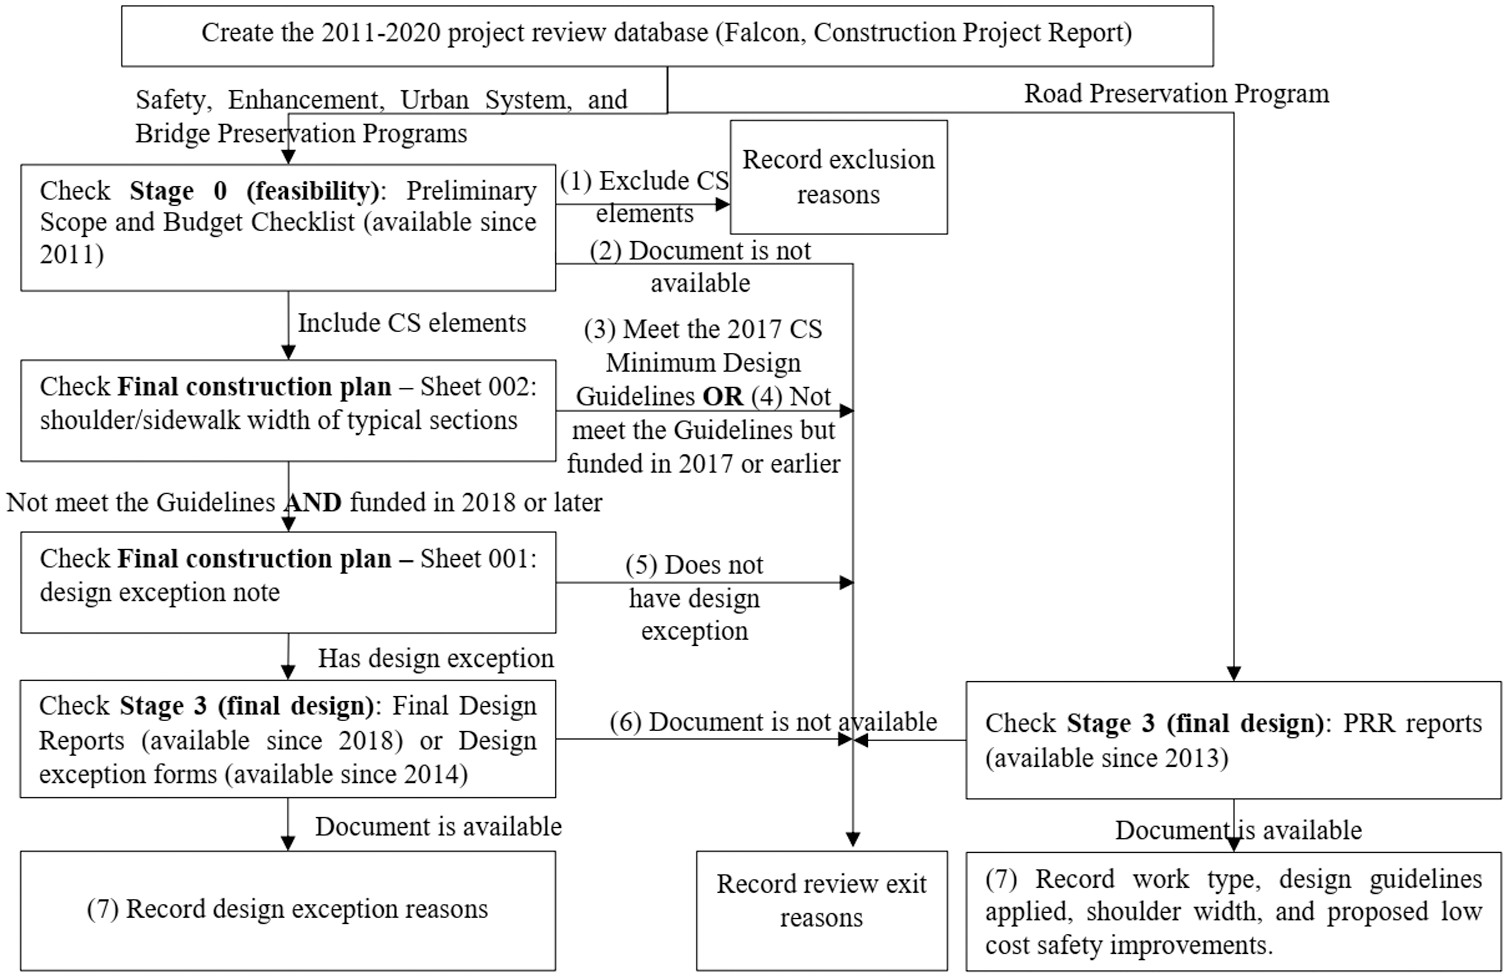
Project review process.
There are seven document review exits in the review process for the safety, enhancement, urban system, and bridge preservation programs. The first two exits are in the review of the Stage 0 document. Some projects do not require a Stage 0 study, although some (especially in the early years) used an “old” Stage 0 form without the Complete Streets question. Those projects without feasibility responses were excluded from further reviews (i.e., Exit 2) because exemption reasons would be hard to determine. In cases with feasibility responses, some projects clearly stated that implementing the Policy would not be feasible (i.e., Exit 1). Exemptions are allowed in a few instances according to the Policy ( 66 ) and the EDSM ( 60 ). The research team categorized exemption reasons claimed in the documents into three general types: out of project scope (e.g., sign installation projects, excessive cost of adding bicycle, pedestrian, or transit facilities); lack of need (e.g., interstate projects, no observed walking/cycling activities); and meets the policy guidelines already (e.g., current shoulder width meets the Complete Streets Minimum Design Guidelines). Evaluation of the validity of these exemption reasons (e.g., whether a lack of observed pedestrian activity indicates a true lack of demand) or appropriateness (e.g., whether a paved shoulder is a suitable Complete Streets accommodation for a particular context) was not part of this evaluation.
The next three exits are in the review of final construction plans. Sheet 001 is the cover page, on which a design exception (when it exists) is marked. Sheet 002 (typically, more than one page and marked by a, b, c …) shows the width of shoulders, sidewalks, cycle lanes, or multiuse paths on typical sections. Projects meeting the 2017 Complete Streets Minimum Design Guidelines (i.e., presence of a 4 ft min paved shoulder or 5 ft min sidewalk, cycle lane, or cycle track) exited from Exit 3. Projects not meeting the Complete Streets Minimum Design Guidelines but funded in 2017 or earlier exited from Exit 4. Then, projects not meeting the Complete Streets Minimum Design Guidelines but funded in 2018 or later were checked to see whether any design exception was requested. If not, a project exited from Exit 5.
The last two exits are in the review of final design documents. When a design exception was requested, the research team reviewed design documents and recorded design exception reasons. A project exited from Exit 7 if its design documents or Sheet 001 provided enough design exception information. If not, a project exited from Exit 6.
The review process for the road preservation program is different. This is because the program does not require Stage 0 studies. The most relevant and informative project document is the PRR report. In its most up-to-date version, the report records design guidelines, existing value, proposed value, and design exception/waiver applied to each design feature. In addition, the report also documents low-cost safety improvements applied to a preservation project.
Findings from Project Review
Table 5 presents project review results by category. “Exit” means the document review process ends for a project. Each exit represents a different meaning as explained in the table. At Exit 1, the most common exemption reason is project scope: 93 in the safety – Highway Safety Improvement Program (HSIP) (in which 30 were for low-cost safety improvements, 16 for traffic flow improvements, 27 for miscellaneous, 10 for asphalt pavement, and 10 for other); 33 in safety – other (all for sign purchase/installation purpose), 29 in enhancement (all for signage and landscaping), 50 in urban system (of which 41 were for pavement preservation and the remaining 9 for others), and 13 in bridge preservation. The second most common exemption reason is lack of need: 53 in safety – HSIP (of which 10 were interstate projects), 12 in urban system, and 5 in bridge preservation. Some of the projects (i.e., 6 in safety – HSIP) declared a road section met the Policy because of existing wide shoulders. Note that a project may use multiple exemption reasons in response to the Complete Streets feasibility question.
Project Review Results by Program Category
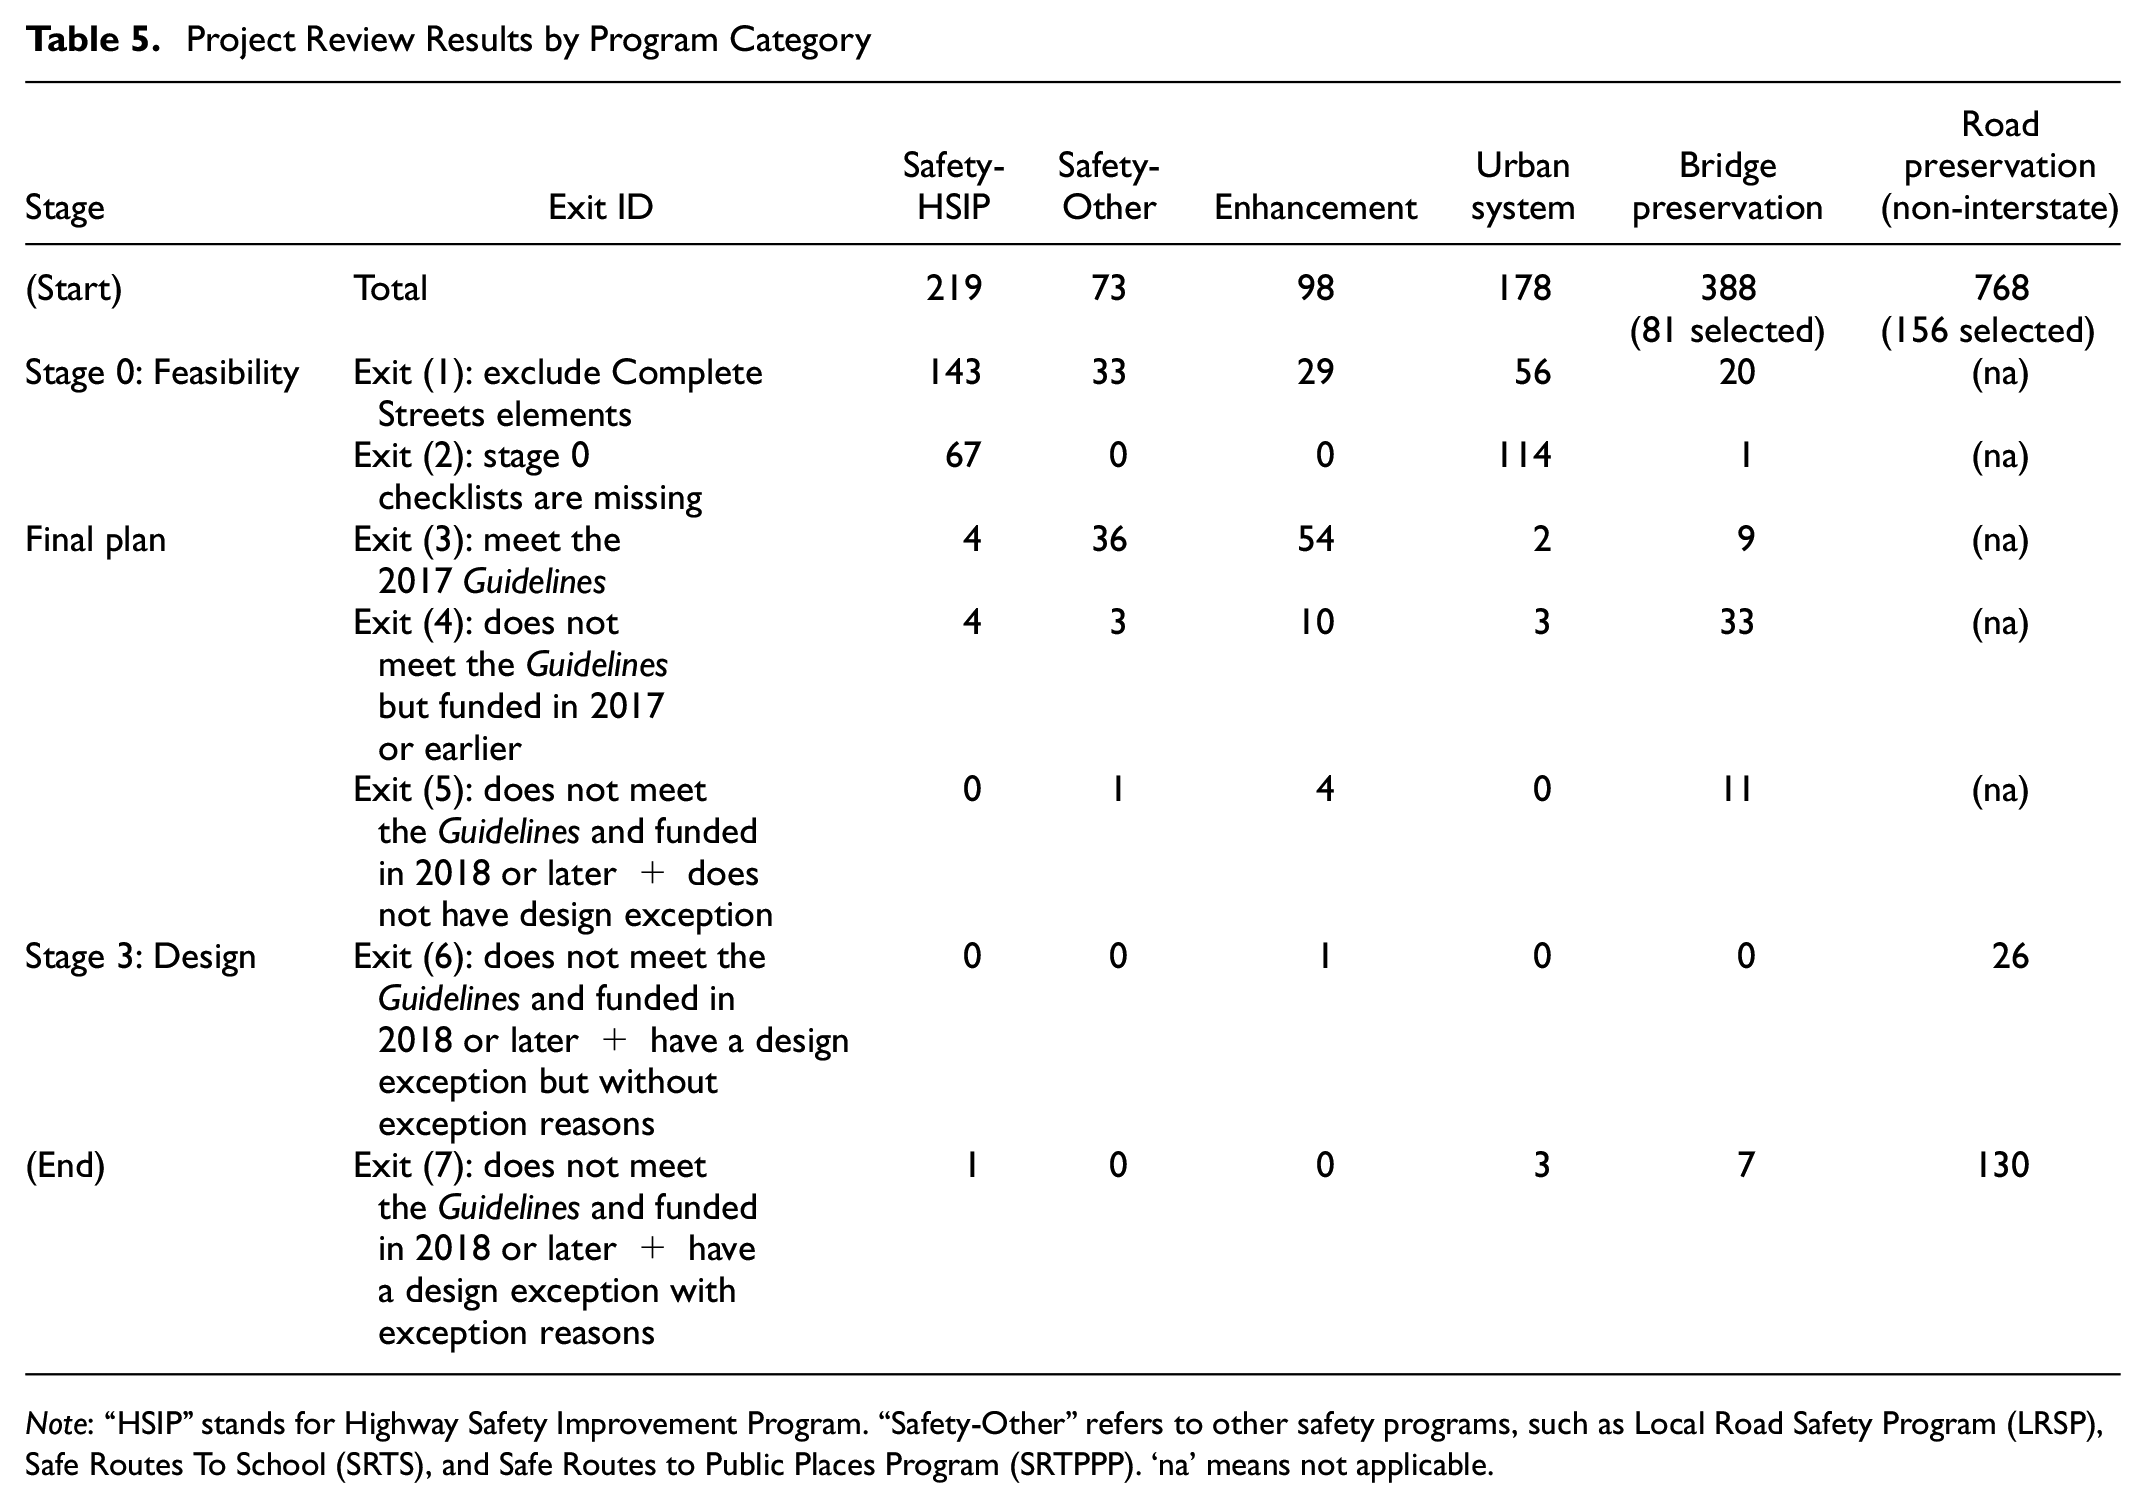
Note: “HSIP” stands for Highway Safety Improvement Program. “Safety-Other” refers to other safety programs, such as Local Road Safety Program (LRSP), Safe Routes To School (SRTS), and Safe Routes to Public Places Program (SRTPPP). ‘na’ means not applicable.
At Exit 2, a significant number of projects used a pre-Policy Stage 0 checklist. Based on information collected, the average time lapse from a Stage 0 study to the time at which the project was funded is three years. In some extreme cases, the time lapse can be over 10 years. Overall, there is a certain time lag for projects (which may have been scoped years earlier) to adopt the most up-to-date versions of forms in practice.
At Exit 3, a significant number of safety – other (i.e., 90%, 36/40) and enhancement (i.e., 78%, 54/69) projects were found to meet the 2017 Complete Streets Minimum Design Guidelines. Among these, 61% of the safety – other projects and 35% of the enhancement projects were funded before 2017.
At Exits 4 and 5, the most significant finding is that a large percentage of bridge preservation projects do not meet the Complete Streets Minimum Design Guidelines. Of the 60 bridge preservation projects that did not exit from Exit 1 or 2, the research team found 59 of them responded “Too early in the process to know” to the Complete Streets feasibility question. When such a project reached Stage 3 (design), it typically considered the Shoulder Width/Type Design Guidelines (i.e., 2 ft. min paved shoulder) instead of the Complete Streets Minimum Design Guidelines (i.e., 4 ft. min paved shoulder). All of them are off-system bridges (i.e., structures not owned by the Louisiana DOTD), which require collaboration and agreements with local authorities to determine needs and maintenance liability.
At Exit 7, for non-preservation projects, exemption reasons include matching the existing section design, tree preservation, and right-of-way acquisition. In the case of bridge preservation, parish council resolutions were applied to Complete Streets exemptions (because they are off-system bridges not owned by the Louisiana DOTD). The most notable case is the road preservation projects, which are typically referred to as PRR projects. First, the time lapse from the PRR report time to the time at which the project was funded is much shorter than the other projects (i.e., the average is 0 years and the maximum is 2 years). Second, these projects followed the 2010 Pavement PRR Minimum Design Guidelines ( 67 ). According to the design guidelines applied, PRR projects for minor rehabilitation and preservation purposes were asked to match existing roadway layout; PRR projects for replacement and major rehabilitation purposes were required to have a 2 ft min paved shoulder, which is considered “acceptable” for urban roads ( 67 ). Third, the research team found the PRR report form had been updated several times since its adoption in 2013. A question asking for details about low-cost safety improvements was added to the form in 2015. Of the 68 PRR projects funded since 2016, 50 responded to the low-cost safety improvement question. Typical answers include adding shoulder wedge, introducing rumble strips, and restriping. A question with regard to Complete Streets was added to the PRR report form in 2020. However, the number of eligible PRR projects funded since this modification is not sufficient for meaningful conclusions to be reached.
Conclusions and Recommendations
This study first reviewed the Louisiana DOTD’s processes and guidance documents to find out how the Policy has been accommodated by the agency in the last 10 years. The study then collected and reviewed construction project documents in the last 10 years to find out how these updates were reflected in practice. Comprehensive evaluation of implementation of the Policy at state level is uncommon, and represents a potential model for other jurisdictions interested in quantifying policy results. Based on the review, it was noted that the following policy implementation processes take significant time: (a) updating policies, guidelines, and manuals; (b) ensuring updates, such as updating project forms, reflect daily practice; and (c) ensuring new projects adopt the most up-to-date version of forms. The process is iterative: updates to one document may reveal further changes that are necessary elsewhere. Overall, facilitating culture change from focusing on automobility to balancing accommodation for all modes is a long-term challenge. This finding explains a perceived slow pace of implementation of the Policy in Louisiana.
Regardless of the slow pace, much progress has been made since 2010. Most of the implementation actions identified at that time have been advanced or completed ( 57 ). Half of the actions identified by the Complete Streets Steering Group Action Plan in 2018 have been completed, partially fulfilled, or are currently in progress, although work to identify parties responsible for some actions and specific targets remains. Looking retrospectively at these achievements, most practitioners recognize the update of the EDSM and the Complete Streets Minimum Design Guidelines as the most significant change and one which should have been advanced sooner. There has been considerable recent momentum within the Louisiana DOTD for accelerating implementation of the action plan, and this research has helped to identify gaps where attention is now needed. The following are a few recommendations for the agency and others who share a similar desire to improve policy implementation.
First, tracking and quantifying process-oriented progress in implementing the Policy has been challenging. This research provides a “one-time” holistic review of the progress made in 10 years. However, additional efforts are needed to facilitate more frequent reviews and performance tracking. For example, the current construction project management system does not provide quick answers to the following: (a) what has been proposed; and/or (b) why something has not been proposed for a project. The first question can be addressed by tracking bid items during their lifetime in the construction process. Such a tracking system would help create a geographic database recording all Complete Streets elements. More broadly, it would help create a transportation asset database for asset management and maintenance purposes. The second question can be addressed by improving our understanding of active transportation needs, posing specific questions with regard to funding challenges, consolidating the project management system, and encouraging all Louisiana DOTD sections to exchange major project decision documents via the system. In addition, responding directly to questions embedded in the project management system instead of utilizing digital/printed forms outside of it will ensure projects use the most up-to-date forms/documents and provide guided responses, which will facilitate text/content analysis.
Second, to make more significant progress with regard to influencing the built environment, more attention should be given to PRR projects. Almost half of the projects in the last 10 years fall into this category in Louisiana. However, because they are restricted by work type, PRR projects cannot involve any new or reconstruction activities. The following are a few actions that could be taken based on current practices. First, response to the low-cost safety improvement question needs to be improved. More guidance, training, or education may be needed to advance low-cost safety measures dedicated to vulnerable road users. This action could also be pursued by building collaborations between different state DOT sections/programs, for example, safety and preservation. Second, a tool could be employed to facilitate roadway reconfiguration (e.g., road diet) decisions with regard to whether pedestrian or bicycle accommodation is needed and whether scope-feasible facility types are appropriate for the context. The tool should provide quick answers without delaying project delivery.
With regard to future studies, the project information collected can be analyzed from different perspectives, such as by year and district, to identify temporal and spatial disparities in policy implementation. In addition, the research team is conducting surveys and interviews with stakeholders who have contributed to policy implementation in the last 10 years and/or expect to be involved in future policy implementation. Responses from stakeholders will inform more practical recommendations for next steps. The state agency is now in a “Complete Streets 2.0” phase, in which the basic framework is in place and key elements have been advanced. The results of the current study and subsequent works are expected to help it reinforce the foundations laid, build capacity, identify training/education needs, and establish stronger partnerships with local governments.
Footnotes
Acknowledgements
The authors would like to thank all the DOTD program managers and their coworkers who responded to our data collection request (names are listed in alphabetical order): Joseph Brown, Jessica DeVille, Zhengzheng “Jenny” Fu, Steve Meek, Mark Morvant, Angela Murrell, Brian Nunes, Ryan Richard, Laura Riggs, and Dlon Spurlock. The efforts of graduate students Mishuk Majumder and Mostafiz Emtiaz who helped with reviewing the report are also acknowledged.
Author Contributions
The authors confirm contribution to the paper as follows: study conception and design, R. Bian, T. Tolford; data collection, R. Bian and T. Tolford; analysis and interpretation of results, R. Bian and T. Tolford ; draft manuscript preparation, R. Bian and T. Tolford. All authors reviewed the results and approved the final version of the manuscript.
Declaration of Conflicting Interests
The author(s) declared no potential conflicts of interest with respect to the research, authorship, and/or publication of this article.
Funding
The author(s) disclosed receipt of the following financial support for the research, authorship, and/or publication of this article: This work is supported by the Louisiana Transportation Research Center under project 21-2SS: Evaluate the Impacts of Complete Streets Policy in Louisiana.
Data Accessibility Statement
Some of the data that support the findings of this study are available from Dr. Ruijie Bian on reasonable request.
Any opinions, findings, and conclusions expressed are those of the authors and do not necessarily reflect the views of the sponsor.