
Abstract
The main objectives of this study are to understand the motivations for and deterrents to the adoption of carpooling, and model people’s intentions to adopt it in Jordan. A cross-sectional survey based on a conceptual framework was designed to answer all the research questions. A total of 630 valid responses were analyzed using partial least squares structural equation modeling techniques. The study found that the main barriers to the adoption of carpooling are factors related to privacy, security, and trust. In addition, there are no incentives offered by companies or any official institution to encourage the adoption of carpooling, and the insurance system disadvantages the driver. An important finding is that providing private parking spaces will encourage more than half of the participants to adopt carpooling. In addition, decisions to adopt carpooling or not were found to be associated with travel time, gender, and income level. Younger people, males, and those with low income levels were more willing to adopt carpooling. Compared with males, it was found that females were less interested in adopting carpooling because they attached more importance to convenience, privacy, and trust. Postgraduate students were found to be less likely to adopt carpooling. Finally, a structural model was developed with a moderate coefficient of determination.
Keywords
Major cities all over the world have witnessed rapid growth in their industries, infrastructure, economic activities, and population over the past few decades. This has led to a rise in car ownership and, consequently, an increase traffic congestion, delay, environmental pollution, and climate change ( 1 ). An effective approach for addressing traffic congestion and its related issues is the implementation of transportation demand management (TDM) strategies ( 2 ). TDM is the application of strategies and policies to improve mobility and to redistribute the demand in space and time. It provides many sustainable and effective solutions for addressing the negative impact of increasing car ownership while ensuring the quality and speed of transportation ( 3 , 4 ). Since the 1970s, policymakers have adopted TDM strategies to influence individuals’ travel behavior ( 5 ). Promoting the adoption of carpooling is one of the most important TDM strategies. Compared with other strategies, it does not need a significant investment in infrastructure or ask people to abandon their cars ( 6 ). McGeehan ( 7 ) considered carpooling as the middle transit mode on a line representing flexibility and privacy, at the extreme ends of which are driving alone and public transit. Carpooling is generally defined as an alternative travel mode in which two or more participants use the same private car simultaneously from a common place to a common destination or one close by, to reduce the number of single-occupancy vehicles on the road.
Carpooling is a type of sharing economy service, and not an on-demand economy service such as Uber, because it is prearranged and non-profitmaking. The term carpooling should not be synonymous with carsharing. In carsharing, the vehicle is not privately owned but belongs to a company and the person rents the car for a set period of time, for example, one hour ( 8 ). Vanpooling ( 9 ) is the same concept as carpooling but using larger cars usually for employees of a particular company. Shaheen and Cohen ( 10 ) classified carpooling into three categories: acquaintance-based; organization-based; and ad hoc ridesharing. The first category consists of carpools that are formed by individuals who are already acquaintances, for example, family, friends, or coworkers, whereas the second category requires participants to sign up to a web platform to match with another driver. There is no cost splitting in this form of carpooling ( 11 ). Vanoutrive et al. ( 12 ) distinguish between internal (common origin) and external carpools, which are also called household-based and non-household-based carpools, respectively. The most distinctive feature of the household-based carpool is the high level of confidence the members have in each other.
Jordan is located in the Middle East region and has a population of about 11 million ( 13 ). The country is similar to the other Arab countries with regard to social habits, values, and culture. In the last two decades, Jordan has experienced a sudden increase in population as a result of forced migration from neighboring countries. This has affected the transportation sector and prevented the government from implementing some vital projects here. In Jordan, the quality of the public transport system is relatively poor, especially with regard to comfort and waiting time ( 14 ). Therefore, because of the lack of an effective and reliable public transport system, people resort to owning private cars. According to Prieto ( 15 ), the number of vehicles registered in Jordan is more than 1.5 million. With increasing vehicle ownership, it is highly likely that problems with traffic congestion, energy, carbon emissions, land use, and climate change will also increase in the near future. Consequently, with a scarcity of resources, weak infrastructure, and a poor public transport sector, consumer behavior has to change to make better use of the transportation facilities available. Carpooling is an appealing and interesting TDM tool. To increase the adoption of carpooling, it is important to investigate public opinion and understand the determinants of a carpooling system from the perspective of Jordanian citizens, as well as the extent to which they could rely on it and the factors that would affect its adoption as an approved means of transport. To the best of our knowledge, previous studies have not investigated the motivations for or deterrents to the adoption of carpooling in Jordan or any other Arab countries.
Purpose of the Study
The main objectives of this study are the following: first, to model the intent to adopt carpooling based on a framework that merges economic and sociodemographic factors and considers the perceived benefits of carpooling for the individual, the community, and the environment; second, to examine the role of behavior, ethics, and individual prerequisites when choosing travel mode, as well as exploring the level of importance that Jordanian citizens attach to convenience, flexibility, privacy, speed, cost saving, and the environment; third, to investigate the willingness of Jordanian citizens to use a carpooling system in the event of establishing a new traffic policy or incentives such as high-occupancy vehicle (HOV) lanes or private parking.
Literature Review
The history of carpooling can be traced back to World War I, when car owners started providing seats in their cars at the end of 1914. However, this sudden increase in carpooling did not last long, because car manufacturers launched a backlash against the government that led to a 90% reduction in carpooling by the end of 1918 ( 16 ). This situation continued until World War II in 1940, when there was a need to preserve fuel resources for the war effort, and carpooling enjoyed a short success period until the post-war boom. At the beginning of the first oil crisis in 1973, carpooling received new attention because of the ensuing financial recession, which was causing people to seek a reduction in personal capital ( 17 ). Participation in carpooling dropped again to 19.7% in 1980 because of a fall in oil prices and a rise in people’s income, and in 1990 it decreased again to 13.4% for all work trips ( 18 ). Carpooling initiatives varied from region to region and, consequently, the drop in take up was not spatially homogeneous ( 19 ). Since the rapid rise in oil prices from 2005 onward, people have shown a renewed interest in carpooling, but without government support ( 20 ).
Technology has played a big role in the spread of carpooling; for example, the rise of internet-based services helped agencies to provide private matching platforms ( 21 ). However, these internet-based platforms did not make significant progress because of an expansion of the road network and the introduction of more flexible working hours ( 22 ). The advent of smartphones that provide a continuous connection to the internet has increased the adoption of carpooling and made it attractive again. Estimates from the U.S. Census Bureau show that the proportion of shared rides declined from 12.2% in 2000 to 8.9% in 2017 because of low match rates ( 23 ). Adelé and Dionisio ( 24 ) found that in France, 4.5% of the total number of workers carpool every day and the conditional quota of carpooling for passengers is 10% of the total kilometers of travel. Some researchers consider carpooling as an invisible mode of travel, because of the difficulty in collecting, recording, and studying carpool data ( 25 ).
Carpooling has been proposed as a realistic option for public transport ( 26 ). Various studies on carpooling services have been carried out, and these can be categorized into the following: demographics of carpool users ( 27 ); factors that affect the intention to adopt carpooling ( 28 – 30 ); the impact of carpooling on the environment; social aspects of, for example, carpooling, trip chain behavior ( 22 , 31 ); and the establishment of matching platforms or carpooling clubs ( 32 , 33 ). Factors that affect the intention to adopt carpooling vary from study to study. Most previous studies focused on externalities such as environmental benefits and finding a solution to traffic problems. Neoh et al. ( 34 ) and Olsson et al. ( 9 ) undertook meta-analyses to understand user characteristics, incentives that encouraged the adoption of carpooling, and barriers to the same. They grouped the determining factors according to whether they were internal or external to passengers. Wang and Chen ( 35 ) examined three groups of factors: sociodemographics; attitudes; and environmental benefits. Factors affecting the adoption of carpooling can also be classified as follows: sociodemographic; spatial accessibility; temporal; attitudinal; and availability of cars ( 36 ). Park et al. ( 30 ) concluded that current mode choices may affect the intention to adopt carpooling. Furthermore, race/ethnicity of prospective partners ( 37 ), promotion of carpool programs ( 12 ), social differences, attitudes ( 28 ), fewer CO2 emissions ( 33 ), and access to HOV lanes ( 29 ) were found to be influential factors when choosing to adopt carpooling.
Many studies have identified the limited influence of sociodemographic traits on the adoption of carpooling as a mode of travel ( 36 ). The only factor that always has a significant influence on an individual’s decision to adopt carpooling is income. Vanoutrive et al. ( 12 ) found that the adoption of carpooling is positively associated with lower incomes, and this result was confirmed by most studies. Devarasetty et al. ( 38 ) found that people with a higher income level had a greater propensity to choose carpooling. Wilkowska et al. ( 39 ) showed that the mobility requirements for adopting carpooling varied between males and females. It has also been found that those adopting carpooling are more likely to be women ( 26 ), employees with a higher education level, people who live in less accessible locations ( 12 ), and those who have positive attitudes toward the environment and public transport ( 8 ). In addition, it has been noted that mental factors are more significant when making a decision about whether to adopt carpooling than sociodemographic factors ( 40 ).
Correia and Viegas ( 32 ) found that the two main barriers to the adoption of carpooling are the psychological anxiety related to riding with strangers and the lack of flexibility because of variations in people’s individual schedules. To improve the attractiveness of carpooling, they conducted a web-based survey in Portugal. As a result, they proposed a carpooling club for the commuter with an innovative structure including a stated preference experiment. The results indicated that carpooling club schemes appeal to certain social groups: the lower socioeconomic classes; younger people; and people who have more open attitudes.
Several studies discuss carpooling as a school travel mode, for example, Arbour-Nicitopoulos et al. ( 41 ) in Canada and Rafiq and Mitra ( 42 ) in California. Carpooling for schoolchildren is defined as an arrangement between two or more families in which they take their children together in one car to or from school. The authors found that the major determinant is travel distance; as the travel distance increases, the children are more likely to be involved in carpooling. In addition, families with more children of school age are increasingly likely to adopt carpooling, especially when the head of the family has a higher education level. Further, Gallo and Buonocore ( 43 ) discussed carpooling as a travel mode for university students. The results showed that the main barrier to the adoption of carpooling, especially for women, is traveling with unknown students (lack of trust). The authors also found that university students are the group most likely to choose carpooling, the reasons for this being their overall culture, their young age, the need to save money, and their willingness to use the internet.
Malodia and Singla ( 44 ) have studied the determinants of and incentives for adopting carpooling in selected Indian cities. They found that the most significant positive factor is cost saving. However, extra travel time to the meeting point or increased waiting time was found to influence the choice to adopt carpooling negatively. Friman et al. ( 45 ) found that the main advantages of adopting carpooling for Swedish residents were economic and environmental efficiency, whereas the main disadvantages were lack of effectiveness and flexibility. Some researchers have found that as the travel distance increases, people are more likely to adopt carpooling ( 46 ), whereas others found the opposite was true ( 47 ). Rietveld et al. ( 48 ) reported that carpooling could increase the travel time by 17% because of detours. In addition, Do and Jung ( 49 ) found that the demand for carpooling and frequency of use is directly proportional to distance. Hwang and Giuliano ( 50 ) explained that the reason behind this is the pickup/drop-off delay, although waiting time is small in relation to the total travel time.
Canning et al. ( 51 ) showed that the greatest motivation for employees to use a formal carpool scheme provided by an employer is saving money, especially when the employer provides incentives to the participants. The desire to ease road congestion has also been studied as a motivator, suggesting that people may use local or even global environmental–ethical frames to construct their rationales socially. Environmental benefits have been found to be the second most important incentive for employees to participate in the carpooling system. As such, the wish to reduce their carbon footprint is important for drivers who adopt carpooling; the British Social Attitude Survey reported that 55% of respondents admitted they should reduce car travel for environmental reasons ( 52 ). Dewan and Ahmad ( 53 ) calculated the approximate cost saving for each person if carpooling were to be adopted. They assumed that four people worked at the same place, each one had a car, and that every week one of the four cars was used. In one month, each person could save 75% of the total cost (fuel, maintenance, and parking), which was approximately 60 USD if the travel distance was 40 km per day. Ayed et al. ( 54 ) evaluated the potential of using a carpooling system as a new alternative mode of travel for workers from France, Belgium, and Germany who were traveling to Luxembourg.
Although most drivers understand the benefits of adopting carpooling, they are unwilling to sacrifice the flexibility and comfort of a private car ( 55 ). Olsson et al. ( 9 ) and Oliphant ( 56 ) found that psychological factors, such as the desire for personal space, reluctance to socialize, and personal security, are of concern when sharing a ride with strangers, and can have a negative impact on the adoption of carpooling. In the light of the COVID-19 pandemic, Hensher ( 57 ) proposed two different future scenarios for mobility as a service, which includes carpooling. In the first scenario, travel will be as it was pre-COVID-19, whereas in the second scenario, working from home will increase and shared modes of transport will become less attractive. Because social distancing is a key means of preventing the spread of COVID-19, sharing transport will raise the level of risk but can be minimized when traveling with familiar people (acquaintance-based carpooling).
Methodology and Hypotheses
Modeling
In this study, structural equation modeling (SEM) is used. SEM is one of the most powerful statistical techniques because it can examine several interrelated relationships between multiple independent and dependent variables simultaneously in one comprehensive analysis ( 58 ). Traditional statistical techniques such as multiple regression, analysis of variance (ANOVA), path analysis, and factor analysis have distinct advantages and limitations. These approaches assume that the variables included in the analyses have been measured without error, which may lead to model misspecification ( 59 ). SEM estimates and removes random and correlated measurements error ( 60 ). The measurement error of a single variable tends to overestimate or underestimate the effect on the dependent variable. Moreover, traditional statistical techniques cannot explain the entire structural model or evaluate all the hypotheses simultaneously. SEM is referred to as latent variable analysis because this is what distinguishes it from other applications of general linear modeling ( 61 ). A latent variable is a variable that is not directly observable because of its complexity, and it is also multifaceted; examples are intelligence and motivation. Using latent variables addresses the problem of including measurement error. Multiple observed variables or indicators were used to measure or represent the latent variable to approximate real-life measures ( 62 – 65 ).
Variance-based structural equation modeling (VB-SEM), also known as partial least squares structural equation modeling (PLS-SEM), is used. Normally, this method is preferred if the research is exploratory and the objective is a prediction ( 66 ). There are no distributional assumptions in this approach ( 67 ). In addition, compared with covariance-based structural equation modeling (CB-SEM), VB-SEM works with a wide range of sample sizes, whether these consist of a very small or very large amount of data ( 63 ). Moreover, the number of indicators per construct can be one or more, whereas for CB-SEM there must be three or more ( 63 ). The primary objective of VB-SEM is to maximize the variance explained in the dependent constructs, as well as to assess the quality of the data based on the characteristics of the measurement model. In this study, SmartPLS software was used to determine whether the proposed hypotheses in the theoretical model were consistent with the data collected ( 68 ).
Conceptual Model and Hypotheses
The main goal of this paper is to identify the factors that may affect Jordanian citizens’ intention to adopt carpooling. Because a sound model is grounded in theory, a conceptual framework based on the findings of the previous literature and our guesses or suggestions based on the current situation and our knowledge of the Jordanian society has been advanced.
The first research question asked to what extent there was a relationship between behavior, ethics, and individual prerequisites of Jordanian citizens on the one hand, and their intention to adopt carpooling on the other. Therefore, the first independent latent variable is the role of behavior, ethics, and individual prerequisites (ROBEI).
Hypothesis 1 (H1): Jordanian citizens’ behavior, ethics, and individual prerequisites have a significant impact on their intention to adopt carpooling.
Because carpooling has several benefits for individuals, the community, and the environment, the second research question asked about the relationship between an individual’s belief in the benefits of carpooling o the one hand, and his/her intention to use it on the other. The third question asked about the relationship between the degree to which the individual understands the benefits of carpooling for the community and the environment on the one hand, and his/her intention to use it on the other. The second independent latent variable is perceived benefits for the individual (PBI), for example, an increase in productivity, and flexibility. The third independent latent variable is perceived benefits for the community and the environment (PBCE), for example, reduction of environmental pollution and traffic congestion.
Hypothesis 2 (H2): The perceived benefits to the individual from carpooling have a significant effect on the intention to adopt it.
Hypothesis 3 (H3): The perceived benefits to the community and the environment as a result of carpooling have a significant effect on the intention to adopt it.
In Jordan, there are no incentives to encourage the adoption of carpooling, and researchers found from the results of previous studies in different regions that willingness to adopt carpooling increases if there are HOV lanes or free parking. The fourth research question asked whether the establishment of a new traffic policy or the introduction of incentives such as HOV lanes or private parking would increase the intention to adopt carpooling. The fourth independent latent variable is the establishment of a new traffic policy (TP)
Hypothesis 4 (H4): The establishment of a new TP or the introduction of incentives such as HOV lanes or private parking has a significant effect on the intention to adopt carpooling.
According to previous studies, six factors may affect the choice of travel mode, and these factors differ from one person to another. In addition, the level of importance may vary depending on surrounding conditions. Therefore, the fifth research question is about the relationship between the degree of importance Jordanian citizens attach to convenience, flexibility, privacy, speed, cost saving, and the environment when choosing travel mode on the one hand, and their intention to adopt carpooling on the other. It is expected that when a driver attaches a high level of importance to cost saving and the environment, his/her intention to adopt carpooling will increase, although the opposite will be true if he/she values convenience and privacy. However, flexibility may depend on the organization of the trips and the partners involved. It is better to carpool with family or neighbors; in addition, the flexibility increases when all drivers sharing the trip are heading for the same destination.
Hypothesis 5 (H5): There is a statistically significant relationship between Jordanian citizens’ priorities when choosing their mode of travel and their intention to adopt carpooling.
Research question six asked about the relationship between Jordanian citizens’ degree of satisfaction with their current mode of travel and their intention to adopt carpooling. It is expected that if the person is very satisfied with the mode of travel, he/she will not change it or try to improve it; carpooling is not a new mode of travel, just a new improvement.
Hypothesis 6 (H6): There is a statistically significant relationship between Jordanian citizens’ degree of satisfaction with their current mode of travel and their intention to adopt carpooling.
Most researchers found that as the travel time increases, the greater the intention to adopt carpooling. So, the seventh question asked about the extent to which travel time would affect the intention to adopt carpooling.
Hypothesis 7 (H7): For Jordanian citizens, travel time is significantly related to the intention to adopt carpooling.
The conceptual model (Figure 1) integrates five latent concepts, two items, and six control factors with the intention to adopt carpooling, to discover what a random sample of Jordanian participants think, do, or feel about the idea of carpooling. The arrows point from exogenous latent constructs to the endogenous variable (carpooling intention). The exogenous latent constructs are measured through measurement variables.
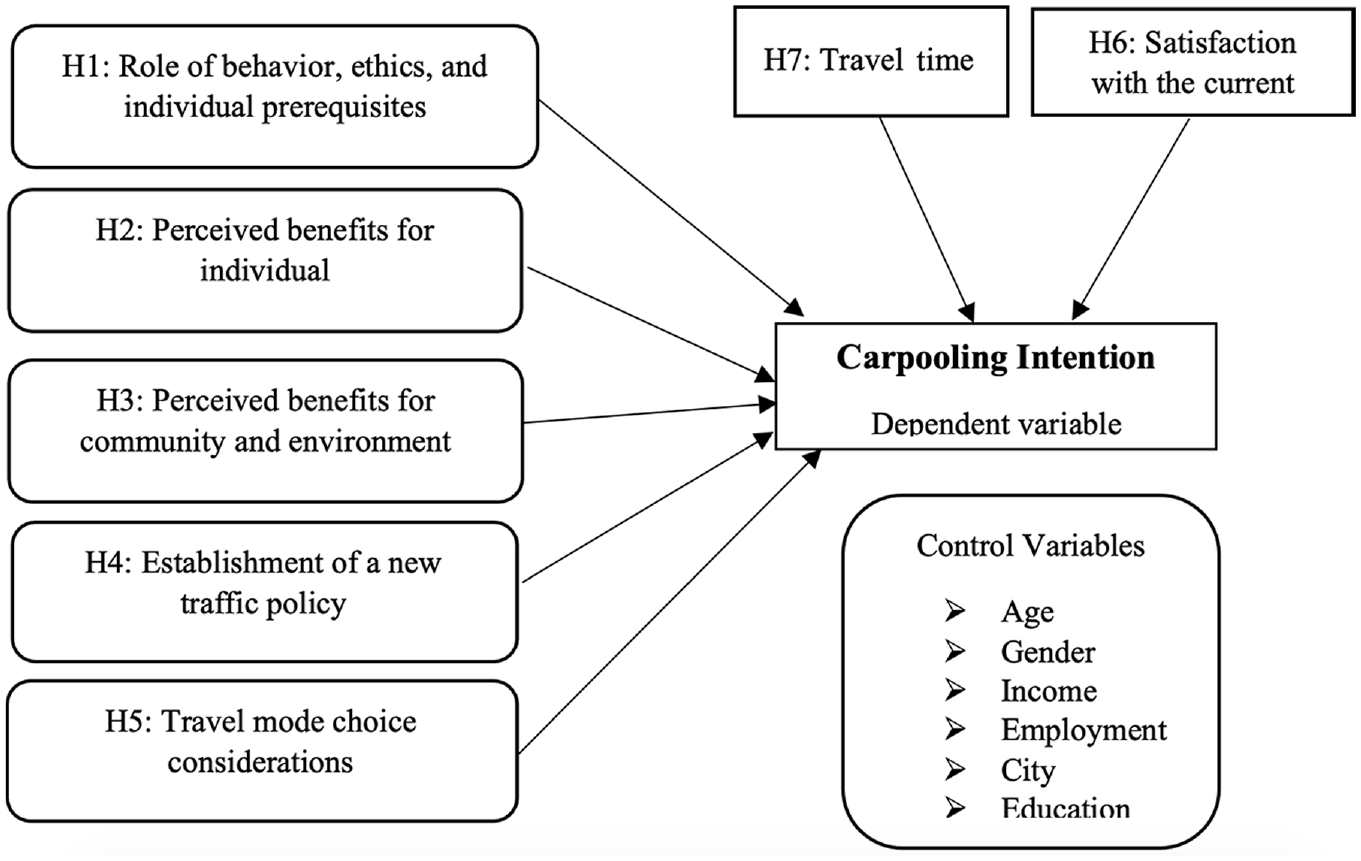
Conceptual framework for factors affecting Jordanian citizens’ intention to adopt carpooling.
Sample Selection and Data Collection
The research instrument used in this paper was a questionnaire to determine the main factors that may affect Jordanian citizens’ intention to adopt carpooling. The questionnaire is an extremely inexpensive method of data collection with regard to money and time compared with interview or other methods ( 69 ). Adopting the questionnaire as a method for gathering information will first provide a full description of opinions, attitudes, or trends for a sample, then a generalization about the population (in this case, Jordanian citizens) will be made.
The survey began with a short introduction to define carpooling and clarify the main objective of the questionnaire. The first section of the questionnaire collects economic and sociodemographic information about the respondents, including age, gender, current city of residence, education level, employment status, and income level. The second section is designed to obtain information about the main modes of travel for recent work and school trips and the estimated travel times of the trips. Respondents were asked to assess their current mode of travel using a symmetric 5-point Likert scale, with responses ranging from 1 (very dissatisfied) to 5 (very satisfied). Section three is designed to examine the respondents’ personal opinions with regard to the adoption of carpooling in Jordan, including factors inhibiting its spread, and the expectations of carpooling. The closed-ended question style with a 5-point Likert scale, ranging from 1 (strongly disagree) to 5 (strongly agree) was used for this section. According to Zohrabi ( 70 ), closed-ended questions are the preferred method of collecting quantitative study data. At the end of this section there is a comment question, also called an open-ended question ( 69 ). Respondents were asked to mention any other incentive that may encourage the driver to adopt carpooling as a mode of travel. The purpose of the question is to explore the differences and similarities between Jordanians’ ideas, as well as provide an opportunity for respondents to express any new ideas or future concerns.
Section four is designed to answer research question five. Respondents were asked to indicate on a 5-point Likert scale ranging from 1 (not important at all) to 5 (very important), the level of importance of six factors when choosing their mode of travel: comfort, flexibility, privacy, travel speed, impact on the environment, and affordability. The final section in the questionnaire was concerned with the endogenous variable, carpooling intention. This section utilized a symmetric 5-point Likert scale with the response categories “absolutely yes,”“yes,”“neutral,”“no,” and “definitely no” to indicate whether the respondents intended to adopt carpooling.
The online survey was created using Google Forms, which automatically saves the data to a Google Sheet. The online questionnaire was distributed to the respondents via email and by sharing the link on social media (i.e., WhatsApp, Facebook).
Before distributing the questionnaire to the participants, it was necessary to conduct a pre and pilot study. It is essential to analyze the questions from a respondent’s viewpoint. Once the design of the questionnaire is completed, several of the target population test it to ensure the simplicity and clarity of items and to review the survey questions to identify any problems with wording, grammar, the appropriateness of the intended meaning, diversity of ideas, and repetition. Most previous research has concluded that the best size for the pretest sample is 5 to 10 people from the field of the study. Therefore, the questionnaire was sent to 10 transportation engineers who speak Arabic as their native tongue. They were asked to check it accurately and provide full feedback on inclusion or exclusion of any questions. Following the pretest, a pilot study needed to be conducted. This serves many purposes, for example, ensuring validity and reliability. It is important to have a reliable measure to ensure consistent results ( 71 ). In this study, the total sample size is 630 valid responses. Hertzog ( 72 ) believes a pilot sample of 20% of the total sample size is quite enough; therefore, our pilot sample consisted of 130 people. Once the number of responses reached 130, a reliability test was done. Reliability can be measured using internal consistency by computing Cronbach’s alpha for each latent variable to see how close a group of measurement variables are to one unit. The range for coefficient alpha is from 0 to 1, and the closer to 1, the greater the consistency. The Cronbach’s alpha reliability coefficient (α) must be greater than 0.7 to accept the validity of the questionnaire and pass it on to the entire sample. The collected responses were entered into SPSS version 23. The internal consistency estimates (α) for the five constructs ranged from .70 to 0.86, which evidence good reliability. In general, the questionnaire items were all clear, easy to understand, and fully reflected the concepts that needed to be measured.
To check the validity and accuracy of responses, the data must first be cleaned. The first step is to deal with missing values; there is a requirement to answer each question in the questionnaire except the two open questions, so there is no missing data. To detect unengaged responses (when somebody fills in the survey but is not paying attention), a screening question has been written into section three whereby one item is duplicated but with a changed scale. Anyone who did not answer these two questions with the same category (e.g., “strongly agree”) was not paying attention, so there is a justification for removing their data. Another way to detect this kind of response is when someone answers with the same value for every question. This is called straightlining, and can be verified by using Microsoft Excel to compute the standard deviation for all Likert scale items for each respondent. If the standard deviation is zero, then we can consider this response as unengaged and remove it. To check the compatibility of respondents’ answers with the questions, we have arranged the data according to age. It is reasonable to assume that a retired person is old, and that a bachelor’s degree student is within the 18 to 24 age range as well as either without an income or only earning a low salary. In other words, we investigated the logic of the answers.
The study population is all Jordanian citizens of all ages, because the goal of this research is to understand why people have different views with regard to their intention to adopt carpooling or not. Therefore, a respondent does not need to be a worker or own a private car. However, we tried to focus on the three most urbanized areas, namely, Amman, the capital, Zarqa, northeast of Amman, and Irbid, the second largest metropolitan population in Jordan after Amman.
It is necessary to sample this population to test the theory and hypotheses and validate the chosen variables. One of the main advantages of SmartPLS is its capability of handling a small sample size (e.g., less than 100) ( 73 ), whereas a larger sample size will produce more accurate results and improve the statistical power. The minimum R2 method is built on Cohen’s ( 74 ) power tables and is based on three elements: the minimum R2 in the model in any endogenous variable in the model; the significance level used, usually 5%; and the maximum number of arrows pointing at a construct. In our model, the maximum number of structural paths pointing at a latent variable is nine. Based on this method, the minimum sample size is 181 based on 80% statistical power and a 5% probability level for detecting R2 values of at least 10%. Previous studies have suggested that the minimum sample size for SEM should be 100 to 200 ( 75 ).
Data Analysis and Discussion
Descriptive Statistics
The number of valid responses collected in this study was 630 ( 76 ). Table 1 summarizes the economic and sociodemographic distribution of the respondents. Of these, 53.8% were females (N = 339). This percentage is representative of Jordanian society. There are respondents from different age groups, that is, from the age of 14 to the age of 65. The average age of our respondents was 27.5 years of age. The largest group of participants was young people: 47.1% of participants were in the 18 to 25 age group.
Economic, Sociodemographic, and Current Travel Mode Distribution of Respondents (n = 630)
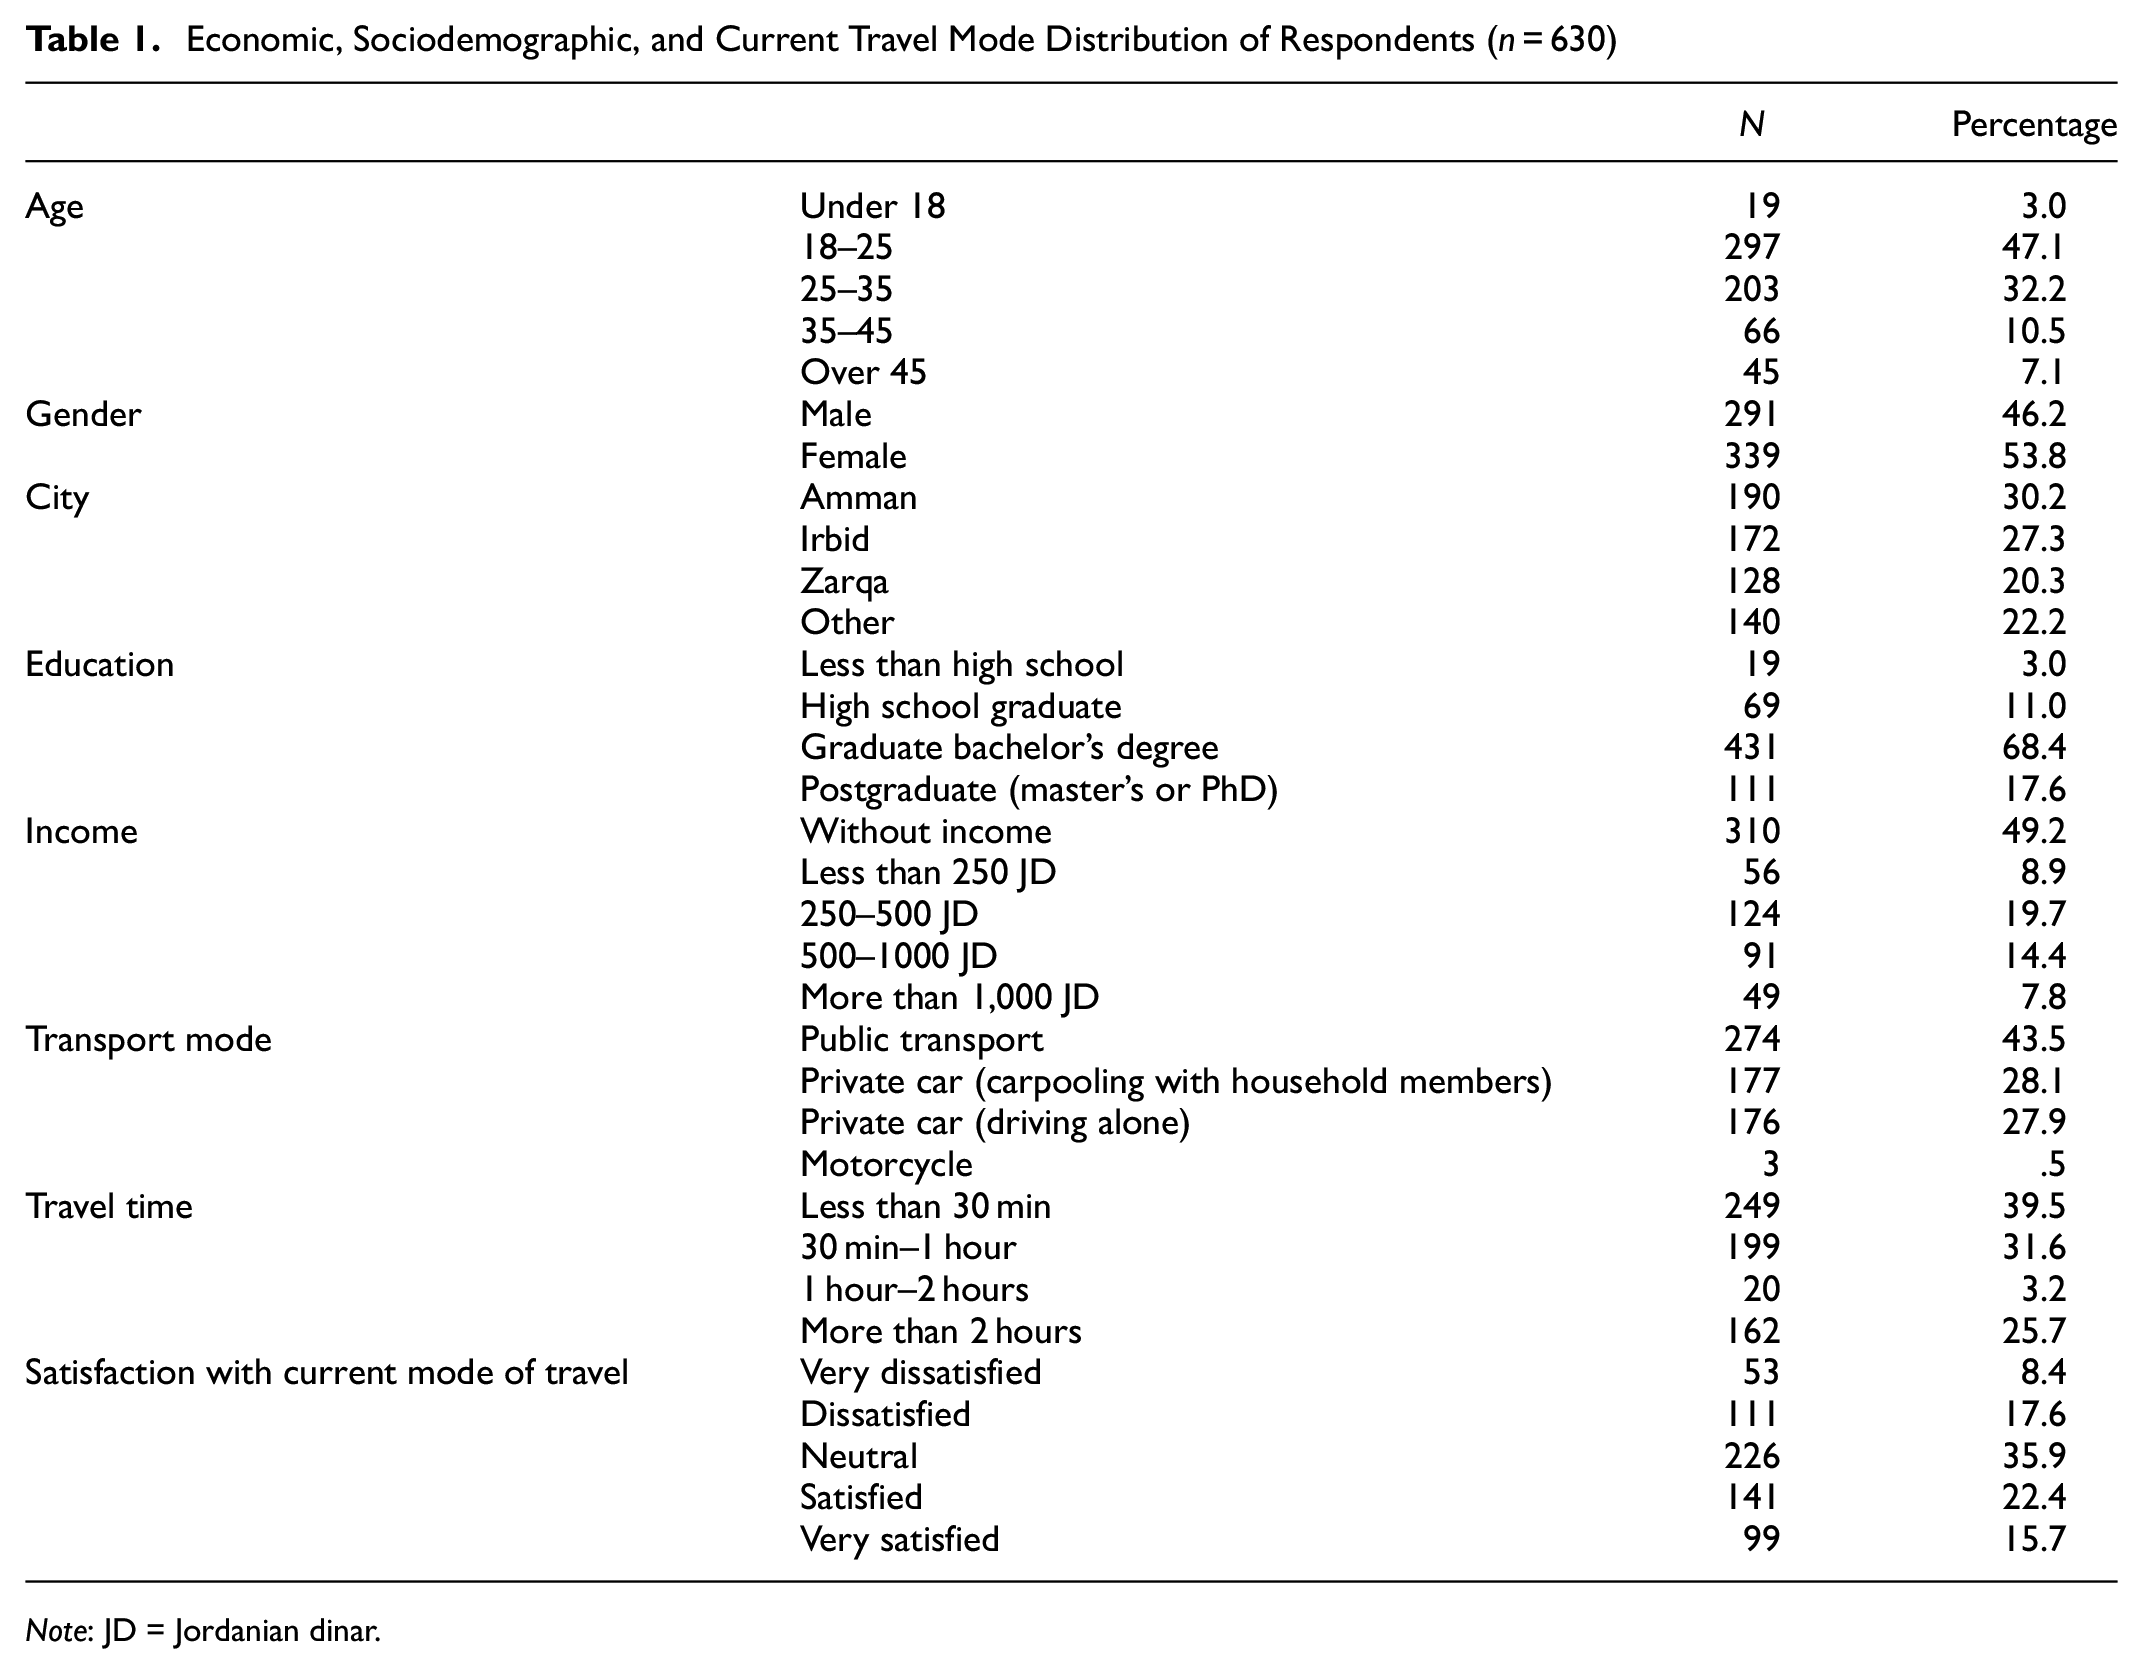
Note: JD = Jordanian dinar.
With regard to city, 30.2% (N = 190) of respondents were from Amman city, followed by Irbid city (27.3%, N = 172). This distribution of the respondents was proportional to the population distribution in Jordan. With regard to education level, 68.4% (N = 431) of the participants had a bachelor’s degree or were currently undergraduate students. Further, 17.6% (N = 111) of the participants were postgraduates and they had completed a master’s or doctoral degree. Of the respondents, 55% were not working and the majority of them were students. Employees either worked part-time (9%, N = 57) or full-time (34.4%, N = 217). As far as income level was concerned, the largest group was comprised of those without a salary (49.2%, N = 310). Next came participants with an income level of between 250 and 500 JD (19.7%, N = 124), and then individuals with an income of between 500 and 1,000 JD (14.4%, N = 91). The remaining groups contain fewer individuals: 7.8% of the participants earn more than 1,000 JD, whereas 8.9% earn an income of less than 250 JD. (Note: 1 JD = 1.41 USD). The respondents were asked to select their current mode of travel. Of the participants, 43.5% (N = 274) used public transport. Most of the respondents use private cars, either driving alone (27.9%, N = 176) or carpooling with household members (28.1%, N = 177). For 39.5% of the participants, their trips take less than 30 min, although 25.7% (N = 162) take more than two hours to travel to work/school. The mean of the satisfaction variable was 3.19 (SD = 1.153). The majority of the participants were neither satisfied nor dissatisfied with their current mode of travel (neutral).
The mean and standard deviation were used to present Likert scale data as summarized in Table 2. These statements were designed to determine the main factors that may affect Jordanian citizens’ intention of adopting carpooling. SPSS version 23 was used to analyze the data and compute the frequency tables. The 5-point Likert scale was used to formulate the items in this part of the questionnaire.
Mean and Standard Deviation of Likert Scale Items
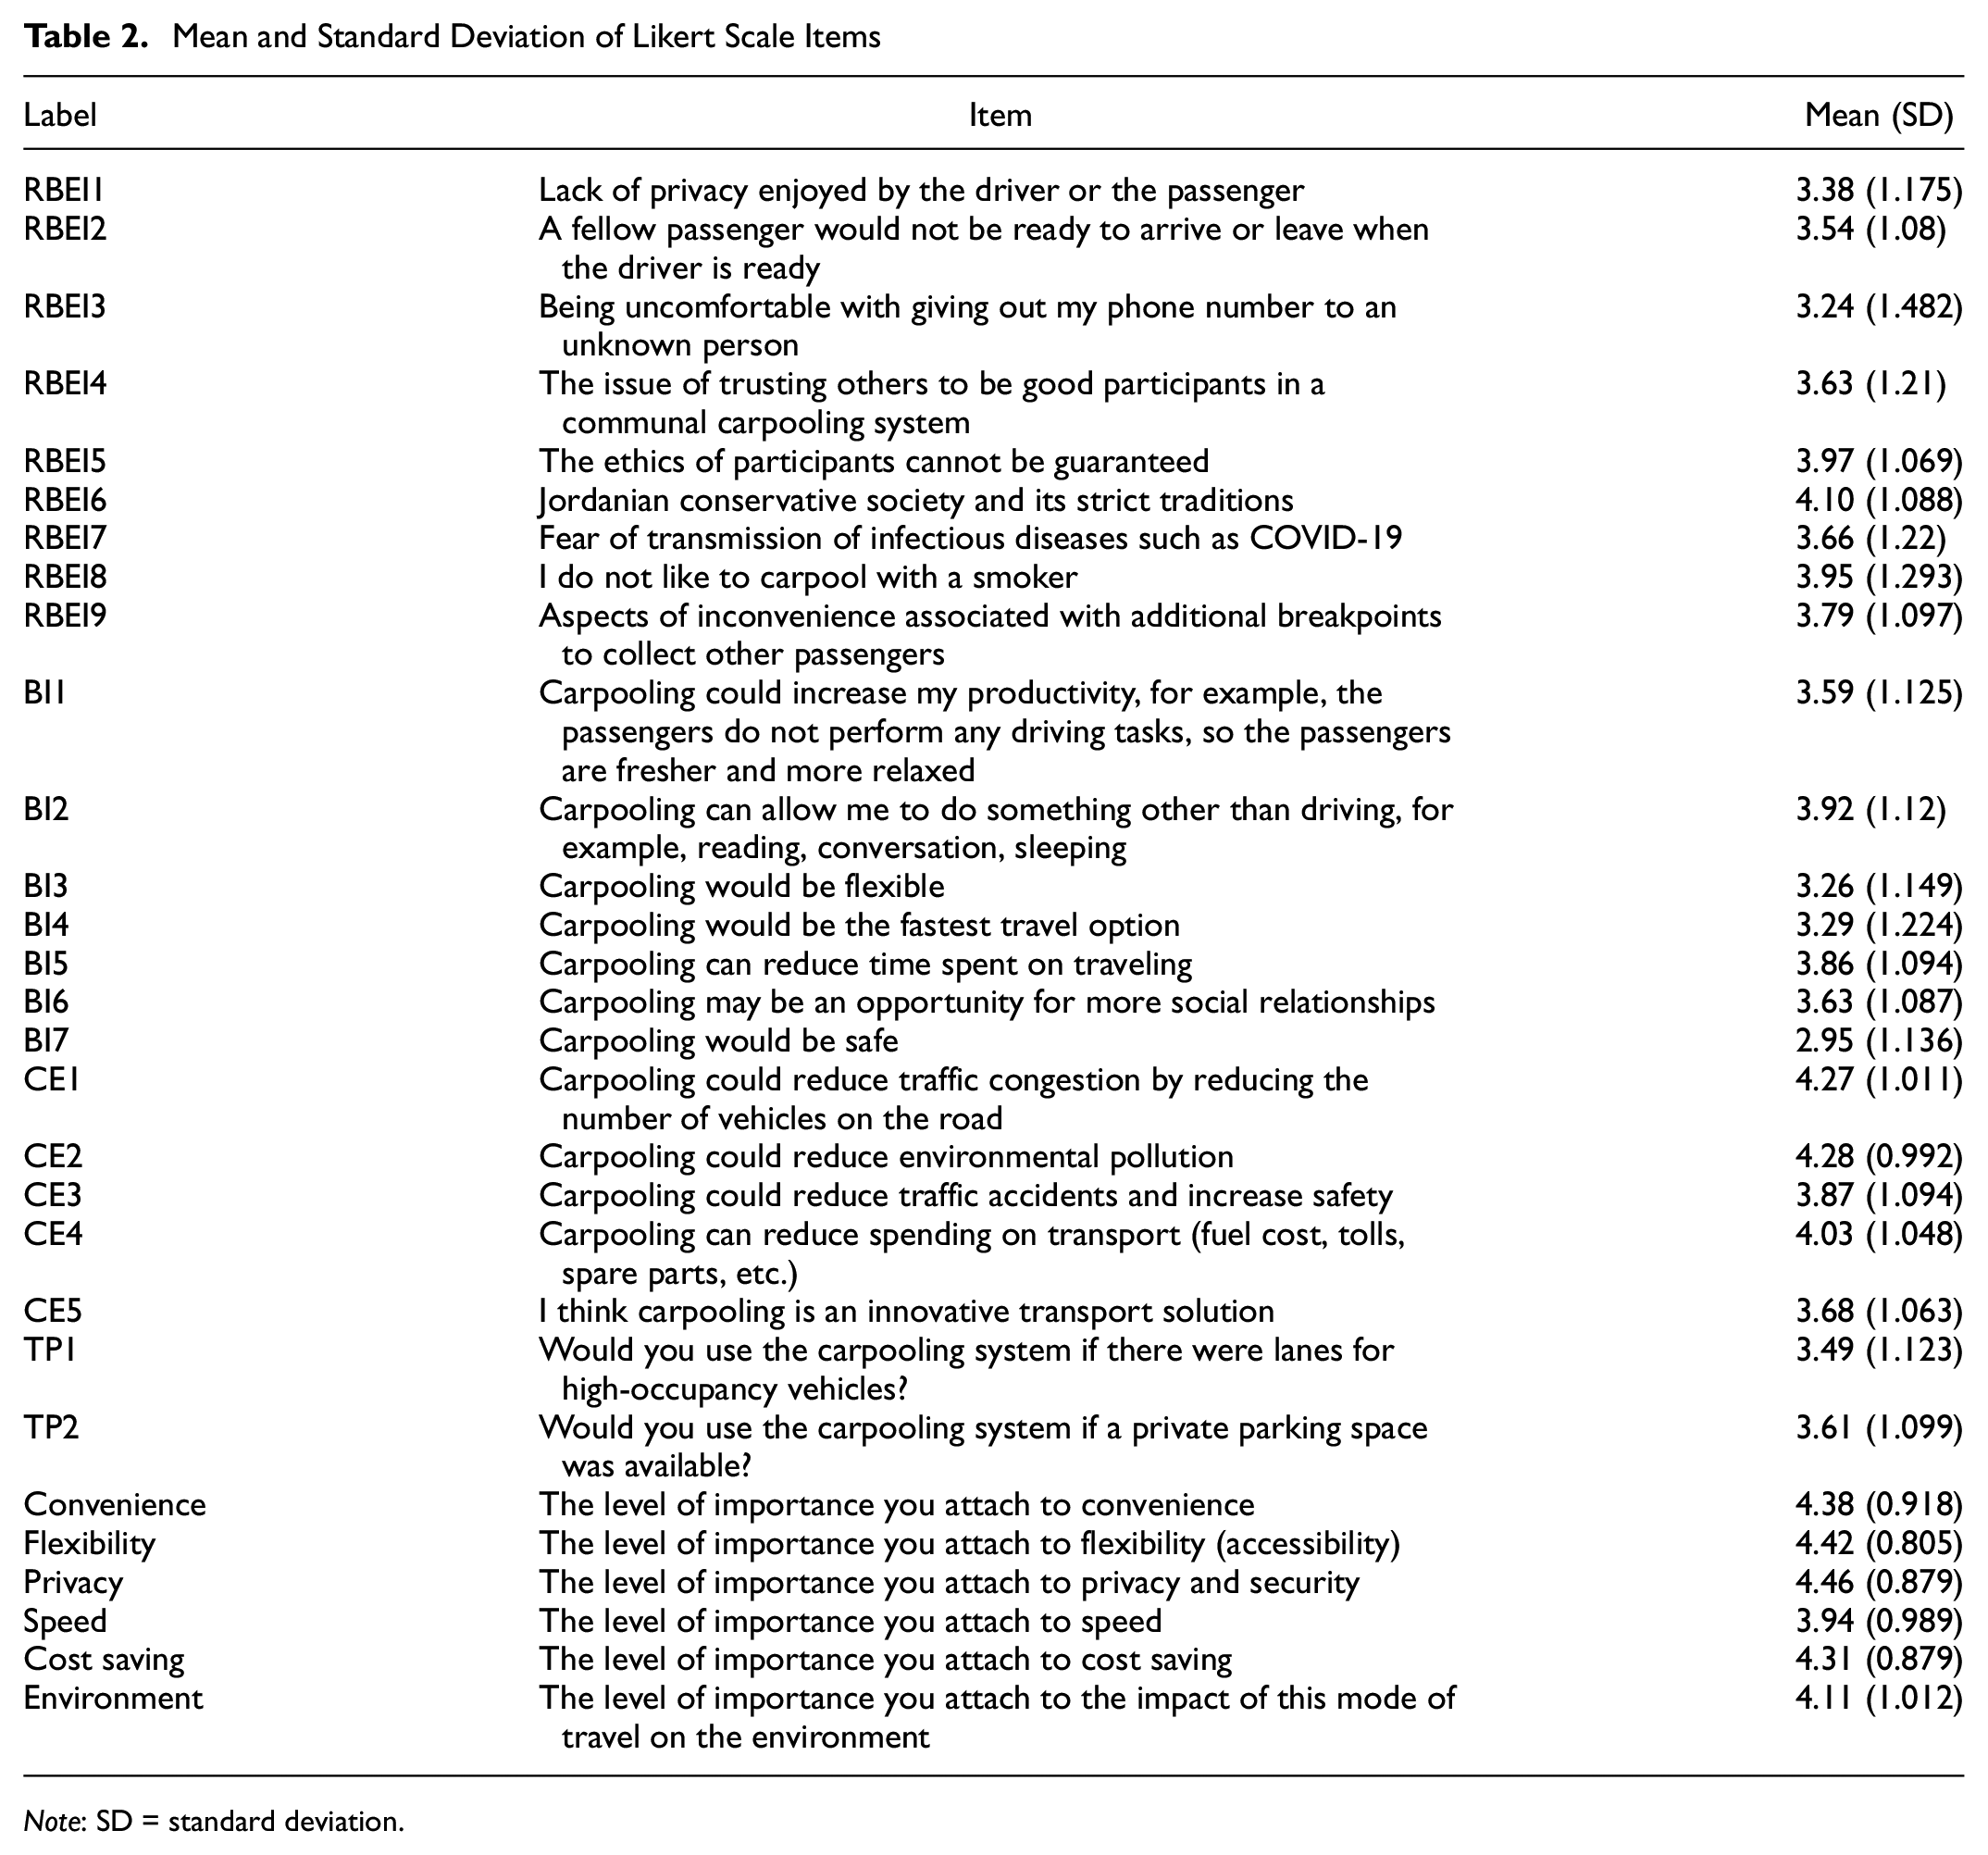
Note: SD = standard deviation.
According to Dewberry ( 77 ), there are five categories to which the mean belongs. The category is defined by finding the length of the range and then dividing the range by the number of categories. In the five Likert scales, the length of the category is 4 divided by 5, which is 0.8. Therefore, the data were grouped by using a classification guide as follows: 1 to 1.8 is strongly disagree; 1.81 to 2.6 is disagree; 2.61 to 3.4 is neutral; 3.41 to 4.2 is agree; and 4.21 to 5 is strongly agree. For the first latent variable, the mean of RBEI1 and RBEI3 is within the “neutral” range, whereas the mean of RBEI2, RBEI4, RBEI5, RBEI6, RBEI7, RBEI8, and RBEI9 is within the “agree” range. According to the frequency table, the vast majority of the respondents agreed with the statement items, although 35.7% of the participants disagreed with the statement RBEI3. The statement the largest number of respondents agreed with was RBEI6 (N = 471), followed by RBEI5 (N = 455), and then RBEI8 (N = 425). As expected by Hensher ( 57 ), the spread of COVID-19 has increased people’s reluctance to adopt carpooling, and the results show that more than 60% of the respondents believe that carpooling may increase the spread of COVID-19.
The second latent variable that was investigated is PBI as a result of adopting carpooling. The mean of BI3, BI4, and BI7 is within the “neutral” range, whereas the mean of BI1, BI2, BI5, and BI6 is within the “agree” range. The highest standard deviation was 1.224 for BI4, followed by 1.149 for BI3. The reason for the variation in the respondents’ answers for the two statements BI3 and BI4 is the service quality. If there is an organization, company, or any official institution that organizes the carpooling process, or if there is a mobile application that facilitates the agreement between participants, the flexibility and speed will increase. Because all matters relating to the trip with regard to meeting place and departure time will be agreed in advance, there will be no wasted time. It is worth mentioning that 73% of the respondents agree that carpooling can allow them to do other things when being driven. In addition, 60% of the respondents agree that carpooling may be an opportunity to form additional social relationships. However, 31% of the participants consider carpooling unsafe; this is a large percentage compared with other negative percentages for the PBI latent variable. Safety can be increased by matching carpoolers who work at the same company or university. Thus, the level of trust increases.
The next latent variable that was examined is PBCE as a result of adopting carpooling. The mean of CE5 is within the “neutral” range, whereas the mean of CE3 and CE4 is within the “agree” range. In addition, there were two items, CE1 and CE2, that had a mean within the “strongly agree” range. The highest standard deviation was 1.094 for CE3, followed by 1.063 for CE5. The vast majority of the respondents (more than half) agreed with all statements. The statement the fewest respondents agreed with was CE5 (N = 383, 60.79%), followed by CE3 (N = 416, 66.03%), the reason being that accidents in Jordan constitute a major health problem and are the second leading cause of death in the country ( 78 ). Consequently, the number of residents adopting carpooling as a mode of transport will not greatly affect the problem of accidents in Jordan because the issue needs radical solutions and cooperation from everyone, especially because accidents are a complex phenomenon. Only 7.1% of the participants disagreed that carpooling could reduce traffic congestion by reducing vehicle numbers on the road, and 7% of the participants disagreed that carpooling could reduce environmental pollution.
The next latent variable considered is Jordanian citizens’ travel mode choice considerations or priorities. This section used a 5-point Likert scale consisting of categories as follows: “not important at all,”“not important,”“neutral,”“important,” and “very important.” They were ranged from 1 to 5 by using Dewberry’s ( 77 ) rating guide. The mean of the data was grouped as follows: 1 to 1.8 is not important at all; 1.81 to 2.6 is not important; 2.61 to 3.4 is neutral; 3.41 to 4.2 is important; and 4.21 to 5 is very important. The respondents attached a high level of importance to all factors: the mean of convenience, flexibility, privacy, and cost saving was in the “very important” range; and the mean of the environment and speed was within the “important” range. The standard deviation for all items was less than 1, except for the environment, which was 1.012. According to the frequency table, more than 70% of the respondents agreed that all of these factors are important when making their daily travel mode choices. Flexibility is the most important factor from the respondents’ point of view (88.1%), followed by privacy and convenience (85.4%). The least important factor is speed (71.1%), followed by the environment (74.1%).
The final latent variable examined is establishment of a new TP, and the mean of the two items is within the “yes” range. However, the mean of TP2 is larger than TP1, although the standard deviation (magnitude of spread around the mean) for TP1 is larger than TP2. Of the respondents, 54.6% would adopt carpooling if a private parking space was provided. In addition, 47.1% of the respondents would adopt carpooling if there were lanes for HOVs. Further, 36.2% and 29.4% of the respondents were reluctant to use carpooling even if a private parking space or HOVs were provided, respectively. In Jordan, large cities experience a considerable shortage of parking spaces ( 79 ). Thus, the time spent in finding a space will decrease if preferential parking for carpoolers is provided. The space allocated for employee parking and the attendant parking facilities required will both be reduced; therefore, providing private parking spaces for carpoolers is mutually beneficial for both employer and employees ( 31 ). In addition, access to HOV lanes is an influential factor in choosing to adopt carpooling, and Li et al. ( 29 ) reached the same conclusion. Providing access to the HOV lane for carpoolers will increase convenience and reduce travel time ( 31 ), and is the reason respondents agreed to adopt carpooling if HOV lanes are available. Benita ( 23 ) stated that some governments in the U.S.A. had introduced financial incentives and subsidies to encourage people to adopt carpooling. However, in Jordan, offering financial incentives is extremely complicated because of difficulties in relation to the financial situation. Therefore, it has not been studied as a motivational factor.
The final section in the questionnaire examined the endogenous variable carpooling intention. This section utilized a symmetric 5-point Likert scale consisting of the response categories “absolutely yes,”“yes,”“neutral,”“no,” and “definitely no” to indicate whether the respondents intended to adopt carpooling. The mean of the respondents was 3.403 and the standard deviation was 1.07. About half of the respondents intended to adopt carpooling (N = 307, 48.7%), whereas 18.9% had no intention of adopting it (N = 119). Further, 32.4% of them were not sure if they would adopt carpooling (N = 204).
Measurement Model Analysis
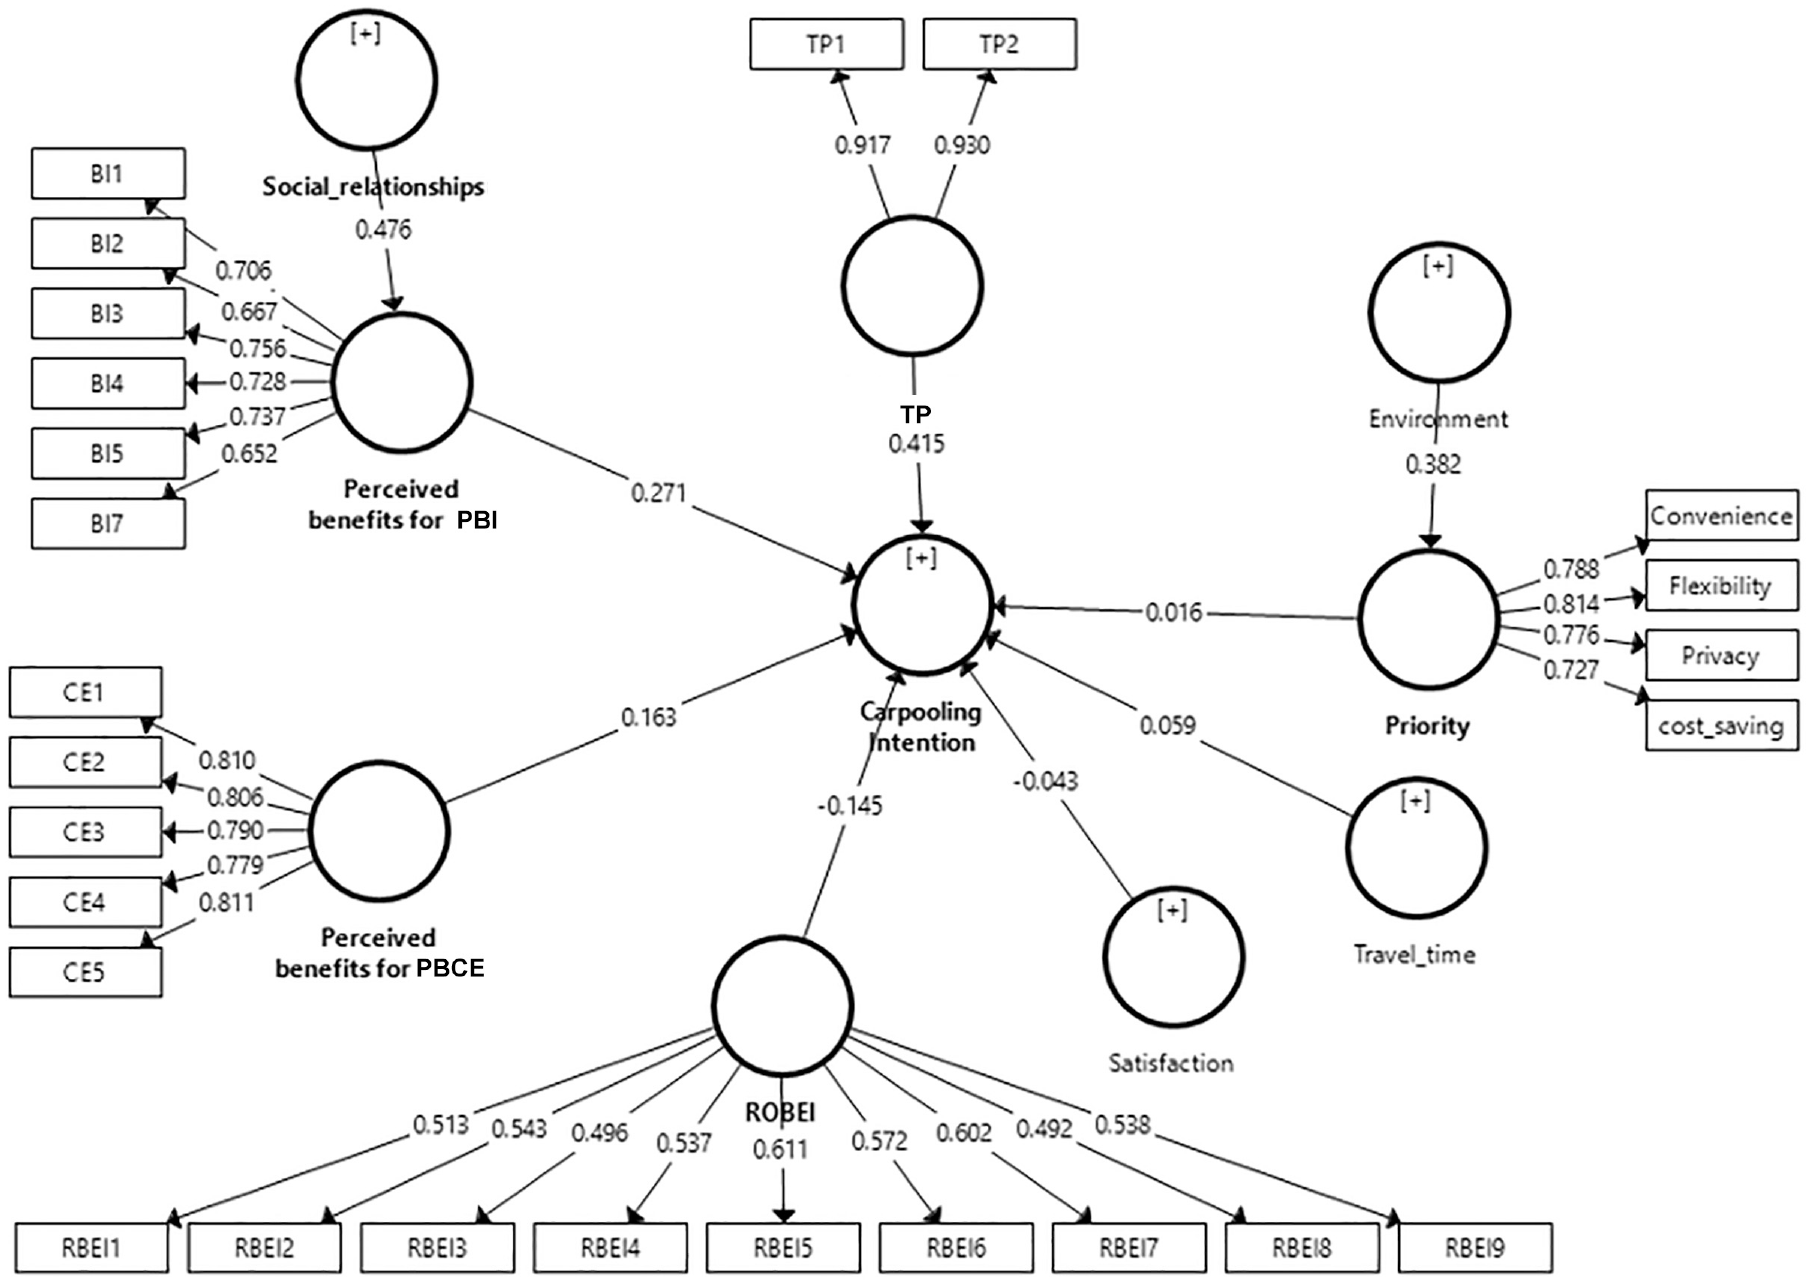
Examination of the PLS-SEM model starts with the measurement model (outer model) with regard to the reliability and validity of the latent variables. This step was important to ensure the appropriateness of the latent variables in the path model. Analysis of the measurement model was conducted by configuring the PLS algorithm. There are many points in evaluating the reflective measurement model. The first one is related to factor loading, which is the correlation between each indicator and the construct; this is also called indicator reliability. As a general rule of thumb, the outer loading should be more than 0.7, and any indicators with an outer loading of less than 0.4 should be removed ( 80 ). The decision to remove indicators with an outer loading of between 0.4 and 0.7 is based on the impact on internal consistency and reliability. In addition, Hair et al. ( 81 ) suggested that all outer loadings for indicators should be above 0.4. As shown in Figure 2, all values of the PBCE, priority, and TP indicators were higher than the 0.7 value. For the PBI outer loading evaluation, two indicators (BI2, BI7) had a value below 0.7 and were retained for overall consistency. With regard to the ROBEI outer loading, all indicators had values between 0.4 and 0.7, thresholds recommended by Hair et al. ( 81 ).
Measurement model analysis findings.
A second criterion is internal consistency, which provides an estimate of the overall reliability based on the collection of heterogeneous indicator variables. The traditional criterion for assessing internal consistency is Cronbach’s alpha. This is a conservative and less precise measure of internal consistency reliability, because the indicators are unweighted (i.e., have equal outer loadings on the latent variable). Another measure of internal consistency is composite reliability (CR), which considers the different outer loadings of the items. A higher value of CR or Cronbach’s alpha indicates a higher level of reliability: the value is between 0 and 1. A minimum value of internal consistency should be 0.7. A value above 0.95 is problematic, because this is an indication of the existence of redundant items. Or, it may indicate the presence of undesirable response patterns such as straightlining, and this may threaten construct validity. Because Cronbach’s alpha underestimates the internal consistency and CR overestimates it, the construct’s true reliability lies between Cronbach’s alpha and CR (two extreme values) ( 73 , 82 ). As shown in Table 3, Cronbach’s alpha for all constructs was between 0.704 and 0.865, that is, greater than 0.7 and less than 0.95. With regard to CR, all values exceed the threshold, with values as follows: 0.858 (PBI), 0.898 (PBCE), 0.792 (ROBEI), 0.859 (priority), 0.92 (TP). Because the construct’s true reliability lies between Cronbach’s alpha and CR, all five reflective constructs have high levels of internal consistency reliability.
Findings of Internal Consistency Reliability and Convergent Validity
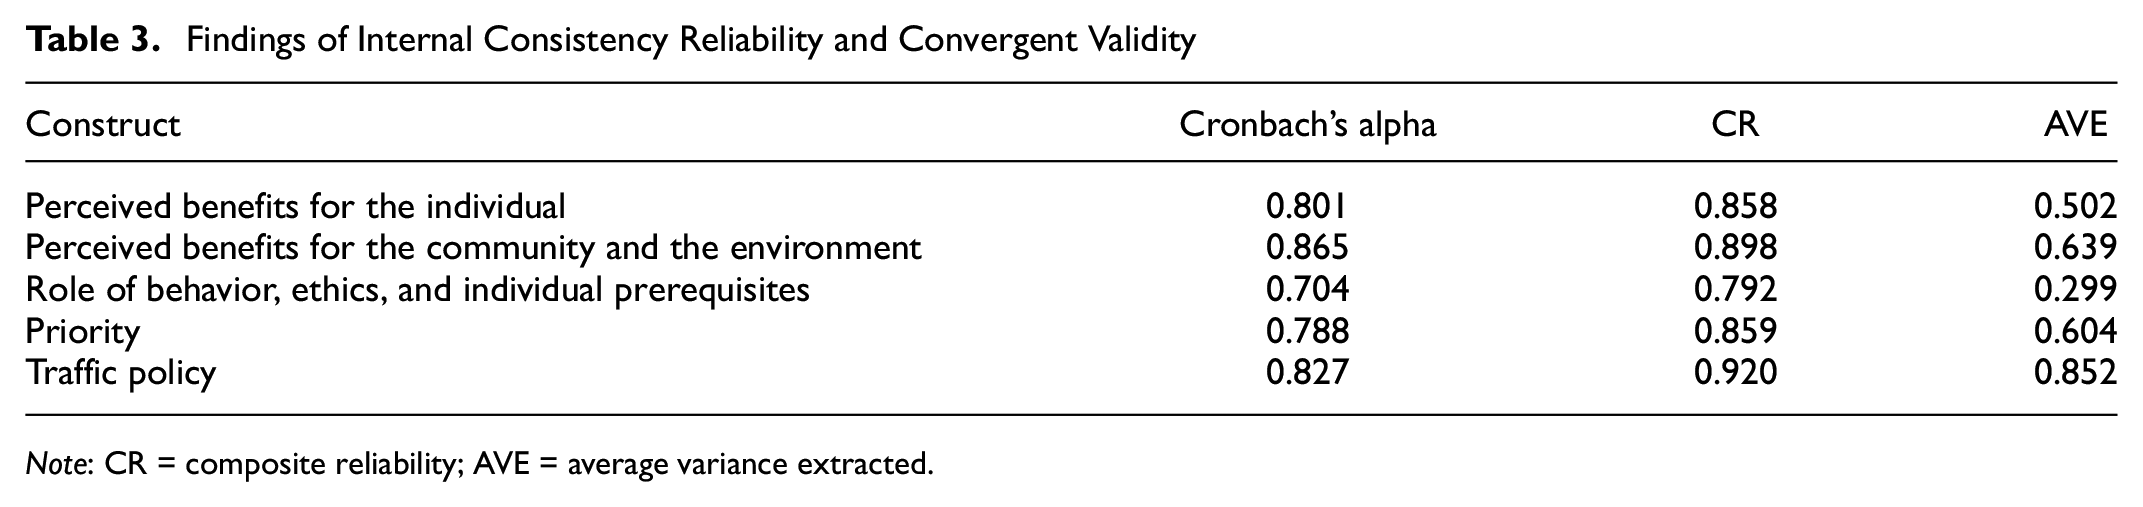
Note: CR = composite reliability; AVE = average variance extracted.
A third criterion is convergent validity, which is the degree to which the indicators positively correlate to measure the same concept (construct). Convergent validity is assessed based on average variance extracted (AVE), which indicates the level of validity of the latent variable ( 81 ). The AVE value ranges between 0 and 1, and it should be more than 0.5 (explained 50% of the variance). The AVE values are as follows: PBI (0.502), PBCE (0.639), ROBEI (0.299), priority (0.604), and TP (0.852). Thus, the indicators of the four reflective constructs (PBI, PBCE, priority, and TP) are highly related and have high levels of convergent validity, because the AVE values are above the required minimum level of 0.50. Clearly, ROBEI explains only 30% of the variance. This latent variable measures the effect of the different behaviors and morals of the participants and their desire to adopt carpooling. All the measurement items had a factor loading of more than 0.4 and they were reliable and consistent. It is known that it is difficult to measure behaviors, and there are large differences in the opinions of the respondents. In addition, Malhotra and Dash ( 83 ) found that the adoption of AVE only is often too strict.
The next step in reflective measurement model evaluation is to assess the discriminant validity to ensure the uniqueness of constructs compared with other latent constructs. SmartPLS 3 offers three means of assessing the discriminant validity: cross-loading; the Fornell–Larcker criterion; and the Heterotrait–Monotrait ratio (HTMT).
The first approach is cross-loading, in which the outer loading of the items on their constructs should be more than any of their cross-loadings on the other constructs in the model. Table 4 shows that all indicators had an outer loading value larger than any cross-loading values of all other constructs. Note that the cross-loading values for the associated indicators for each construct are in bold. For example, the indicator BI5 has a cross-loading with its corresponding construct PBI (0.737) higher than all cross-loadings with other constructs (0.434, 0.025, 0.206, and 0.249). Therefore, the cross-loading criterion provides evidence for the constructs’ discriminant validity.
Findings of the Cross-Loading Criterion
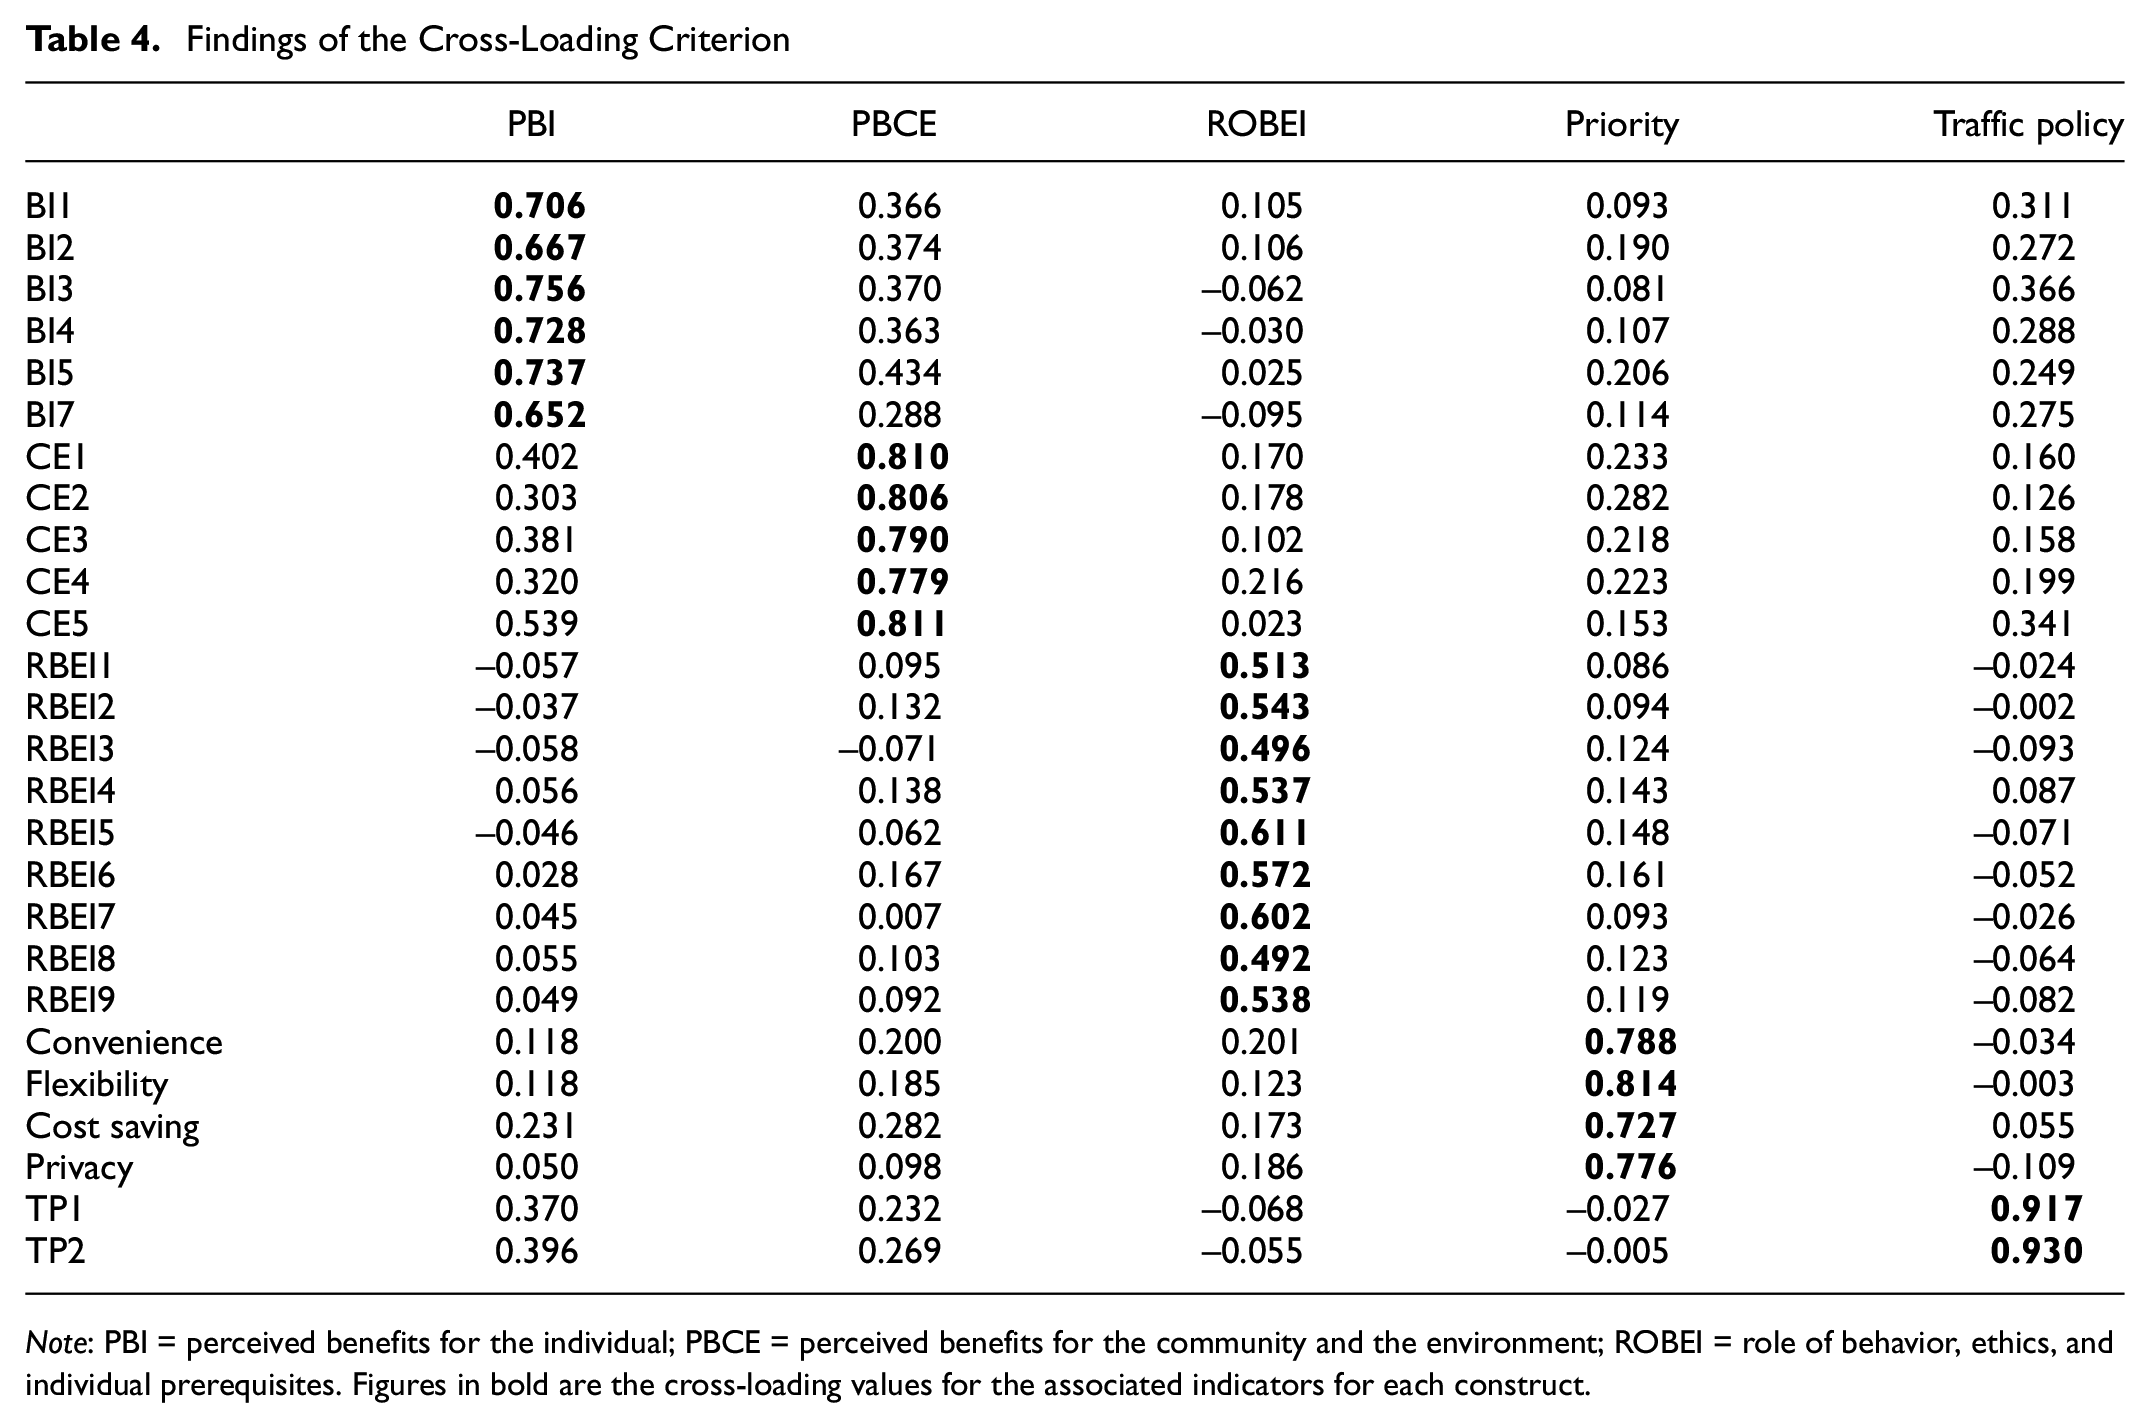
Note: PBI = perceived benefits for the individual; PBCE = perceived benefits for the community and the environment; ROBEI = role of behavior, ethics, and individual prerequisites. Figures in bold are the cross-loading values for the associated indicators for each construct.
Fornell and Larcker ( 84 ) suggested that the discriminant validity can be assessed by comparing the square root of the AVE for one construct with the correlation with other constructs. The shared variance between each construct and its indicators should be greater than the variance shared between this construct and any other construct. In Table 5 the diagonal values are the square root of the AVE for the construct, and the off-diagonal values are the correlations between the constructs. The results show that AVE2 for each construct (e.g., 0.709 for the PBI variable) is higher than all the correlations between PBI and other constructs (0.184, 0.007, 0.415, and 0.516). Thus, there was no problem with discriminant validity.
Findings of the Fornell–Larcker Criterion
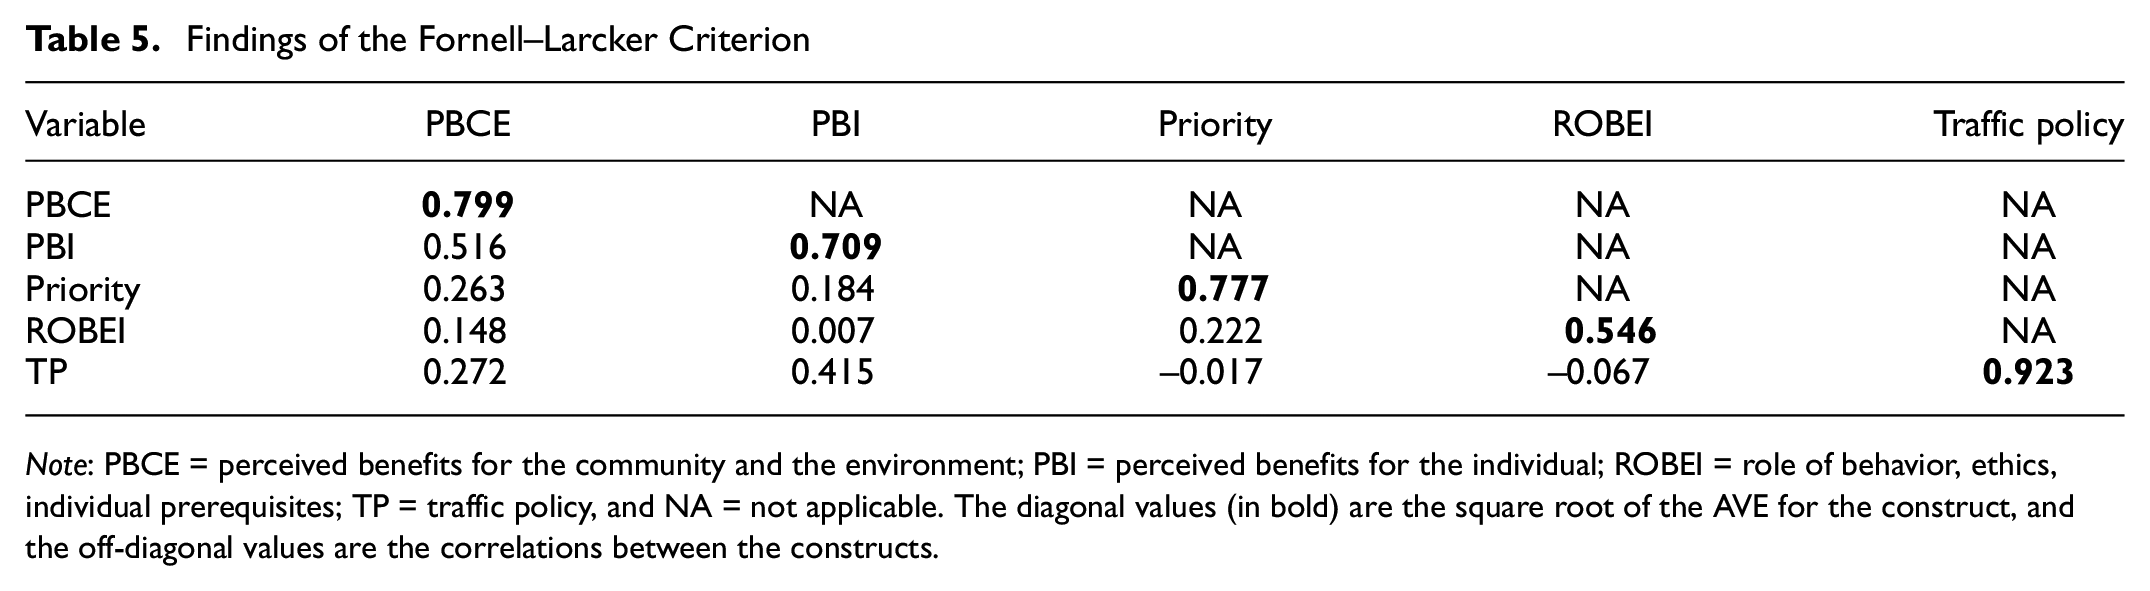
Note: PBCE = perceived benefits for the community and the environment; PBI = perceived benefits for the individual; ROBEI = role of behavior, ethics, individual prerequisites; TP = traffic policy, and NA = not applicable. The diagonal values (in bold) are the square root of the AVE for the construct, and the off-diagonal values are the correlations between the constructs.
Recent research found that neither cross-loading nor the Fornell–Larcker criterion approach are reliable in detecting the lack of discriminant validity. Henseler et al. ( 85 ) proposed an alternative approach for assessing discriminant validity, namely, HTMT, which is an estimate of the true correlation between two constructs and is called disattenuated correlation. The HTMT ratio is computed by dividing the correlations of indicators across two different constructs by the correlations of indicators measuring the same construct. In other words, HTMT is the ratio of the between-construct correlations to the within-construct correlations ( 73 ). Therefore, a ratio close to 1 indicates discriminant validity problems. The researchers identified that a lack of discriminant validity happens when the HTMT ratio is above 0.9. The more conservative threshold is 0.85 ( 85 ). Table 6 shows the HTMT values for all pairs of constructs; all of them are less than 0.85 (the more conservative threshold value). The lower and upper bound of the 95% confidence interval does not include 1. For example, the 2.5% and 97.5% upper and lower bound, respectively, of the 95% confidence interval for the relationship between PBCE and PBI are 0.497 and 0.658, respectively. The HTMT criterion supports discriminant validity, and each construct was a valid measure of distinctive concepts.
Findings of the Heterotrait–Monotrait Ratio
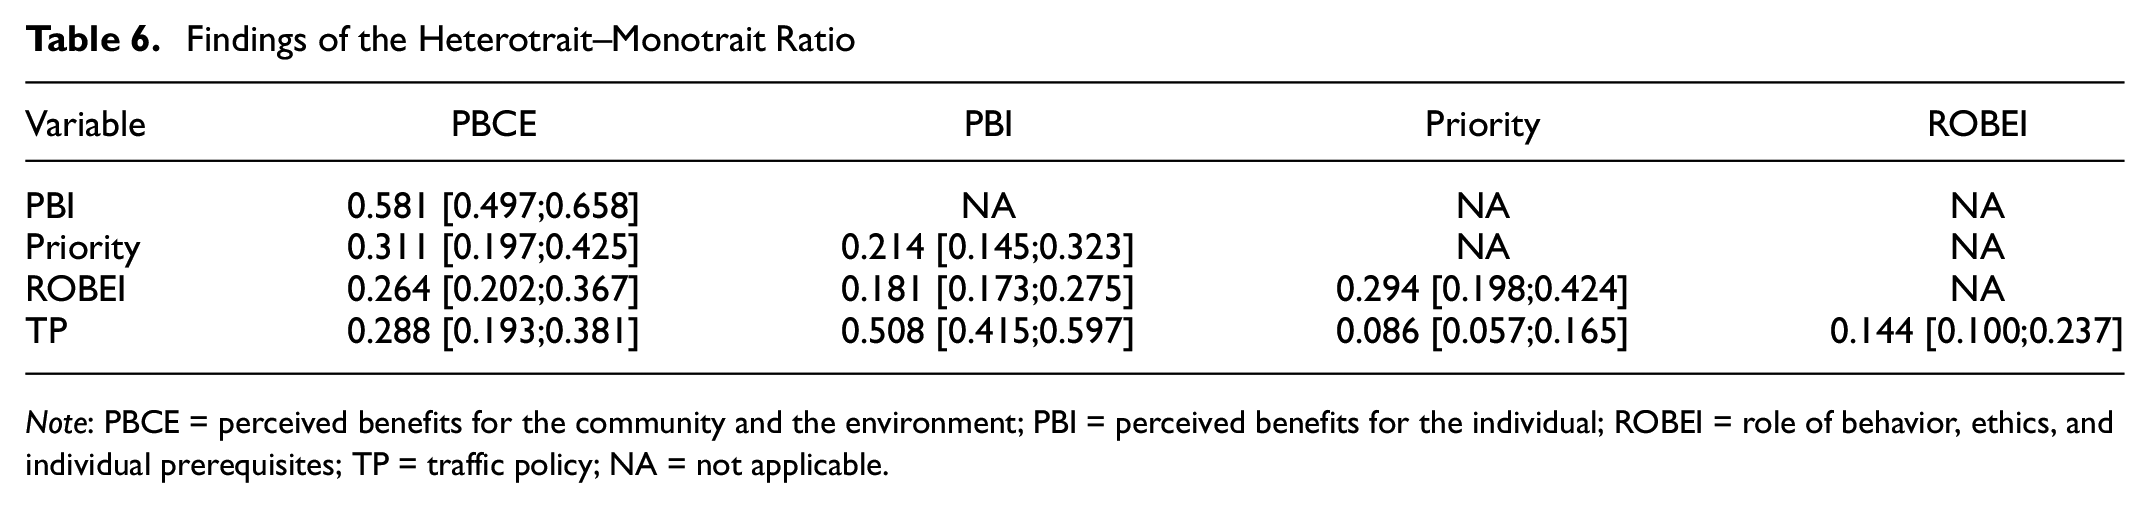
Note: PBCE = perceived benefits for the community and the environment; PBI = perceived benefits for the individual; ROBEI = role of behavior, ethics, and individual prerequisites; TP = traffic policy; NA = not applicable.
Structural Model Analysis
The structural model is the inner model that shows the relationship between constructs. The assessment of the structural model involves evaluating the model’s predictive capabilities and determining the strength or even the direction of path coefficient values.
The first step in assessing the structural model is a collinearity assessment. Collinearity issues happen when two constructs are highly correlated, in which case the path coefficients might be biased. The variance inflation factor (VIF) was used to predict the presence of collinearity, where VIF is the reciprocal of a tolerance value. VIF values of less than 5 or tolerance values above 0.2 are acceptable ( 63 ). VIF values for all exogenous constructs were as follows: PBCE: 1.493; PBI: 1.582; priority: 1.141; ROBEI: 1.079; satisfaction: 1.114; TP; 1.245; and travel time: 1.131. All values are below the threshold of 5, providing evidence that no collinearity issues existed in the structural model.
The standardized beta coefficients were obtained after running the PLS-SEM algorithm. To test the significance of these path coefficients, a bootstrapping procedure is required in the PLS-SEM model ( 73 ). The path coefficients range from -1 to +1. As the value gets close to 1 in either sign, the strength of the relationship increases. When the path coefficient (standard beta) is positive, the association is positive, and when it is negative, the association is negative. An empirical t-value has been computed for all path coefficients by using a bootstrapping procedure in which the t-statistic is the original mean (standard beta) divided by standard deviation. A path coefficient is statistically significant when the t-statistic is greater than the critical t-value. The critical value for two-tailed tests at a 5% probability level is 1.96. Therefore, a significant relationship occurs when the t-statistic is greater than 1.96 and, subsequently, when the p-value is less than 0.05.
Table 7 presents the path coefficient. The stronger significant relationship is the TP to carpooling intention with a positive path coefficient of 0.415 and t-value of 10.942. The relationships between PBCE and PBI and carpooling intention are positive and significant with t-values of 4.574 and 7.032, respectively. Shaheen et al. ( 31 ) indicated empirical and anecdotal evidence of the importance of individual benefits for encouraging carpooling. Although most drivers understand the benefits of carpooling, they are unwilling to sacrifice the flexibility and comfort of a private car ( 55 ). The path coefficient from travel time to carpooling intention is 0.059. It is a small positive relationship, but is significant with a t-value of 2.012. An observed overall trend is that the adoption of carpooling is directly proportional to travel time, as also concluded by many other studies ( 46 , 49 ).
Bootstrapping Results for the Path Coefficients
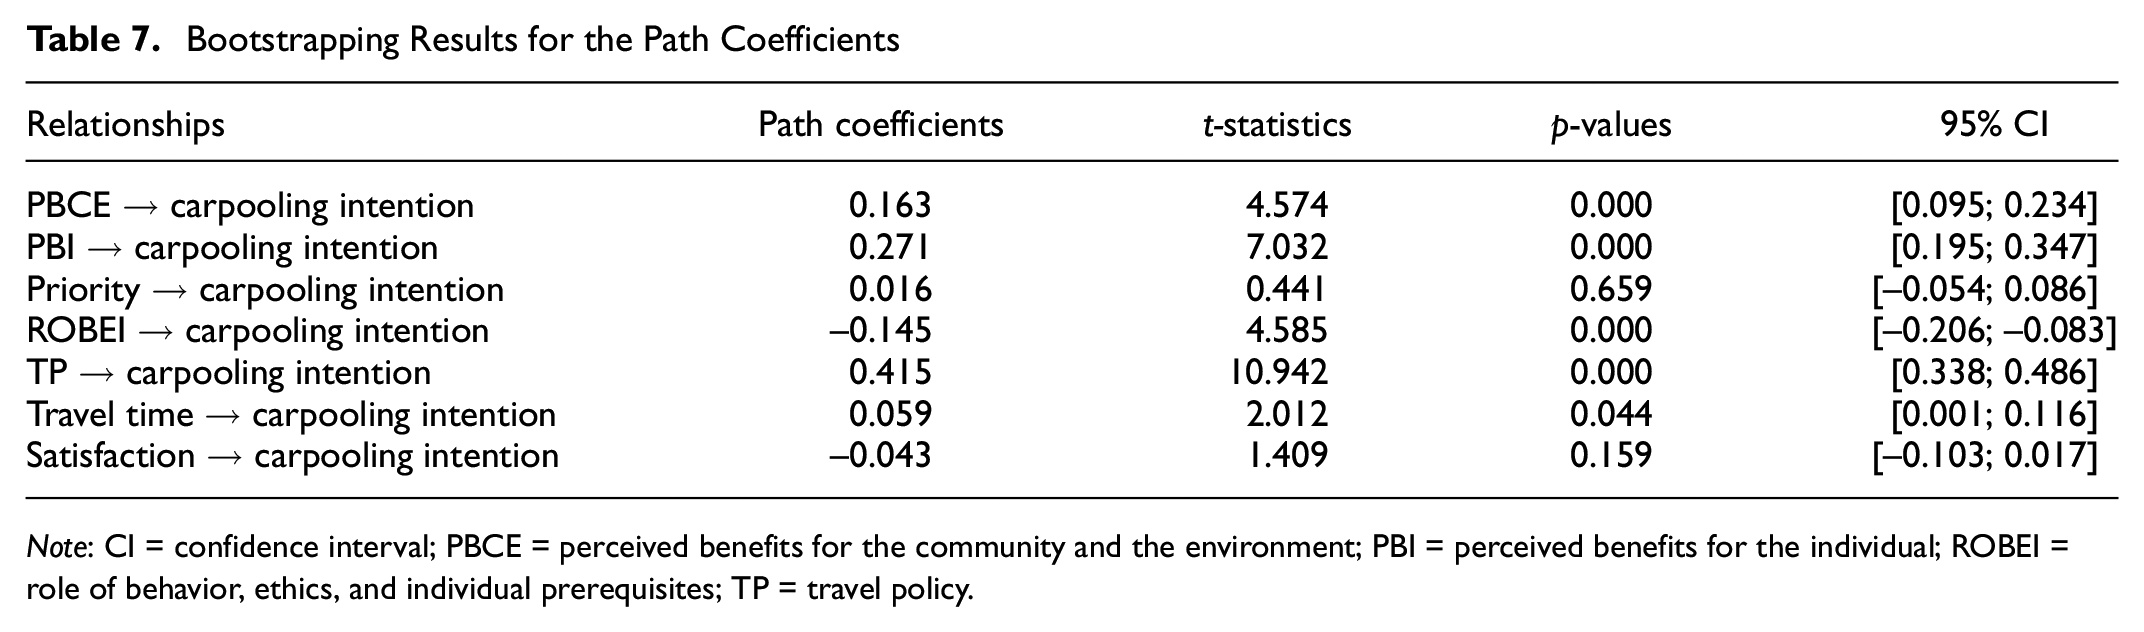
Note: CI = confidence interval; PBCE = perceived benefits for the community and the environment; PBI = perceived benefits for the individual; ROBEI = role of behavior, ethics, and individual prerequisites; TP = travel policy.
With regard to the negative relationships, ROBEI to carpooling intention has a path coefficient of -0.145, and was significant with a t-value of 4.585. This result is consistent with the literature and was confirmed by the participants when asked about the incentive that may encourage them to adopt carpooling as a mode of travel. Many participants emphasized that they would carpool only with acquaintances, either friends, family members, or coworkers, because they feel more confident with people they trust, a factor also concluded by Correia and Viegas ( 32 ). Overall, behavior and ethics play an important role in predicting carpooling intention, and this result is consistent with previous studies ( 9 , 56 ). In addition, our results are in line with the existing literature documenting the role of attitudes in the decision to adopt carpooling, for example, de Almeida Correia et al. ( 28 ), who also emphasized the wish to retain privacy and the desire to preserve personal space.
The mean of the carpooling intention variable for participants was as follows: those who use public transport (3.57); those who use a private car (carpooling with household members) (3.37); those who use a private car (driving alone) (3.18); and those who use a motorcycle (3.00). The mean of the satisfaction variable for participants was as follows: those who use public transport (2.45); those who use a private car (carpooling with household members) (3.56); those who use a private car (driving alone) (3.99); and those who use a motorcycle (3.00). It is obvious that public transport users were more likely to have the intention of adopting carpooling and more likely to be dissatisfied than owners of private cars. When a person is dissatisfied with the current mode of travel, his/her intention to change it will increase. The results of 5,000 bootstrapping procedures reject the relationship (satisfaction → carpooling intention) with a path coefficient of -0.043. The relationship between priority and carpooling intention is considered not significant at a 5% level.
The total indirect effect is calculated by multiplying the path coefficients for the sequence of relationships that compose it. For example, the indirect effect of social relationships on carpooling intention through PBI is 0.271*0.476 = 0.129. This relationship is significant at a 5% level with a t-value of 5.752 as shown in Table 8. Arteaga-Sánchez et al. ( 86 ) also concluded that social relationships is an important factor. In addition, de Almeida Correia et al. ( 28 ) indicated that carpooling could be encouraged as a way of making friends and getting to know people from a variety of locations. The indirect effect of prioritizing the environment on carpooling intention is not significant with a t-value of 0.433 (less than 1.96). A positive environmental attitude is not enough to adopt carpooling; although participants are convinced of its importance to the environment, this is still not enough to encourage them to adopt it.
Bootstrapping Results for Total Indirect Effects
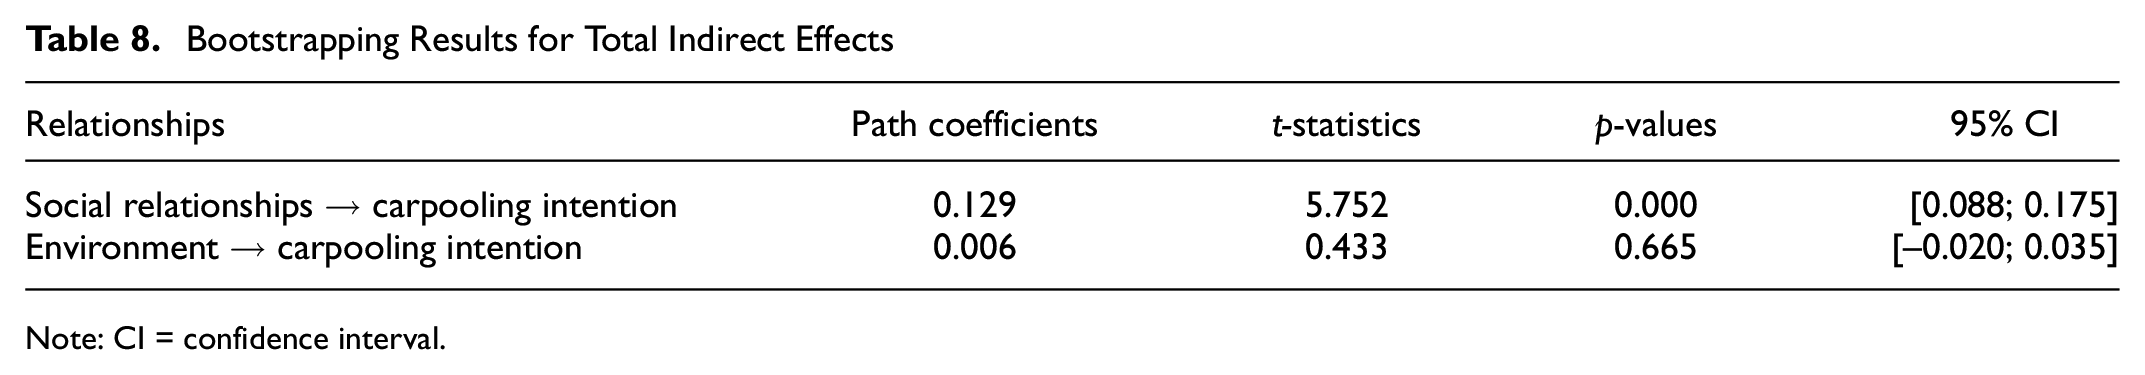
Note: CI = confidence interval.
The next step is evaluating the coefficient of determination (R2), which is the proportion of variance in the dependent variable (carpooling intention) that can be explained by one or more predictor variables ( 73 ). This is a measure of the model’s predictive power. The minimum acceptable value of R2 is 0.2, especially in behavioral studies. Chin ( 87 ) and Vinzi et al. ( 80 ) suggested that the R2 values of 0.67, 0.33, and 0.19 for endogenous latent variables can be considered as substantial, moderate, and weak, respectively, whereas Hair et al. ( 73 ) considered R2 values of 0.75, 0.50, or 0.25 in PLS-SEM as substantial, moderate, and weak, respectively, especially in scholarly research. The endogenous latent variables show the R2 value of the carpooling intention variable is 0.486. This indicates that the overall predictor variables explained 48.6% of the variance in carpooling intention. This percentage indicates a moderate level of predictive accuracy ( 73 , 80 , 87 ). The 2.5% and 97.5% lower and upper bound, respectively, of the 95% confidence interval are 0.432 and 0.551, respectively.
To assess the predictive effect of each construct on the endogenous variable, the effect size (ƒ2) is computed. The ƒ2 is the change in the R2 value when a particular exogenous latent variable is eliminated from the model, and it can be calculated as (R2included-R2excluded)/(1-R2included). The ƒ2 values of 0.02, 0.15, and 0.35 represent small, medium, and large effects, respectively. ƒ2 values of less than 0.02 are considered to have no effect size. Table 9 presents the effect size for all exogenous variables. Introducing a TP has an effect size of 0.269; therefore, it has a medium effect. ROBEI has an ƒ2 value of 0 0.038, which means it has a small effect on carpooling intention. The PBI are more of an incentive to adopt carpooling than the PBCE (the effect size for the impact of PBCE on carpooling intention was 0.035, whereas the effect size for the impact of PBI on carpooling intention was 0.090). Both were found to have small effects, and this conclusion is not surprising and expected. For example, Neoh et al. ( 34 ) mentioned that the desire to reduce congestion showed a relatively small effect on carpooling intention, as did the desire to reduce spending on transport, which was found to be the reason for adopting carpooling in previous research ( 29 ). Priority, satisfaction, and travel time have no effect on carpooling intention because the corresponding effect size is less than 0.02.
Results of the ƒ2 Effect Sizes
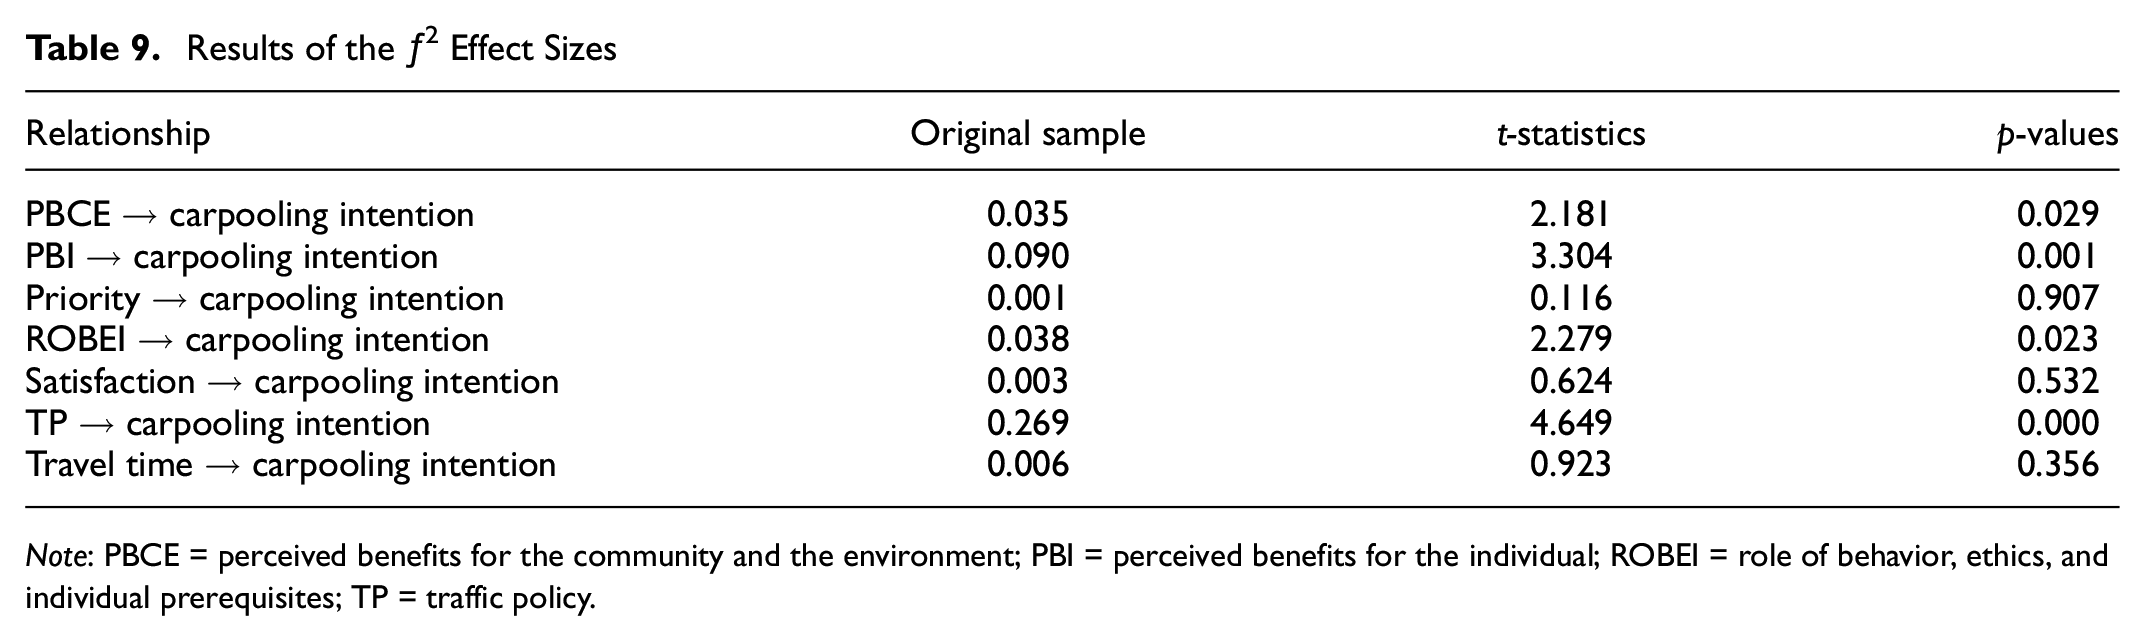
Note: PBCE = perceived benefits for the community and the environment; PBI = perceived benefits for the individual; ROBEI = role of behavior, ethics, and individual prerequisites; TP = traffic policy.
The findings for the assessment of the structural model are summarized in Figure 3, in which the numbers on the inner model represent the path coefficient and t-value, and the numbers in the outer model in the arrows from construct to the indicators represent the t-value. The value 0.486 that appears inside the constructs represents the R2.
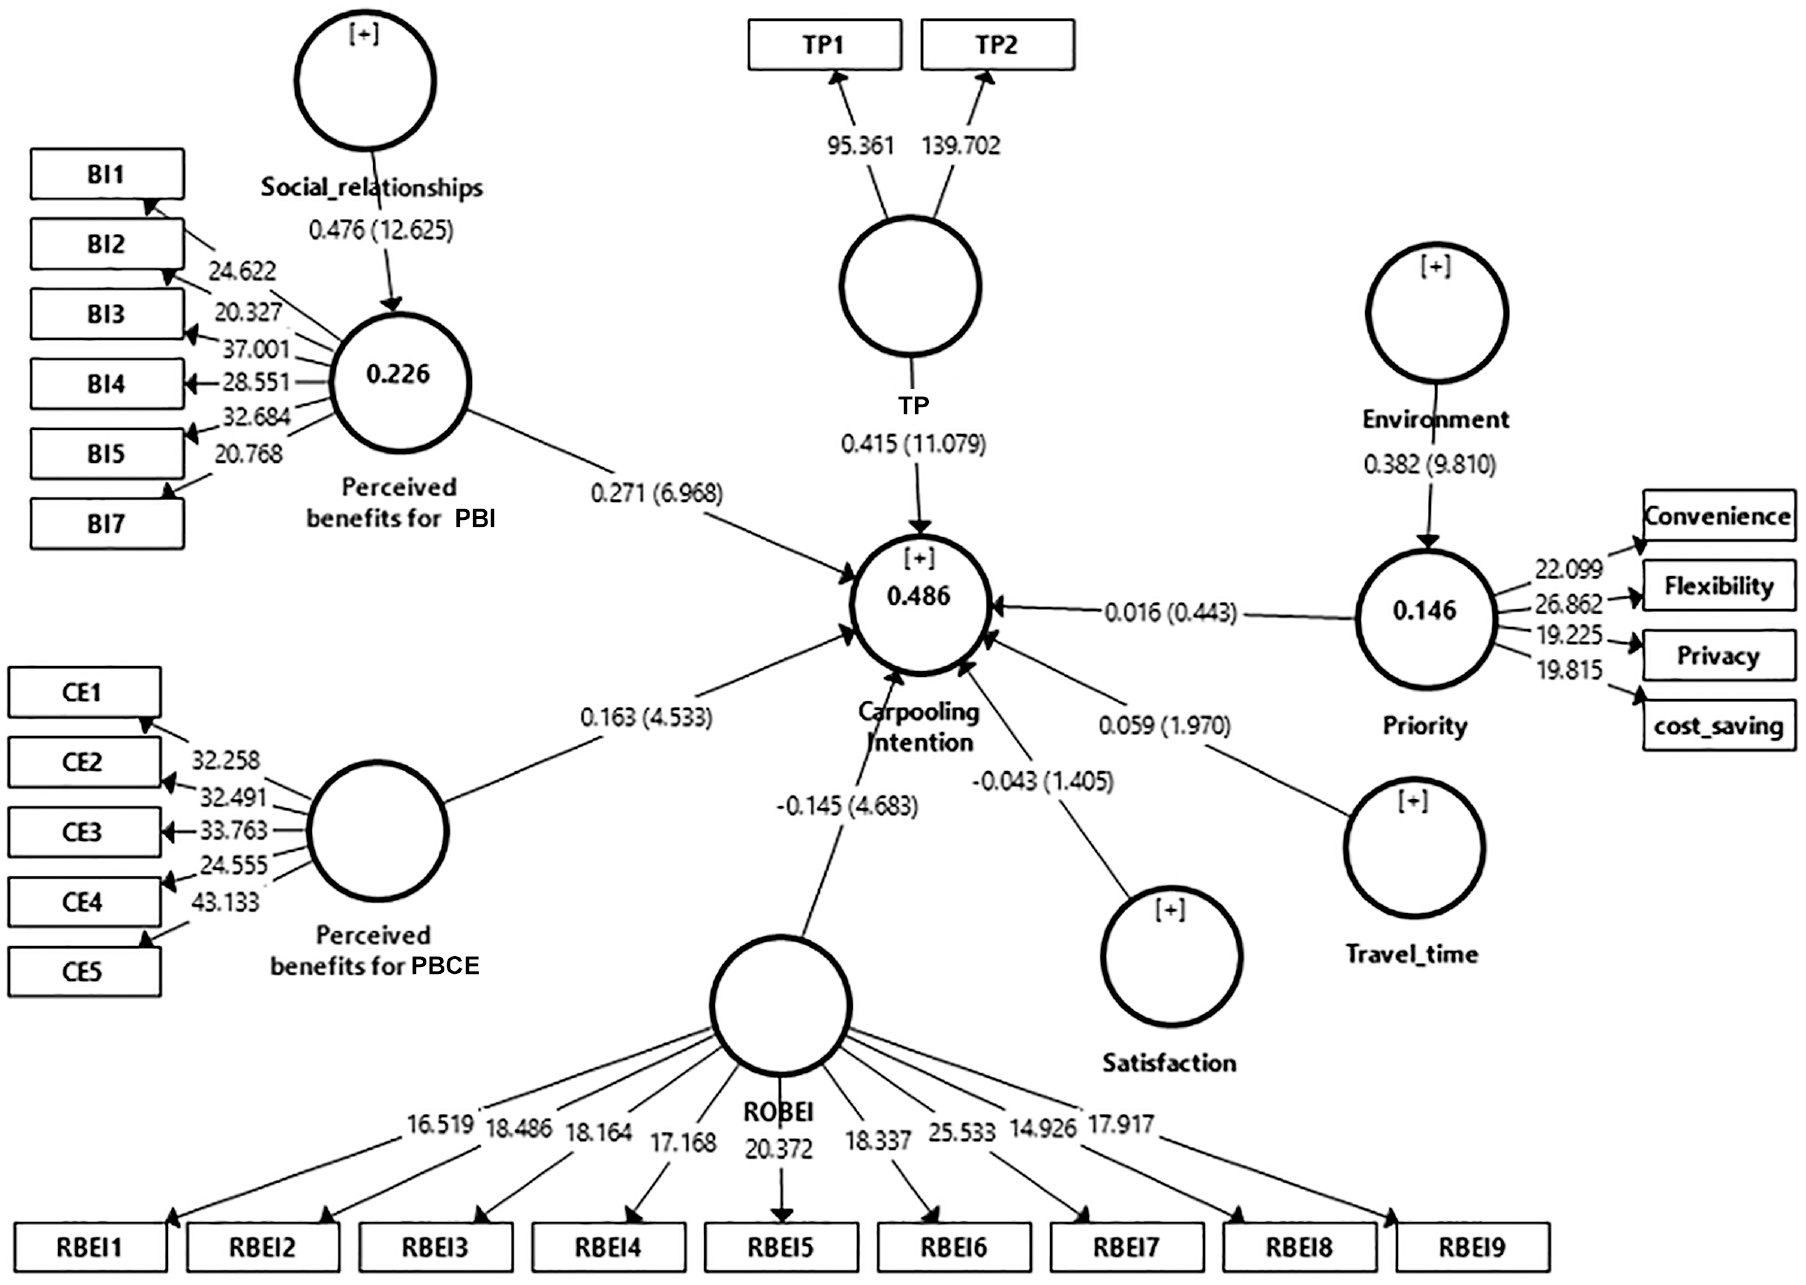
Structural model analysis findings.
Analysis of Control Variables
The analysis was done for the full sample regardless of the demographic characteristics of the respondents, because the main purpose of our research is to test the factors that may affect the intention to adopt carpooling in Jordan. ANOVA was carried out using SPSS version 23 to examine the association between carpooling intention and each of the following variables: age; gender; city of residence; education level; employment status; and income level. In addition, Levene’s test was conducted to support the assumption of the homogeneity of variance ( 88 ).
All independent variables except gender have three or more groups. Using the independent sample, a t-test or one-way ANOVA give the same results in the case of two groups (e.g., males and females). Table 10 presents the results of one-way ANOVA for all control variables and the dependent variable carpooling intention. There is an option for running Levene’s test in SPSS, and it is not significant for the income level variable with p = 0.256 > 0.05, so equal variances are assumed. The ANOVA test was conducted for each of the Likert scale items in the questionnaire separately as a dependent variable and the control variable as an independent variable.
ANOVA Analysis Results for Demographic Groups
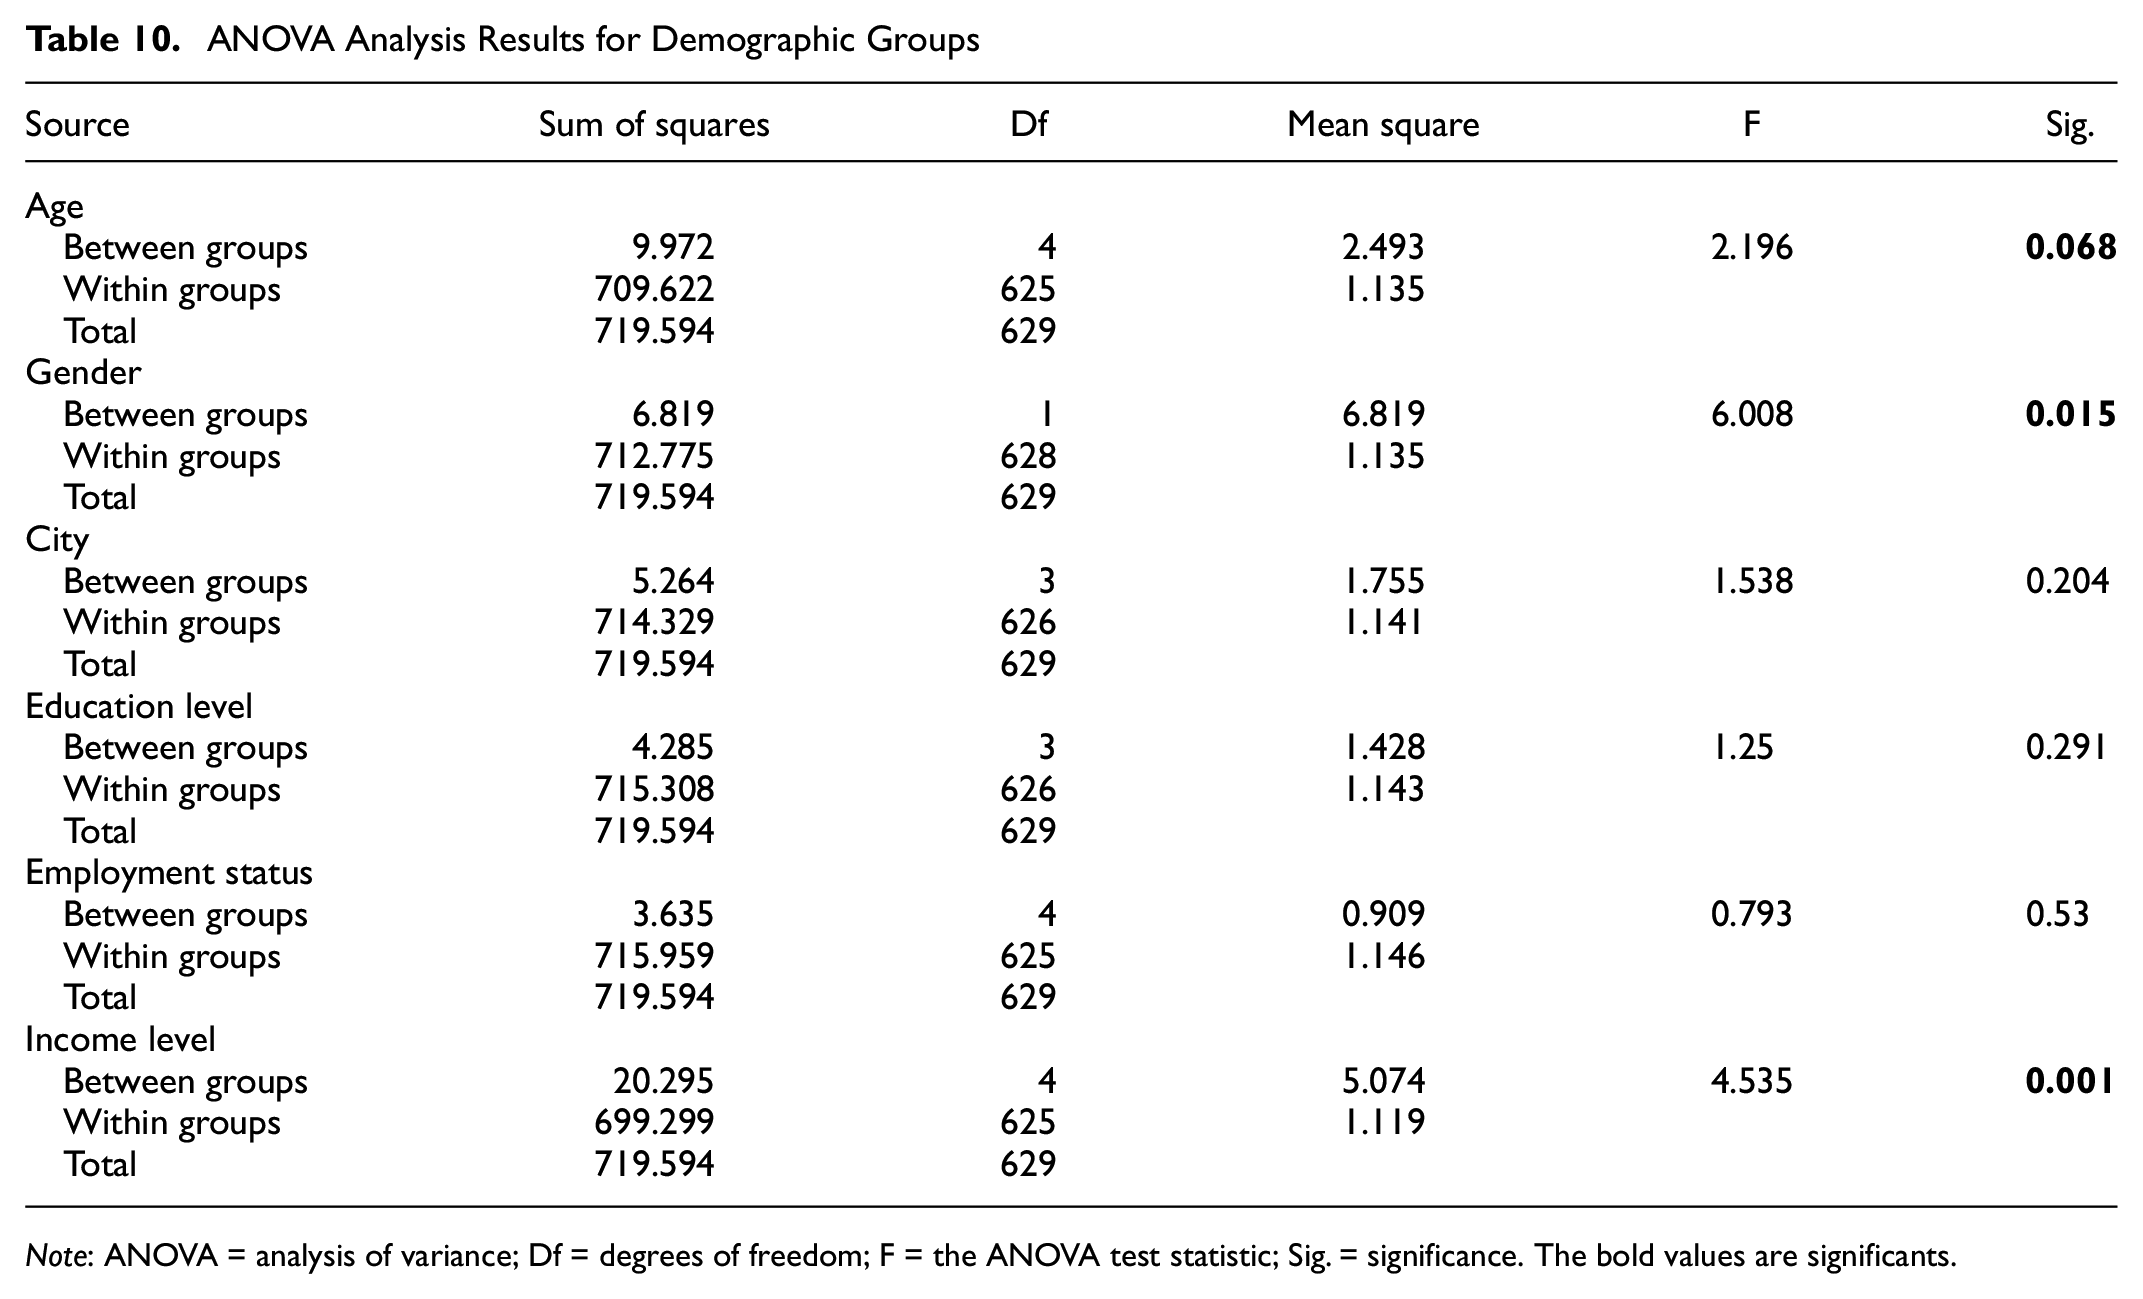
Note: ANOVA = analysis of variance; Df = degrees of freedom; F = the ANOVA test statistic; Sig. = significance. The bold values are significants.
Gender Variable
The ANOVA test statistic (F) for the gender variable is 6.008 with a p-value of 0.015 < 0.05 [F (1, 628) = 6.008, p = 0.015]. Therefore, there is a significant difference between males and females with regard to their intention to adopt carpooling. Almost all previous studies found the same result ( 27 , 39 ). In our study looking at Jordanian citizens, males have more intention of adopting carpooling than females (males = 3.52, females = 3.31). This finding is similar to some studies ( 9 , 30 ) and different to others ( 8 , 26 ). To understand the reason for the differences between gender groups, an ANOVA test was conducted for each of the Likert scale items in the questionnaire separately as a dependent variable and the gender variable as an independent variable. The differences occurred in nine variables, for example, females attach more importance to convenience and privacy. This is clearly apparent in observed ROBEI variables: females are more diffident than men about giving their phone numbers to an unknown person; in general, trusting others is more difficult for women than men. This issue has been discussed in other studies ( 9 , 28 ), and the results showed that men are more ready to adopt carpooling than women if HOV lanes or private parking spaces are provided because of their active desire to drive as explained by Park et al. ( 30 ). Overall, men are quite rational and practically oriented, whereas women’s notion of the idea of carpooling is more emotional and focused on security and fairness.
Age variable
The ANOVA results show there is no significant difference between the five age groups [F (4, 625) = 2.196, p = 0.068] at a 95% level. However, there is a significant difference at a 90% level. In addition, it was found that people aged 18 to 25 have more intention of adopting carpooling (3.53), followed those who are under 18 (3.47). Those over 45 have less intention of adopting carpooling (3.16). This is exactly the conclusion drawn by Park et al. ( 30 ), who found that people under 25 were more likely to adopt carpooling and those who were over 45 were less likely to do so. To understand the reason for the differences between age groups, an ANOVA test was conducted for each of the Likert scale items in the questionnaire separately as a dependent variable and the age variable as an independent variable. Older people are very aware of the benefits of carpooling and attach more importance to speed. However, the change to carpooling is difficult for them. In contrast, younger people attach more importance to privacy. Further, the results showed that younger people rather than older members of the population are more ready to adopt carpooling if HOV lanes or private parking spaces are provided. This result was confirmed by Olsson et al. ( 9 ), who stated that younger people’s intention to adopt carpooling was dependent on context and motivation.
Income Variable
The ANOVA test statistic (F) for the income level variable is 4.535 with a p-value of 0.001 < 0.05. Therefore, there was a significant difference in carpooling intention between income level groups. This result has been confirmed by most studies ( 38 ). It was found that people have more intention of adopting carpooling until their income reaches 500 JD. However, when their income is more than 500 JD, people are less likely to adopt carpooling. The biggest difference occurred between people with an income level of more than 1,000 JD and the rest of the groups. Clearly, people with an income level from 250 to 500 JD are most likely to adopt carpooling (3.55). In contrast, people with an income level of more than 1,000 JD are least likely to adopt carpooling (2.92). The post-hoc test was conducted for the income variable to locate where this significant effect lay. Hochberg’s test was employed to conduct a post-hoc analysis (equal variance assumed, there is a great difference in group sizes), and to control for the type I error ( 89 ). The results of the analysis indicated that the significance occurs in three tests. The first one is between the without income and the more than 1,000 JD groups (mean difference = 0.546 and p-value = 0.008 < 0.05). The second is between the less than 250 JD and the more than 1,000 JD groups (mean difference of 0.599 and p-value = 0.038). The third is between the 250 to 500 JD and more than 1,000 JD groups (mean difference = 0.630 and p-value = 0.004). Vanoutrive et al. ( 12 ) also found that carpooling is positively associated with lower incomes. To understand the reason for the differences between income groups, an ANOVA test was conducted for each of the Likert scale items in the questionnaire separately as a dependent variable and the income variable as an independent variable. It was found that people with an income level of more than 1,000 JD attach a low level of importance to cost saving but value a high level of flexibility. In Jordan, the largest percentage of citizens have an income in the range 250 to 500 JD. These people attach a high level of importance to the environment, speed, and cost saving compared with other groups. In addition, they are very aware of the benefits of carpooling.
City Variable
The ANOVA results show there is no significant difference between the four cities of residence groups and carpooling intention [F (3, 626) = 1.538, p = .204]. Previous studies pointed out that if there is a difference between countries or cities in the intention to adopt carpooling, then the reason is differences in population density and traffic situation ( 9 ). As the population density increases, the probability of finding appropriate partners increases ( 8 ). The selected cities in this study are the most urbanized areas in Jordan, and they experience approximately similar congestion levels.
Education Variable
The results of the analysis show there is no significant difference between the four levels of education groups and carpooling intention [F (3, 626) = 1.25, p = .291]. In our data, postgraduate students are less likely to adopt carpooling than undergraduate students, and this result contradicts Park et al. ( 30 ), who stated that it may be because university students mostly live closer to the university. The ANOVA analysis indicates that bachelor’s students attach a high level of importance to saving money and that this is the rationale behind their intention to adopt carpooling, as also found by Gallo and Buonocore ( 43 ). In contrast, postgraduate students (master’s or PhD holders) have a higher income level and place a higher value on their time; therefore, they are less likely to adopt carpooling. Furthermore, graduate students (bachelor’s degree) are those most aware of the benefits of carpooling for the community and the environment. Table 11 indicates that the benefit of carpooling for the community and the environment does not affect postgraduate students’ intention to adopt it (p-value of 0.059 > 0.05). Table 11 also shows that TP and PBI significantly influenced postgraduate students’ decision to adopt carpooling.
Bootstrapping Results for the Three Levels of Education Groups
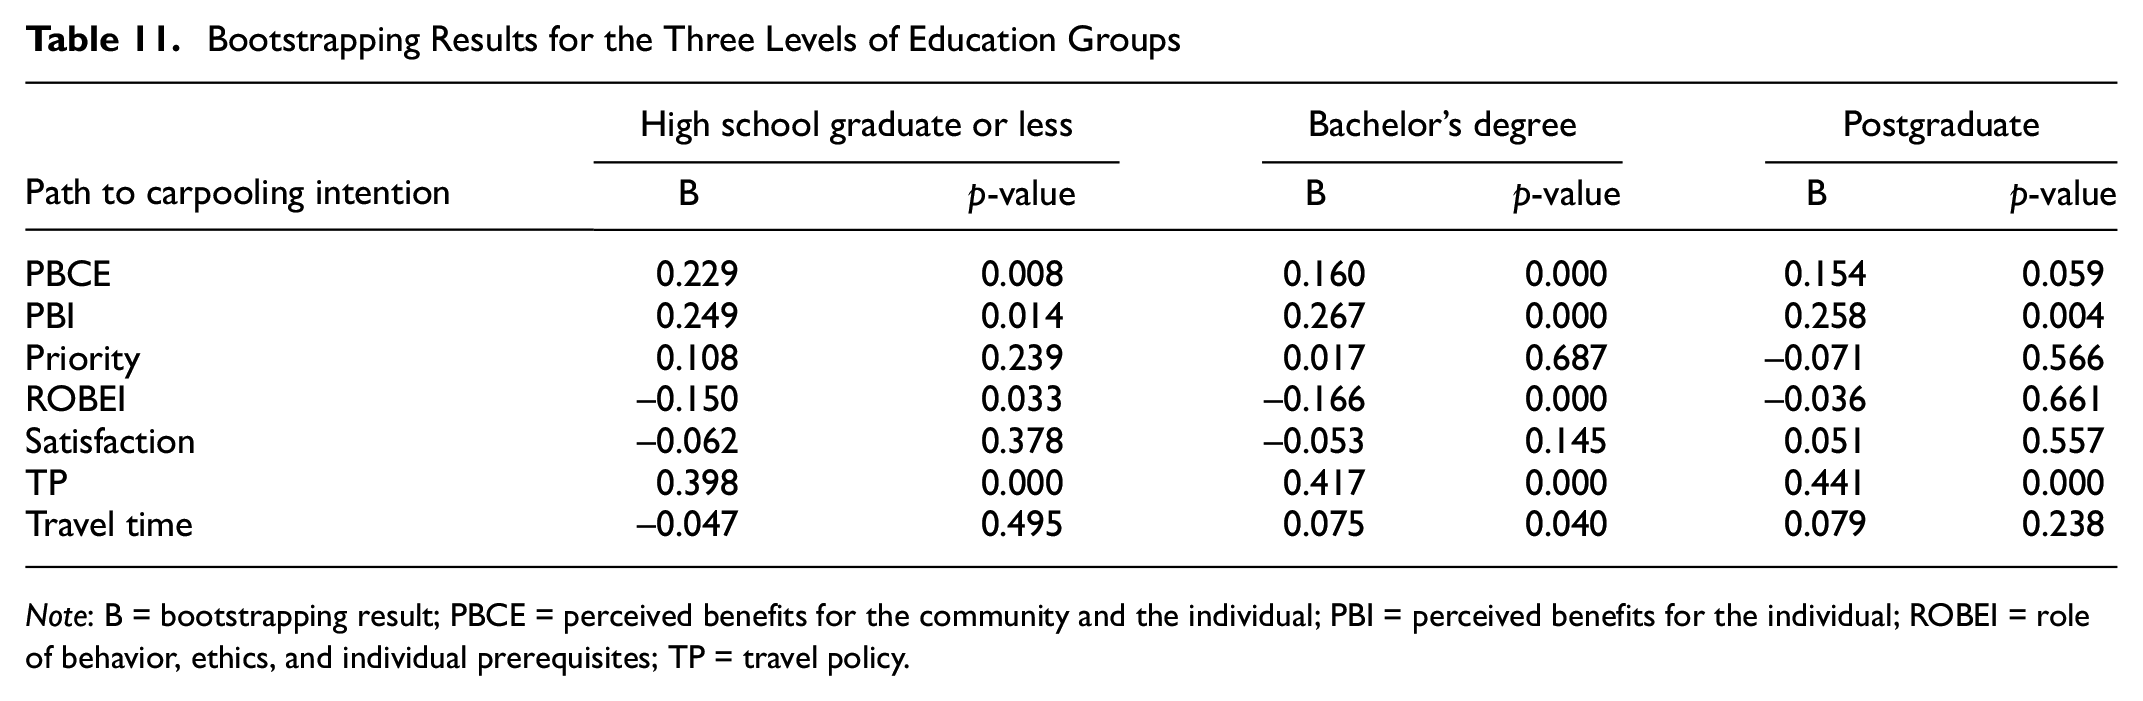
Note: B = bootstrapping result; PBCE = perceived benefits for the community and the individual; PBI = perceived benefits for the individual; ROBEI = role of behavior, ethics, and individual prerequisites; TP = travel policy.
Employment Status
The ANOVA results show there is no significant difference between the four employment status groups and carpooling intention [F (4, 625) = 0.793, p = .530]. Students are attracted to carpooling because of their age and their need to save money, but their intention to adopt carpooling depends on travel time, as also confirmed by Rafiq and Mitra ( 42 ). Lack of incentives, motivation, or organization on the part of employers results in employees being unwilling to adopt carpooling, because these features are effective in increasing the intention to adopt carpooling in the workplace ( 8 ).
Summary and Practical Implications
The results of this study may help transport planners and policymakers in Jordan and similar Arab countries devise better strategies to encourage more people to adopt carpooling. We have examined Jordanian citizens’ knowledge and opinions with regard to adopting carpooling. The chosen conceptual model integrates five latent concepts, two items, and six control factors with the intention to adopt carpooling, and PLS-SEM was used to model carpooling intention, an endogenous variable. The analysis was performed using SmartPLS software to analyze the data and validate the research model. The predictive relationship between carpooling intention and several factors has been examined. The results of modeling show that the main barriers to adoption of carpooling are factors related to privacy, security, and trust. In addition, there are no incentives offered by companies or any official institution to encourage carpooling in Jordan. In addition, the insurance system, which disadvantages the driver, is considered to be another issue.
Jordanian citizens realized the benefits of carpooling for the driver, for example, cost saving and increased productivity. In addition, they were aware of the benefits for society as a whole and for the environment. However, PBI are a greater incentive for adopting carpooling than PBCE, although several participants in the study had a positive attitude toward the environment. However, the results indicated that being aware of these benefits had only a small effect on their intention to adopt carpooling. Therefore, companies and transport planners in Jordan need to focus on the PBI, for example, the cost-effectiveness of carpooling. This is also in line with findings that providing private parking spaces will encourage more than half of participants to adopt carpooling. In addition, it was found that the intention to adopt carpooling is directly proportional to travel time. Gender and income level variables were found to have a significant influence on the decision to adopt carpooling, whereas the current city of residence, education level, or employment status did not affect it. Furthermore, it was concluded that there is a significant difference at a 90% level between the five age groups. Younger people (under 25), males, and those with a low income level were more willing to adopt carpooling. In contrast, postgraduate students and residents of Amman were less likely to adopt carpooling.
Based on our findings and the literature on carpooling, there are several key factors that would contribute to devising better strategies to encourage more people to adopt carpooling. First, the issue of trust in others, including the loss of privacy, was found to be one of the main obstacles to adopting carpooling. Trust in this context means to have trust in others with regard to punctuality, and also having confidence in the ethics and behavior of fellow travelers. Therefore, it is essential when trying to encourage carpooling to take this point into consideration. When participants work in the same company or are from one social network, a basic level of trust would already be established, and this would result in a good level of security. Second, participants in our study realized the benefits of carpooling for society as a whole and for the environment, and several of them have a positive attitude toward the environment. However, the results indicated that being aware of these benefits has only a small effect on their intention to adopt carpooling. Therefore, it is necessary to raise citizens’ awareness of pollution and its impact on their health. Anable ( 90 ) stated that making information about environmental problems available can encourage people to switch to a more sustainable mode of travel than driving alone.
Third, the number of participants in our study who would adopt carpooling if a private parking space was provided is greater than the number who would adopt it if there were lanes for HOVs. This is expected, because the study was conducted in Jordan, and providing preferential parking may be more easily effected and financially viable. Providing private parking spaces for those who adopt carpooling is of mutual benefit for both employer and employees ( 91 ). Finally, if an accident occurred, in Jordan, there are guarantees and obligations that the driver should assume toward passengers. The participants expressed concern about the insurance system. This is real, and can be seen from the number of obligations that Jordanians pay as compensation in the event of accidents, injuries, and deaths, even if the people who are chauffeuring them are relatives. This leads us to search for a solution, for example, exempting a driver in a carpool from any obligations in the event that the cause of the accident is unintended.
Footnotes
Author Contributions
The authors confirm contribution to the paper as follows: study conception and design: Hashem R. Al-Masaeid; data collection: Ghoroub A. Al Olaimat; analysis and interpretation of results: Hashem R. Al-Masaeid, Ghoroub A. Al Olaimat; draft manuscript preparation: Hashem R. Al-Masaeid. All authors reviewed the results and approved the final version of the manuscript.
Declaration of Conflicting Interests
The author(s) declared no potential conflicts of interest with respect to the research, authorship, and/or publication of this article.
Funding
The author(s) received no financial support for the research, authorship, and/or publication of this article.
Data availability
The data are available on request.