
Abstract
The uncertainty of cyclists’ movements has a significant impact on predicting the risk of collisions between cyclists and vehicles. The purpose of this study was to provide a method for assessing collision risk using probability, taking into account the uncertainty of cyclists’ movements. A cyclist model was first developed using a first-order Markov model. Then, based on Monte Carlo sampling, the distribution characteristics of the minimum distance and the time-to-collision (TTC) between the vehicle and the cyclist were extracted. By fitting these features, the probability density functions of the collision distance and TTC were estimated to derive the collision probabilities. The effectiveness of the collision probability prediction model was benchmarked against a deterministic crash risk prediction model (autonomous emergency braking [AEB] system) applied to three real-world cases previously reconstructed in an in-depth crash database. The results show that the collision probability prediction model can effectively predict the risk of collisions between cyclists and vehicles with better accuracy than AEB systems using a fixed trigger threshold. This study is a valuable reference for the development of advanced vehicle collision avoidance systems to protect cyclists and other vulnerable road users.
According to the World Health Organization, vulnerable road users (VRUs), that is, pedestrians, cyclists, and motorcyclists, account for more than half of global road traffic deaths, with cyclists accounting for 3% of global deaths ( 1 ), although in some countries, such as Germany (12%) and Japan (11.8%) ( 2 ), the percentage is higher. In China, the number of cyclists killed or injured in 2019 was 2,774 and 8,174, respectively, with fatalities accounting for 4.42% of all traffic fatalities ( 3 ).
Active safety systems, such as collision mitigation and collision avoidance systems, are now on the market and can effectively prevent accidents or reduce the severity of injuries ( 4 , 5 ). These systems consist of four main basic components: environmental perception; collision risk assessment; decision-making; and avoidance measures. To reduce false warnings and decision errors, accurate assessment of crash risk is an important function in addition to accurate sensing of the vehicle’s environmental. Quantitative threshold measures such as TTC ( 6 , 7 ), time-to-braking, and time-to-reaction (TTR) ( 6 – 10 ) have been widely adopted to assess crash risk. However, these metrics are typically established assuming that the vehicle and VRUs do not change travel speed before a collision occurs. It is clear that these deterministic time metrics do not take into account the effects of uncertainty in traffic accidents, which may lead to misjudgment of crash risk by the system and result in suboptimal decisions.
In the field of active safety, one of the important uncertainties is the measurement errors of sensors that detect VRUs on the road ( 11 , 12 ). If the objects are not detected clearly enough to obtain accurate measurements, the accuracy and robustness of the prediction algorithms decrease, thus reducing the performance of subsequent decisions ( 8 , 12 ). With the development of computer vision, Kooij et al. combined images with a dynamic Bayesian network. This system could efficiently calculate probabilistic path predictions considering the uncertainty in measurements and target behavior ( 13 ). Zhou et al. ( 14 ) utilized the extended Kalman filter to detect the motion status of objects, thus reducing the errors from sensor measurement noise and blind zones.
The second type of uncertainty is the change in the behavior of traffic participants over short time periods. For example, VRUs can quickly change their speed or direction according to their habits and travel intentions. To address the effect of VRUs’ uncertain movements, for example, those of pedestrians, the uncertainty can be described by establishing a stochastic model of VRU kinematics and calculating the probability distribution of the corresponding evaluation metric. Monte Carlo sampling is one of the most straightforward methods for assessing the probability of collision ( 4 ). By combining a simple but representative stochastic model for pedestrians and an offline risk assessment relying on Monte Carlo simulation, De Nicolao et al. ( 15 ) proposed a crash risk assessment method based on scenarios and pedestrian behavior. Further, Tamke et al. ( 6 ) proposed the binary search algorithm for searching for time-to-maneuver and calculating TTR. Based on Gaussian distribution ( 16 ), Berthelot et al. ( 11 , 17 ) addressed the uncertain movements of vehicles. Huang et al. applied the unscented transformation ( 18 ) as an alternative to Monte Carlo simulation to estimate collision probabilities effectively and efficiently ( 12 ). In addition, visual inspection and machine learning algorithms have been used to predict VRU intention and short-term movements, and these uncertainty estimations can be incorporated into the mathematical description of collision possibility ( 19 – 21 ). Lambert et al. ( 22 ) integrated the Gaussian set into the vehicle velocity to calculate collision probability. Eidehall and Petersson ( 4 ) used the repeated Monte Carlo sampling method to sample uncertainty in the positions of surrounding objects to calculate collision probabilities.
Previous research has focused on how path uncertainty affects pedestrian detection by vehicle sensor systems; however, the uncertainty associated with cyclists’ movements has not been systematically investigated. Kooij et al. ( 13 ) considered the uncertainty of cyclists’ movements based on diverse and relevant cues that may also have some uncertainty. However, a large amount of computation is required in model prediction inference and mathematical model construction, and this consumes a lot of computing devices’ computational power. In addition, it is not known whether the prediction models developed for pedestrians are equally applicable to cyclists, because of the higher speed and larger range of cyclists’ movements. Furthermore, as studied by Gao et al. ( 23 ), it is important to consider the uncertainty associated with the trajectory of cyclists, especially in urban environments.
The objective of this study was to develop a predictive model of collision probability associated with a dynamic model of cyclists at unsignalized intersections, taking into account the uncertainty of cyclists’ movements. The model would also be validated against three real-world cyclist accident reconstructions and benchmarked against results for three autonomous emergency braking (AEB) systems with different braking preferences. These results provide an important reference for predicting the collision risk of autonomous vehicle systems in relation to nondeterministic kinematics pertaining to VRUs such as cyclists and pedestrians.
Method
Vehicle Model
To improve the stability and accuracy of collision prediction, vehicle movement is mostly described by deterministic motion models, for example, the constant velocity model, the constant acceleration model, the constant turn rate and acceleration model, and the constant curvature and acceleration (CCA) model (
24
,
25
). In this study, the CCA model was applied to describe the transient movement of the vehicle to predict the collision probability. The state of the vehicle

where

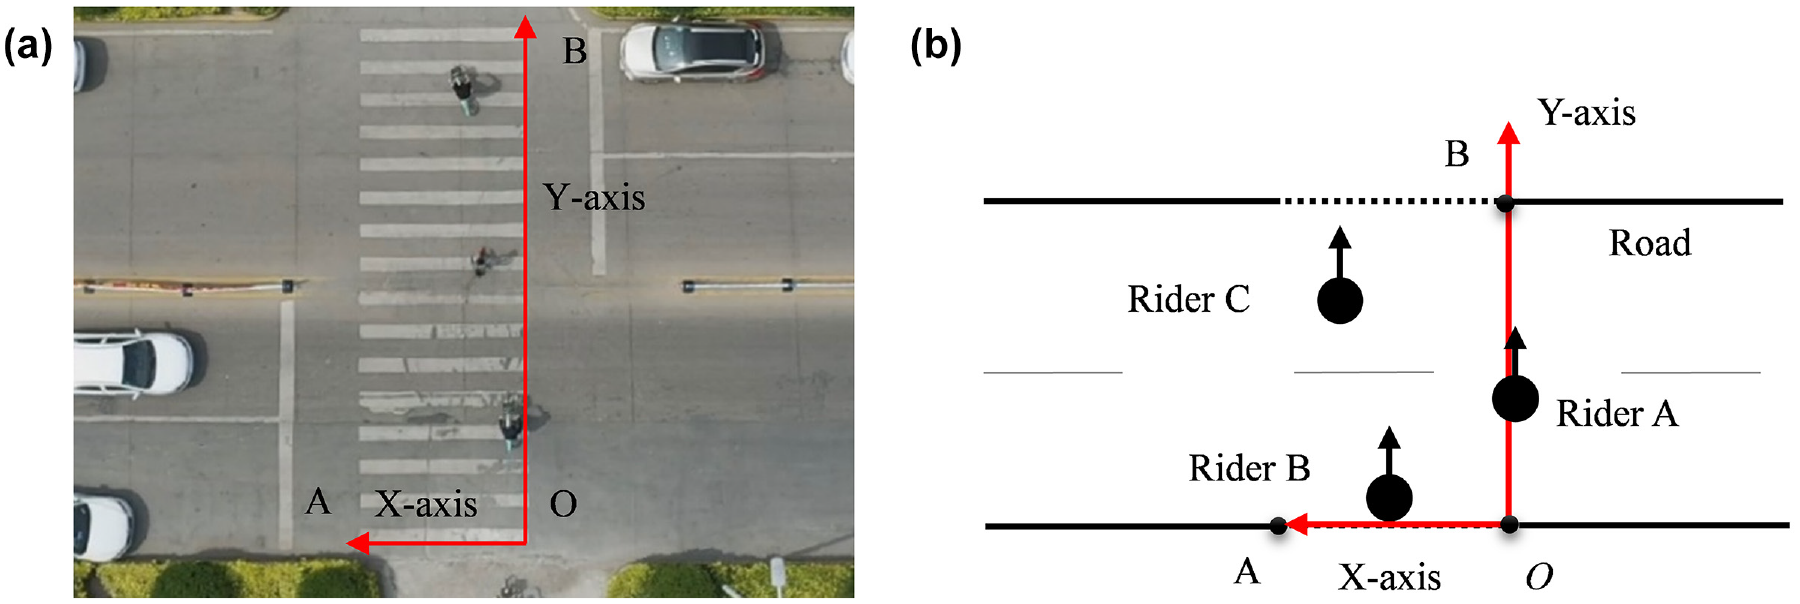
Road coordinate system: (a) real-world coordinate system; and (b) parametric analysis diagram.
Cyclist Model
In this study, cyclists’ movements were considered as a first-order Markov process ( 12 , 21 ), and Gaussian white noise was used to describe the uncertainty of cyclists’ speed variation ( 12 , 15 , 26 ). The state of cyclists’ movements can be expressed as follows:

where


where
To obtain the cyclist’s uncertain movement parameters
Risk Assessment Metric and Distance Model
The time metric TTC is very useful for assessing the risk of traffic accidents. In this study, TTC was used to represent the risk of a collision between a vehicle and a cyclist during the future period

where

where
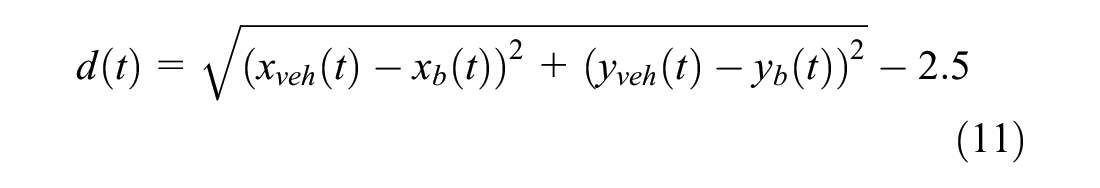
According to Equation 11, the mapping space of the distance function

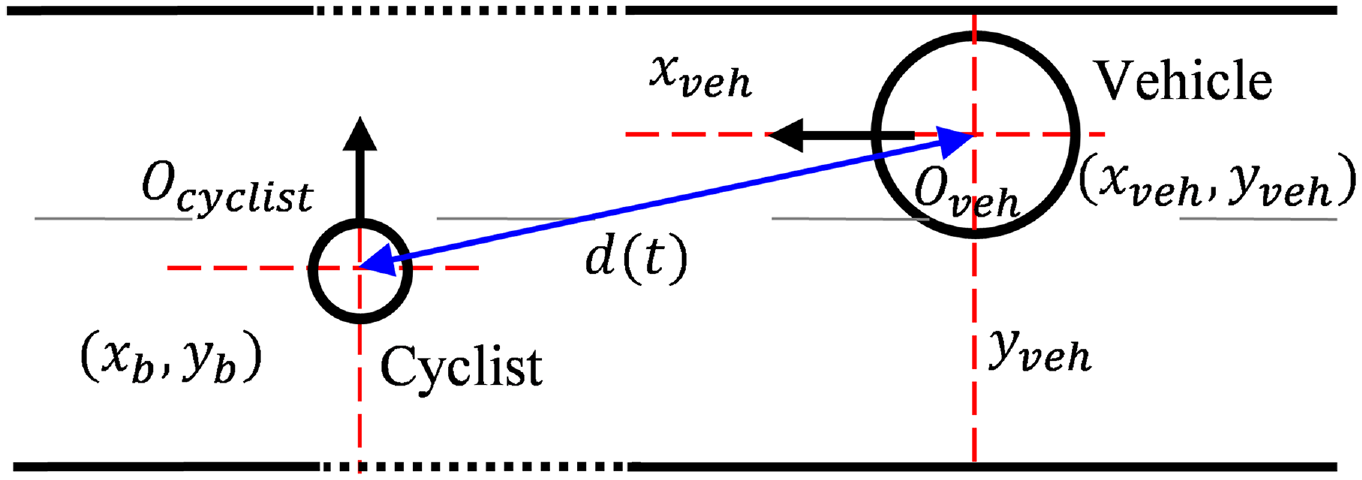
Vehicle-to-cyclist collision distance model.
Collision Probability Distribution
Considering the uncertainty of cyclists’ movements,
By calculating the shortest distance (

where
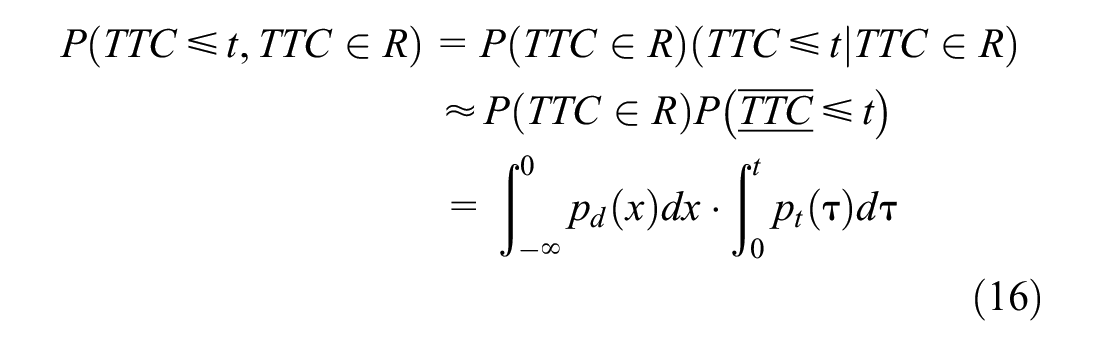
According to Equation 12, the TTC may not exist when no collision occurs; therefore, the direct calculation of

where
where
Calculation of the
and TTC
To calculate
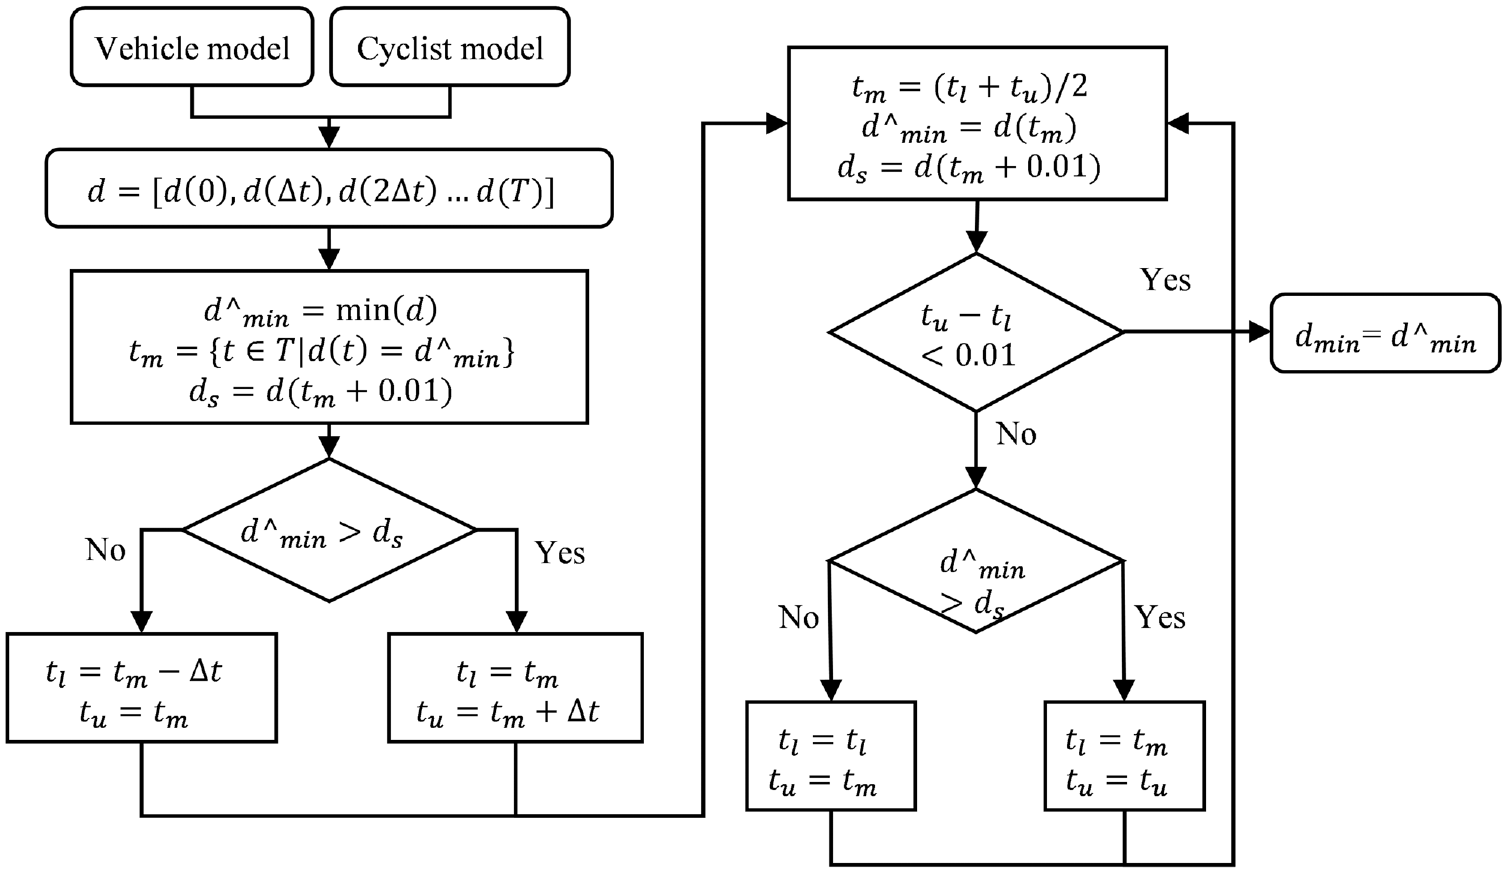
Flow chart of shortest distance dichotomous search method.
Collision Probability Estimation Using Monte Carlo Sampling
Monte Carlo sampling (
27
–
29
) with a sample of 10,000 was used to estimate the density histogram of
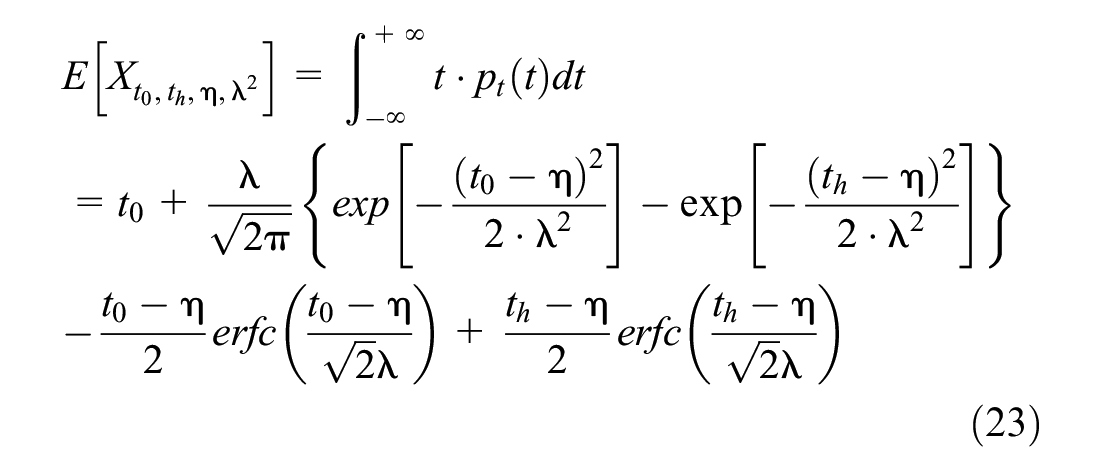
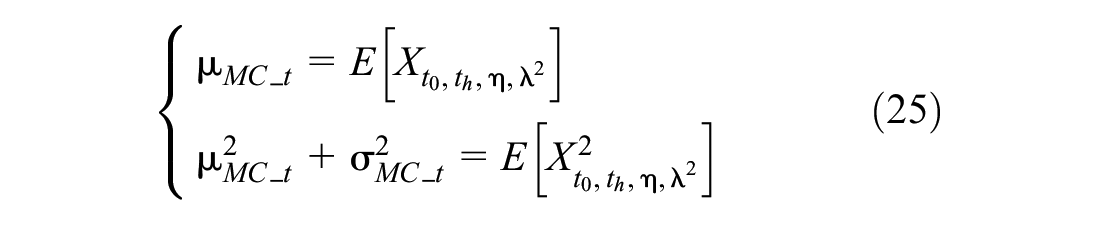
The moments of
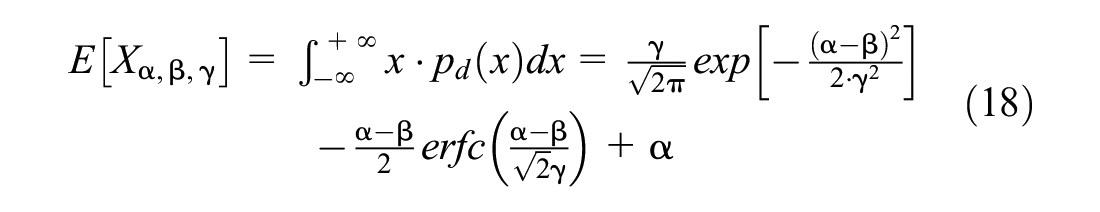
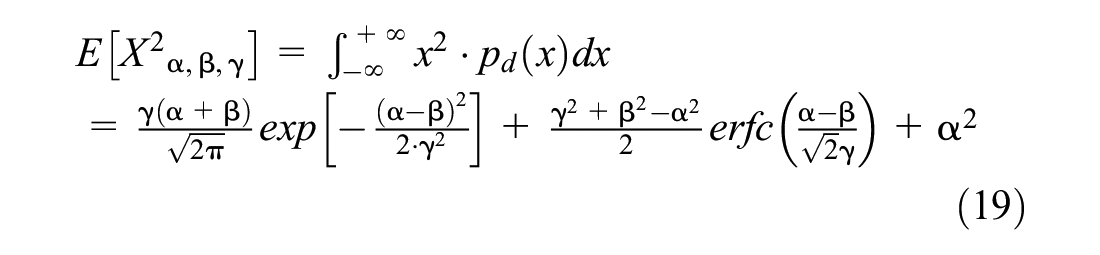
respectively, where
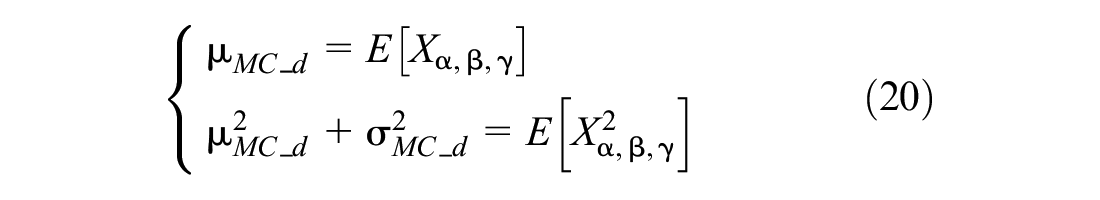
Thus, the
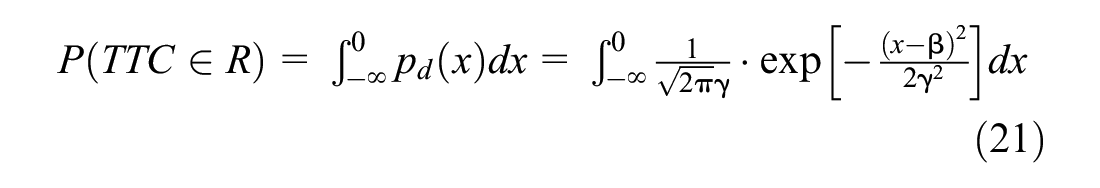
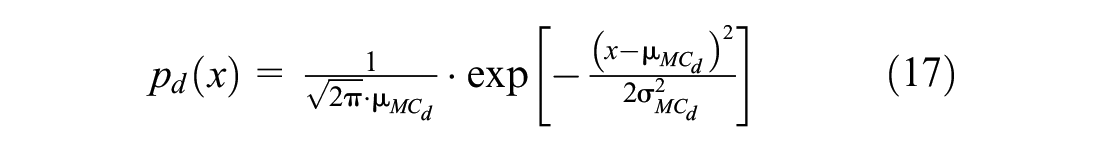
The probability density function
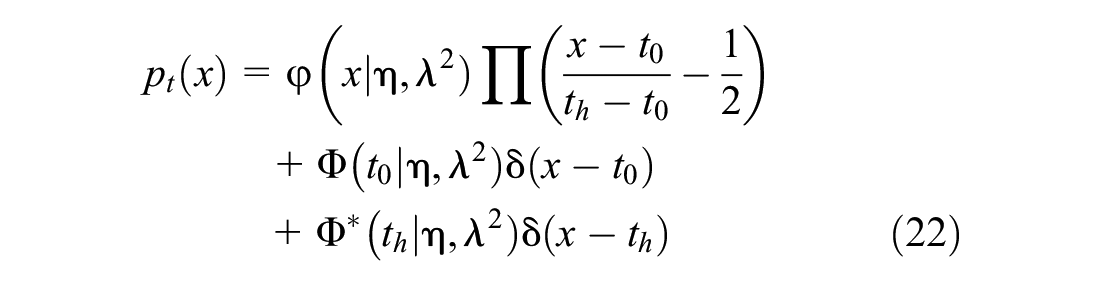
where

Similarly,
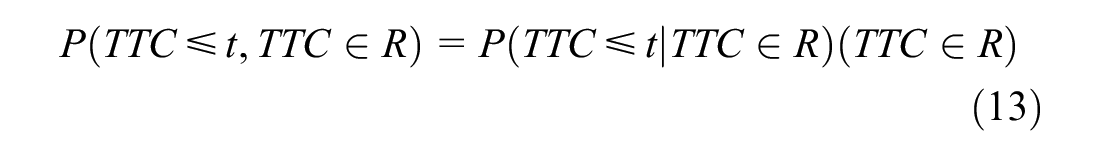
As a consequence, the conditional collision probability

Simulation Analysis
To validate the collision probability model, three car-to-cyclist accident cases were selected from the VRU Traffic Accident Database with Video (
30
,
31
) to investigate the collision probability. The database aims to obtain more detailed and objective precrash, crash, and postcrash accident information by collecting in-depth accident data with videos as well as public internet videos. All accident videos are recorded by either a drive recorder or an intersection monitor. In accordance with the high-precision reconstruction method used for the accident (
32
,
2
), the precrash scenarios of the three cases were first reconstructed in PC-Crash Ver. 11.0 Based on the reconstruction results, the boundary conditions, for example, relative position and velocity, were extracted for the vehicle and the cyclist at
Appendix A shows the process of AEB intervention and the braking deceleration profile (
33
). AEB is triggered when the time-to-collision
Parameters of the Autonomous Emergency Braking (AEB)System for the Three Different Braking Preferences
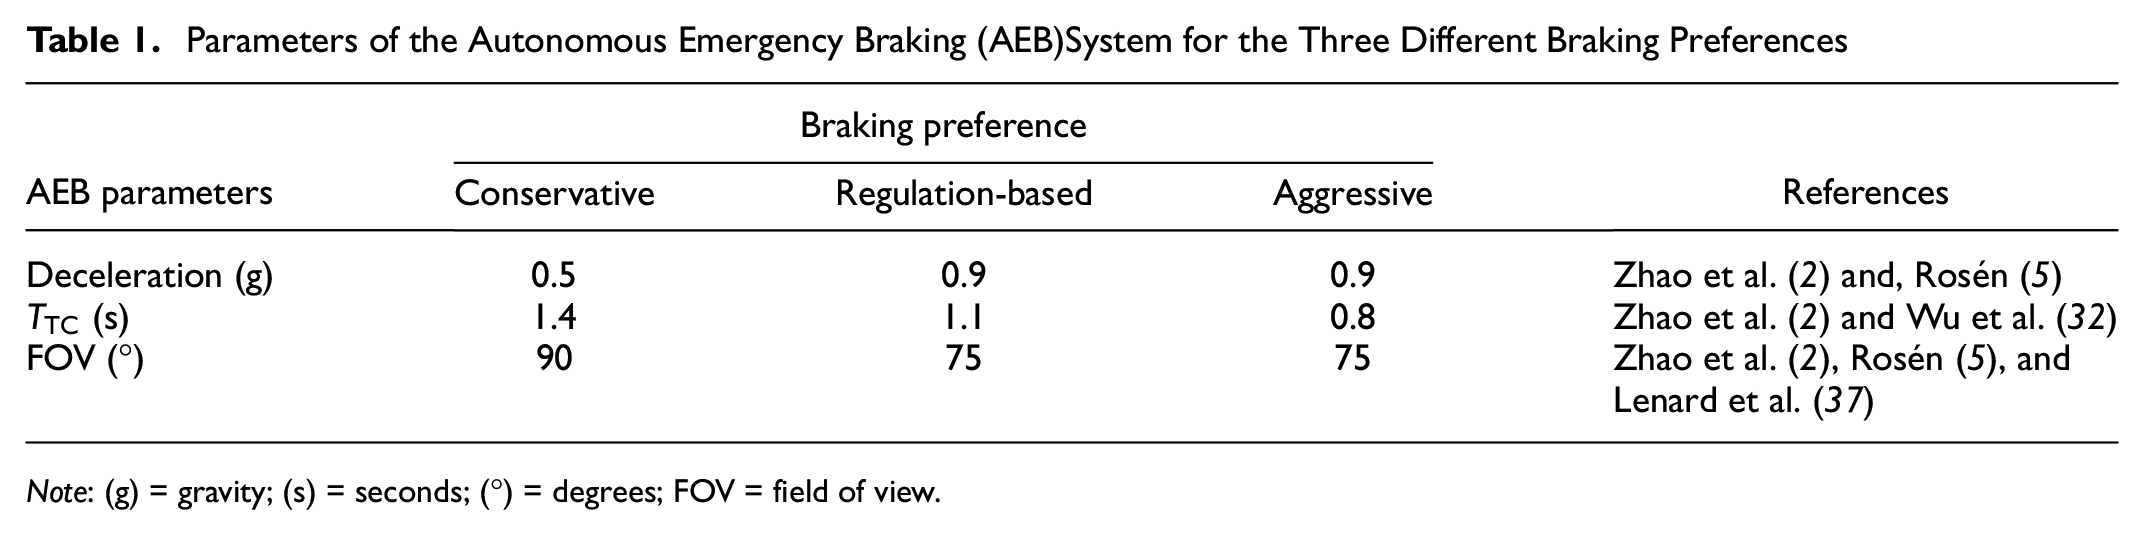
Note: (g) = gravity; (s) = seconds; (°) = degrees; FOV = field of view.
Results
Uncertainty Characteristics of Cyclists’ Movements
Video data was collected for 200 cyclists crossing the road presented in Figure 1 A time series record of each cyclist’s position state was created, and the statistics describing the cyclists’ movements are as follows.


Figure 4 shows a comparison between cyclist crossing velocity (
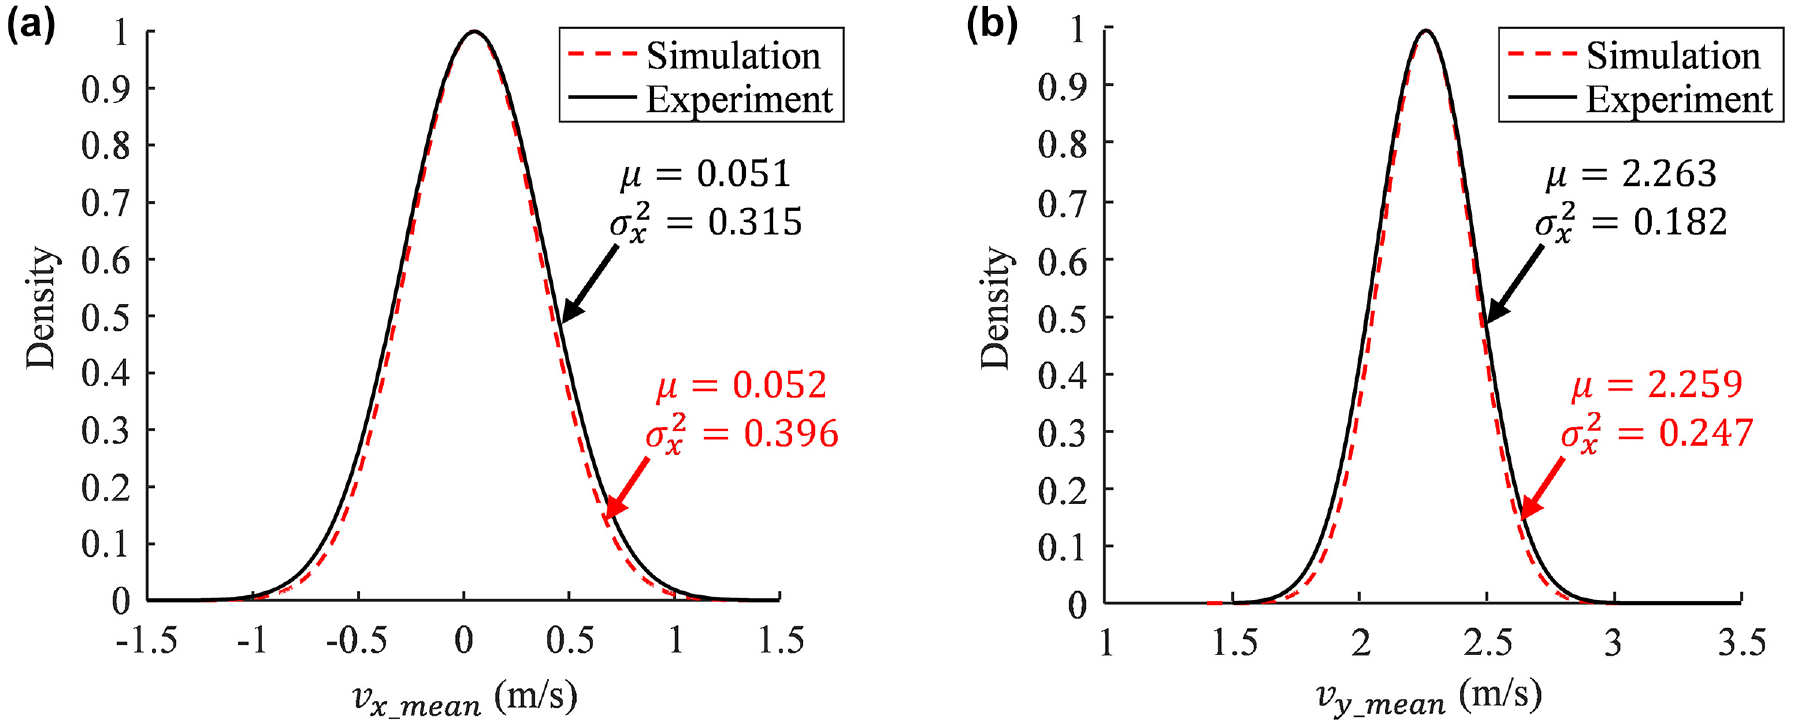
Comparison of velocity characteristics of cyclists crossing the road during simulation and experiment: (a) velocity in X direction; and (b) velocity in Y direction.
Distribution Characteristics of
and TTC
The entire prediction model was applied to three cases. Figure 5 shows the results of Monte Carlo simulation and the fitted Gaussian distribution of
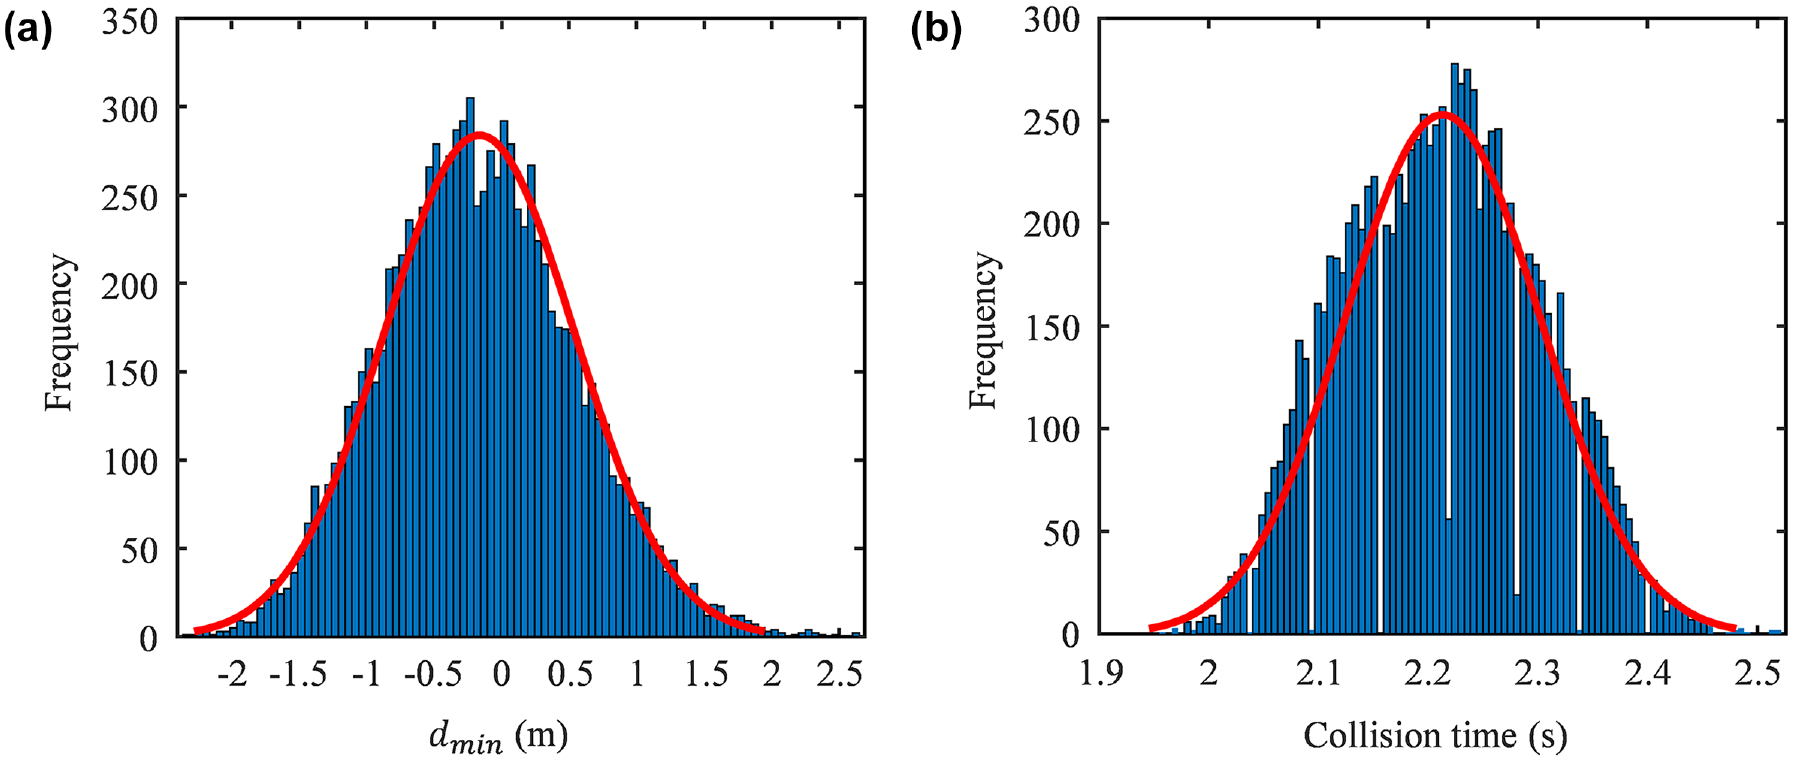
Results of Monte Carlo simulation and fitting of Gaussian distribution at the moment t = 0 in Case 1: (a) distribution of
Simulation and Case Analysis
Figure C1 (in the appendix) shows the relative positions of the cyclist and vehicle in the simulated in-depth reconstructions of the three accidents compared with the screenshots of the accident videos. The relative positions of the car and cyclist are basically the same, which indicates that the reconstruction of the precrash phase for these three cases is reasonable. The boundary conditions were derived from the in-depth reconstruction results shown in Table 2, including the coordinates
The Initial Boundary Parameters of Three Reconstructed Cyclist Cases (
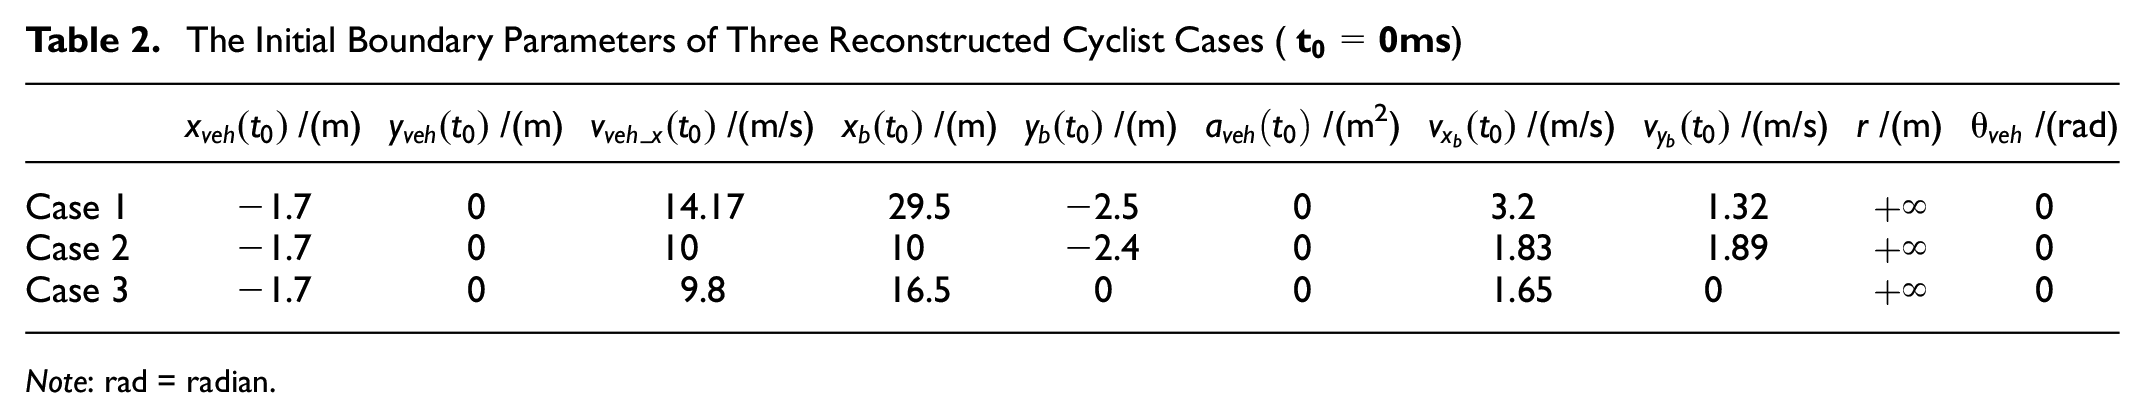
Note: rad = radian.
Figures 6 to 8 show the simulation results and the predicted crash probability distribution for the collision between the cyclist and the vehicle in Case 1. As shown in Figure 6, the original accident occurred at 2.66 s and the collision was avoided when the vehicle was equipped with three different AEB systems. The results of the crash probability model show that at a simulation time of 1.8 s, the crash probability would reach 1.0 for the first time in the next 0.95 s (Figure 7), which indicates a predicted crash time of 2.75 s, with an error of 3.38% from the actual accident time. Therefore, the collision probability model predicted the collision risk well.
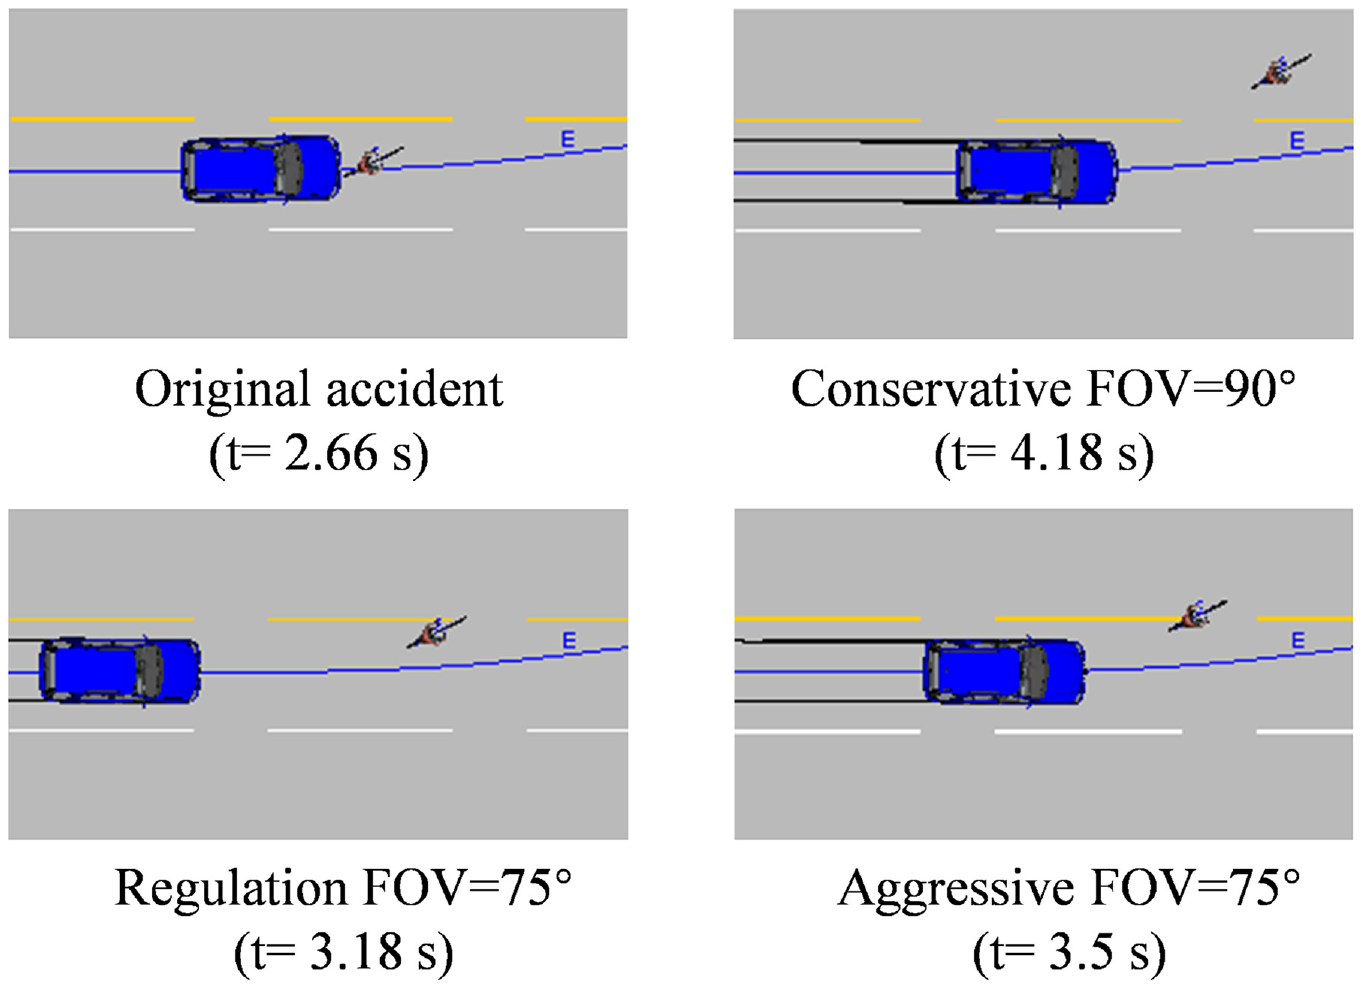
Results of the collision simulation for Case 1. In the case of using autonomous emergency braking (AEB), the collision was avoided.
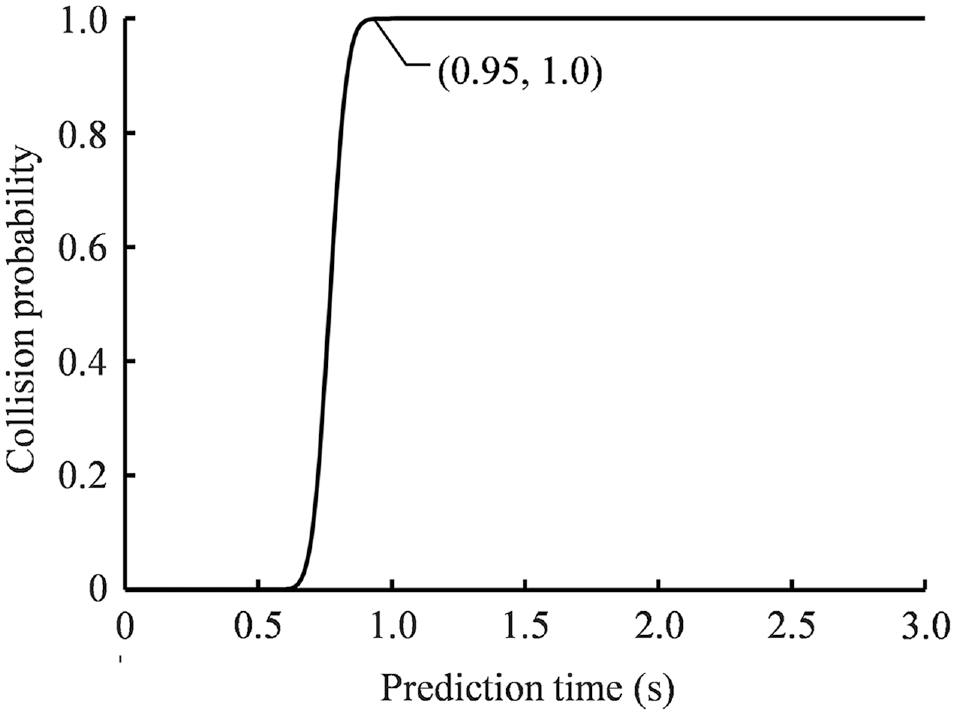
Prediction of the collision probability at t = 1.8 s in Case 1.
Collision probability predictions of different autonomous emergency braking (AEB) preferences for Case 1.
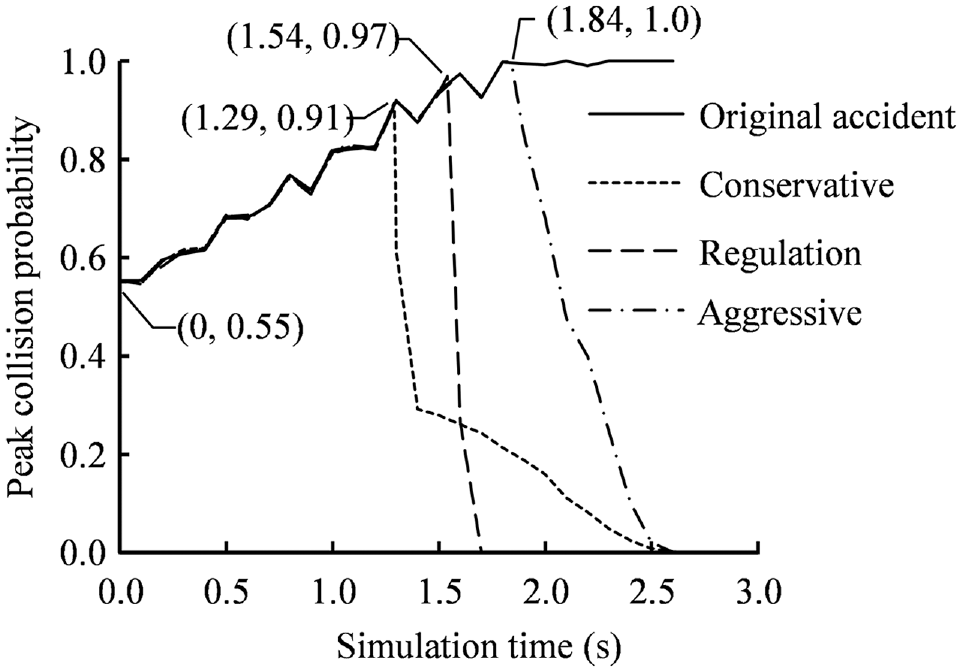
Figure 8 shows the collision probability distribution of the whole simulated collision process for Case 1. In the original accident, the collision probability already exceeded 50% at the start of the simulation, after which the probability increased as the distance between the two parties decreased, reaching a peak of 1.0 at 1.80 s. Because all collisions were avoided when using the three different AEB systems, the collision probabilities were reduced to 0. However, when the AEB systems were triggered, the collision probabilities varied significantly. The conservative AEB system was first triggered at 1.29 s after reaching the
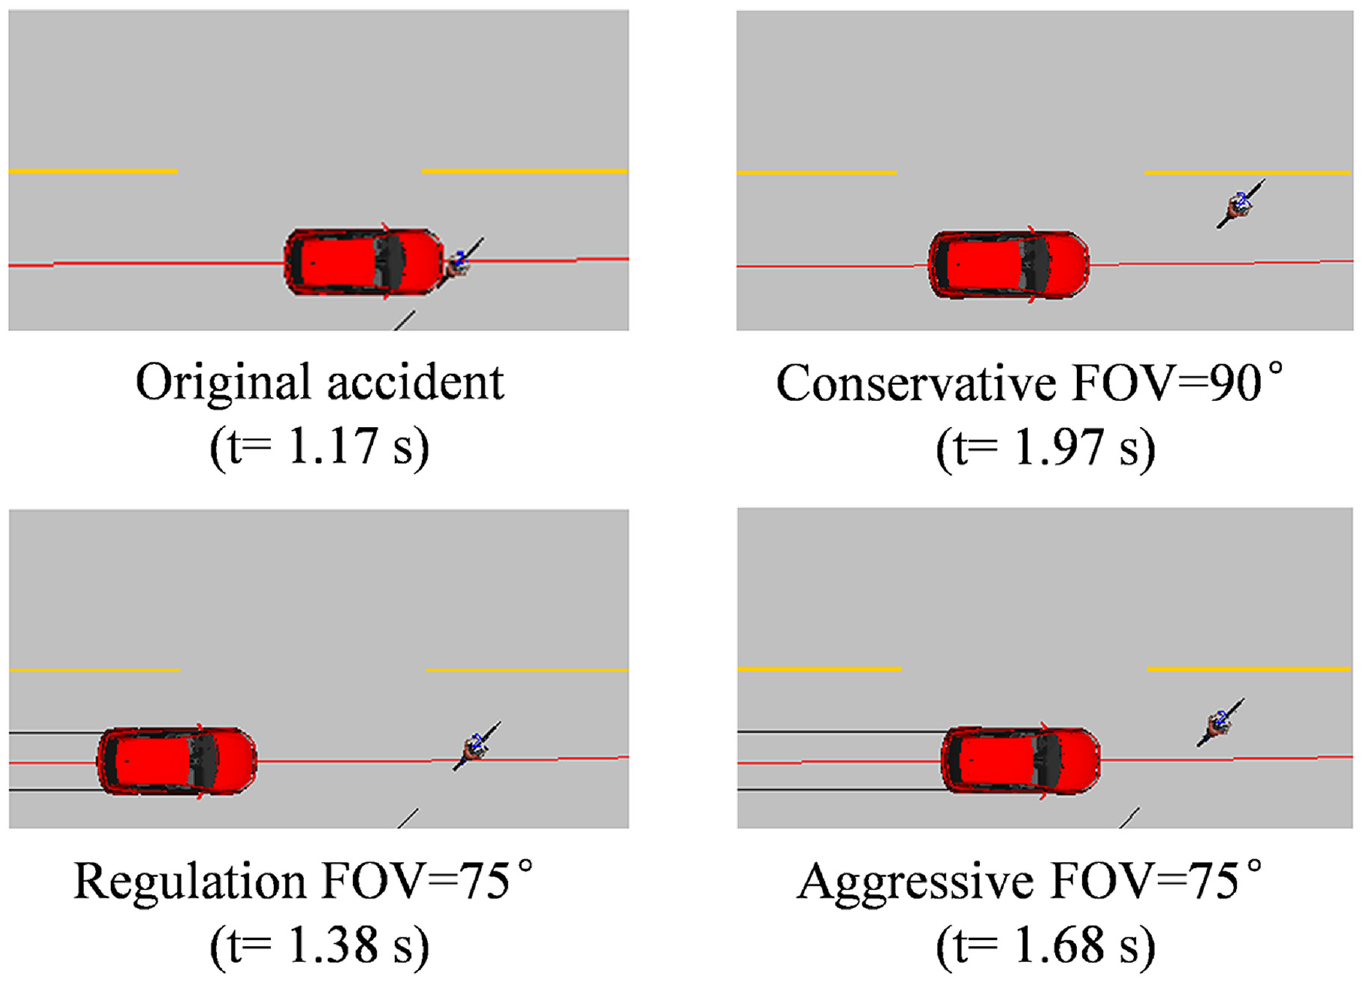
In Case 2, the original accident without the AEB system occurred at 1.17 s (Figure 9), whereas at simulation time t = 0, the crash probability model predicted that the collision probability would increase to a peak of 1.0 after 1.25 s (Figure 10), which is comparable with the actual accident situation. Because of the closeness of the collision partners when first visible in the video, the probability that a collision would occur between the cyclist and the vehicle had reached 1.0 at time = 0 for the simulation (see Figure 11). This indicated that the accident was unavoidable if no action was taken to avoid the collision. When the accident was resimulated by equipping the vehicle with three different AEB systems, as in Case 1, the accident was avoided in all cases. Despite the collision probability being 1.0 at the start of simulation, the trigger times for the three AEB systems still differed significantly. The AEB system with a conservative braking preference came into play at t = 0; the collision probability also decreased from 1.0, followed by a slower decrease in collision probability at 0.4 s. In the regulation-based AEB system, the
Results of the collision simulation for Case 2. In the case of using autonomous emergency braking (AEB), the collision was avoided.
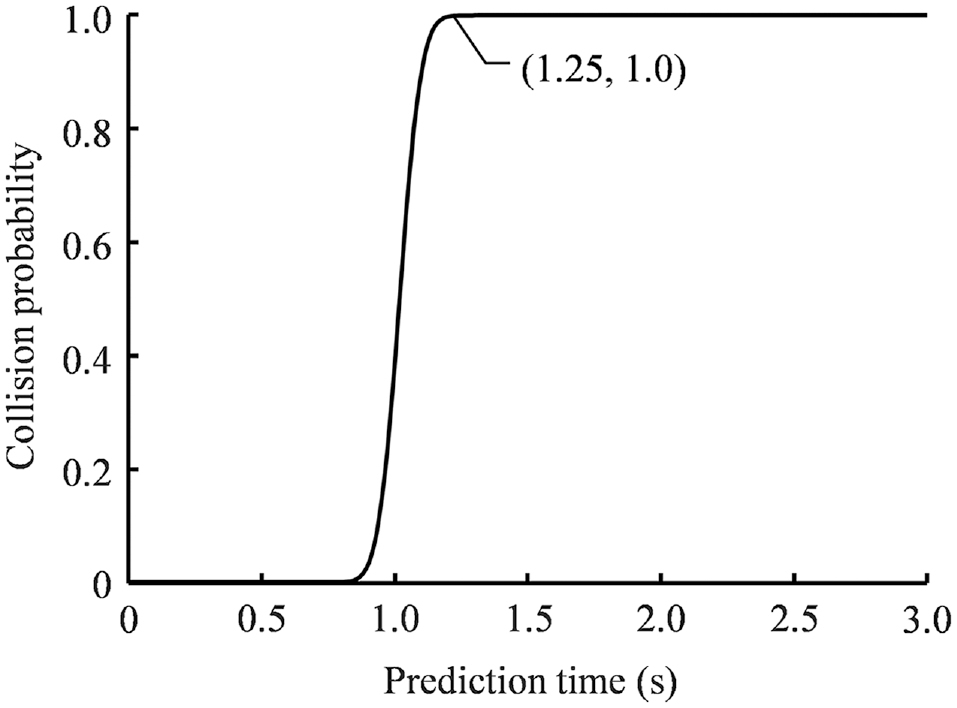
Prediction of the collision probability at t = 0 s for Case 2.
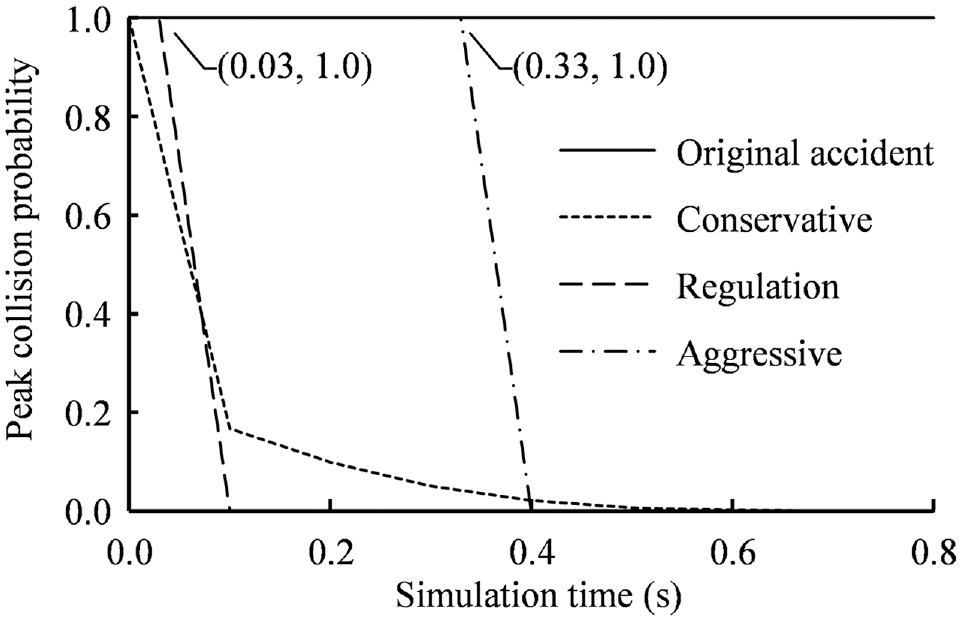
Collision probability predictions of different autonomous emergency braking (AEB) preferences for Case 2.
Figures 12 to 14 show the simulation results for Case 3. According to Figure 13, the collision probability prediction at the simulation time of 1.3 s shows that the collision probability increased to the maximum value after 0.85 s. Therefore, the predicted collision time of 2.13 s is comparable with the actual accident time of 2.02 s (see Figure 12), which demonstrates that the collision probability model is valid. For the whole simulation process (see Figure 14), the collision probability without AEB increased from an initial value of 0.04 to 0.99 at 1.2 s and then maintained this value to the end of the simulation. When the accident vehicle was equipped with the three different AEB systems, the collision probability was significantly reduced until it became 0, indicating that the accident was avoided in all cases. Compared with Case 1 and Case 2, the collision probability when AEB was triggered was lower in Case 3. With the conservative settings, the AEB system started to intervene at a simulated time of 0.52 s, making the collision probability instantly reduce from 0.36 to 0 within 0.1 s. In the regulation-based system, the
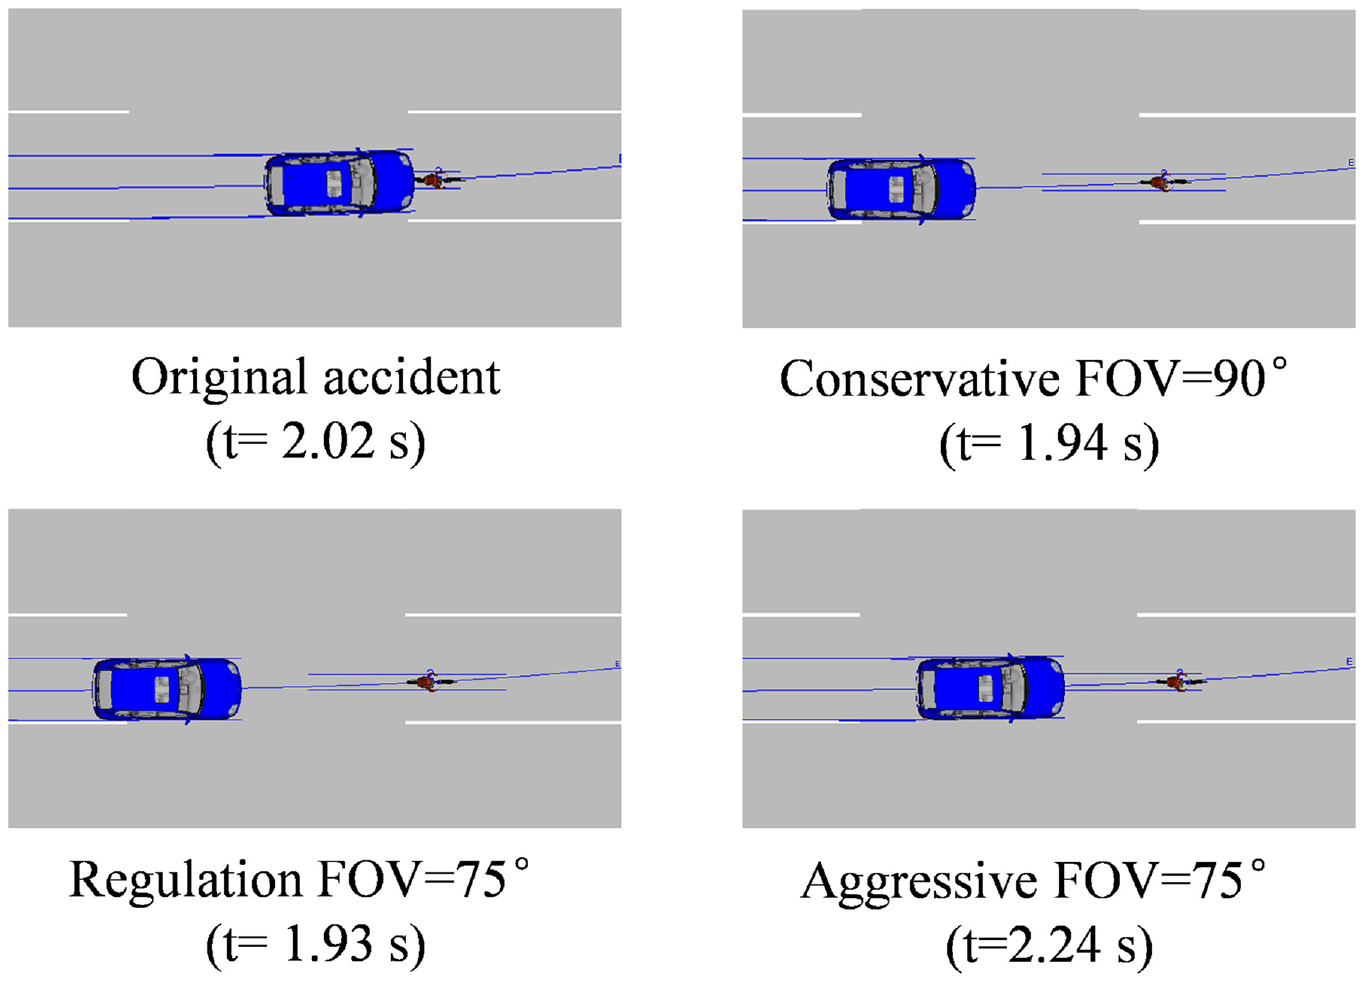
Results of the collision simulation for Case 3. In the case of using autonomous emergency braking (AEB), the collision was avoided.
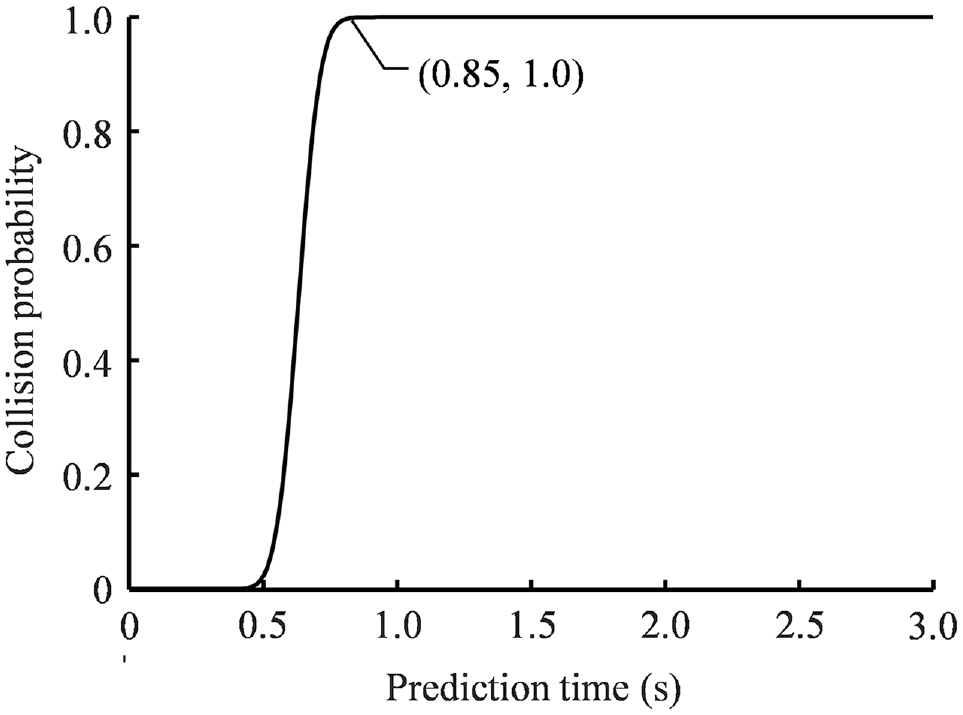
Prediction of the collision probability at t = 1.3 s for Case 3.
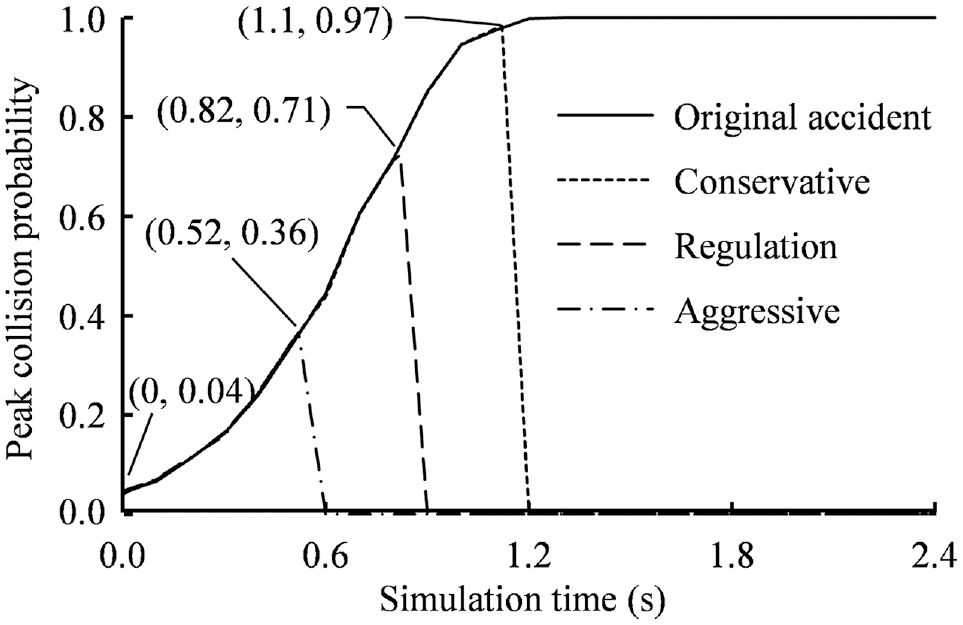
Collision probability predictions of different autonomous emergency braking (AEB) preferences for Case 3.
Discussion
In this study, a prediction algorithm for collision probabilities associated with cyclists’ uncertain movements was proposed and validated by using PC-Crash to simulate the results of three real-world accidents involving cyclists. The model could predict the time of collision witnessed in the video when the actual behavior of the cyclist was replaced with the modeled behavior. The results show that the prediction model can be applied to real-world cases to effectively mitigate and avoid accidents.
The AEB system is one of the leading active safety systems available today and has been proved to be effective in avoiding accidents between VRUs and vehicles. It assesses the crash risk and performs avoidance measures by assuming that the VRU and vehicle maintain their current speed and direction of travel using
Compared with deterministic risk assessment models, collision probability models that consider the uncertainty of cyclists’ movements can predict crash risk more accurately if applied in real time. As shown in Figures 8, 11, and 14, although AEB systems with the same braking characteristics were used, the probability of an AEB-triggered collision varied considerably from one accident case to another because of the differences between the cases, indicating that a fixed trigger threshold cannot be used to assess the risk of a collision between a cyclist and a vehicle accurately. In addition, even for the conservative AEB systems, the collision probability during AEB braking can still be very high (Case 1 in Figure 8 and Case 2 in Figure 11), which may cause driver discomfort and may also lead to driver misjudgment and more serious crash consequences.
In the current study, the CCA model was used as the vehicle model because of its accuracy and computational efficiency. However, this may not accurately describe the future movement of the vehicle because the influence of the driver was not considered. Predicting the driver’s possible operation of the vehicle based on his/her behavior will influence the future movement of the vehicle, particularly for longer simulation times. This may not have been a factor in this study because of the limited simulation time provided by the case reconstruction times (restricted by the camera’s FOV). Another shortcoming of this study is that the cyclist model did not consider the influence of the environment ( 38 ). In addition, although it is feasible to predict the trajectory of cyclists over a short period of time using the model, its accuracy and adaptability were limited.
Conclusions
In this study, a collision probability prediction algorithm considering the uncertainty of cyclists’ movements was proposed and validated based on simulations in PC-Crash of three real-world accidents involving cyclists. The results show that the prediction model can be effectively used for collision risk assessment of real-world conflicts. In addition, compared with the AEB system in the deterministic prediction model, the collision probability prediction model can assess the collision risk more accurately. This study provides information for improving collision avoidance strategies.
Supplemental Material
sj-docx-1-trr-10.1177_03611981221121270 – Supplemental material for Probabilistic Prediction of Collisions between Cyclists and Vehicles Based on Uncertainty of Cyclists’ Movements
Supplemental material, sj-docx-1-trr-10.1177_03611981221121270 for Probabilistic Prediction of Collisions between Cyclists and Vehicles Based on Uncertainty of Cyclists’ Movements by Di Pan, Yong Han, Qianqian Jin, Jin Kan, Hongwu Huang, Koji Mizuno and Robert Thomson in Transportation Research Record
Footnotes
Author Contributions
The authors confirm contribution to the paper as follows: study conception and design: Y. Han, H. W. Huang; data collection: Q. Q. Jin, J. Kan; analysis and interpretation of results: D. Pan, Q. Q. Jin, J. Kan; draft manuscript preparation: D. Pan, Q. Q. Jin, Y. Han, R. Thomson, K. Mizuno. All authors reviewed the results and approved the final version of the manuscript.
Declaration of Conflicting Interests
The author(s) declared no potential conflicts of interest with respect to the research, authorship, and/or publication of this article.
Funding
The author(s) disclosed receipt of the following financial support for the research, authorship, and/or publication of this article: The authors would like to acknowledge the support of the National Natural Science Foundation of China (Project No: 51775466), the Fujian Provincial Science Foundation for distinguished young scholars (Project No: 2019J06022), the State Key Laboratory of Automotive Safety and Energy under Project No. KF2005, and the Education and Research Project conducted by the Fujian Provincial Finance Department (File No. (2021)-103). The research was supported by Toyota China.
Supplemental Material
Supplemental material for this article is available online.
References
Supplementary Material
Please find the following supplemental material available below.
For Open Access articles published under a Creative Commons License, all supplemental material carries the same license as the article it is associated with.
For non-Open Access articles published, all supplemental material carries a non-exclusive license, and permission requests for re-use of supplemental material or any part of supplemental material shall be sent directly to the copyright owner as specified in the copyright notice associated with the article.