
Abstract
The catchment areas of subway stations have always been considered as a circular shape in previous research. Although some studies show the catchment area may be affected by road conditions, public transportation, land use, and other factors, few studies have discussed the shape of the catchment area. This study focuses on analyzing the anisotropy of catchment areas and developing a sound methodology to generate them. Based on taxi global positioning system (GPS) data, this paper first proposes a data mining method to identify feeder taxi trips around subway stations. Then, a fan-shaped model is proposed and applied to Xi’an Metro Line 1 to generate catchment areas. The number and angle of fan areas are determined according to the spatial distribution characteristics of GPS points. Results show that the acceptable distance of the catchment area has significant differences in different directions. The average maximum acceptable distance of one station is 2.31 times the minimum. Furthermore, for feeder taxis, the overlap ratio of the catchment area is very high. Travelers in several places could choose several different stations during the travel. A multiple linear regression model was introduced to find the influencing factors, and the result shows the anisotropy of the catchment area is affected not only by neighboring subway stations, but also by the road network, distance from the city center, and so on.
The subway has become one of the main transport modes in big cities because of its high speed and punctuality. Because of its low accessibility (i.e., a long distance from one subway station to another), many passengers need another mode of transportation to get to subway stations or a destination. The problem is called “the first- or last-mile problem.” Analyzing the feeder services of the subway is an important way to understand regional traffic characteristics and improve the service of the subway. As such, the identification of the transit catchment area of feeder services becomes important.
A subway station’s catchment area is defined as a region where most of the station passengers come from ( 1 ). Studying the catchment area of feeder services is of great help in planning regional public transportation and land use layout and designing reasonable transportation policy, as well as improving the transportation environment of residents.
Many scholars have carried out research on different kinds of transfer traffic modes, including walking ( 2 , 3 ), cycling ( 4 – 7 ), buses ( 8 , 9 ), and so on. However, studying the feeder taxis of subway stations is often ignored by researchers ( 10 ). Nowadays, more people are willing to use both taxis and subways to complete their trips because of the favorable environment of subways built over the past decades and fast-developing online taxi services ( 11 ). Relevant research shows that the existence of subway stations has a positive effect on taxi passenger flow ( 12 ). Feeder taxi trips can make up for the shortcomings of the subway, such as low flexibility, limited catchment area, and so on. Furthermore, based on the distance decay theory, if a demand generating area of feeder taxis is far away from the station, this means a large proportion of travelers need to take a taxi to overcome the long distance so as to get to the station. It is likely that the service of public transportation has not been well-developed in that demand region. Therefore, studying the catchment area of feeder taxis can help city planners improve the layout of the public transportation system.
The existing literature on catchment areas is mainly focused on public transport stations, such as bus stops, tram stops ( 13 ), and subway stations ( 14 ). Some also studied the catchment area of a park and ride ( 15 ). Catchment areas are usually considered as a round shape in the existing research. The determination of the round shape radius, which is called the acceptable distance, is the most important step in delineating the catchment area ( 16 ). Take the subway station as an example. The acceptable distance from a subway station, for a mode such as walking, was determined based on experience in 1993 ( 17 ). O’Neil et al. ( 2 ) used GIS and buffer analysis to the study catchment area of stations, and they concluded that in the vicinity of subway stations, the better the walking environment was, the more acceptable a longer distance became. Later, some scholars started to develop models to study the acceptable distance from subway transit stations. In the study of subway stations, Li ( 18 ) introduced a reachability theory and selected a general travel time as a description index of reachability to obtain acceptable distances of different modes of transportation. Jiang et al. ( 19 ) used a least squares regression model to obtain the acceptable walking distance from subway stations. Generally speaking, modeling-based, convex hull-based, and buffer-based methods are common methods to generate catchment areas nowadays ( 14 ). The most frequently used one is the buffer-based method, with which the buffer area can be delimited by a circle or a network distance ( 14 ). Many scholars also used the network distance to cut the buffer area and took the road conditions into account ( 20 ). This method generally determined an acceptable distance or time in advance according to the actual travel data or surveys, and then the catchment area was determined according to the road conditions.
Some researchers ( 1 ) have begun to discuss the spatial boundary of park and ride catchment areas in recent years, but for the catchment area of subway stations, almost all the studies use a circle as the default geometry, which needs further study and discussion. Besides the travel distance, the road network conditions, destination direction, land use around the subway station, and other public transportation would all affect the shape of the catchment area. Therefore, a circle may not be a precise geometry to describe the catchment area. The anisotropy of the catchment area is a kind of property in which the acceptable distance is changed by different spatial angles in this manuscript. If the characteristic of anisotropy is considered when generating the catchment area, then the impact of road network conditions, land use, and other factors can be shown in the differences of acceptable distances in different directions. So, considering the anisotropy of the catchment area can better describe the spatial distribution of catchment areas, and can help planners set transport policy in a more reasonable and sustainable way. The anisotropic characteristic of the catchment area can also be a reference to the city planner when making a plan for the land use and public transportation system. However, how to divide the space around a subway station to reflect the anisotropic characteristic is a challenging task.
This study uses taxi global positioning system (GPS) data to analyze the catchment area of the subway station. For a long time, scholars have focused on the identification of taxi hotspots ( 21 – 23 ) and trajectory research to provide a basis for public transport development ( 24 , 25 ). For example, Li et al. ( 26 ) analyzed taxi GPS data and the transaction data of new subway lines to explore the impact of an opening subway line on taxi passengers from the space and time dimensions. After the subway was opened, they found that most passengers who used to take taxis chose a combination of a taxi and the subway. The taxi was mainly used for the last mile of the trip. Wang and Ross ( 27 ) explored the interaction between taxis and subways and divided the relationship into three categories: the transit-extending taxi trip, transit-competing taxi trip, and transit-complementing taxi trip. The transit-extending taxi trip can approximately be regarded as the feeder taxi trip. They found that a competitive relationship accounted for the largest proportion. The travel distance of transit-extending taxi trips is much smaller than that of other types. However, Jiang et al. ( 28 ) reached a conclusion that is almost completely the opposite. Their results showed that the transit-complementing trip was the most common one, and the transit-extending taxi trip had the longest distance. The inconsistencies in the criteria for classifying taxis in these two studies may be one of the reasons for the opposite results. So how to classify taxi trips is especially important.
This paper first obtains feeder taxi data by developing a data mining method based on a field survey and GPS data. Then, a fan-shaped model based on mathematical statistics is proposed to demonstrate the anisotropy of acceptable distance. The model determined acceptable distances in different directions by the spatial distribution of feeder taxi points. A new method is proposed to select the acceptable distances when considering the anisotropy of the catchment area.
The contents of this paper are organized as follows. The second section mainly describes the processing of taxi GPS data. The third section introduces the fan-shaped model for determining the catchment area of feeder taxis. The fourth section discusses and analyzes the relevant results of the study, and finally a conclusion is drawn in the fifth section.
Data Preparation
As the ancient capital of 13 dynasties, Xi’an is a city with a profound history and culture. In recent years, it has also been rated as the national central city. There are five subway lines in Xi’an now and, according to the plan, Xi’an will have nearly 20 subway lines in the next decade. We use about 100 million taxi GPS data points of Xi’an, on 17–20 April 2017, and take Subway Line 1 as an example. Since the taxi GPS data could not distinguish the feeder taxi data that transfers to the subway (from those that do not), this paper needs to filter and extract the feeder taxi GPS data first.
Classification and Recognition of Taxi Trips
According to the previous research ( 27 , 28 ), taxi trips are divided into three groups, namely, competitive relationship, complementary relationship, and extending relationship, as defined below.
(1) Transit-extending taxi trip refers to a trip that improves the accessibility of the subway. Most trip passengers have taken or will take the subway to complete the whole trip. In this paper, this kind of trip is regarded as a feeder taxi trip.
(2) Transit-competing taxi trip means that one can use the subway to complete the whole trip, and the taxi and subway are in a competing relationship.
(3) Transit-complementing taxi trip refers to taxi trips that the subway cannot complete, and there is no direct relationship with the subway.
The three relationships are shown in Figure 1.
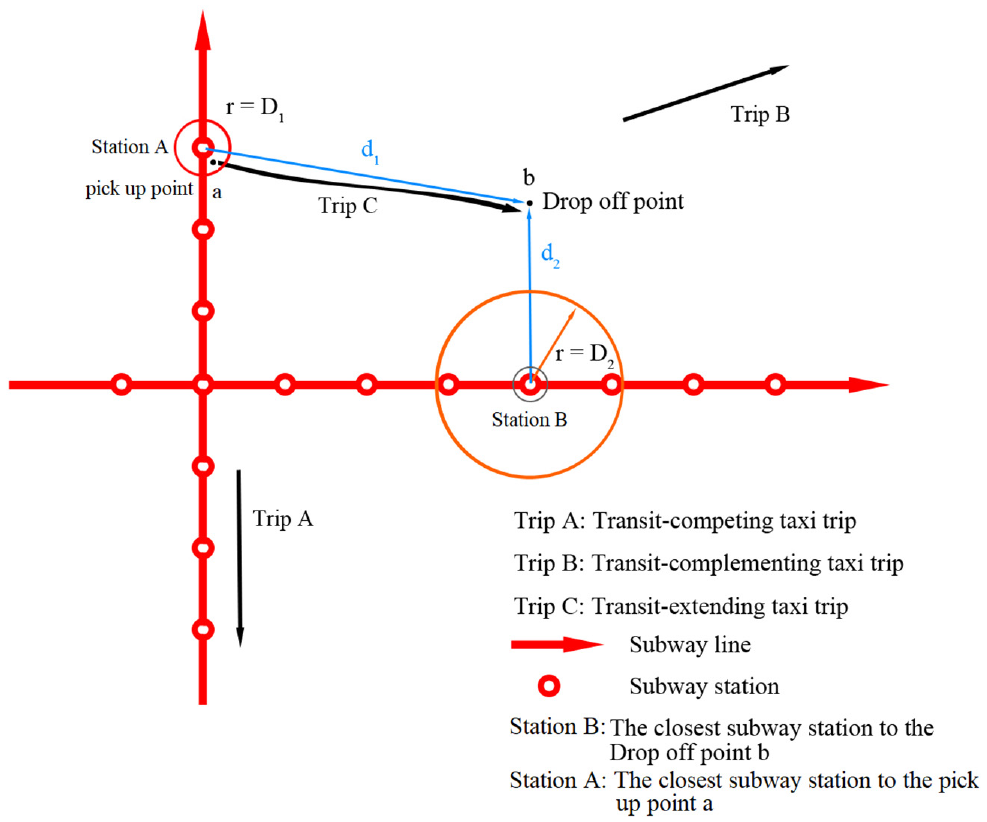
Classification of taxi trips.
Figure 1 shows the three relationships between taxis and the subway. This paper mainly studies the transit-extending taxi trip, which can also be called the feeder taxi trip. The focus of this section is to study in what circumstances would this kind of trip happen. Therefore, the other two kinds of trips are not described in further detail.
Trip C is a transit-extending taxi trip, also called a feeder taxi trip. Its pick-up point is near station A, where it is easy for the customer to transfer from the subway to a taxi. It finishes at point b. Point b is not close to any subway station, so it is difficult for passengers to walk there. The total travel distance is
Condition 1: one end of the taxi trip is close to the subway station, for which the distance is less than
Condition 2: the other end of the taxi trip is far away from the closest subway station and the distance must be greater than
Condition 3: as shown in Figure 1, the gap between distance


The data mining method is shown in Figure 2.
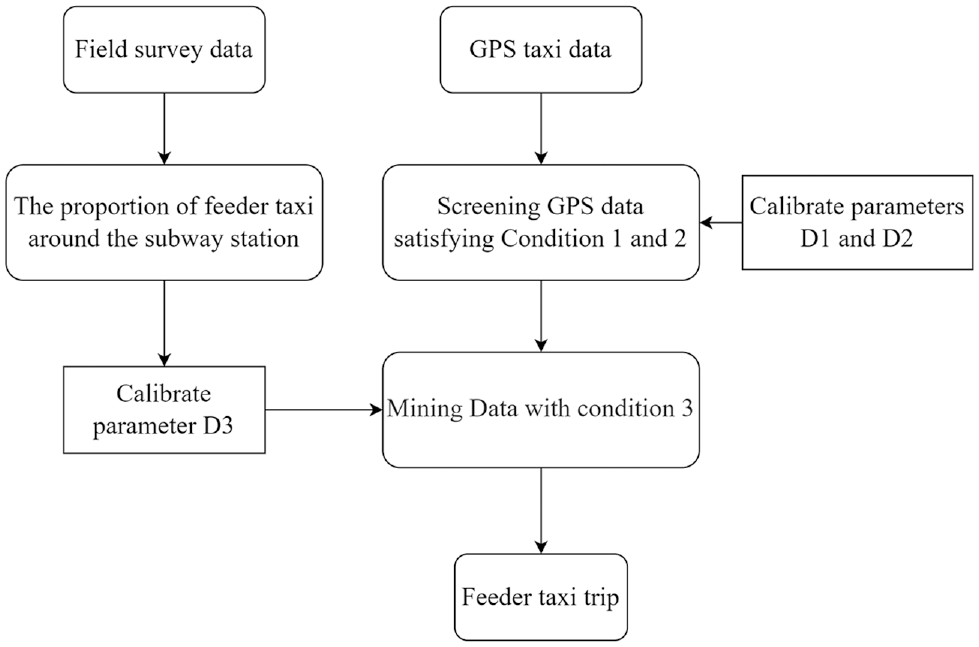
The mining method of feeder taxi trips.
Parameter Calibration
Since there are three parameters
The Calibration of Parameters
and
This paper selects a specific subway station in Xi’an– Banpo Subway Station to conduct research. On 9 July 2019, from noon to 3 p.m., we conducted an on-the-spot investigation on the four entrances of Banpo Station, and recorded a total of 200 taxi data items. The result of the distance between the taxi point and subway station is shown in Figure 3. In Figure 3, the entrances and exits of subway stations A–C transfer to roads, and then correspond to points 1–3 in order. The statistical results show that all feeder taxi data is within 100 m from the subway station.
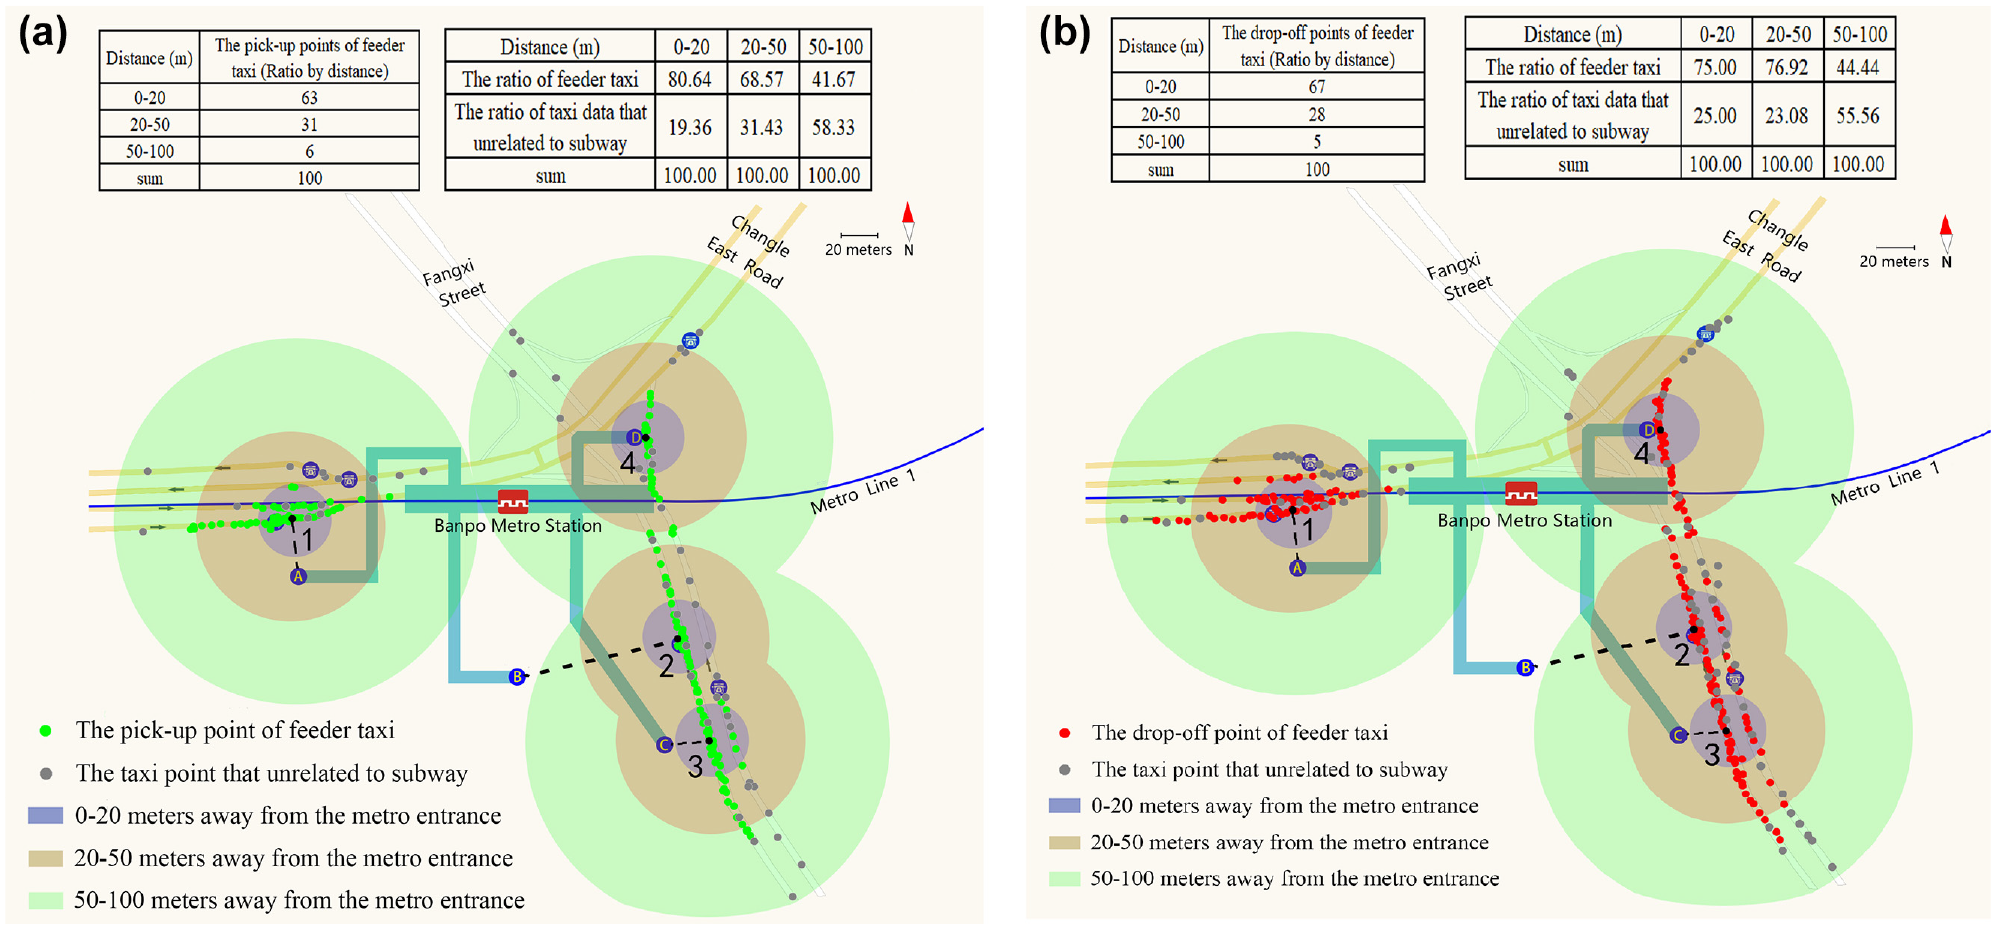
The spatial distribution of taxi trip points near Banpo Station: (a) leaving subway stations and (b) arriving at subway stations.
It can be observed from Figure 3 that most drop-off and pick-up points of feeder taxis are within 20 m of the subway station, and all the drop-off and pick-up points are within 100 m. Therefore, according to the current research results, it can be considered that if the drop-off or pick-up point is more than 100 m away from the subway station, it is basically impossible to be related to the subway, so
Many studies have shown that the pedestrian service radius of the subway station is between 600 and 700 m (
29
,
30
). This distance is affected by many factors, such as road conditions, weather, and personal preferences. If the other end of the taxi journey is too close to the subway station, passengers can take the subway directly and walk to the destination, so the value of
The Calibration of Parameter
The calibration method of
According to the above research results, we import the GPS trajectory data of taxis on 17–20 April 2017 in Xi’an. The data includes equipment ID, license plate number, acquisition time, latitude and longitude, instantaneous vehicle speed, vehicle orientation, and vehicle status. The vehicle state changed at the place where passengers get into and out of the taxi. The data is considered invalid when the travel time is shorter than 60 s or longer than 5 h. After removing invalid data, the origin–destination (OD) data that related to Banpo Station is taken as the research dataset. The OD data was selected if they satisfied the first two parameters, which are that one end of OD is within
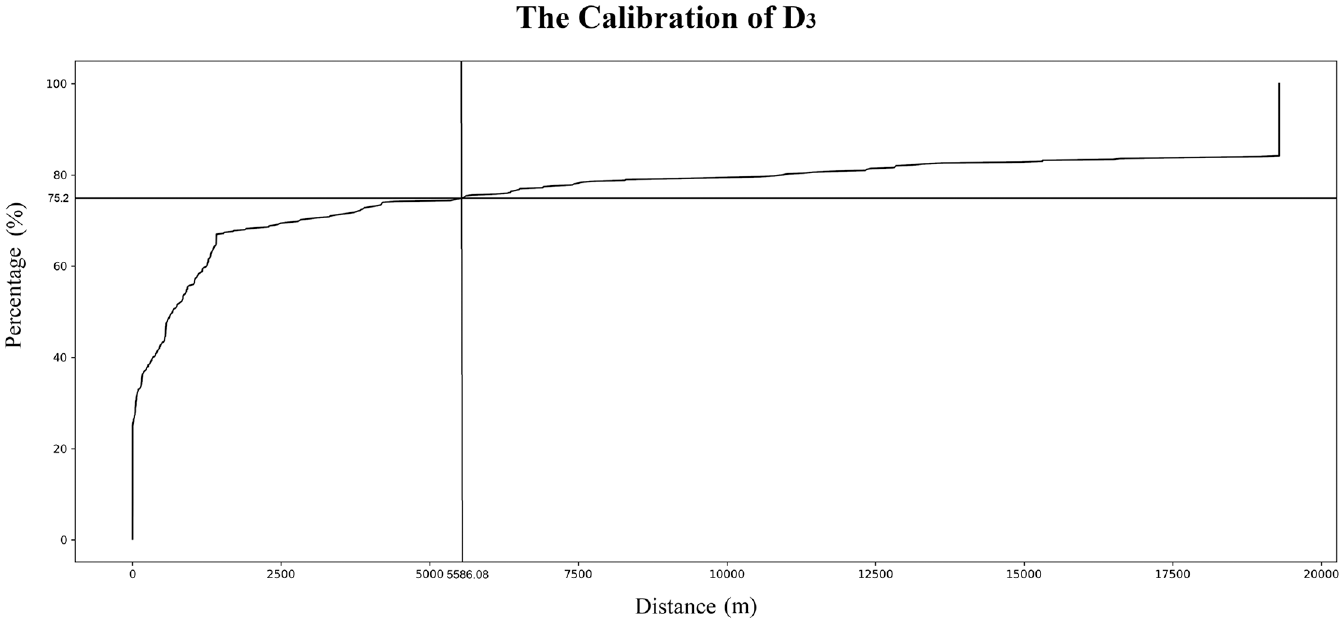
The calibration of
Figure 5 shows the distribution of all GPS data and the feeder taxi data of interest.
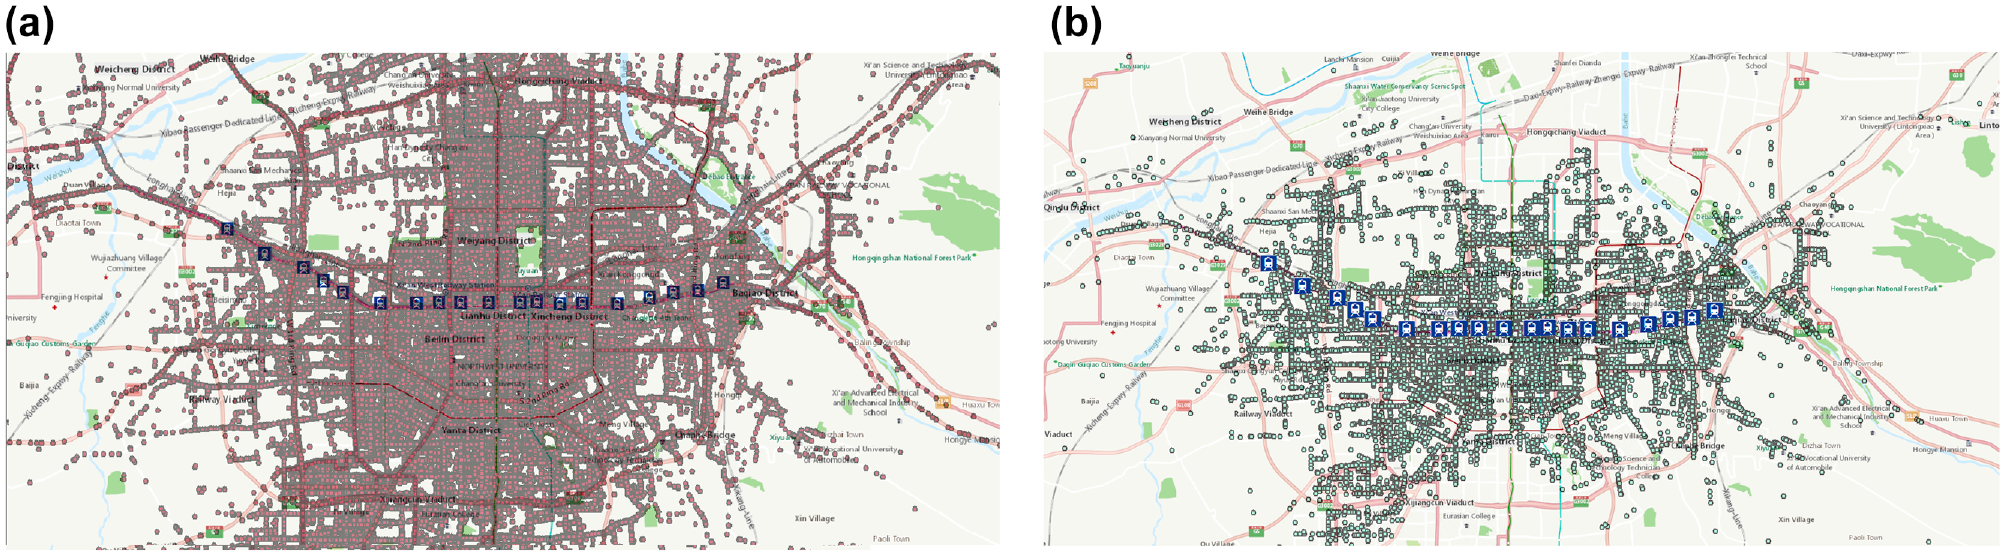
The spatial distribution of subway station and taxi global positioning system (GPS) data: (a) original taxi GPS data and (b) feeder taxi GPS data.
Catchment Area Generation Based on the Fan-Shaped Model
Generation Method of the Catchment Area
When studying the catchment area of subway stations, the previous literature all assumed that the acceptable distance of each direction was the same, which failed to consider that the differences in road conditions, public transportation, land use, or other factors in different directions may influence the acceptable distance of the subway station. To analyze the anisotropy of acceptable distance, this paper takes the subway station as the vertex and divides the space around the subway station into sectors with different angles. Each sector has its own acceptable distance and would be cut by network distance. The generation of the catchment area can be divided into following steps.
Step 1: find the shortest path from the point of interest to the subway station. The point of interest is a pick-up or drop-off point far away from the subway station during a feeder taxi trip. Therefore, travel points near subway stations must be eliminated. Specifically speaking, the excluded data points include drop-off points of feeder taxi travel that go to the subway station and pick-up points of feeder taxi travel that depart from the subway station. The shortest path is based on the road network, and the path searching is performed through the built-in algorithm of ArcGIS.
Step 2: divide the space of each subway station into several fan-shaped areas and find the acceptable distance for each sector. The subway station is the center of the circle. The number of sectors, acceptable distance, and angle of each sector area are determined according to the distribution and distance of point of interest to the subway station. The fan-shaped model is established to decide these important factors.
Step 3: generate the catchment area of each sector. The range of each sector is generated by network analysis in ArcGIS software based on the road network around the subway station. A trim distance of 100 m was applied to trim a catchment area, thereby restricting it to this specified distance near the outer edges ( 14 ). The catchment area generated in this step needs to be tailored by angle to form a sector. Cropping is based on the start and end angle of each sector generated in the second step.
Step 4: splicing sectors to determine the catchment area of the station. According to the angle, the fan-shaped areas of the same station are spliced with each other to obtain the final catchment area.
The process is shown in Figure 6.
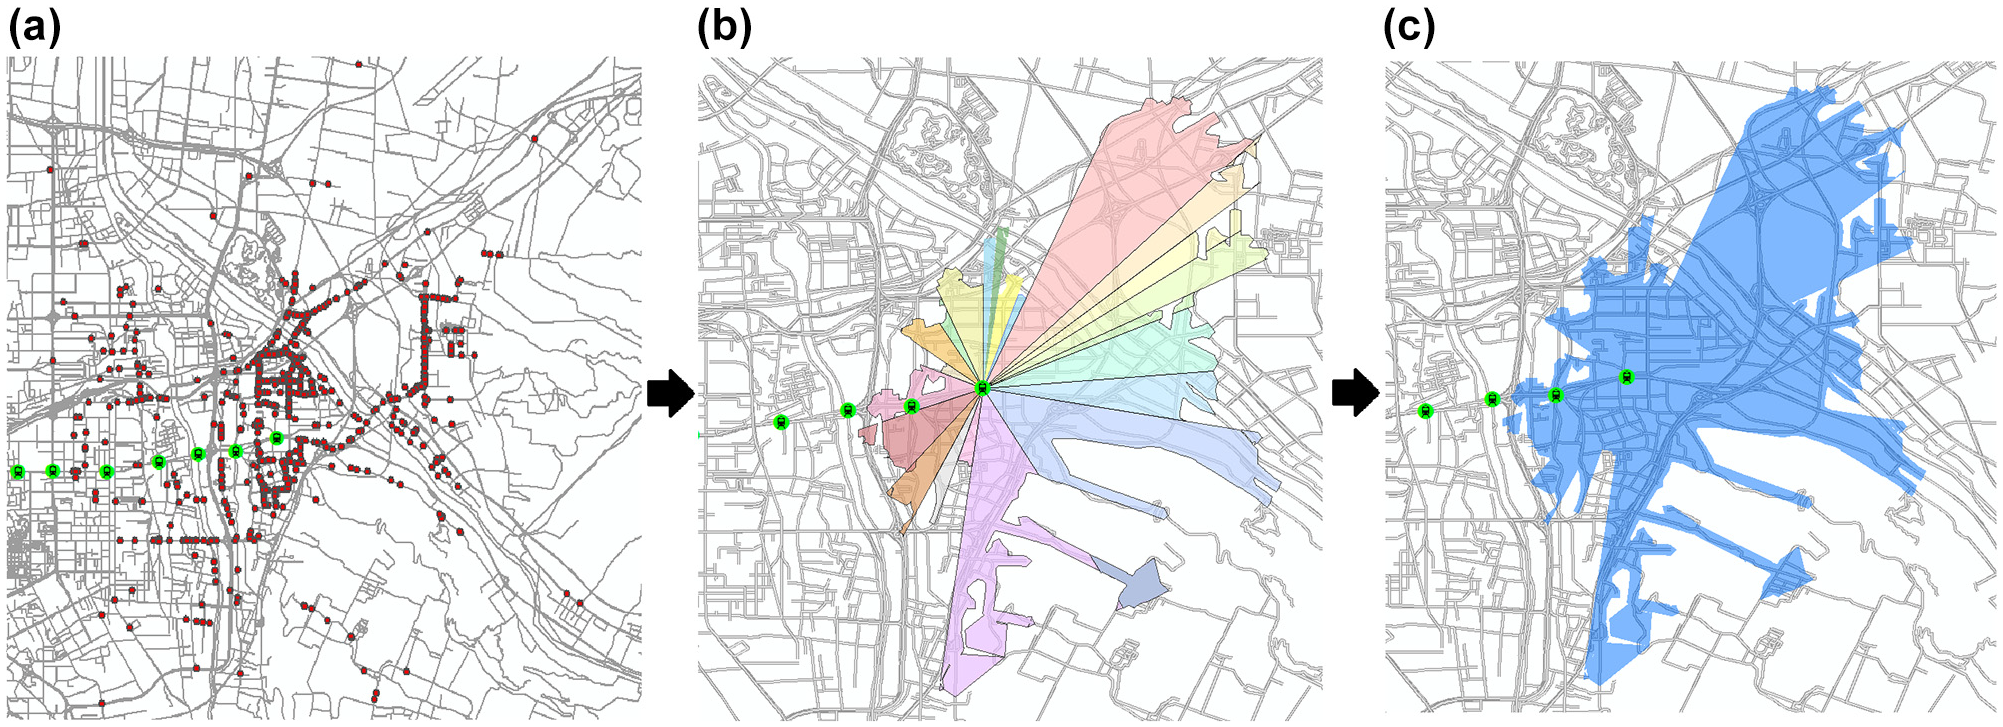
Sector splicing in generating the catchment area: (a) find the points that belong to the interest station and calculate the distance of each point, (b) split the space into different sectors, generate and crop each of their catchment areas, and (c) splice sectors to determine the catchment area of the station.
Fan-Shaped Model
The most important parts of generating the catchment area are to determine how many sectors should be generated in each station and what is the center angle and acceptable distance of each sector. Step 3 introduces a fan-shaped model to settle these questions.
Acceptable Distance
For the acceptable distance, the 75th and 85th percentiles of associated trip lengths for each station were usually adopted as suitable indicators of the “acceptable” distance (
14
,
16
). The 75th percentile trip length was selected here. However, because the catchment area is divided into several sectors, the acceptable distance of each sector may not be the 75th percentile trip length. The percentile of the acceptable distance in sector
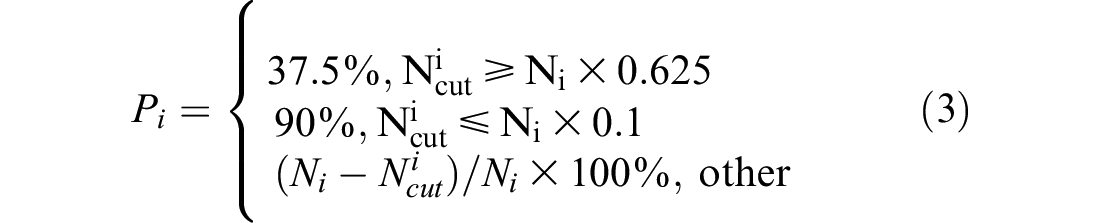
where


where
The 75th percentile trip length was selected as the acceptable distance, as we suspect the last 25% distance of the point of interest cannot represent the choice of most people. These points are called special points in this paper. The trips of special points are too far away from the subway station, since the travel might happen in special circumstances or if the traveler has special needs or considerations. These unpredictable and personal factors might occur to every traveler randomly. So, we suppose special points appeared evenly at every angle. Therefore,
Center Angle of Each Sector
Another important factor is the center angle of each sector. Since we want to study the anisotropy of acceptable distance, the more sectors in one station are divided, the more clearly the spatial characteristics will be described. However, if the number of sectors becomes higher, the center angle of each sector will be reduced. This would cause inaccuracy in determining the acceptable distance, since the 75th percentile trip length is meaningful only if the amount of data is statistically significant. Therefore, the model needs to divide the catchment area based on the spatial distribution of the points of interest. If the overall distance between points of interest and the subway station varies greatly from different angles, the number of divided sectors is likely to increase. The fan-shaped model achieves this goal by going through all points of interest twice. Each time it begins at angle
Step 1: on the first search, when the number of points of interest
Step 2: on the second search, three key parameters need to be calculated to describe the spatial distribution of the points of interest, which are
There are four cases that can generate a sector, as follows:


where
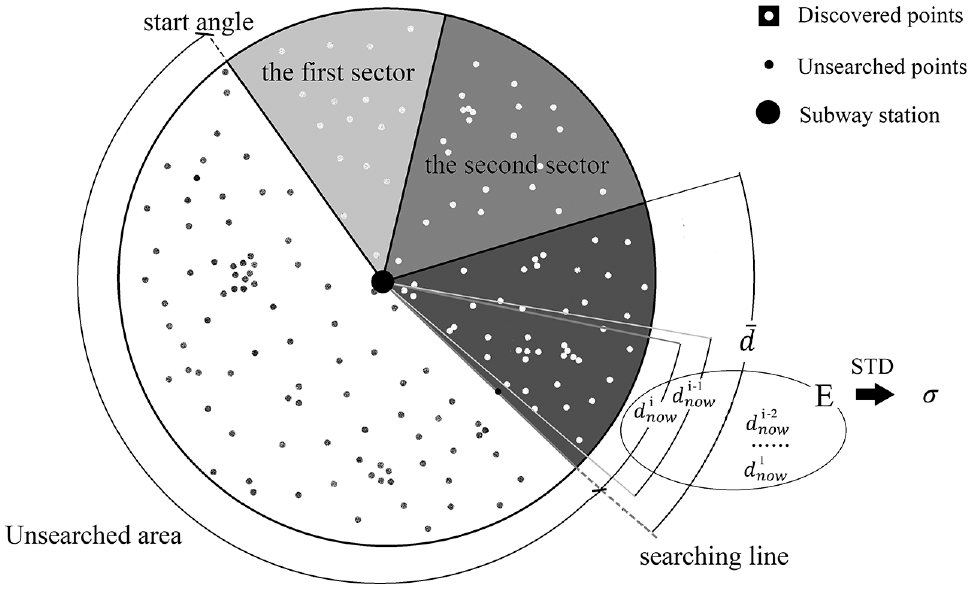
Explanation of the three key parameters.
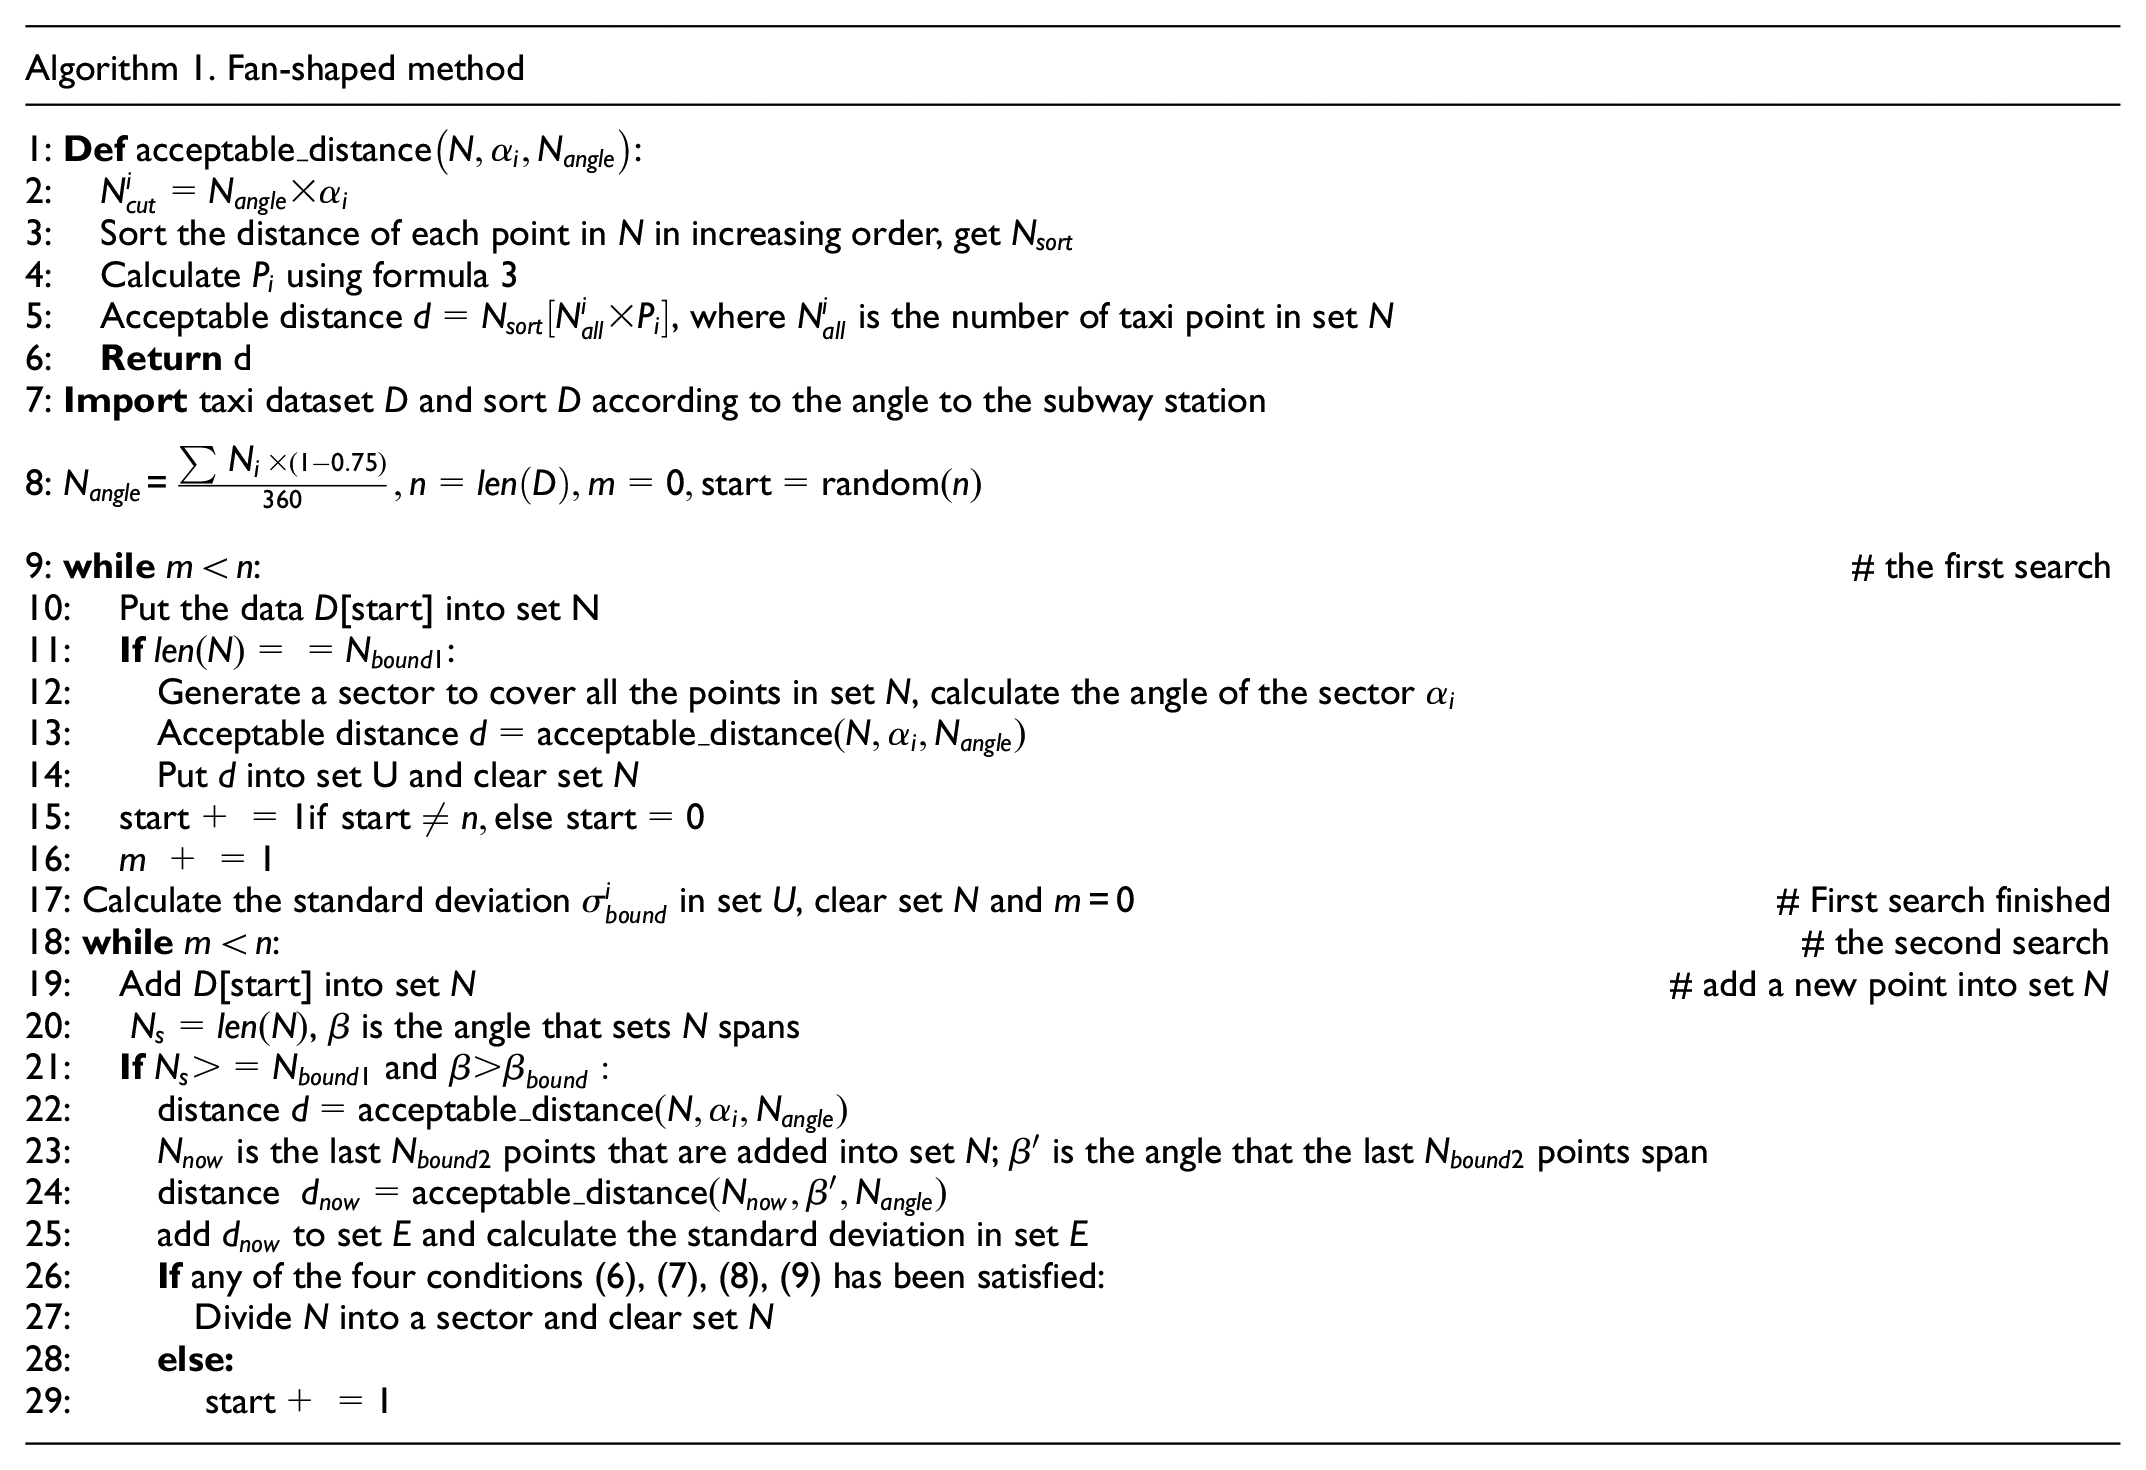
The procedure in dividing the catchment area is shown in Figure 8, and the algorithm is shown in Algorithm 1.
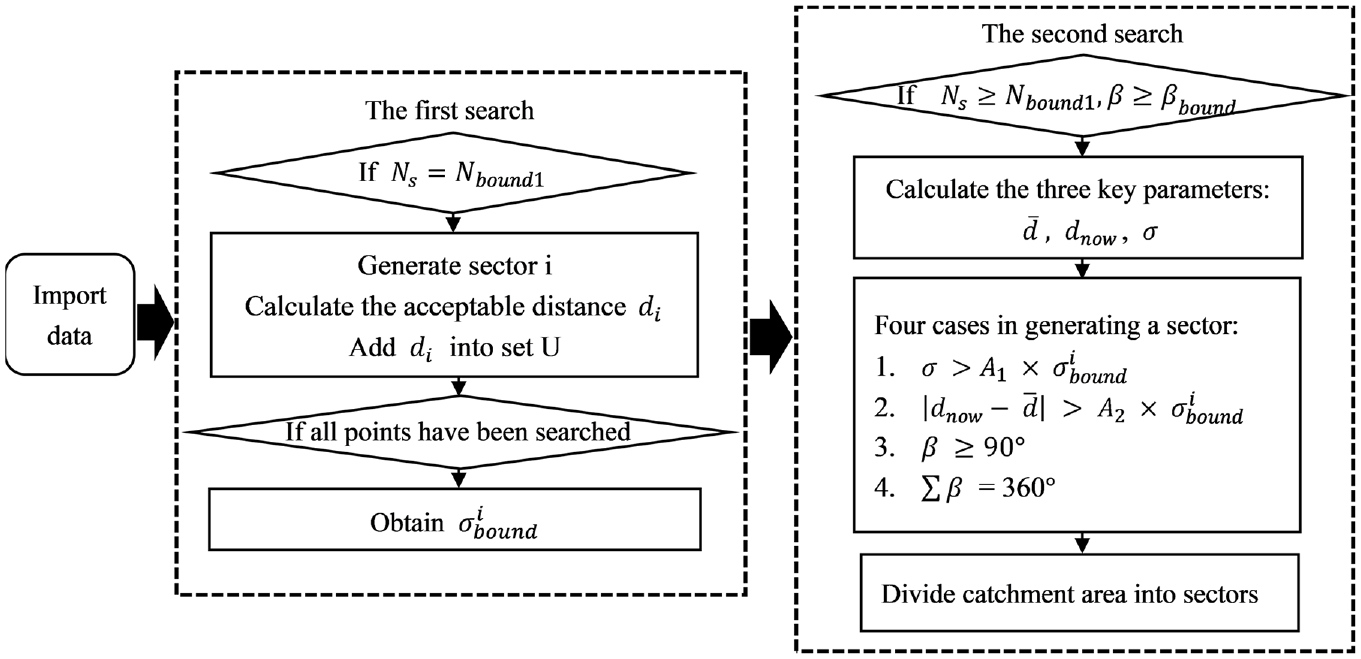
The procedure in dividing the catchment area into sectors.
Results and Discussion
Taking Xi’an Subway Line 1 as an example, this paper uses the data mining method to mine and extract the related feeder taxi data for the subway. The fan-shaped model is used to generate the catchment area of each subway station. In the fan-shaped model,
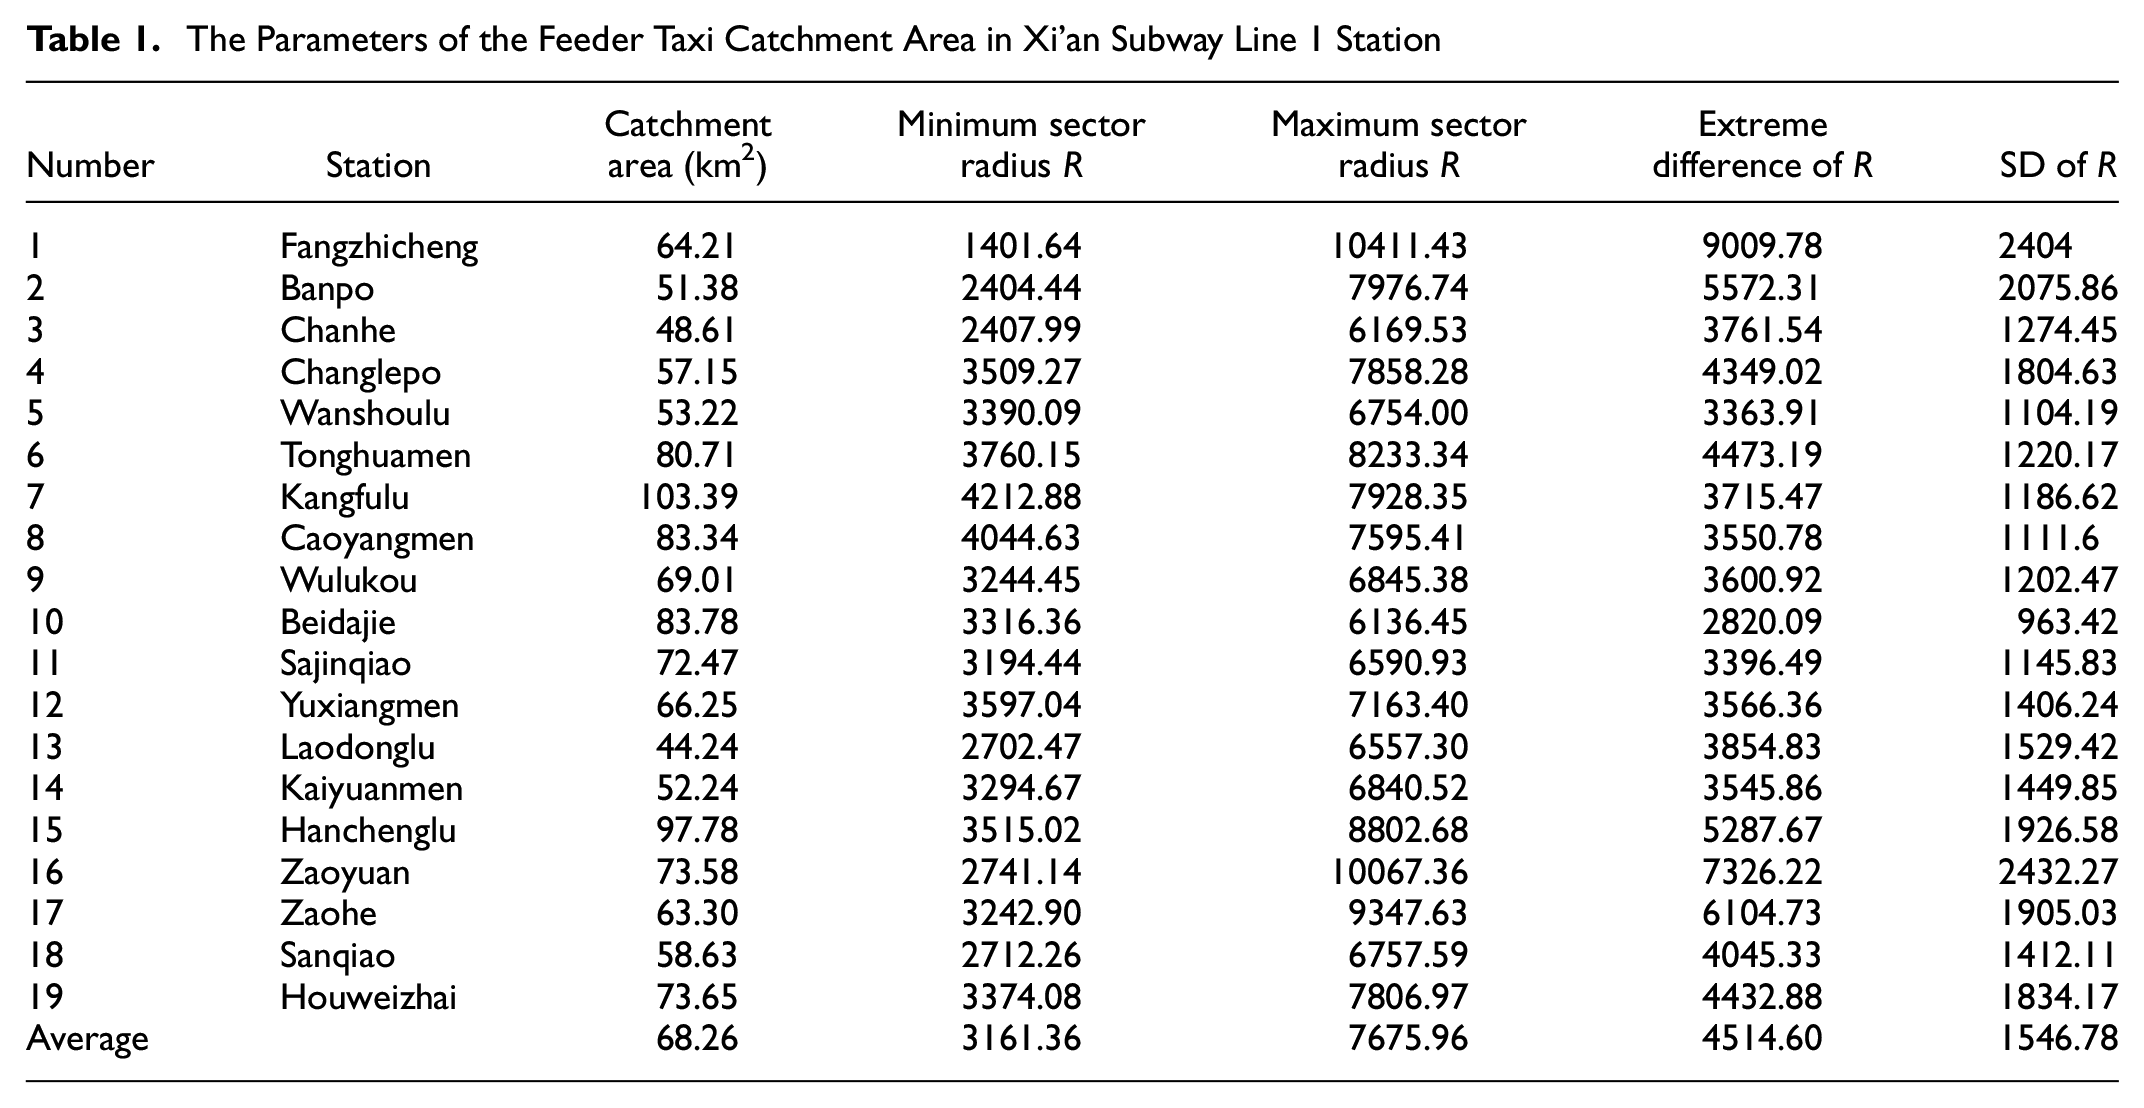
The Parameters of the Feeder Taxi Catchment Area in Xi’an Subway Line 1 Station
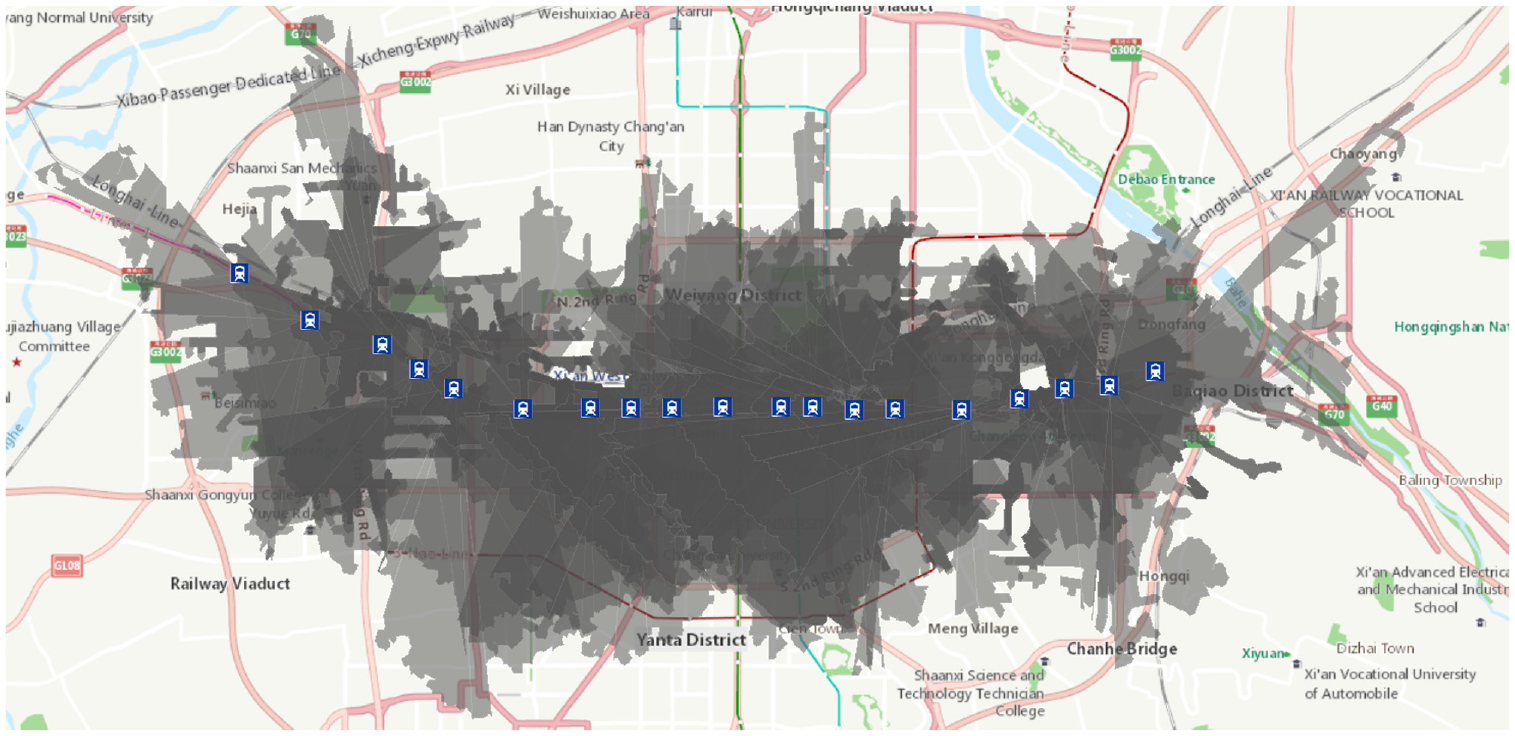
The catchment area of Xi’an Subway Line 1.
The Space Distribution of the Catchment Area
The results show that the sizes of subway station catchment areas mainly fall into the range of 50–83 km2, with an average value of 68.26 km2. As for the radius, the maximum sector radius
Comparison Between the Traditional Method and Fan-Shaped Model
After processing the taxi GPS data of each station in Xi’an Line 1, we compare the catchment areas from the proposed fan-shaped model with the network-based method. Taking No. 1, No. 3, No. 11, No. 14, No. 15, and No. 19 subway stations as examples, the comparison is shown in Figure 10. Both acceptable distances of the two methods are the distance of the 75% quantile. The blue range represents the network-based method, the black range represents the result of the fan-shaped model, and the red points are the points of interest of the subway station. It can be seen from the figure that there is a large deviation in the catchment area obtained by the two methods. When the acceptable distance of the subway station is divided from different angles, the attraction radii of different areas are quite different.
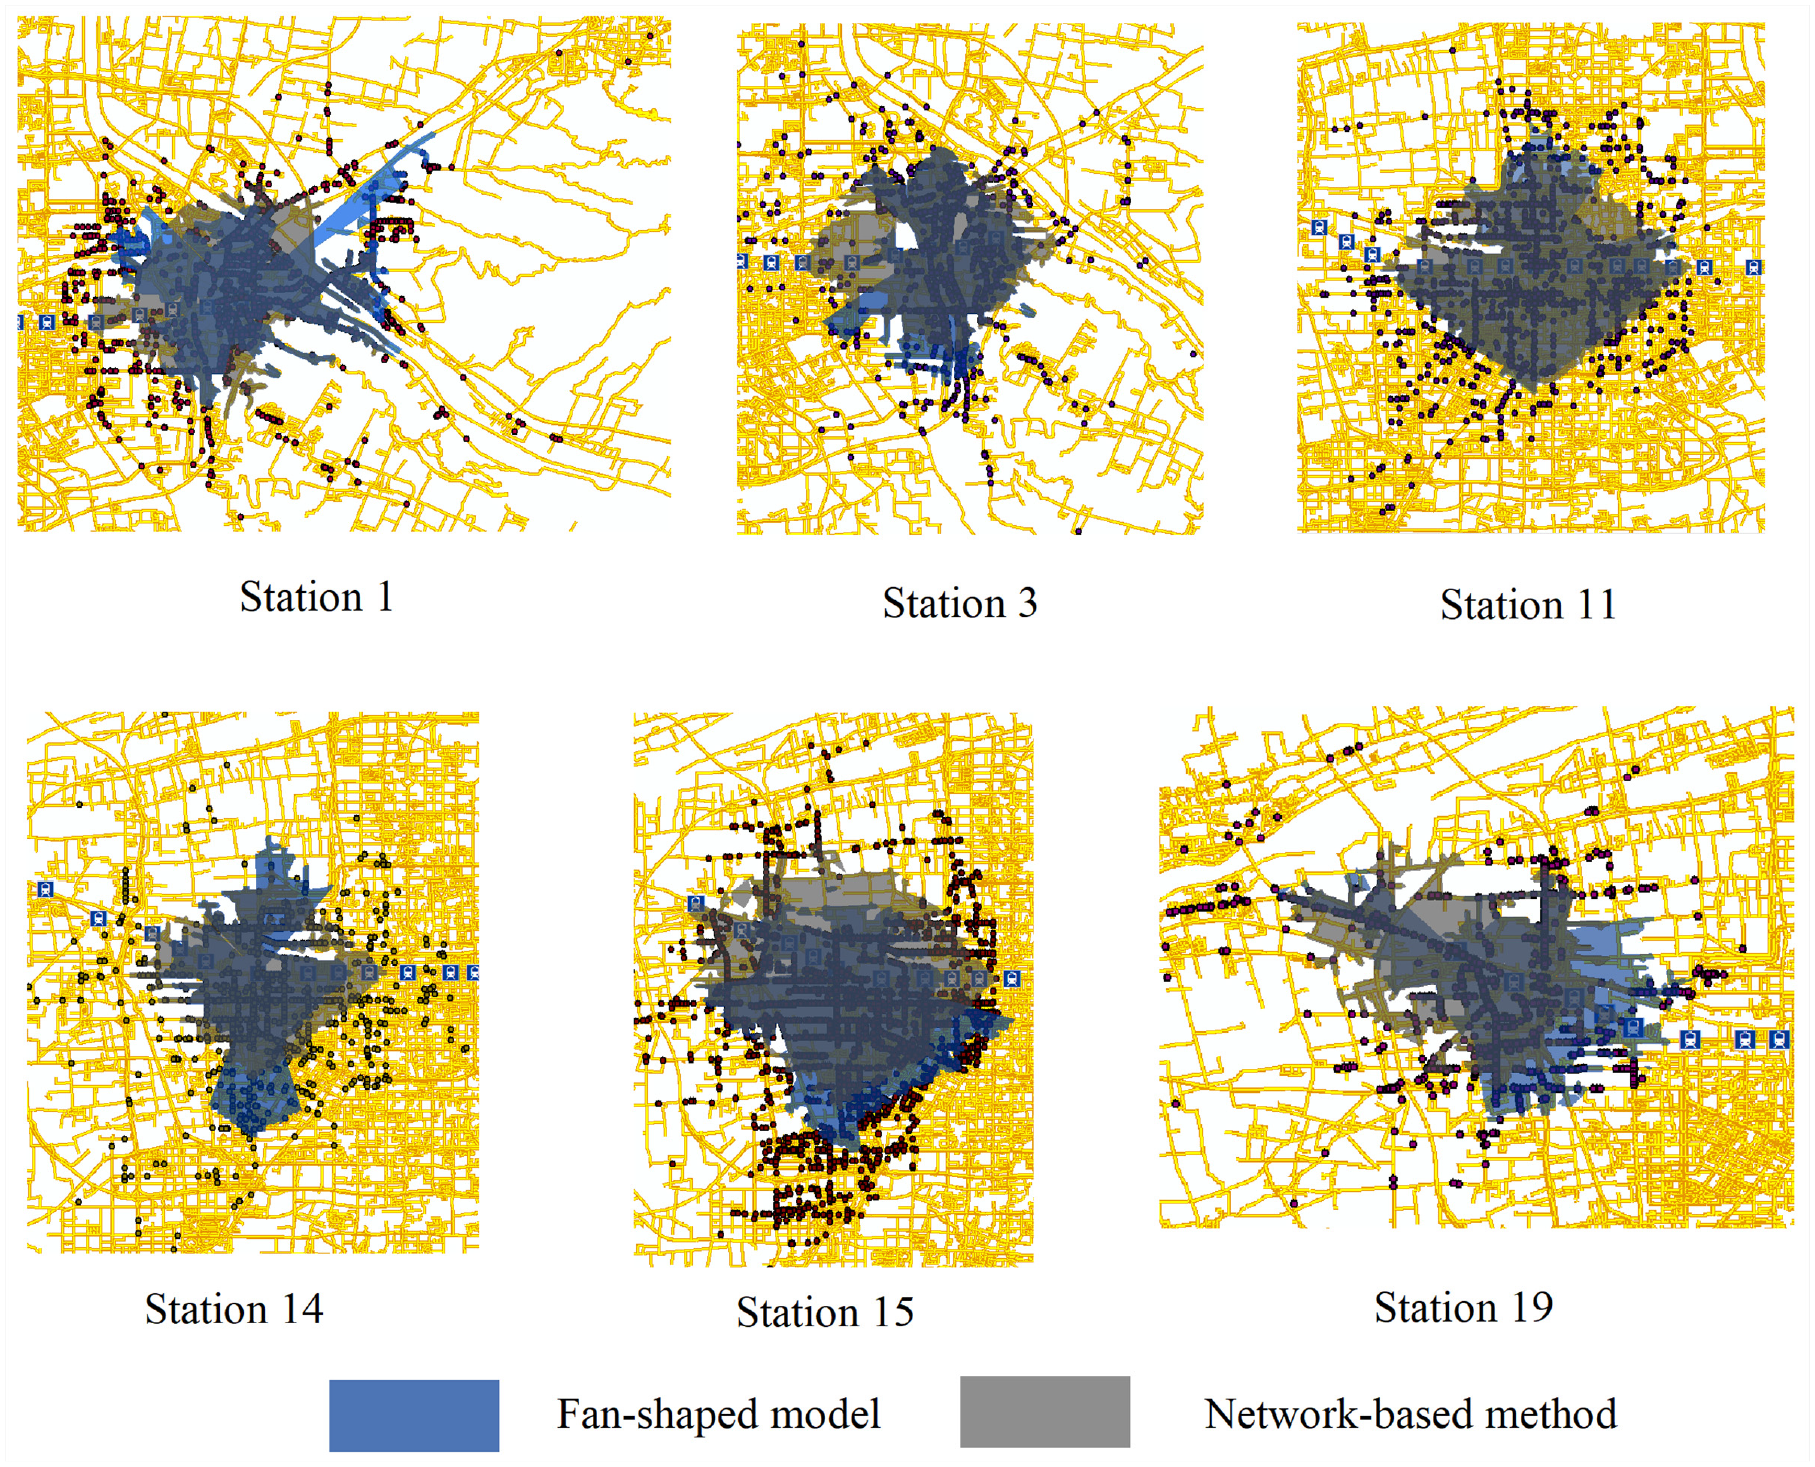
Comparison of the catchment area of the two methods. (Color online only.)
The network-based method does not consider the spatial distribution characteristic of the demand at different angles. It assumes that the spatial characteristic of the demand is only influenced by the road network. Thus, it does not consider that the distance between the demand and the subway station can be different at different angles. The density of the demand can also be different at different angles. This is called anisotropy of the catchment area. The fan-shaped model considers the anisotropy of the catchment area and generates different acceptable distances at different angles.
To better demonstrate which method is better at showing the acceptable distance, we use the feeder taxi GPS data to capture the target acceptable distance at every angle. The target acceptable distance is calculated using formulas 3–5 in this paper to ensure that we finally covered 75% of points in each station. To make sure that the data is statistically significant, the target acceptable distance in angle α takes the GPS points from angle α-30° to α into consideration. After obtaining the target acceptable distance, the difference between the two acceptable distances is the error. The average error in angle α is calculated by averaging the error among 19 stations. The error shows the matching degree between the generated catchment area and the actual taxi demand points. The average error of each angle in 19 stations is shown in Figure 11.
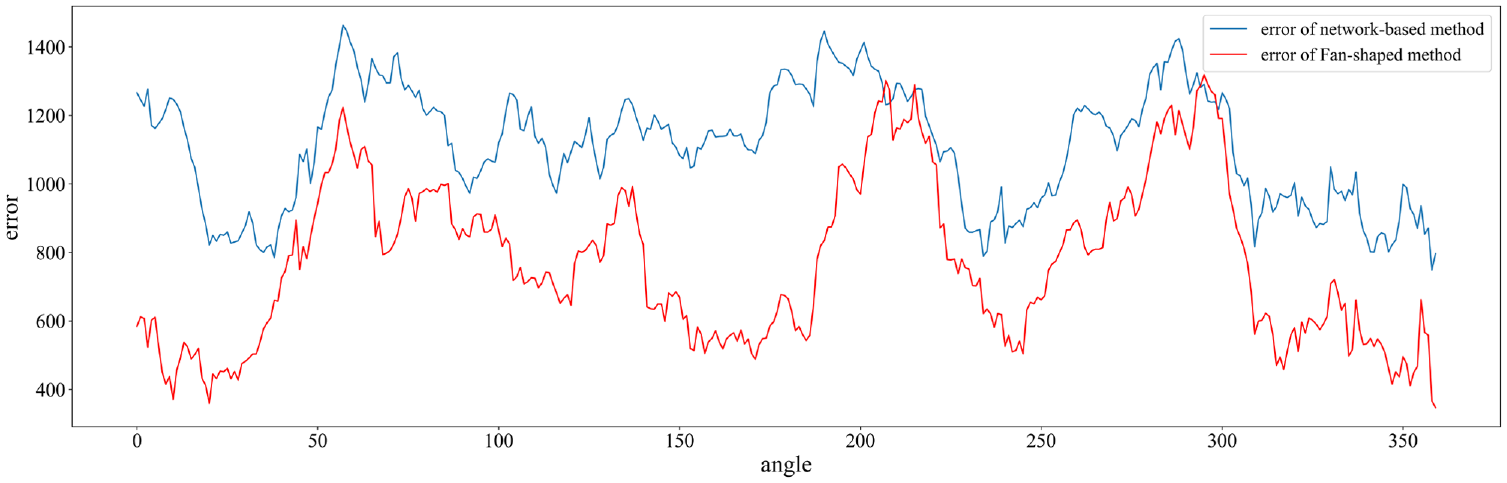
Comparison of the fan-shaped method and the network-based method.
As can be seen from Figure 11, the fan-shaped method has a smaller error compared with the network-based method. The error is 1111.26 for the network-based method, and 771.84 for the fan-shaped method. The average error decreased 30.5% by using the fan-shaped method.
The Overlap Zones of the Catchment Area
As can be seen from Figure 9, there are many overlapping areas between the subway stations. This paper calculates the overlap percentage of each station using ArcGIS. The result is shown in Figure 12. Figure 12 shows that all the stations contain an overlap area that counts for more than half of the whole area. It also demonstrates that in urban areas, the proportion of overlap area is higher than in the suburbs. This paper intercepts the catchment area of some adjacent subway stations, and uses different colors to identify them. The generated overlap picture is shown in Figure 13, which shows a large part of the catchment area of adjacent subway stations overlapped with each other. The high proportion of overlap area indicates there is no clear dividing line for the catchment area of feeder taxis. If the travel distance is short, such as via walking or cycling, it is easier to tell which station is the best one to go to, so it could form the dividing line. However, few travelers consider taxis when the trip distance is short. Taxis are more competitive in long distance travel. If the distance is large, the distance ratio of heading to different subway stations decreases. This would erode the advantages of the closest subway station. The road network would also influence the choice. Taxis prefer choosing trunk roads rather than branch roads. The station that is closest to travelers does not necessarily have the shortest travel time. Furthermore, each traveler would consider different factors when choosing stations. The origin and destination of the travel, the great travel environment of the taxi, and the degree of crowdedness of the station and train could all influence the final choice of travelers. These might be the reasons that the catchment area of feeder taxis has no clear dividing line. Travelers in one place may head for several different subway stations.
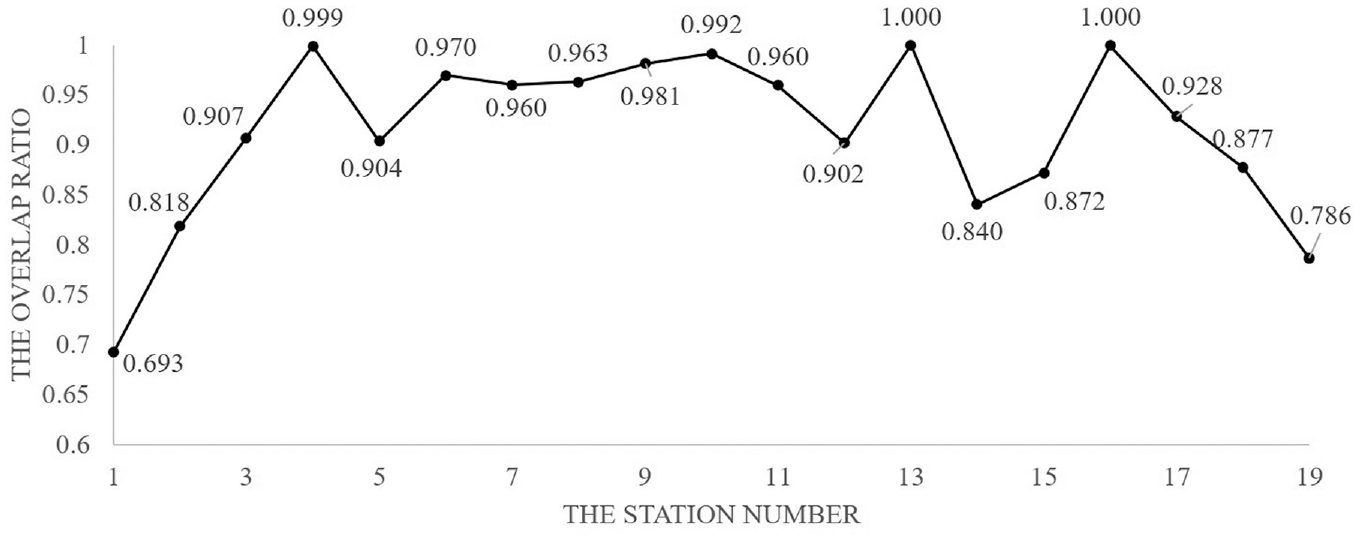
The overlap ratio of each station.
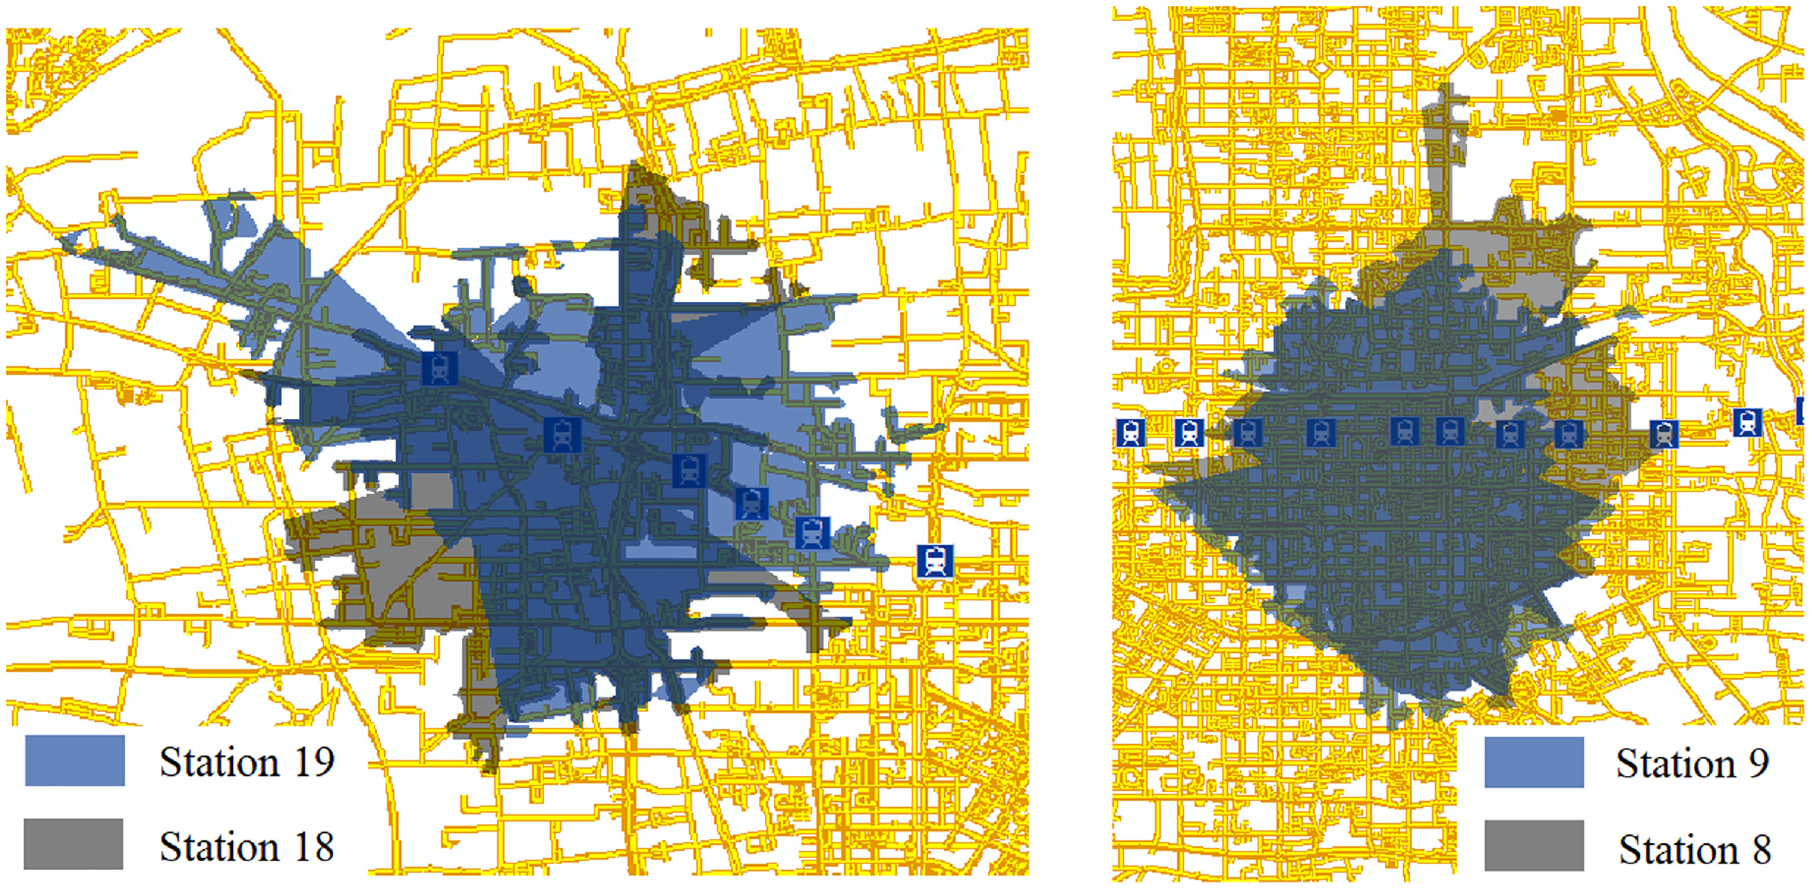
The overlapping area in Subway Line 1.
Linear Regression Analysis
To analyze the influencing factors and the possible quantitative relationship among the factors and catchment area results, linear regression was introduced. We analyze four variables that might influence the catchment area. The first is the distance from the city center. We set up two binary parameters, which are downtown and suburbs. Downtown is the area that is mainly inside the second ring road of Xi’an, and the suburbs station is outside the third ring road. The second and third variables are the transfer station and terminal station, both of which are binary. The hierarchy of the roads perpendicular to the subway line is the last one. Vertical trunk road and vertical expressway represents whether there exist a trunk road and expressway that are perpendicular to the subway line, respectively. The collinear relationship among these variables were first tested and the variance inflation factors (VIFs) are all under 2.0, which means there is no evidence to show the model has multicollinearity problems. Five regression models were established to capture five different parameters of the fan-shaped catchment area, which are the catchment area (km2), SD of R, the maximum sector radius
As can be seen from Table 2, the P-values of the first three linear regression models are less than 0.05, which indicates the models are significant and can help predict the dependent variables. However, there seems to be no linear relationship in the last two models, which are the catchment area and number of points, as their adjusted R squares are negative. From the first three explainable models, we can see that an expressway perpendicular to the subway line would decrease the maximum sector radius. It can uniformize the spatial distribution of points of interest and thus promote the balance of the acceptable distance from all angles. The location of the subway station would also influence the catchment area. When the station is downtown, the SD of R, range of R, and the maximum R are all likely to be smaller than average. This might be because the land use and public transportation system are well-developed downtown. So, the acceptable distance values are not significantly different at different angles. If the subway station is in the suburbs, the range of R and maximum R values tend to be small. This might be because the travel demand in these stations is less than that of the stations downtown, and the passengers that might form a long taxi journey are likely to be attracted by the terminal station. This is because the range of R is large in the terminal station, and in our case, the stations in the suburbs are close to the terminal station. This also indicates that the range of R and maximum of R are large in the stations that are located between the gap of downtown and the suburbs.
Linear Regression Result Between Selected Variables and Catchment Area Parameters
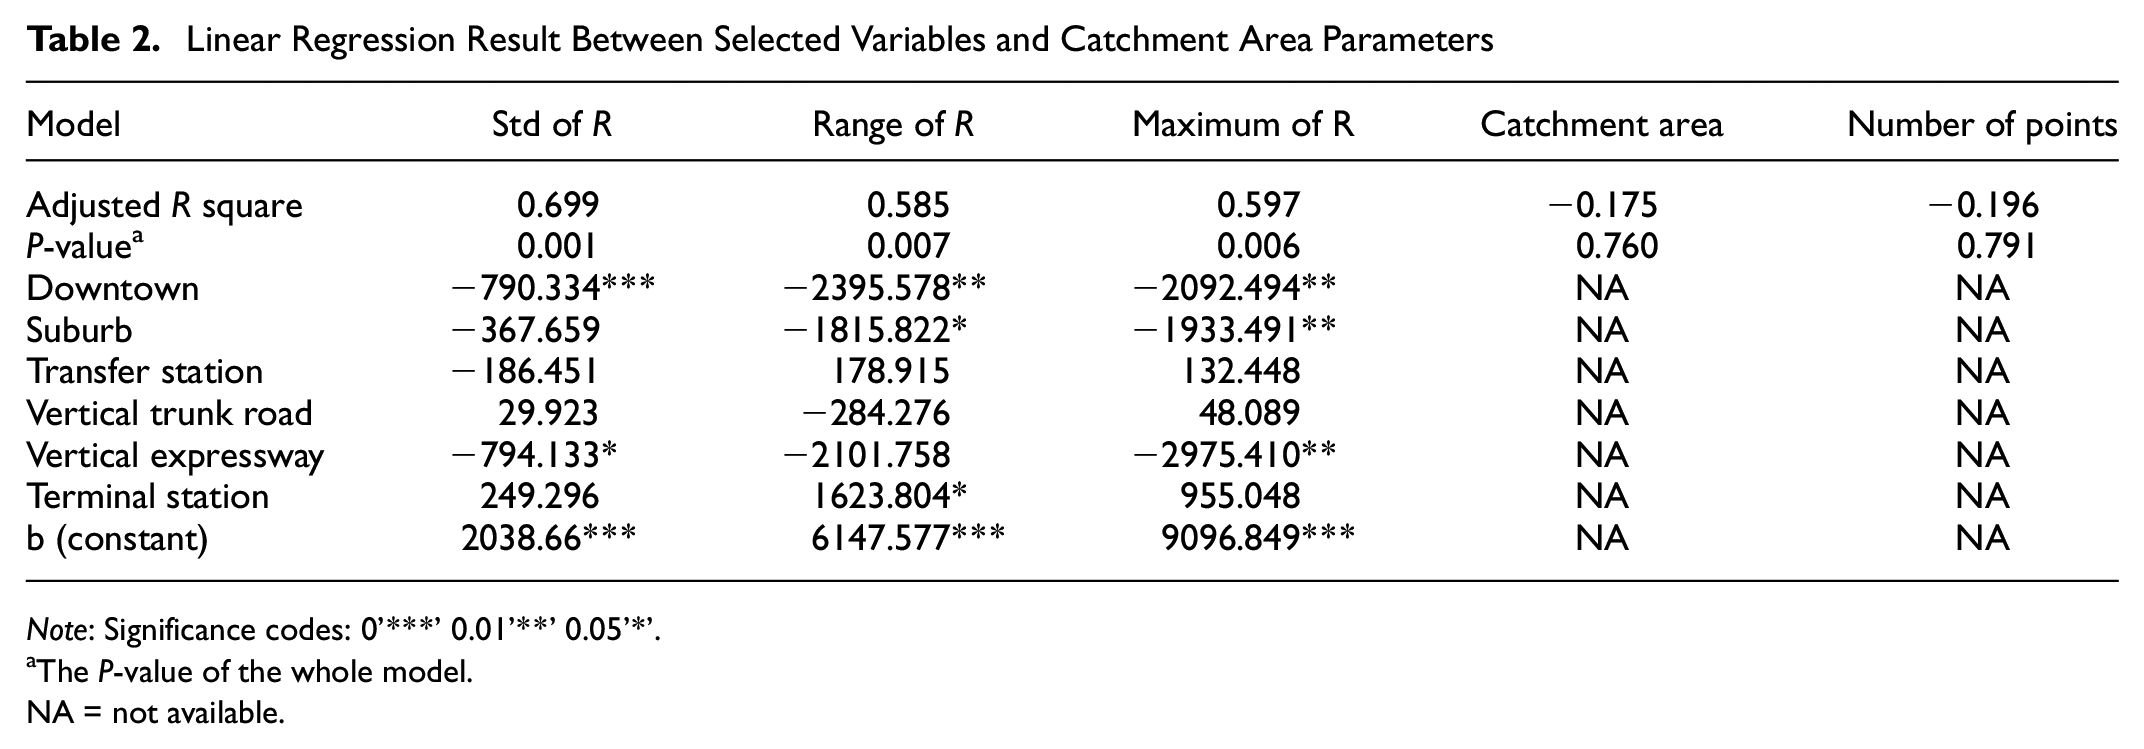
Note: Significance codes: 0’***’ 0.01’**’ 0.05’*’.
The P-value of the whole model.
NA = not available.
Conclusion and Future Research
This paper proposes a fan-shaped model to generate catchment areas. The model generates catchment areas that acceptable distances are different in different directions. This model divides the subway station space into several fan-shaped areas, and then calculates the radius of each fan-shaped area in turn and finally splices them together. Through the case study of Xi’an Metro Line 1, it is found that the acceptable distance of the catchment area in each subway station varies significantly in different directions. The standard deviation of acceptable distance R in each sector is more than 1500 m. Therefore, it is necessary to consider the anisotropy of the catchment area. After comparing the network-based method and the fan-shaped model proposed in this paper, it is found that the final results of the two are quite different. Under different angles, the difference of the acceptable distance will have a great impact on the shape of the catchment area. We take the feeder taxi GPS data to generate the target acceptable distance and calculate the average error between the fan-shaped model and the network-based method. The average error decreased 30.5% by using the fan-shaped method. The network-based method assumes that the spatial characteristic of the demand is only influenced by the road network. Thus, it does not consider the spatial distribution characteristics of the demand of feeder taxis, such as the demand density distribution and the anisotropy of the demand distance from the station. However, the fan-shaped method considers the anisotropy of the demand to generate the catchment area.
Furthermore, the overlapping area does not disappear after dividing the space into different sectors. This indicates that travelers consider not only the length of a trip, but also many other factors, and most of these effects vary from person to person. The high proportion of overlap area indicates there is no clear dividing line for the catchment area of feeder taxis. Travelers in one place might go to several different stations. From the case study, we conclude that the distance from the city center and the road network around the subway station will influence the catchment area. If the subway station is downtown, then the SD of radius and the range of the radius are smaller, which means that the demand is distributed more evenly. If the station is between downtown and the suburbs, the range and standard deviation of the sector radius are large. If the subway station is in the suburbs, the range of R and maximum R values tend to be small. This might be because the travel demand is lower in the suburbs, and passengers with long journeys are likely to be attracted by the terminal station. The expressway perpendicular to the subway line can decrease the SD of the radius and decrease the maximum radius of the catchment area.
The fan-shaped model proposed in this paper considers the anisotropic characteristic of the origin or destination of the feeder taxi. This feature leads to the different acceptable distance of catchment areas in different directions. It breaks the limit that one catchment area can only have one acceptable distance, which is an improvement on the existing research methods. This method can be used to analyze the demand distribution of subways, predict the metro passenger flow, and develop the transportation system in a more reasonable way. It is of great help to ease urban traffic congestion and build a sustainable city. Secondly, the research finds that the catchment areas of feeder taxis among different stations do not have a clear dividing line. The overlapping area accounts for a high proportion of the feeder taxis’ catchment area. The research also finds that the distance from the city center, the road network and whether it is a terminal station can influence the catchment area.
In the process of taxi data identification of feeder taxi trips, we did not consider the randomness and multi-purpose of individual selection, and used pre-conceived general conditions to filter the data, which may have an impact on the final results. Another limitation is that this paper uses straight-line distance to calibrate the parameter of the data mining method, instead of the actual travel distance. From these analyses, we can see that there is still much work we can do to analyze the quantitative relationship and to predict the catchment area. Firstly, the catchment area contains a great deal of information in two dimensions. Only using the SD, range, or maximum radius, one cannot obtain a catchment area in detail. Secondly, the anisotropy of the catchment area might be influenced by many factors, such as land use, road network, and so on.
Footnotes
Author Contributions
The authors confirm contribution to the paper as follows: study conception and design: Y. Deng, S. Liu; data collection: S. Liu, J. Chen, J. Zhou; analysis and interpretation of results: Y. Deng, S. Liu, X. Hu, J. Chen; draft manuscript preparation: Y. Deng, S. Liu, X. Hu. All authors reviewed the results and approved the final version of the manuscript.
Declaration of Conflicting Interests
The author(s) declared no potential conflicts of interest with respect to the research, authorship, and/or publication of this article.
Funding
The author(s) disclosed receipt of the following financial support for the research, authorship, and/or publication of this article: The research is supported by the National Key Research and Development Program of China (grant No. 2018YFB1600900), the Natural Science Basic Research Program of Shaanxi (Program No.2021JQ-276), and the Fundamental Research Funds for the Central Universities, CHD (300102342204).