
Abstract
In-vehicle crowding and travel time are two important factors that determine passenger transportation preferences in public transit. A widely used approach to obtain the relative magnitude of these preferences is the stated choice (SC) survey. However, such imaginary choice situations do not capture automatic cognitive biases during the immersive experience of trips. In a previous study, we used virtual reality (VR) technology to simulate short immersive virtual subway trips with different levels of crowding. We asked participants to indicate the level of pleasantness and estimate the duration of each trip. In this paper, we compare and contrast perceptions of participants in the VR task with preferences in a SC survey taken from the same participants. The SC task consisted of two-alternative choice scenarios, asking for preference between more crowded shorter trips and less crowded longer trips. Discrete choice modeling was used to analyze the SC results. There are two main findings. First, individuals who perceived passenger density more negatively in the SC task also felt more negatively during higher density VR trips. This confirms that hypothetical SC surveys can reflect feelings induced by crowding during more realistic experiences. Secondly, a more crowded VR trip was perceived as longer compared with a less crowded trip, whereas this effect was not reflected in the SC task. It therefore suggests that SC surveys may not be capable of capturing systematic temporal biases induced by crowding. Results shed light on potential caveats of the SC surveys and introduce an avenue for the use of VR in passenger preference research.
Keywords
The stated choice (SC) survey is a common technique for obtaining passengers’ preferences when choosing between modes of transportation. In these surveys, individuals are asked to indicate their preference among multiple alternatives, for example, transportation options, each with specific attribute values such as crowding level, travel time, or cost ( 1 , 2 ). Discrete choice modeling can then be used to model the utility of each alternative as a function of attribute values and to analyze the trade-offs between different attributes. However, it is a critical concern whether these surveys are ecologically valid and able to capture real-world preferences ( 3 ). In this paper, we argue that perceptions of different attributes might be psychologically intertwined with each other, making them hardly distinct, yet they are treated as distinct in the hypothetical choice situations of SC surveys. Specifically, our focus is on the interaction between crowding level and perceived travel time.
Crowding in public transport is a major externality, becoming an increasingly noteworthy influence on users’ modal and route choice along with the more traditionally recognized factors of travel time and cost ( 1 , 2 ). Passenger crowding can lead to transit-users’ negative affect and a feeling of stress and discomfort ( 4 – 8 ). Negativity of crowding is even more pronounced in the age of the COVID-19 pandemic. Abundant evidence has confirmed that the same travel time with a higher crowding level is rated as having more disutility than a lower crowding level. Crowding influences the amount one is willing to spend to save time on a trip, that is, the value of time (VoT). This topic is of such importance that various transit operators and government bodies have funded research on the effect of crowding along with a range of other factors on the VoT ( 9 – 11 ). The VoT on an unpleasant overcrowded public vehicle or in congested traffic is higher than the VoT in a more comfortable trip. In this context, crowding multiplier is a numerical estimate for the relative disutility of travel time under different crowding levels. An increase in crowding level is equivalent to multiplying travel time by a number larger than one, that is, the crowding multiplier, as if the trip was longer than its actual duration, but with the same crowding level. Although several authors have used the term “time perception” when referring to such mathematical estimates of duration under different crowding levels (e.g., Gao et al. [ 12 ]), this is not consistent with time perception as implied by psychologists.
Perceived time in psychology is (and here we refer to it as) the subjective duration of an interval (how long an interval feels) in contrast to its objective duration that is measured by a physical timer (see Grondin [ 13 ] for a review). In this notion, perceived time is the subjective feeling of the duration of an interval. Imagine that a passenger feels the duration of a 10 min trip on a train as 12 min, without access to any clock or any other tool to hint at the actual time passed. In this case, the passenger has experienced what psychologists refer to as a dilation of subjective duration, such that the time subjectively slowed down during the trip. The VoT as estimated in transportation studies, however, does not necessarily imply dilation or contraction of subjective time. It is rather a numerical computation reflecting the increase or decrease in disutility of time under certain conditions. For instance, in the case of crowding, the crowding multiplier reflects the increase in disutility of travel time by an increase in crowding level; whereas the psychological perceived duration is an independent concept related to the subjective experience of the trip. In this paper, we compare and contrast the two notions of time in how they are affected by crowding: the increase in psychological perception of travel time caused by crowding, and the increase in crowding multiplier or VoT under higher crowding levels.
In a recent study ( 14 ), we used virtual reality (VR) technology under controlled conditions in the laboratory and asked participants to estimate the duration of immersive VR experiences of short (1–2 min) subway trips. Results showed that participants rated a more crowded VR trip as more unpleasant and estimated its duration to be longer. Whereas the psychological mechanisms behind this effect have been discussed ( 14 ), interpretation of these findings in transportation research, specifically for the validity of SC surveys, remains unclear. In the current study, we compare and contrast results of the VR task with a SC survey taken from the same participants. In each choice scenario, participants chose between two hypothetical alternatives with two attributes of travel time and crowding level. We compared the feelings induced by crowding and perceived travel time in the VR trips with attribute preferences in the SC task. We examined whether preferences and perceptions in the VR trips and the SC task are correlated with each other among participants. Specifically, we investigated two questions: (1) Do individuals who feel more negative after the experience of a crowded public trip also tend to disutilizecrowding more when choosing between commuting routes? (2) Do individual differences in subjective lengthening of travel time because of crowding explain variability in relative disutility of travel time (i.e., crowding multiplier) in the SC surveys?
The existence of these correlations between the SC and VR tasks suggests that SC surveys could be capable of capturing individual differences in preferences and perceptions. These investigations therefore expand our understanding of the strengths and limitations of SC surveys compared with more realistic VR experiences of trips. On the other hand, differences between the two tasks would indicate dissimilarities between a hypothetical task and an integrated experience of a trip.
Literature Review
Progress in VR technology in recent years has made it possible to simulate highly realistic virtual environments for behavioral research. VR has been used not only to improve passenger experience ( 15 ), but also to investigate passengers’ behaviors or preferences using virtual environments. One study, for instance, showed that VR experience is more reliable than text description or visual representation for obtaining pedestrian preferences related to autonomous vehicles ( 16 ). VR is also an excellent tool for creating social stimuli that are more controlled than real stimuli, are replicable, and may be impractical or too expensive to attain in the real world ( 38 ). For example, physiological stress levels of pedestrians have been compared in different road crossing scenarios precisely manipulated using the immersive VR technology ( 17 ). VR has also been used to examine the impact of smartphone distraction on pedestrian’s walking speed and acceleration rate in conditions with different safety levels ( 18 ). The level of control on the environment in these VR experiments is hardly attainable in the highly chaotic and complex settings of the real world.
VR has been used to study feelings and perceptions induced by crowding in various social settings but not, to our knowledge, in the context of transportation. For instance, previous studies have examined the impact of crowding on consumer emotions when waiting in a VR restaurant ( 19 ), or shopping behavior in large stores ( 20 ). In Sadeghi et al. ( 14 ), for the first time, we extended the use of VR to the study of crowding in public transportation. The use of VR was not only a choice but perhaps a necessity to answer our research hypothesis: Measuring subjective perception of time requires experience of the trip and is not feasible in a hypothetical SC choice survey. On the other hand, in the case of using real-world transportation data, there are numerous out-of-control factors interacting with crowding as we discuss further, an issue that can be controlled with the use of VR.
In real-world settings, several previous studies have investigated the mismatch between the objective travel time and subjectively reported travel duration ( 21 – 27 ). However, obtaining both the objective and subjective travel time in real-world commuting trips has certain methodological complications. Actual travel times have been collected by GPS tracking technology in several studies (e.g., Delclòs-Alió et al. [ 22 )] and Parthasarathi et al. [ 24 ]), or from other sources of travel time information between known locations in several other studies (e.g., González et al. [ 23 ] and Tenenboim and Shiftan [ 26 ]). Travel times were then compared with individuals’ reported estimates of trip duration to explore discrepancies between the two numbers. Whereas these studies can be useful for finding the difference between the reported and true travel times, it is questionable whether the reported time is in fact equivalent to the perceived time. One study concluded a divergence between reported estimate and perceived travel times, finding no relationship between individuals’ route choices and the reported times ( 25 ). They suggested several possible reasons for this divergence, including underestimating one’s speed based on social desirability, or overestimating trip duration as a complaint to policy makers. Furthermore, reported travel times are not reliable measures of time perception in most real-world situations, since passengers sometimes check the objective time by using their personal phone or watch while traveling. Therefore, the reported travel time would not be merely subjective but confounded with access to objective time. In this study, with the use of VR, we overcame these limitations for obtaining the subjective travel time not confounded with access to the objective time.
Furthermore, VR enabled us to distinguish the impact of the perception of crowding independent of other factors, while this is hardly feasible with the real world data. Crowding in the real world is, for instance, correlated with the purpose of a trip, and flexibility of arrival time; congestion occurs on weekday mornings when many people commute to the workplace, attempting not to be late. Therefore, in this context, it is challenging to distinguish different sources of distortions in time perception or pleasantness of the trip. A recent study by Carrion and Levinson examined several factors that contribute to error in travel time perception of daily work trips ( 21 ). They reanalyzed a dataset that included GPS-based actual travel times, as well as survey-based estimates of participants’ usual travel durations. Among the various factors included in their model, higher values of congestion and stress predicted an underestimation of travel time, rather than an overestimation, a finding that contradicted their hypothesis. Carrion and Levinson associated this observation to participants not accurately understanding experimenters’ intentions with regard to the words “congestion” and “stress.” Another source of this conflicting result could be the inclusion of various interacting explanatory factors in one model which can lead to unreliable results, such as arrival flexibility, type of trip, congestion level and stress, which are all tightly correlated.
Another study ( 22 ) found that university members commuting to/from campus overestimate travel times more during peak hours. It is not clear which underlying aspects of peak hour account for changes in time perception in that study. Peak hours are usually associated with high density of travelers, stress, travel time unreliability, arrival inflexibility, higher waiting times, and higher likelihood of standing during the trip. Any of these factors may or may not be responsible for distortion of time perception.
Various factors have been found to have a robust influence on subjective time, such as complexity ( 28 , 29 ), numerosity ( 30 , 31 ), stimulus size ( 32 ), and intensity ( 33 ), along with internal factors such as emotions and attention ( 34 ). Although the precise mechanisms of the effect of these factors on temporal perception are still under debate, they are usually discussed with regard to attention, arousal, and memory ( 35 ) within the framework of the influential pacemaker-accumulator models ( 36 ). Previous studies have shown highly arousing emotionally negative stimuli, such as images of spiders or angry faces, are perceived to be longer in duration than neutral stimuli ( 37 ). A greater quantity of items can also increase perceived time. For instance, more dots on a screen are perceived to display for longer than fewer dots ( 38 ), or a larger digit is perceived to have a longer duration than a smaller digit ( 39 ). Whereas these factors have usually been tested in isolation with simple stimuli, crowding is an ecologically valid situation that has a combination of these factors. A higher density of individuals on a crowded train indicates a higher numerosity and complexity in the environment. These external characteristics of a crowded environment also induce negative feelings, as reviewed above. All these factors could make the duration spent in higher crowding levels more likely to be felt longer than the time in lower crowding levels, as confirmed in our recent study ( 14 ). Consistent with the impact of emotions on time perception, this effect was mediated by negative feelings induced by crowding: a more crowded trip was perceived as longer to the extent that it felt more internally unpleasant. Here we extend the VR study, investigating its interpretation in SC surveys. SC surveys are expected to caputre conscious subjective individual attitudes toward crowding. However, being merely imaginary situations that are not practically experienced, they are unlikely to reflect unconscious temporal biases induced by the real experience of crowding.
Methods
General Procedure
Participants first completed a VR task, as analyzed in Sadeghi et al. ( 14 ). They also responded to several surveys including an SC survey (not analyzed in the previous study). Descriptions of the SC task and VR task are provided below. All ratings, duration estimates, and surveys were administered using the Qualtrics software as participants were in the laboratory.
VR Task
Briefly, 41 participants (19 female, mean age = 22.6) were recruited from the Cornell University campus. Each participant experienced five VR trips with five different crowding levels (Figure 1). The duration of a trip was 60, 70, or 80 s, determined randomly. Each trip started with a public announcement implying that the train is leaving the station, played from the two speakers in the experiment room and ended by a beep tone. The VR avatars were animated with behaviors such as bodily movements, looking at phones, and reading magazines. A background crowd noise was played during the trips. Participants were instructed to interact with the environment before the trips, entering the train from the doorway, walking for one or two feet in the train, looking around, and standing at a comfortable location. They also experienced three demonstration trips before the main task to become familiar with the environment. Video demonstrations of the train environment are available at https://github.com/saeedeh/Crowding-Time-VR/. More details about the VR setup can be found at Balcombe et al. ( 10 ).
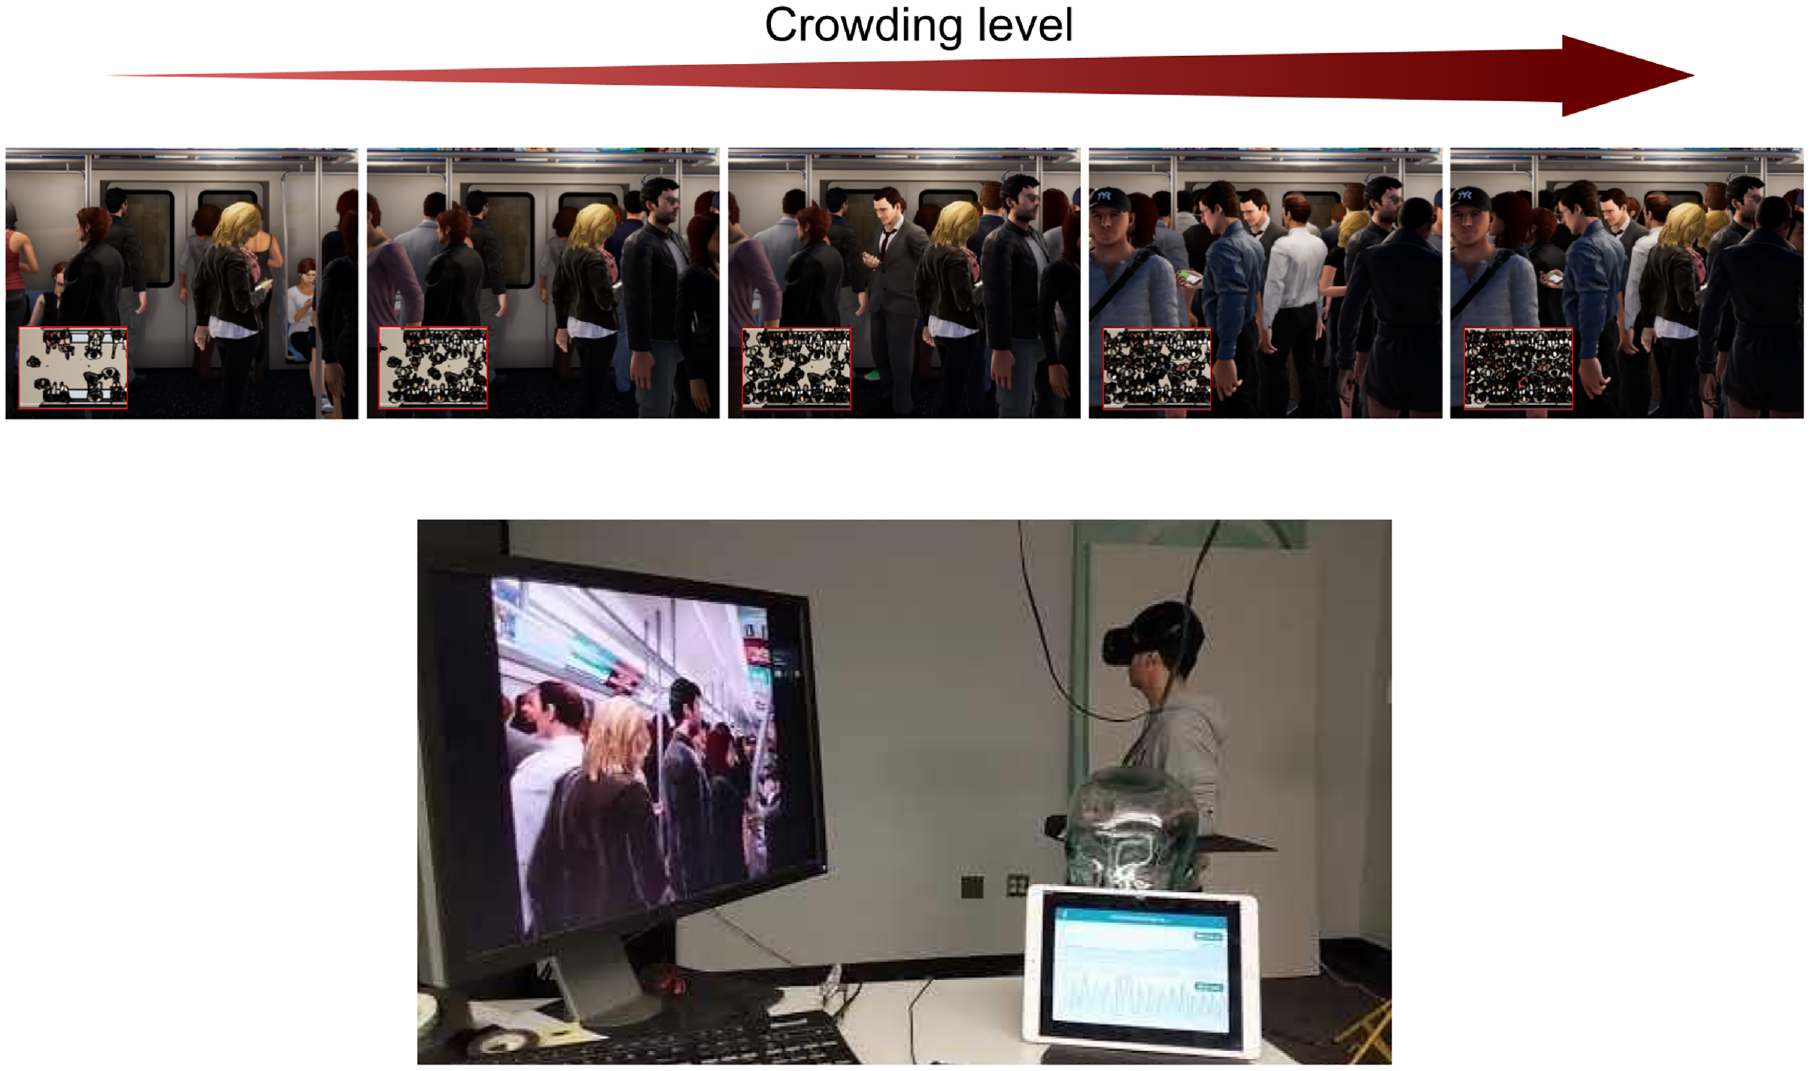
(Top) Screenshot of passenger’s view and cross-sectional view of the five levels of crowd density in the virtual reality (VR) environment. (Bottom) Preview of the VR task setting. The monitor displays the participant’s view of the subway train.
After each trip, the participant estimated the trip’s duration in seconds, and rated its pleasantness and unpleasantness on a scale of 1 to 7. Emotional valence of a trip was defined as the pleasantness rating minus the unpleasantness rating.
Demonstration of crowding in the immersive VR experience was in stark contrast with photographs used in choice surveys. Images in the SC surveys are cross-sectional or side-view two-dimensional schematics presented on a computer screen; they are remarkably smaller than the real scene and static. In the three-dimensional immersive VR experience, however, participants stood close to the dynamic virtual avatars who had realistic human sizes. During the trip, the participant could freely move their head to look around at the dynamic virtual crowd. The accompanying audio during the VR trips further immersed participants in the experience of hearing noises of the crowd, the train, and the announcer. None of these features exist in the hypothetical survey-based SC tasks.
SC Survey Design
The SC survey was answered either before or after the VR task, with the order determined randomly. The SC survey included six choice scenarios. Each SC scenario asked the participant’s preferred choice between two presented subway travel conditions. Each alternative had two attributes: crowding level and travel time. To minimize heterogeneity of responses based on individuals’ assumptions about the trip, participants were primed with a storyline about the trip before they completed the SC survey. The storyline was as follows:
Imagine you are a tourist visiting New York City (NYC). You are going to use the subway to visit one of NYC landmarks. In each scenario you will see two transportation options that differ in travel time and crowding level. You need to choose the option you would prefer, among the two available options.
Figure 2 shows a sample choice situation of the SC survey. Crowding level had four possible attribute levels illustrated by a bird’s-eye view diagram of inside a subway car. The diagrams were similar to those used in a previous study (density levels 3–6 in Tirachini et al. [ 40 ]). The four levels corresponded to one, two, four, or six persons standing per square meter, respectively. All seats were occupied in all density levels, removing the possibility of sitting during the trip, independent of one’s chosen alternative. The travel time of each alternative was presented by the number of minutes the trip would take. There were four travel time levels: 15, 17, 22, and 25 min. A total number of 24 SC choice situations, grouped in four blocks of six questions, was designed. NGene software was used to find a D-efficient design of the survey (D-error = 0.0092) ( 41 ). In all choice scenarios, one option was of shorter duration and more crowded and another option was less crowded and longer. Each participant was randomly assigned to respond to the questions in one of the four blocks. The final SC survey design is available in Supplemental Table 1.
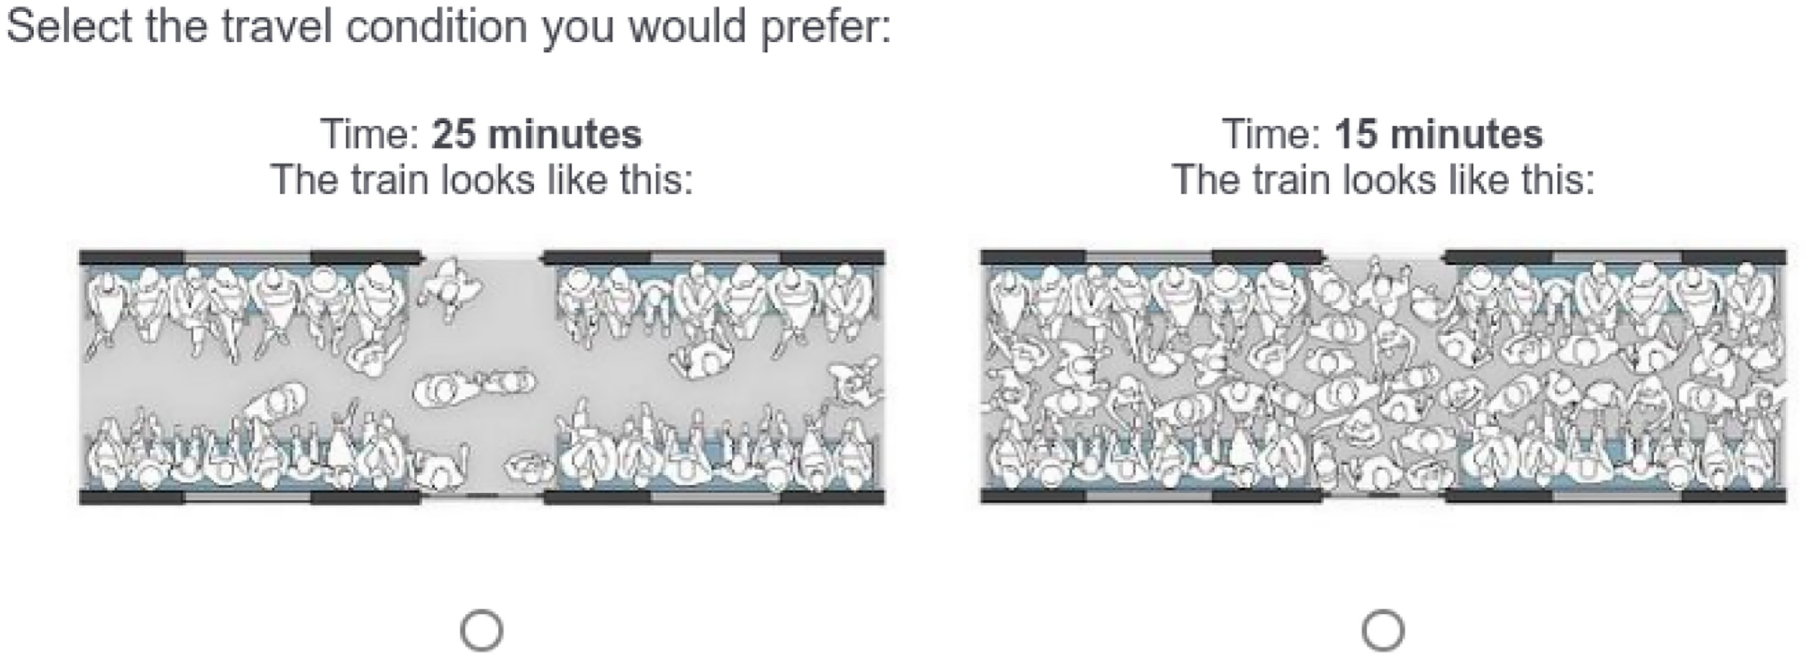
Screenshot of a sample choice scenario from the stated choice survey.
SC Analysis Methodology
Following the previous studies on modeling valuation of crowding, passengers were considered as random utility maximizers when making travel decisions (1, 2). The conditional indirect utility (u) of alternative i for individual n, in choice situation t can be defined as:

where TT is travel time and dens is passenger crowd density. The error terms
Note that in the utility function, density is multiplied by travel time to account for the accumulative disutility of being in a crowded vehicle over time (following the convention in previous studies). The correlation between individual fitted coefficient estimate of this term (
Crowding multiplier is a factor that reflects the disutility of traveling under crowded conditions relative to uncrowded conditions ( 1 , 2 ). Accordingly, in the above model, the crowding multiplier for an individual n and crowding (density) level dens, can be formally defined as:
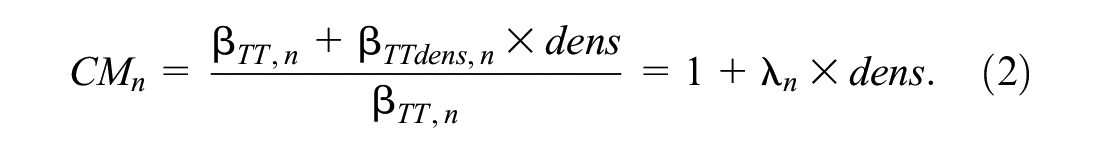
where
Results
All participants finished both the VR and SC tasks. The less crowded longer option in the SC choice survey was preferred over the more crowded shorter trip 55.3% of times. When one choice was remarkably less crowded than the other (more than three levels), the preference for the less crowded trip increased to 73%. The alternative with shorter travel time was preferred 44.7% of times, and the preference increased to 72.4% when it was more than 7 min shorter. Table 1 shows the results of fitting a mixed logit model to participants’ responses, allowing random taste variation for the preference parameters of travel time (
Results of the Mixed Logit Model Fitted to Discrete Choice Responses
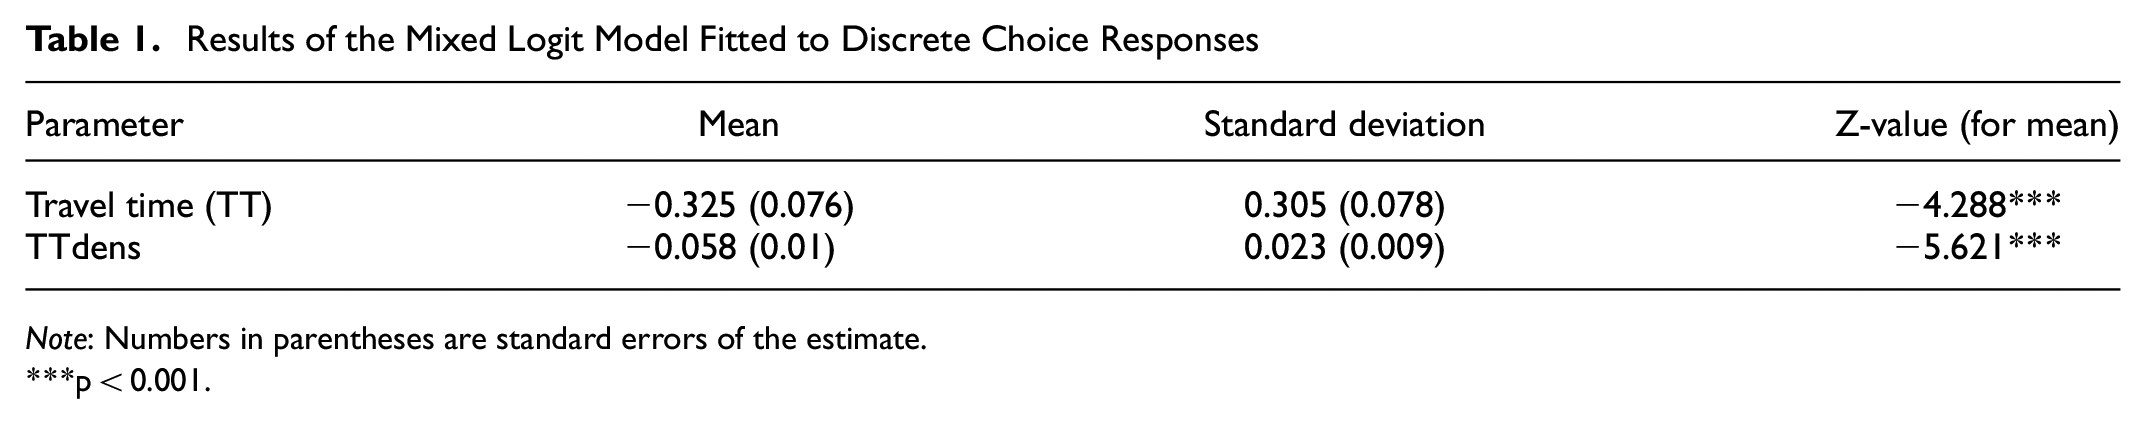
Note: Numbers in parentheses are standard errors of the estimate.
p < 0.001.
A mixed effect linear regression with random individual specific intercept and a fixed slope was further used to predict valence from crowding level in the VR task. As shown in Figure 3a, the emotional valence of a trip decreased with an increase in crowding level (β = −1.03, SE = 0.099, p < 0.0001; also reported in Sadeghi et al. [
14
]). Furthermore, negativity of
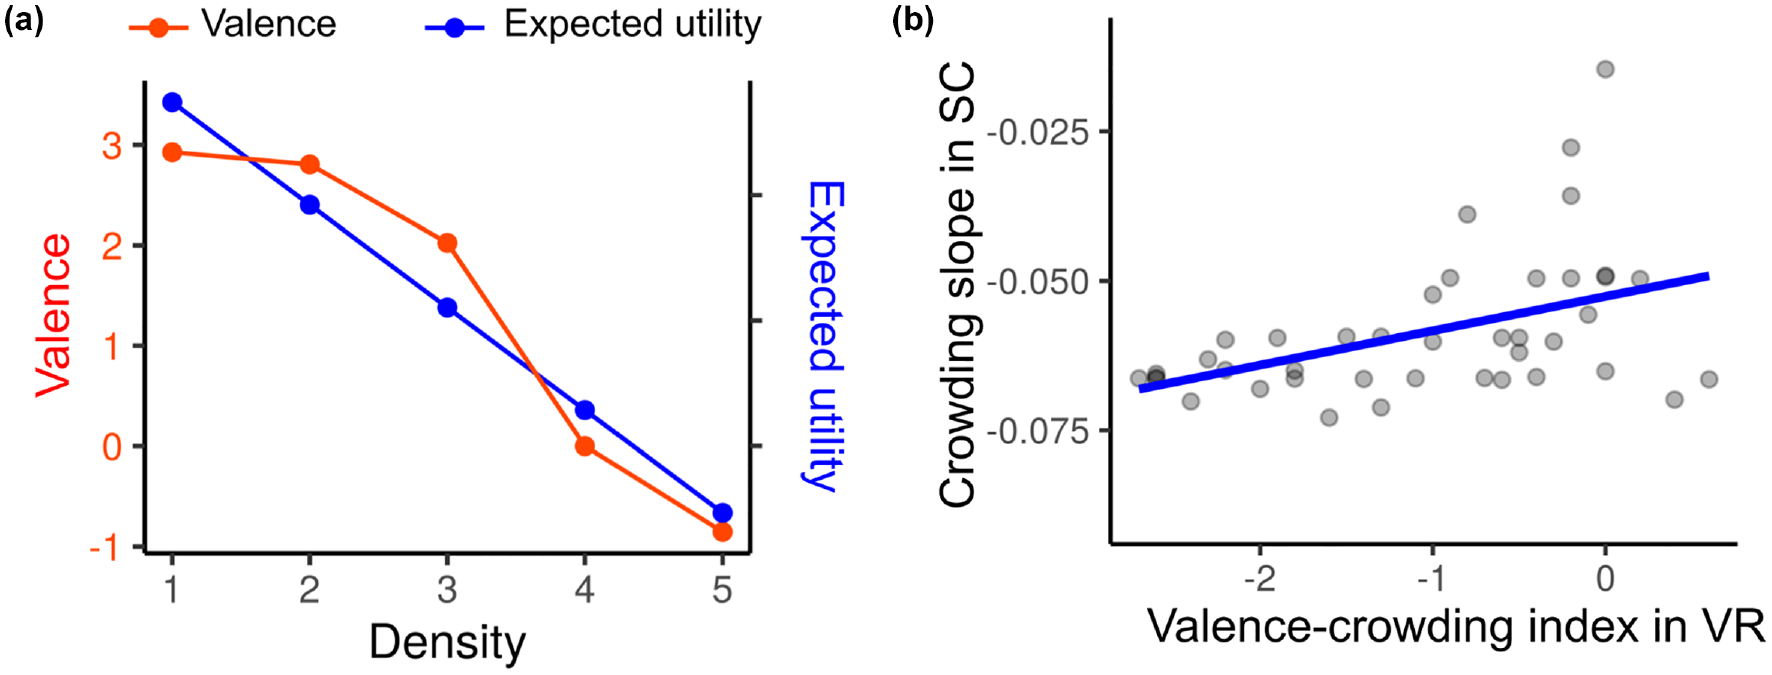
Comparison between crowding-valence relationship in the two tasks. (a) Crowding-valence relationship in the virtual reality (VR) task (red), and crowding-expected utility relationship in the stated choice (SC) task (blue). Note that expected utility is on an arbitrary scale and can only be compared between individuals. The graph is presented only to signify the negativity of the slope. (b) Relationship between the slope of change of the two variables in (a). Each data point in (b) represents one individual.
Next, we compared perceptions of and preferences for travel time as a function of crowding level between the two tasks. The ratio between perceived duration divided by actual duration was estimated for each experienced VR trip. As shown in Figure 4a, this ratio increased significantly with increase in crowding (mixed effect linear regression with random intercept; β = 0.0260, SE = 0.0105, p < 0.0143). The crowding multiplier was estimated for each individual in the SC task through simulation. Figure 4a also represents the mean crowding multiplier for different density levels. As shown in the figure, traveling under the highest density level (level 5) can create a disutility change of greater than 1.75, whereas the lowest density level has on average only about 1.1 times change in trip utility (compared with a hypothetical level 0 density).
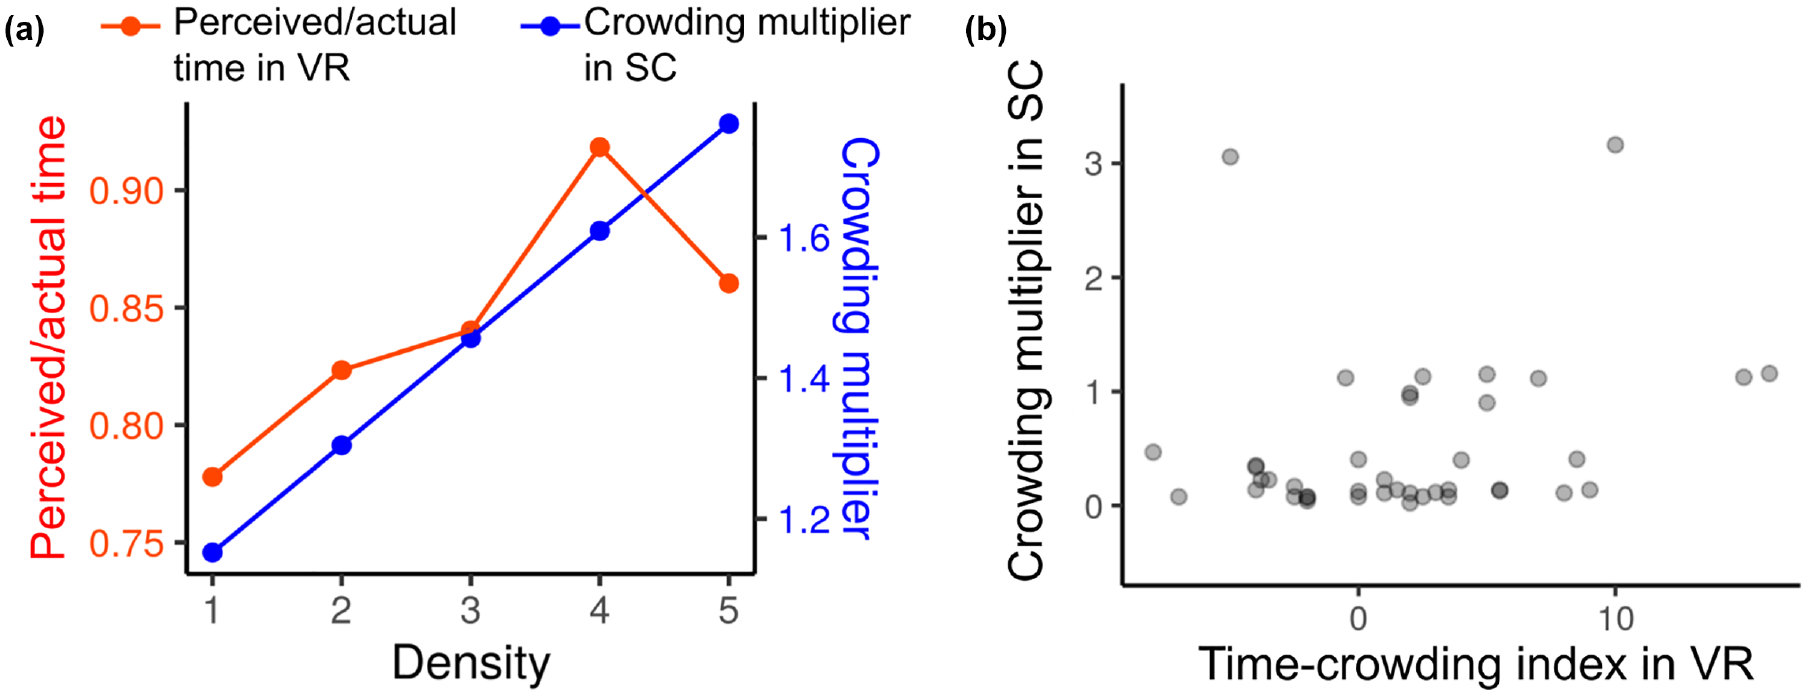
Comparison between relationship of crowding and time perception bias in the two tasks. (a) Crowding-time perception bias ratio relationship in the virtual reality (VR) task (red), and crowding-crowding multiplier relationship in the stated choice (SC) task (blue). (b) Relationship between the slopes of change of the two variables in (a). Each data point in (b) represents one individual.
A simple regression was fitted to each individual’s responses in the VR task, with time perception bias ratio as the independent variable, and the density level as the explanatory variable, including an intercept term. Accordingly, a regression line was estimated from five data points corresponding to the trials of the VR task. The estimated coefficient of density for each participant, here referred to as “time-crowding-index” (similar to valence-crowding-index defined before), represents the amount of a person’s change in misperception of time resulting from one level increase in crowd density. The correlation between time-crowding-index and the individual’s estimate of
Summary statistics of the four variables of interest in Figures 3 and 4 (valence, expected utility, temporal bias, crowding multiplier) for the five levels of crowding are presented in Supplemental Table 2.
Conclusion
We compared perceptions and feelings of short subway trips in an immersive VR experience with preferences expressed in an SC survey. In the VR trips, the emotional valence rating of a trip decreased with increase in crowding level. Similarly, in the SC survey, increase in crowding level decreased the utility of a trip as modeled by discrete choice techniques. There was a significant correlation between unpleasantness and disutility of crowding among participants between the two tasks: participants who had more unpleasant feelings in response to crowding in VR also disutilized crowding more in the hypothetical choices in the SC task. Furthermore, travel time was psychologically perceived to be longer in the more crowded VR trips; whereas this effect was not reflected in individuals’ preferences in the SC survey.
In both the VR trip and the SC survey, crowding was perceived as negative and the level of this negativity was correlated among individuals between the two tasks. These results are aligned with previous research indicating that crowding is an unpreferred aspect of a trip associated with negative affective states such as feeling uncomfortable, distracted, frustrated, stressed, and irritated ( 8 , 44 ). Furthermore, individuals who disutilized passenger density more negatively in the SC task also experienced more unpleasantness during higher density VR trips. Therefore, heterogeneity of responses in the SC task can at least partially be associated with individual differences in feeling unpleasant in a crowded vehicle. Although crowding level in the SC task was illustrated with black-and-white diagrams, results revealed that participants were able to imagine the feelings induced by higher crowding levels if they actually experienced them. Therefore, respondents on average had the metacognitive ability to estimate their feelings in imaginary situations. This confirms the capability of SC surveys in reflecting subjective feelings about public crowding.
Analysis of perception of time, however, did not confirm a correlation between the amount of increase in perceived duration in the VR and the crowding multiplier in the SC task. Therefore, the extent to which a person disutilized passenger density in an imaginary choice situation was not significantly relevant to the amount their perception of time varied with density. This is psychologically justifiable, since temporal biases are automatic, without the person being aware that they are making an error.
Discrepancy between the objective travel time and subjectively reported travel duration has been observed in a few previous studies in the transportation literature ( 21 – 27 ). Several previous works have proposed using perceived travel time instead of the objective travel time to improve choice modeling in transportation ( 45 – 47 ). Given that individuals are not aware of their error in perceiving time in response to crowding, our results indicate that perceived travel time can only be captured in an actual trip with all attributes integrated with each other, and imaginary choice situations are not capable of doing so.
Despite having an overall significant linear trend, the relationship between crowding and time perception bias was not monotonic (e.g., between level 4 and 5 in Figure 4a). In the SC task, however, it was only feasible to estimate an overall linear slope for this relationship. Real-world time perception is indeed influenced by external physical or internal attentional or emotional factors that add noise to the crowding-temporal bias relationship. This is aligned with time in a holistic experience tapping into different mechanisms and being highly malleable in respsonse to factors that are not reflected in a hypothetical choice survey.
Interpretation of Findings and Future Applications
Results showed that temporal biases in the VR task can only be captured by the holistic experience of the trip. Reliability of the SC tasks in this context may depend on the nature of choices: if choices are based on one’s past experiences, then actual travel times might be systematically different from the biased perceived times as remembered by the individual when choosing between multiple routes. However, SC surveys are useful if the goal is to model preferences of new alternatives when individuals only know their distinct attributes, not having experienced holistic trip routes beforehand.
These results, therefore, call for new cognitive considerations in the analysis of passenger preferences. We predict that passenger preferences that are based on subjective experience of options are systematically distinguishable from preferences for never-experienced alternatives that are merely based on the provided attribute descriptions. The perceived travel time, perceived waiting time, and even the perceived service frequency systematically depend on other factors such as the crowding level. Unlike first-time travelers, preferences of experienced travelers may be better modeled when considering the interaction between different experienced attributes such as crowding and perceived travel time.
In the daily experience of a regular subway, subjective travel time is inseparable from the emotional responses to social crowding. The findings overemphasize the role of crowding in passengers’ transportation behavior through both disutility of crowding and increase in perceived travel time. Passengers may choose to avoid a crowded route they have experienced before not only because they did not like crowding, but also because the crowded trip is remembered as being longer. This increased perceived travel time resulting from crowding experience is probably more determinant for route choice when a passenger is in a hurry. In this case, the increased perceived travel time by crowding is even more undesirable with regard to the higher VoT when one is in a rush. This can be extended even beyond choosing between routes to choosing between modalities. When public transportation is crowded, it is perceived negatively not only because of its intrinsic discomfort but also because of the increased perceived travel time leading to the choice of private transportation. An interesting future direction is examining when crowding on public vehicles begins to affect mode choice; that is, the subway becomes so crowded that passengers prefer to choose other modes of transport.
Our findings provide a deeper understanding of passengers’ travel time perception in public transit. This knowledge can be applied to travel demand modeling or estimating ridership response to crowding. These models are critical for forecasting passenger behavior under different transit conditions for urban planning and policy making. While SC surveys have been an important tool for such analysis, understanding of the hidden real-world complexities can help to obtain models that better explain behavior and therefore provide a stronger asset for predicting behavior. This can be further tested by comparing real-world choices versus SC survey preferences versus VR choice experiments in which options are previously experienced scenarios rather than hypothetical attribute descriptions. Future work is suggested in these directions.
Based on our previous mediation analysis ( 14 ), negative feelings induced by crowding mediated the lengthened perceived travel time in more crowded situations. If so, the lengthening of the perceived travel time may be implied as an indirect measure of passenger on-board comfort or convenience level aspects of level of service (LOS) modeling ( 11 ). Whereas the subjective assessments can be obtained directly through surveys, there are automatic biases in a holistic experience that can only be indexed through the experience itself. Temporal bias might be a result of such automatic biases. That is, more bias toward perceiving the travel duration as longer compared with its objective duration might imply less satisfaction from the trip. Future work is needed to examine the validity and applicability of using travel time perception bias as an index of automatic negative feelings toward the quality of a trip.
The impact of crowding on passenger preferences is particularly important in the age of COVID-19. In the post-pandemic era, people have renewed attention to crowds in shared vehicles ( 48 ). Public transportation authorities are now concerned that passengers might avoid public transit even when the effect of virus transmission is under control ( 49 ). An interesting future research direction is to replicate data collection from a group with similar demographics to compare the pre-pandemic results with the post-pandemic. If crowding is more negatively felt after the pandemic, we would expect a larger crowding multiplier in the SC task (the conscious feeling), as well as longer perception of duration of more crowded trips in the VR task (the unconscious bias in perception of time).
There are also further implications for urban design, emphasizing the critical role of subjective feelings about crowding over the objective density. The lengthening of travel time by crowding is only mediated by the negative feeling induced by crowding ( 14 ). With the same individual density, passengers in one train could be more immune to the negative effects of crowding on increasing travel time if the vehicle is designed in a way that the experience of crowding becomes less unpleasant. Therefore, designers of public vehicles should consider emotional factors in vehicle design to make crowded vehicles less emotionally unpleasant, not only because of the unpleasantness of crowding itself, but also because of its impact on biasing perceived travel time.
Limitations and Real-World Challenges
Use of VR in transportation behavior study is a relatively new research avenue with increasing studies in recent years. The present work adds to this young body of literature, confirming the applicability of VR in transportation research. Use of VR in behavioral studies related to transportation expands possibilities for designing controlled experimental scenarios. Such controlled laboratory experiments, however, have certain limitations compared with the real-world passenger experiences. The present study had several limitations as we discuss below.
One weakness of the study was the narrow demographic range of the participants, who were mostly undergraduate university students. In psychological behavioral experiments, there is usually less concern about participants’ sociodemographic characteristics compared with consumer behavioral studies. This is perhaps because basic cognitive phenomena might be less susceptible to high-level socioeconomic differences. Here, our conclusions were based on within-individual repeated measures of correlations between the two tasks, rather than comparison between different groups of people. The role of socioeconomic characteristics on the negativity of crowding and its impact on time perception requires further investigation. Additionally, VR trips deviated from the real-world trips in being shorter, with virtual avatars and not including all aspects of crowding such as smell.
In the controlled VR setting we were able to focus on “direct perception” of time based on experience, excluding the “inference” of time through access to objective measures such as phone or clock. However, in the real world, passengers have access to objective time, checking the time from their phones, or looking up the travel durations from the schedule. Examining the direct perception of time was a strength of the study, on the one hand, discriminating it from inference of time—a distinction that is hardly possible in the real world. Future work is needed to examine the extent to which the direct perception of time versus access to objective time contributes to one’s estimate of the travel time in different situations and influences choice preferences and behavior.
In conclusion, the real world is indeed far more complex than our controlled VR study. Here, we did not emphasize the magnitude of the effects but rather the existence and significance of them. The effect sizes may be larger or smaller in the real world. Even though VR may not be precisely similar to the real experience, the impact of crowding on time perception observed in VR was not reflected in the SC survey, suggesting a superiority of VR in capturing certain effects. Our results challenged the over-simplification in the SC surveys in which options are decomposed into different independent attributes. This study is therefore an important step toward understanding the complexities of real-world experiences and the limitations of questionnaire-based approaches to understand passenger perceptions and preferences.
Supplemental Material
sj-pdf-1-trr-10.1177_03611981221130346 – Supplemental material for Crowding and Perceived Travel Timein Public Transit: Virtual Reality Compared With Stated Choice Surveys
Supplemental material, sj-pdf-1-trr-10.1177_03611981221130346 for Crowding and Perceived Travel Timein Public Transit: Virtual Reality Compared With Stated Choice Surveys by Saeedeh Sadeghi, Ricardo Daziano, So-Yeon Yoon and Adam K Anderson in Transportation Research Record
Footnotes
Author Contributions
The authors confirm contribution to the paper as follows: study conception and design: S. Sadeghi, R. Daziano, S.-Y. Yoon, A. K. Anderson; data collection: S. Sadeghi, S.-Y. Yoon; analysis and interpretation of results: S. Sadeghi, R. Daziano, A. K. Anderson; draft manuscript preparation: S. Sadeghi, R. Daziano. All authors reviewed the results and approved the final version of the manuscript.
Declaration of Conflicting Interests
The author(s) declared no potential conflicts of interest with respect to the research, authorship, and/or publication of this article.
Funding
The author(s) disclosed receipt of the following financial support for the research, authorship, and/or publication of this article: Data collection in this research was supported by the Cornell Center for Social Sciences (CCSS); and by the Cornell Center for Transportation, Environment, and Community Health (CTECH). Analysis was supported by the National Science Foundation Award SES-2031841.
Supplemental Material
Supplemental material for this article is available online.
References
Supplementary Material
Please find the following supplemental material available below.
For Open Access articles published under a Creative Commons License, all supplemental material carries the same license as the article it is associated with.
For non-Open Access articles published, all supplemental material carries a non-exclusive license, and permission requests for re-use of supplemental material or any part of supplemental material shall be sent directly to the copyright owner as specified in the copyright notice associated with the article.