
Abstract
The Rose Fitzgerald Kennedy Bridge spans the River Barrow with two 230-m (755-ft) long main spans. It is an extradosed bridge with three towers, and four spans that are supported by cables in addition to several approach spans to complete the 887 m (2,910 ft) length of the whole superstructure. The design paid special attention to landscape integration, durability, and planning requirements. The analysis was required to address challenges related to structural efficiency under service loads and local code considerations, wind effects on traffic, ship collisions, and fire events analysis as well as construction issues related to the extreme slenderness of the superstructure. The design decision-making process and value engineering were heavily constrained by the contract requirements, which led to a solution that slightly departed from pure engineering optimization but that allowed for the addressing of local requirements and integration with the surroundings. This paper presents a case in which engineers had to comply with specifications set by the Administration, which did not correspond to optimum economic engineering solutions. Other criteria such as the aesthetics or ensuring minimum disruption to the landscape are also valuable, especially in the long term, and may drive engineers to nonstandard proposals.
Keywords
The Rose Fitzgerald Kennedy Bridge is a 887-m (2,910-ft) long bridge that provides a bypass for New Ross, a town in the south of Ireland. This link requires spanning the River Barrow, which is around 300-m (984-ft) wide at the crossing point (see Figure 1).
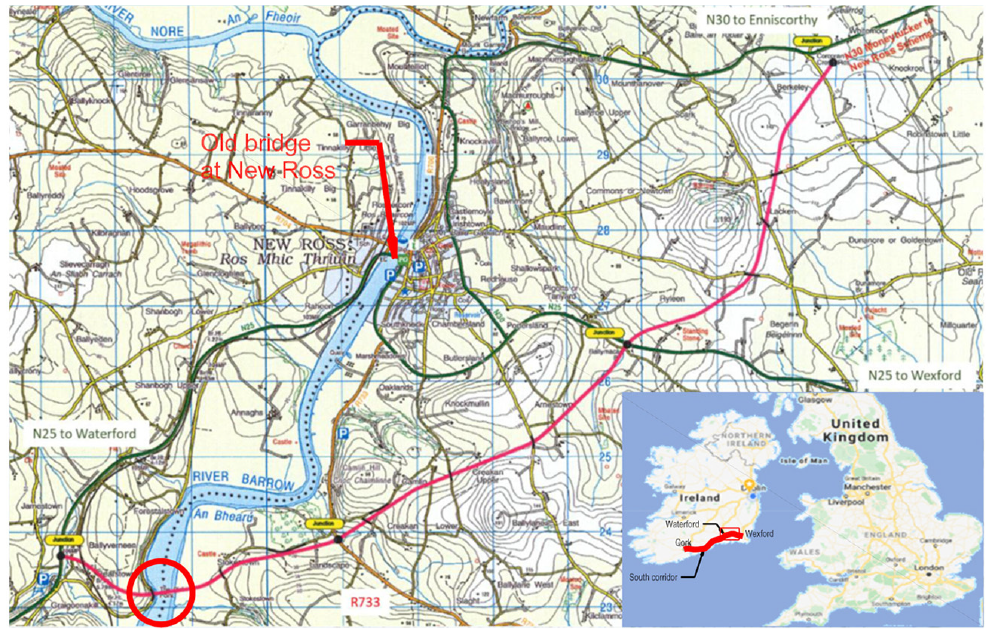
Project location.
This link provides two main improvements to the area: the missing road link in the south corridor of the Island, connecting Wexford to Waterford, and it removes through traffic across the old, substandard bridge located in New Ross town, which held the previous last crossing over the River Barrow before the sea, 15-mi south (See Figure 2).
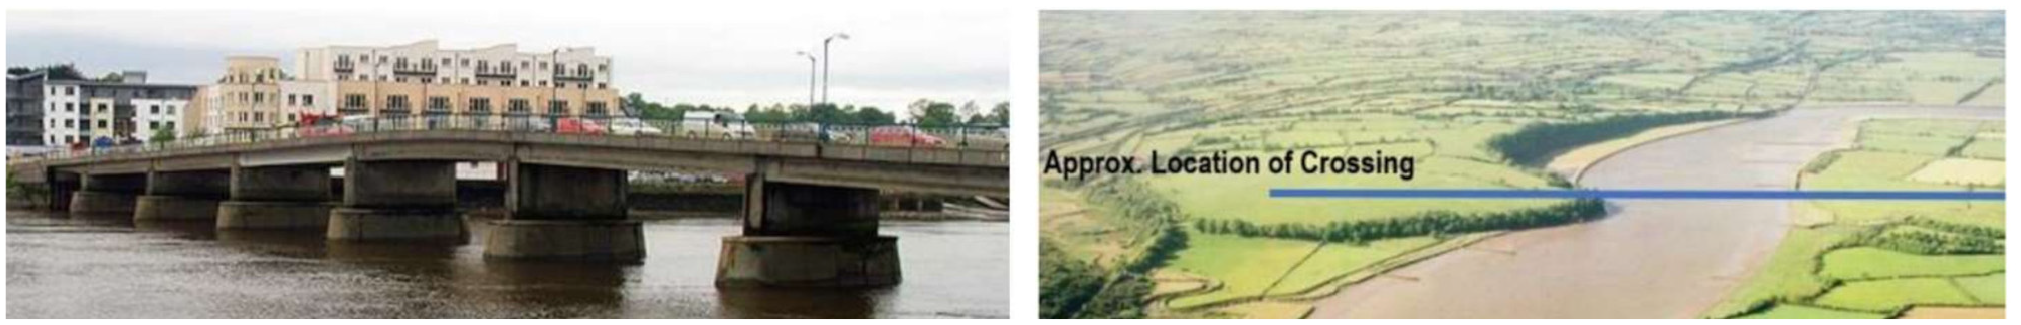
(left) Old New Ross town bridge and (right) proposed crossing point for the new bridge ( 1 ).
The crossing point, known locally as Pink Rock, located only a mile away from the Kennedy Homestead, is surrounded by a typical Irish landscape of gentle hills and green fields within the flood plain of the river to the east and reaching a slightly higher level on the west side, within a special area of conservation that required specific consideration of environmental constraints.
Project History
Irish planning is particularly strict, requiring a long, complex process of obtaining approvals from different entities. Between 2001 and 2013, various stages from constraints studies, route selection, preferred option, and specimen design were undertaken. Different crossing points and bridge forms were considered and a final crossing point and set of constraints were defined to launch the competition for a PPP (i.e., public–private partnership) concession to design, build, and operate this infrastructure.
Along with the crossing point, a three-tower extrados bridge was selected as part of the planning application (See Figure 3). This paper describes development of the design during the stages of tender, detailed design, and construction within the constraints established by the project.
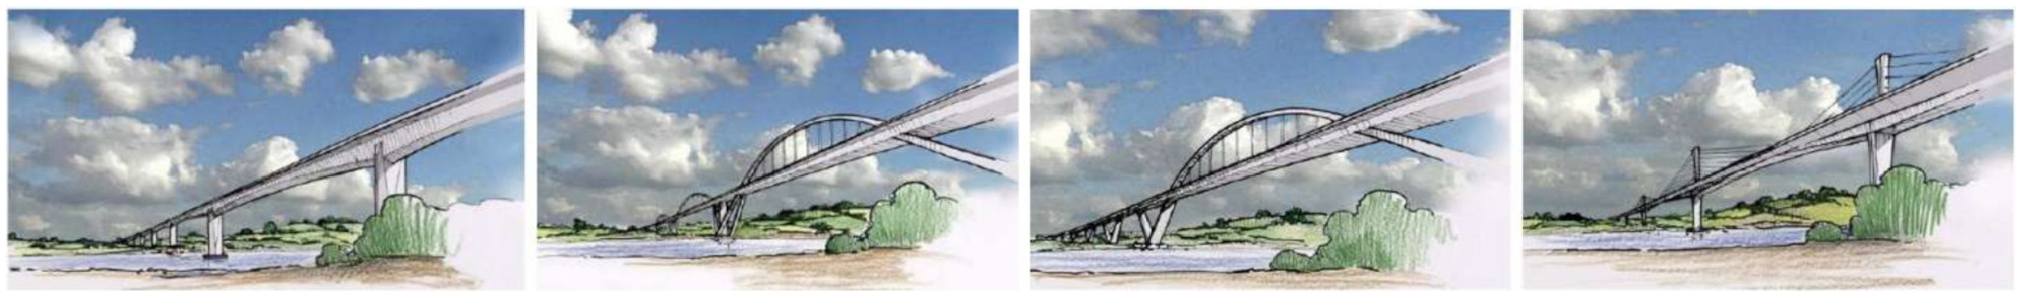
(left to right) Alternatives developed at the conceptual stage before planning, (far right) the selected option ( 1 ).
Once the planning application was approved, a set of fixed parameters was established. These parameters, along with the construction requirements established by Transport Infrastructure Ireland, represented the starting point and requirements for all the design and build teams that participated in the PPP stage. The authors of this paper were members of the successful team, which consisted of designers Carlos Fernandez Casado SL and ARUP, contractors Dragados Ireland & UK and BAM Ireland, and concessionaires Iridium and BAM Concessions.
Project Constraints
This bridge is the largest structure in Ireland and as such was subject to specific aesthetic and architectural conditions. In addition, it crosses the River Barrow in a tidal area within a special area of conservation and over a navigational section of the river. This set of functional and environmental conditions produced the following constraints.
The location of the three towers was fixed in plan, establishing two main spans of 230 m (755 ft). The tower height was also fixed with slight variations allowed (i.e., less than 1 m/3 ft) at around 16 m (52 ft) for the outer towers and 27 m (89 ft) for the central tower. As a direct consequence of this constraint, the only cable-supported structure that was feasible was an extrados bridge, since the cable angle would be around 10° for the longest cables. A single plane of cables located in the middle of the deck and a dual carriageway in each direction were also specified. In addition, a full concrete superstructure was required with no visible steel allowed in principle. Finally, a navigational channel 117-m (384-ft) wide and 36-m (118-ft) of vertical clearance over the mean high water level was required. The rest of the bridge supports and abutment locations could be modified in the longitudinal direction as long as the embankment height was limited to 10 m (33 ft). Figure 4 shows an architectural interpretation of the span distribution by presenting the relation between the different dimensions of the bridge as variable wave lengths that nonetheless respect the golden rules: the ratio between the deck lengths supported by each tower, the ratio between the fraction of the main spans supported by each tower, the ratio between some of the span lengths in the approach spans, and the ratio between the central pier height and the corresponding tower height. Engineers slightly modified these ratios to adapt them to common engineering criteria.
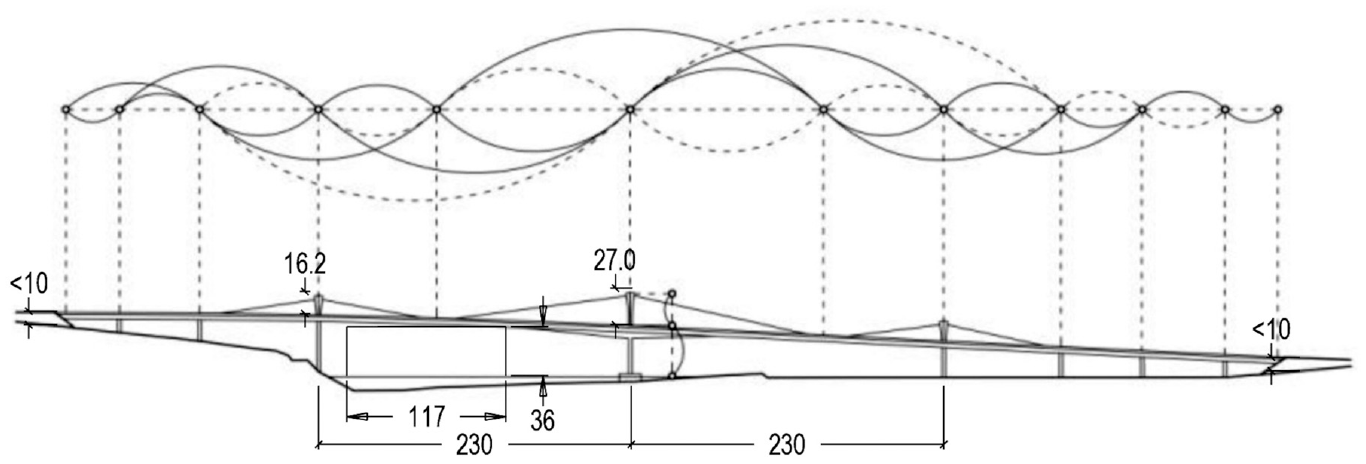
Architectural concept of the bridge ( 2 ).
Design Development
General Considerations
For the given configuration, as part of the planning constraints, that is, a three-tower extrados bridge with 230-m (755-ft) long main spans, there were certain radical approaches to the design that would have improved the efficiency of the structure:
- Equal height towers. A cable-supported bridge with two symmetric, equal spans is a very inefficient structure, particularly under asymmetric span loading. This inefficiency increases if the central tower is taller than the side towers. For this reason, many other multispan extrados or cable stayed bridges have equal tower heights ( 3 – 5 ) or the central tower is shorter (e.g., Mersey Gateway Bridge; see Sanders et al. [ 6 ]).
- Optimum weight cross section. Alternative, lighter cross sections, replacing the outer webs with either ribs or props (see Figure 5) were also proposed.
- Steel composite superstructure at midspan. Concrete is much heavier than steel and for long-span bridges the capacity/weight ratio can diminish structural efficiency; a central section, working under hogging bending (i.e., negative bending) in steel composite is not only beneficial from a weight saving point of view but also structurally, neglecting the requirement of posttensioning in the bottom slab.
Value engineering of the cross section: (left) specimen design and (right) proposed.
However, none of the optimizations indicated above were allowed to progress to an approved submission owing to the specific planning or client requirements as part of the tender stage. As a consequence, the value engineering focused on the points indicated in the following section.
Value Engineering
In light of the aforementioned constraints, the value engineering during the competition stage focused on the following elements:
- Optimization of the cross section from a structural behavior point of view;
- Structural depth at midspan and at the towers;
- Pylon dimensions, number of cables, longitudinal spacing and strand size of the cable system, and the balance of internal and external posttensioning; and
- Construction methodology.
Optimization of the cross section was the first element developed, given the constraint of using concrete as the material and the tower heights leading clearly toward an extrados bridge with shallow cables. Optimized weight and cross section behavior were paramount to optimization of the structure.
A deck that carries a dual carriageway in each direction will require a relatively wide top flange, around 19 to 20 m (62 to 66 ft) when hardshoulders and barriers are considered. Since the stay system is located in a single plane in the central axis of a section, the balance between the cantilever length and the distance from the webs and the cable system is paramount to optimizing transversal behavior.
The specimen design’s cross section (Figure 5a) considered the main webs in the outer perimeter of the section, with props or internal ribs at certain locations. This solution was not very efficient at the cable locations nor at other parts of the bridge where cables were not needed as the top slab had a significant span. The proposed cross section (Figure 5b), considered vertical webs 8-m (26-ft) apart and, to support the cantilevers, a secondary element that was not an aspect of longitudinal behavior but would reduce cantilever bending. This secondary element could have been a rib or a prop, but the client wanted the box to have a “closed appearance,” so a precast panel with minimal spacing between panels to avoid longitudinal continuity was provided.
The rest of the value engineering process consisted on minimizing the pylon width, as this has a direct impact on the cross section width, and adjusting the cable size and spacing. A 1.8-m (6-ft) wide pylon, carrying saddles for a maximum of 127 strands was the arrangement designed, with cables spaced 6.5-m (21-ft) longitudinally and using internal posttensioning to achieve the remaining capacity of the structure to fulfill the service and ultimate limit state requirements.
Detailed Design
Description of the Solution
The solution resulting from the value engineering process consisted of a 887-m (2,910-ft) long superstructure with a span arrangement of 36-45-95-230-230-95-70-50-36 m (118-148-312-755-312-230-164-118 ft), with the four central spans supported by a cable system and the rest of the structure spanning as a continuous girder (see Figure 6)
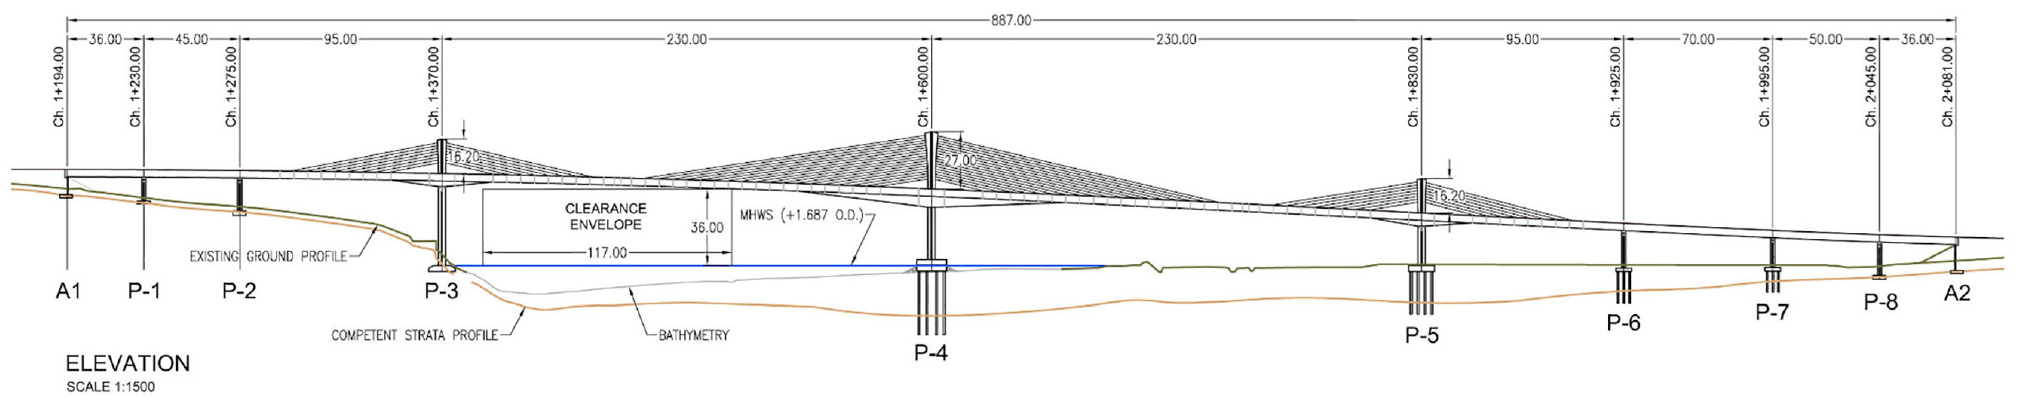
Bridge longitudinal elevation.
The tower heights were limited to 16.20 m (53 ft) on the side towers and 27 m (89 ft) for the central spans, supporting a different number of cables proportional to the tower height: 18 cables in the central tower and nine cables for the side towers. The cable arrangement is referred to as a pure harp, with all cables running parallel at an angle of approximately 12° to the horizontal. The deck was 3.50-m (11 ft 6-in) deep at midspan and approaches, with a linear increase only on the three central towers to a depth of 6.50 m (21 ft 4 in) in the outer towers and 8.50 m (27 ft 11 in) in the central tower (Figure 7). This resulted in a slenderness ratio for the central spans of L/27 at the central tower, L/35 at the side towers, and L/65 at midspan, which, for an extrados configuration, is a very slender approach.
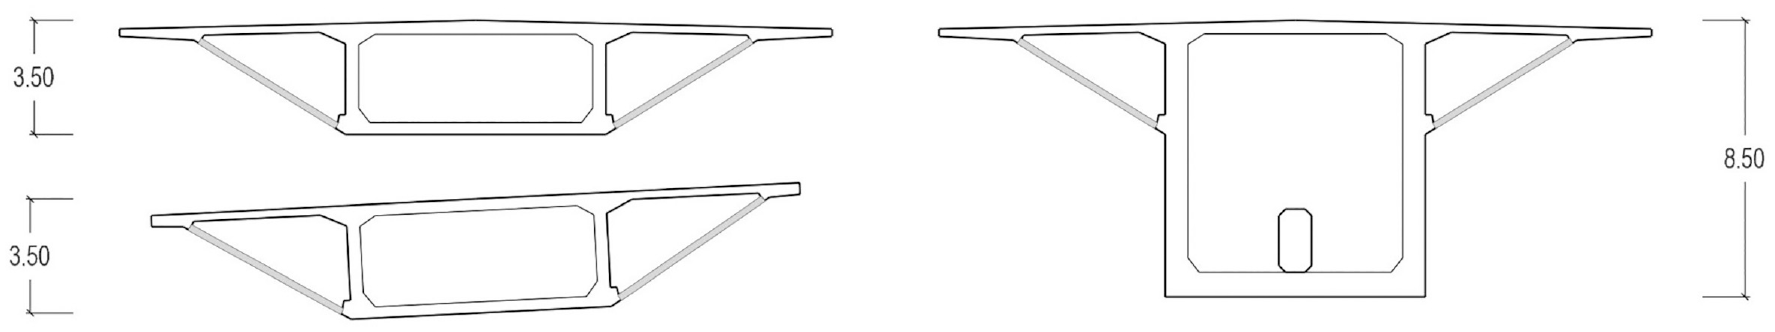
Deck cross sections: (top left) midspan in central span, (bottom left) approaches, and (right) at central pier.
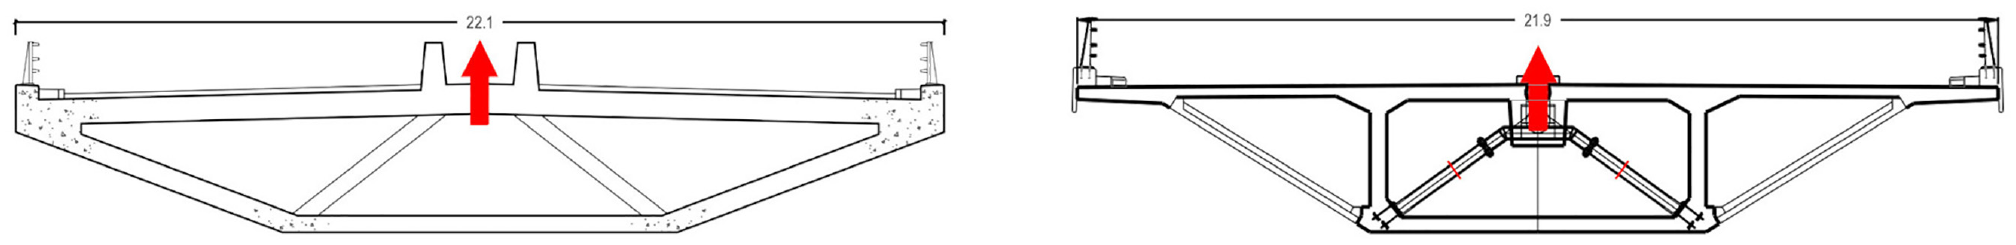
The deck width varied between 19.9 m (65 ft) at the approach spans and 21.9 m (72 ft) over the main spans to accommodate the 1.6-m (5 ft 3-in) wide pylons and central barriers.
In relation to the superstructure–substructure connection, the central pier was integral while the rest of the piers were connected to the deck using pot bearings.
The design of this complex bridge involved many constraints, as described, and required manifold decisions and analyses, the most relevant of which are presented in this paper. However, it would have been very difficult to present them all in detail; those only briefly mentioned include cable fatigue testing, wind studies, hydrodynamic and scour studies, and fire analysis.
Longitudinal Behavior
The longitudinal behavior of a structure of this type is governed by the relative stiffness between the cable system and the girder working in bending. The presence of two symmetric spans with a taller central tower therefore exacerbated the flexibility of the system under asymmetric load. This effect was amplified by the relatively conservative traffic loading required by the Irish National Annex to the Eurocodes ( 7 ) as shown in Figure 8.
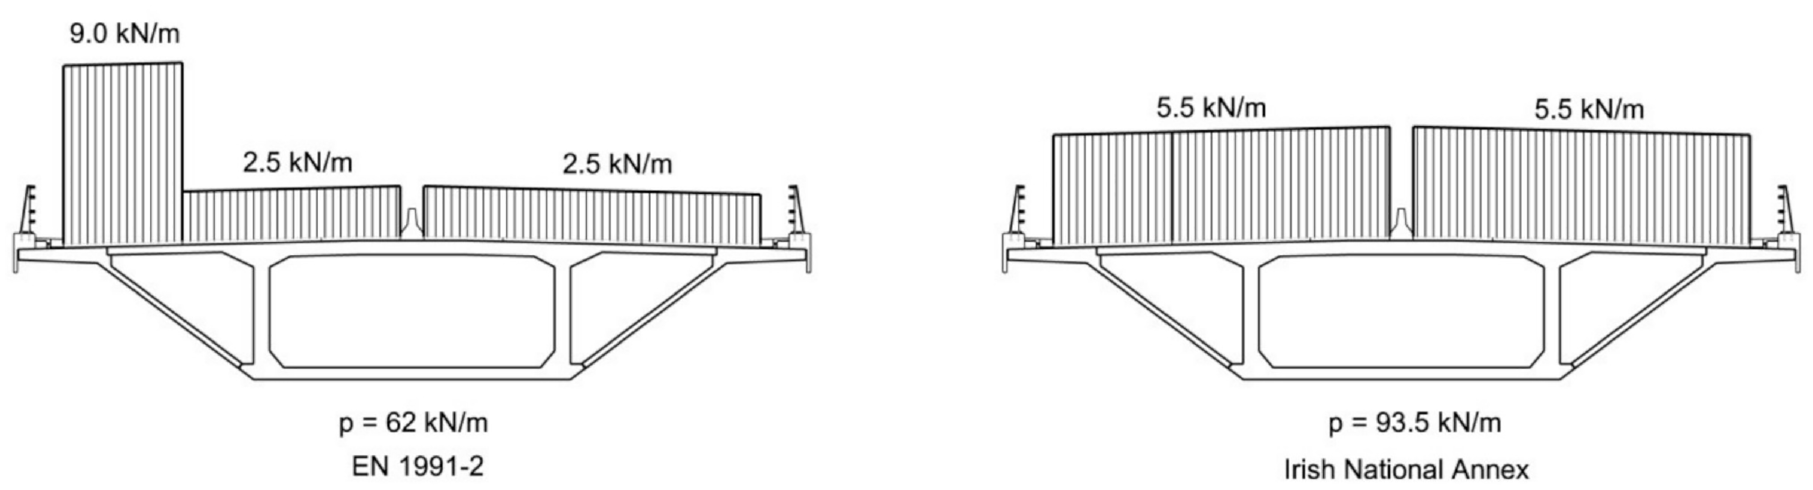
(left) General Eurocodes (EN1991-2) versus (right) traffic load in the Irish National Annex.
Another important parameter that governed the behavior of the bridge was the longitudinal slope of the road, resulting from the vertical alignment having a slope of nearly 5% (because of the transition from a high plateau on the west bank to a lower level on the east bank) and a very shallow cable angle (average 12°), which meant the vertical component of the cable force was very different on the left and right sides of the tower (see Figure 9).
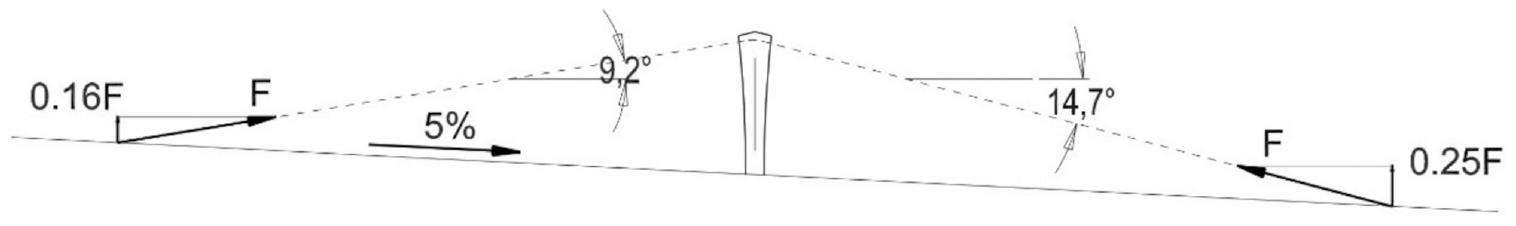
Effects of the longitudinal slope on the supporting role of the cables.
The flexibility of the system can be observed when the symmetric versus nonsymmetric traffic loading for the main spans is considered. Figure 10 shows the loading pattern, bending moments, and deflections for the traffic loading to produce the maximum bending at the central tower.
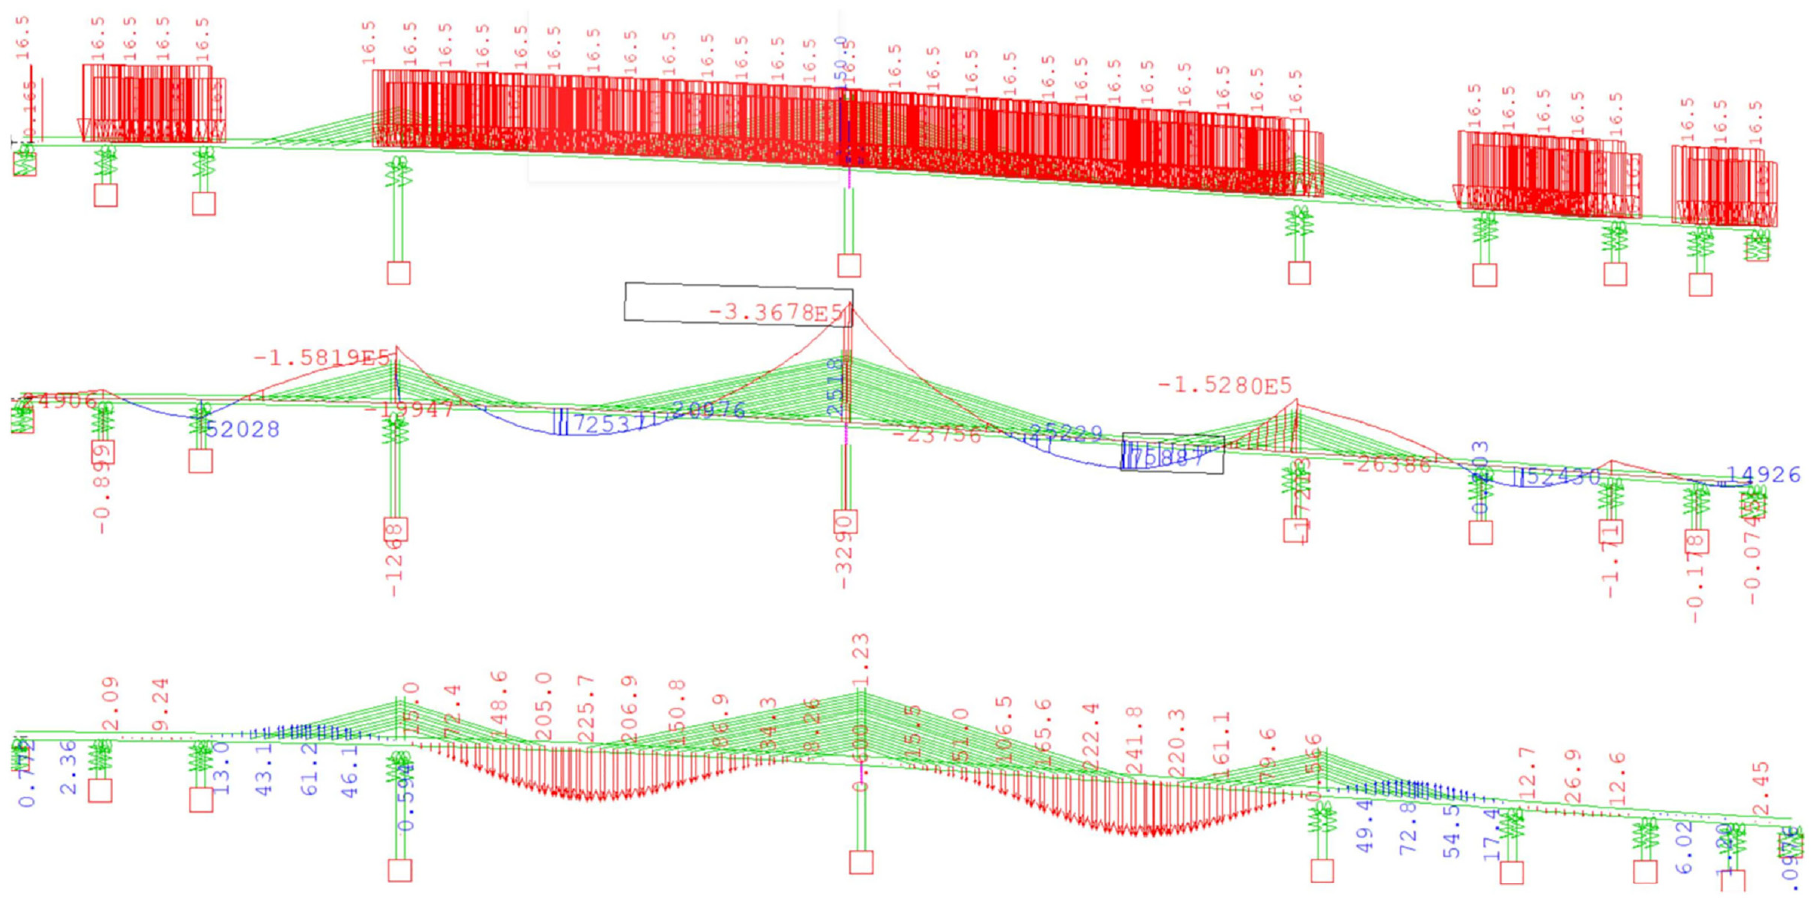
(top) Loads (KN/m/lane), (middle) bending moment (KNm), and (bottom) deflections (mm) under LM1 traffic symmetric loading.
As shown in Figure 11, the nonsymmetric traffic loading produced the maximum sagging (positive) bending at midspan.
(top) Loads (KN/m/lane), (middle) bending moment (KNm), and (bottom) deflections (mm) under LM1 traffic nonsymmetric loading.
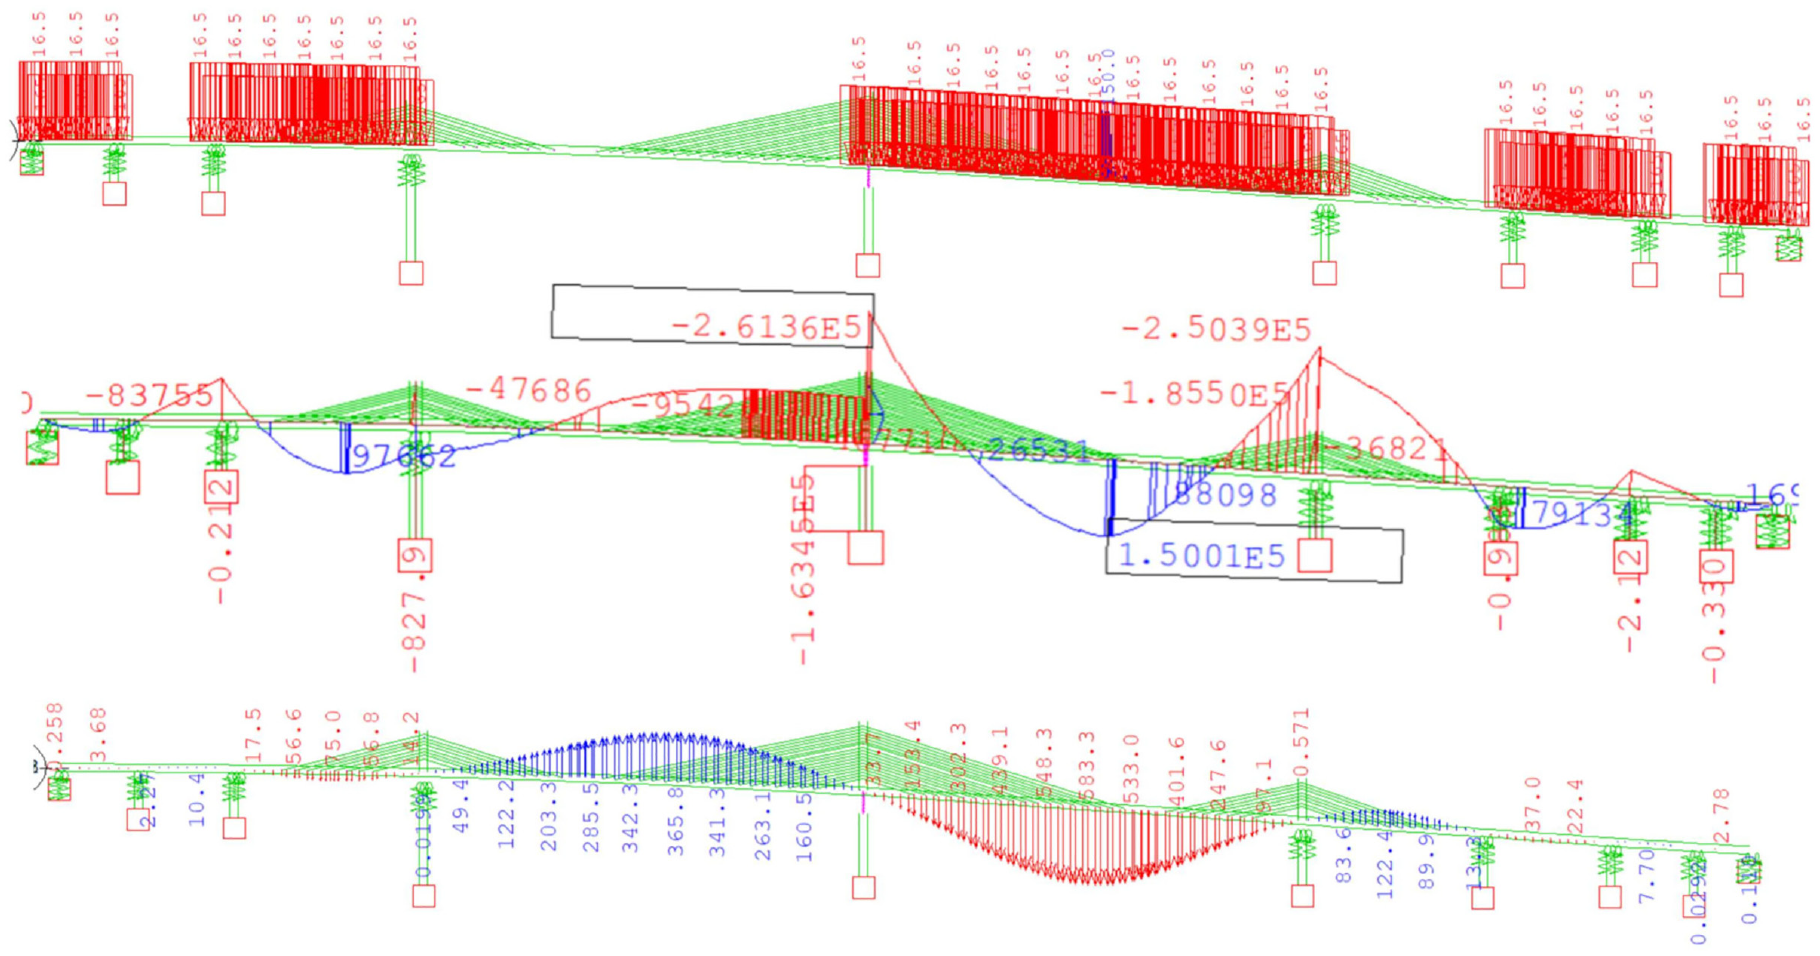
As can be seen, because of the flexibility of the system provided by the taller central tower, the maximum deflections nearly doubled in the span, and the bending moment in the girder at the central tower in the nonsymmetric case was 77% (261.000 kNm versus 336.000 kNm; 23·106 kip-in. versus 30·106 kip-in.) of the corresponding value for the symmetric case. It can also be observed that the superstructure at the lateral piers (which were 6.5-m deep versus 8.5 m at the central pier) took a bending moment of approximately 70% at the central tower (250.000 kNm versus 336.000 kNm; 22·106 kip-in. versus 30·106 kip-in.) with respect to the symmetric load pattern. This ratio increased up to almost 100% if the envelope of all load cases was considered, as shown in Figure 12.
Serviceabilit Limit State bending moment envelope (frequent combination).
This inefficiency of the structural system, combined with the inherent slenderness of the superstructure and also the requirements of the Irish National Annex of the Eurocodes ( 8 ) to achieve full compression under service loads at any point of the cross section, resulted in significantly large quantities of steel for the main cables and internal posttensioning and also led to the requirement for high strength concrete in a significant part of the superstructure. These drawbacks could have been partly avoided by increasing the superstructure depth, but this step would have increased its weight and, for a record span like this, would have also increased the amount of prestressing since there was no room for increasing the capacity of the cables.
The distribution of concrete strength along the superstructure was optimized not only at longitudinal locations, but also within the cross section. High strength concrete C80/95 (f’c = 11.6 kips per square inch [ksi]) was used only at specific places, transitioning to C60/70 (f’c = 8.7 ksi) and to the more conventional C50/60 (f’c = 7.2 ksi) wherever possible. This is shown in Figure 13 (only half of the bridge is shown in this figure; a similar distribution can be found in the other half).
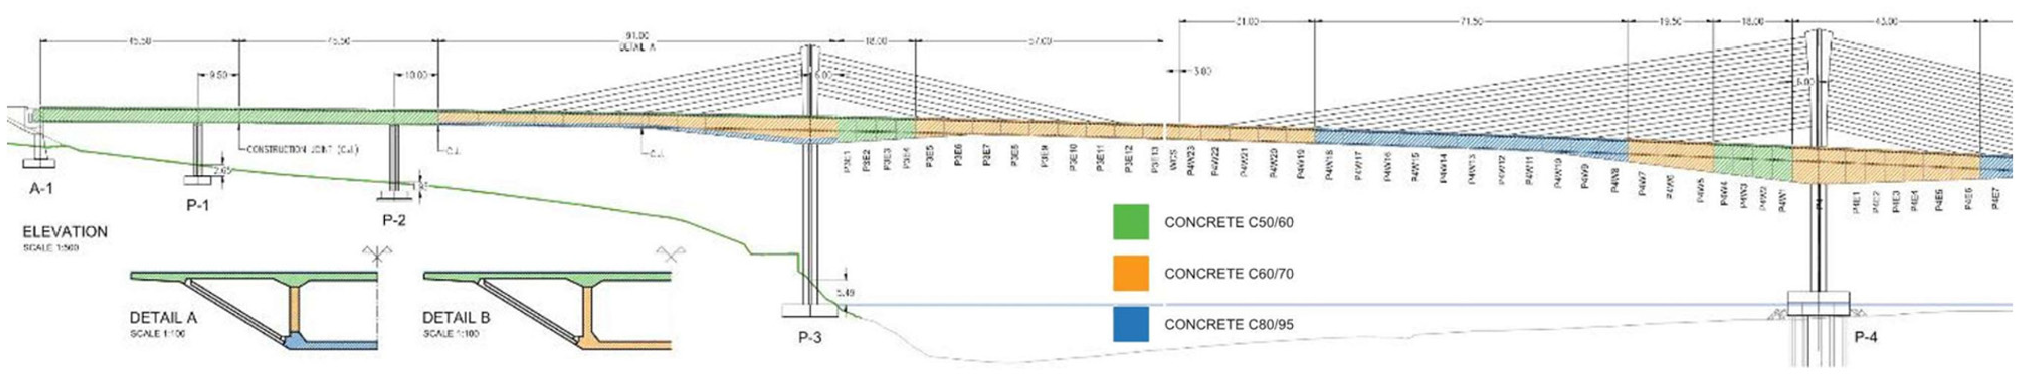
Distribution of concrete strength along the deck.
Cable Design
Although the Eurocode does not explicitly allow an increase in the cable forces under service beyond the limits corresponding to cable stayed bridges, this is common practice on codes where extrados bridges are explicitly identified ( 9 , 10 ). Extrados bridges will typically have stress variation that is under the frequent service envelope, between 50 N/mm2 (7.2 ksi) and 100 N/mm2 (14.4 ksi), owing to the shallowness of the cable system and the relative stiffness of the deck as a girder that is taking more live load than a conventional cable stayed bridge ( 11 ).
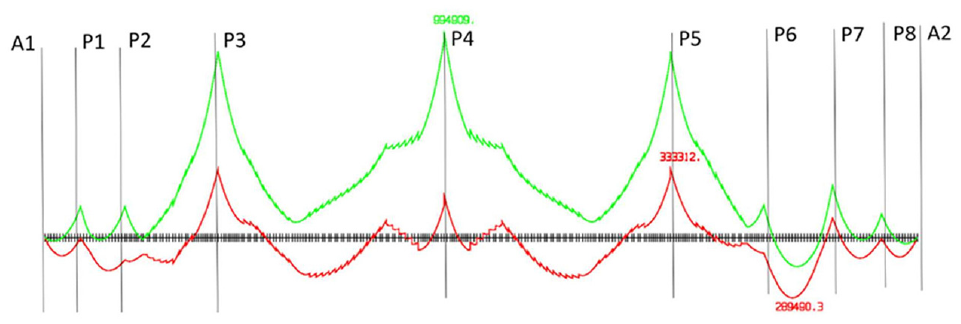
However, in this bridge, this was not the case because of the symmetry produced by the three-tower arrangement and the central tower’s flexibility. Figure 14 presents the cable stress variations under the frequent combination, and particularly in the lateral towers, the stress ranges are all clearly above 50 N/mm2 and much closer to the conventional range of cable stayed bridges.
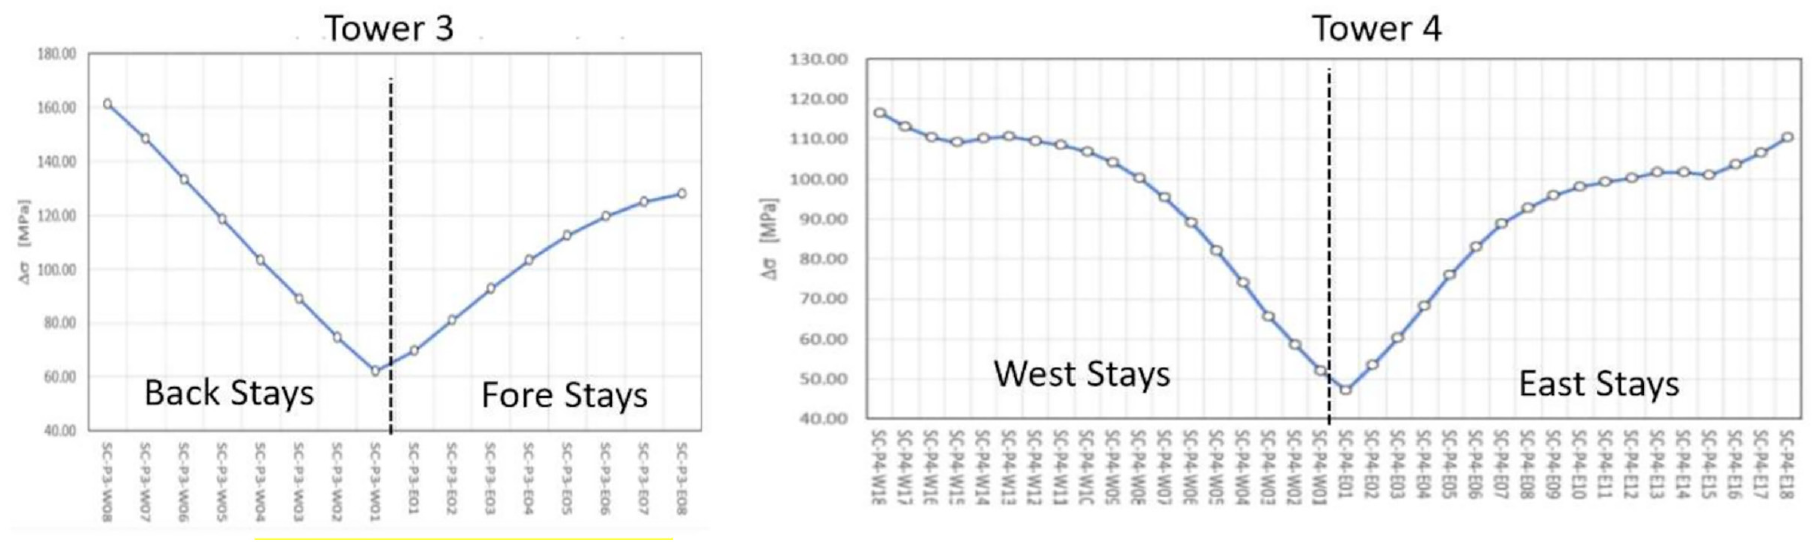
Serviceability Limit State cable stress variations (frequent combination): (a) Tower 3 and (b) Tower 4.
For this reason, and even if the specific requirements on the bridge would have allowed for cable stresses in service beyond those in conventional cable stayed bridges (i.e., 0.45 GUTS without local bending or 0.5 GUTS with local bending), it would have been difficult to take advantage of the additional allowable stresses in this extrados bridge as the cables were subject to high stress ranges resulting from the structural behavior of the bridge.
Transversal Behavior
The main feature of the transversal behavior of this structure was the load transfer between the cable and the deck. Owing to the central location of the cables and the distance between webs, 8 m (26 ft, 3 in), the transversal behavior induced in the top slab was significant. For this reason, diagonal steel members were placed inside the box at the cable locations.
The top slab was subject to two tension fields: a dispersion field of the horizontal component of the cable force (Figure 15b, in blue) and the portion of the vertical component not taken by the diagonal steel beams (Figure 15b, red).
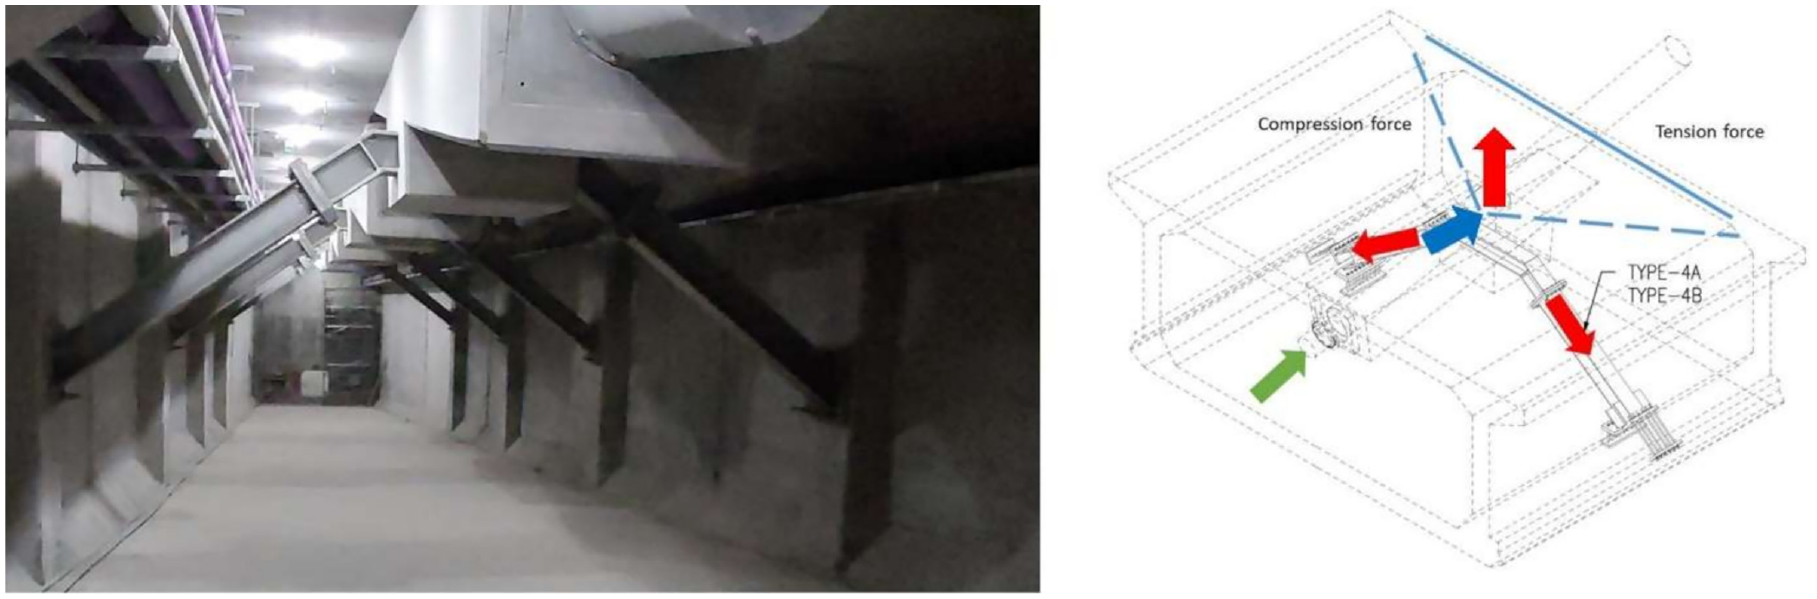
(left) Internal beams at cable location and (right) structural scheme of cable force.
The calculations showed that the distribution of the vertical component of the cable varied between 30% for the shortest cable, for which the struts were more flexible as, being located in the variable depth section of the deck, they did not reach the bottom corner of the box, and 50% for the longest cable (Figure 16).
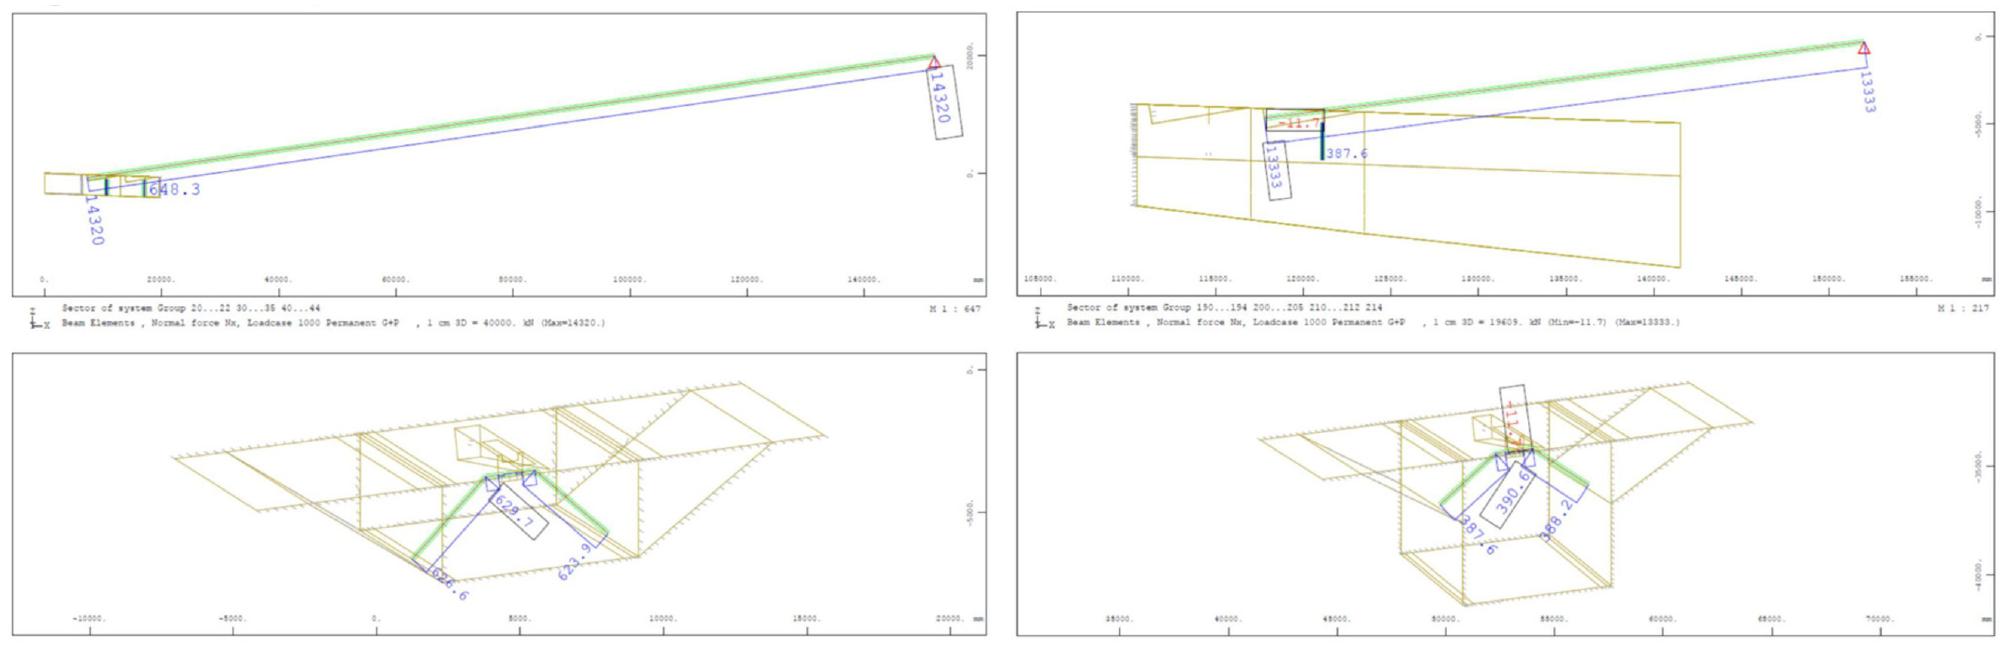
Distribution of forces from the main cable (top) to the internal props (bottom) in the shortest cable (right) and longest cable (left) of the central pylon.
In addition, top slab reinforcement continuity was interrupted while the cable form tube was crossing the slab. Because of the shallowness of the cable angle and the diameter of the form tube (558 mm, or 22 in., for a 127-strand cable size) the length interrupted by the form tube was around 3.0 m, which represents a significant ratio given the cable spacing of 6.5 m (21 ft) (Figure 17). This necessitated transversal posttensioning to resist the bending and tension forces induced in the top slab and an analysis that required use of two- (2D) and three-dimensional (3D) finite element models.
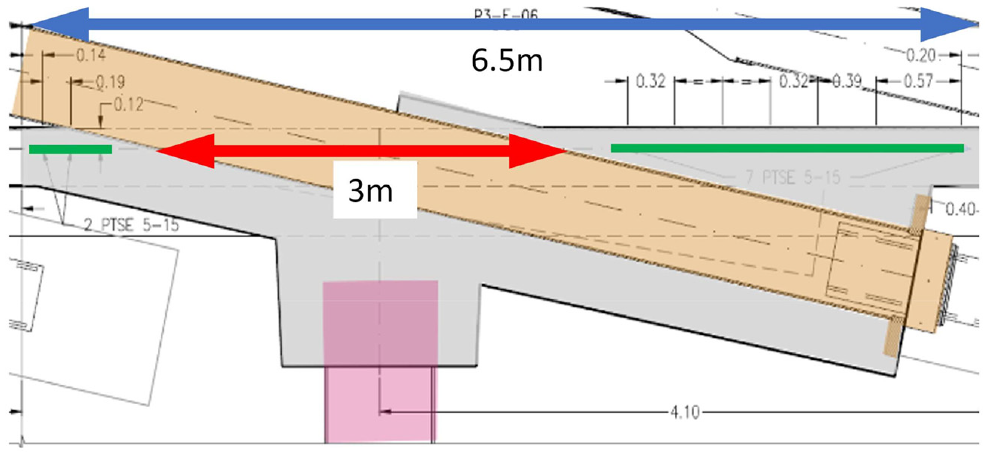
Longitudinal cross section of a typical segment over the cable.
The verification of the top slab was carried out using both 2D and 3D models, since the angle of the form tube also requires analyzing the top slab thickness taking into account the corner effects at the top slab–form tube intersection (Figure 18).
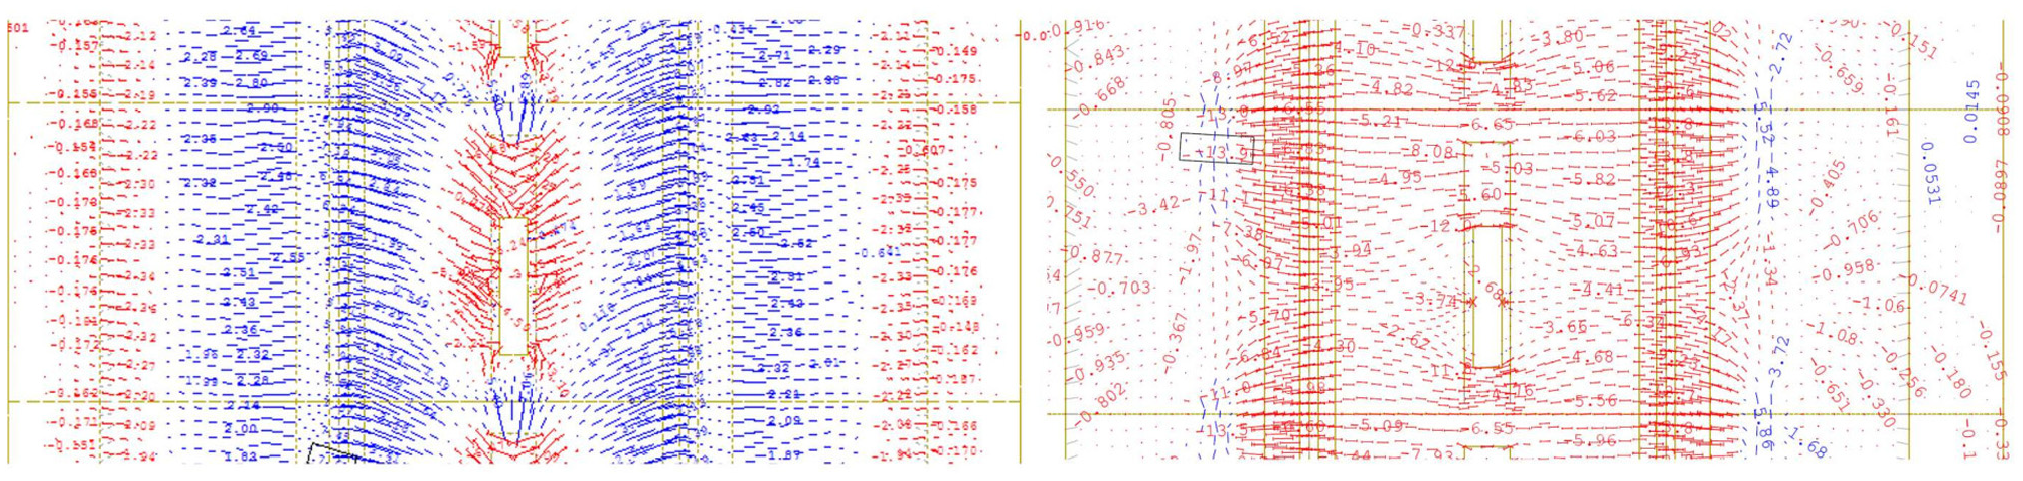
Principal stress distribution resulting from the cable force (right) and transversal posttensioning (right) in the top slab (red indicates tension and blue indicates compression).
The analysis showed that at least five strands running through the top slab were required to ensure that compression under the service load combination was achieved. The transversal posttension tendons were anchored beyond the vertical webs in the internal triangular cells created by the precast slabs and the web, as shown in Figure 19.
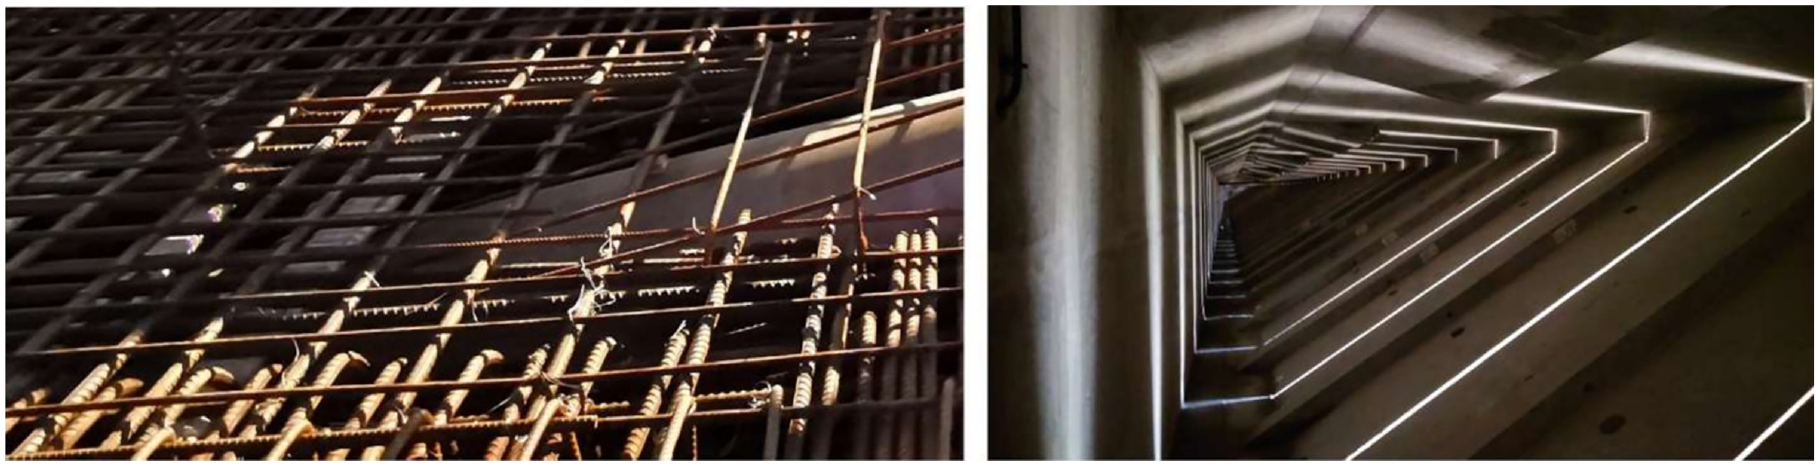
(left) Transversal flat tendons crossing the top slab and form tube for the main cable, and (right) blisters for the transversal prestress tendons in the outer cell of the deck.
Special Analyses
In addition to the conventional analysis required in this type of structures there were three areas that required special attention: wind, fire, and ship impact.
In addition to the usual wind parameters to determine structural behavior, it was required to demonstrate whether the provision of wind shields would allow for the road to remain open for maximum winds within the 5-year return period.
In relation to fire, verification of specific requirements against the progressive collapse resulting from a particular fire event involving a 50 MW fuel tank was required.
The assessment of ship impact required the two piers adjacent to the river to withstand an impact from a ship of 6,000 Dead Weight Tonnage traveling at 8 kn.
Wind
As indicated, vehicle structure wind analysis was carried out to determine wind shield requirements in addition to conventional wind studies, which, while required, were not expected to produce any surprising outcomes, given the bridge comprised a concrete superstructure and span/depth ratios just slightly above the continuous beam but far from the structures that are usually prone to aeroelastic instability.
The wind tunnel studies were complemented using analytical methods, taking into account the vehicle and structure dynamic properties (see Figure 20).
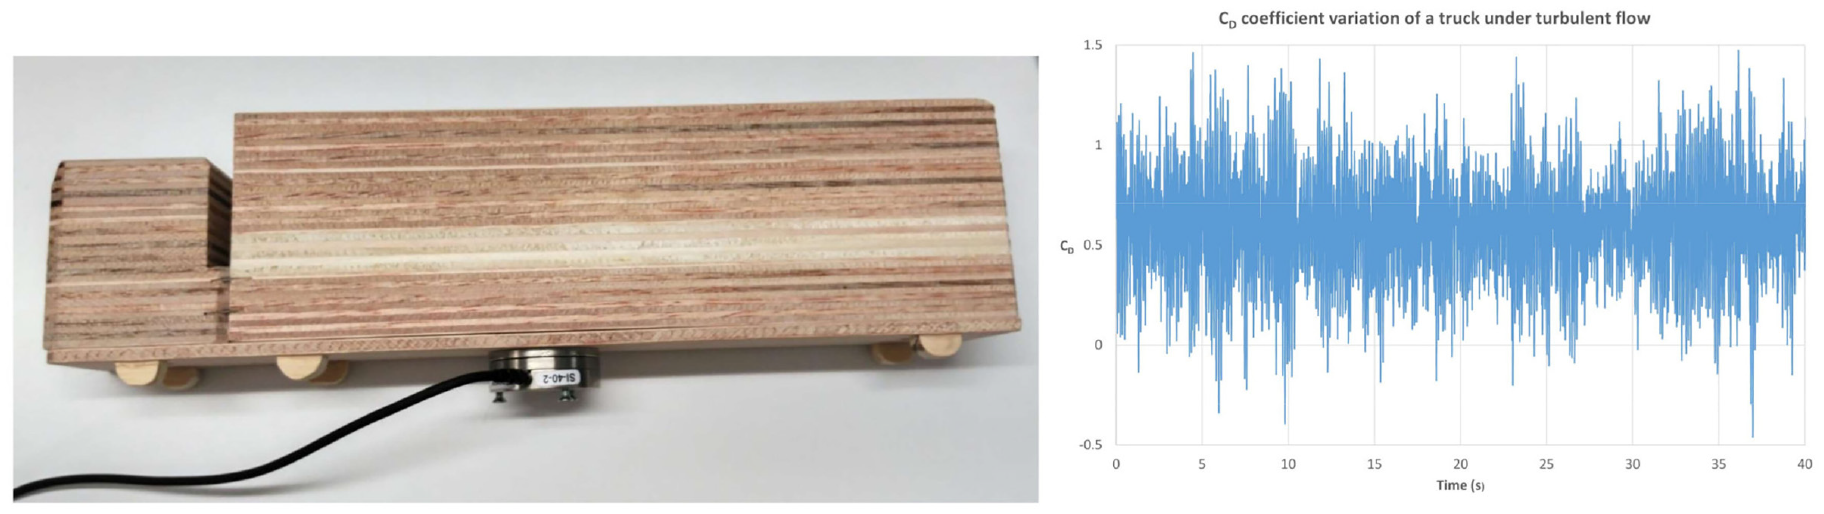
(left) Truck model used in the wind tunnel studies and (right) drag coefficient in the truck from wind loads resulting from the wind tunnel studies.
The values obtained from the wind tunnel were used to carry out a dynamic explicit analysis using vehicle–bridge interaction ( 12 , 13 ) to determine whether trucks (see Figure 21) would be stable in wind for the specified 5-year return period (33.8 m/s or 75.6 mph peak wind speed; and 23.7 m/s or 53 mph mean wind speed for a 10-min period at superstructure level). The results indicated that external wind shields on the deck were not required, only local wind protection around the three pylons.
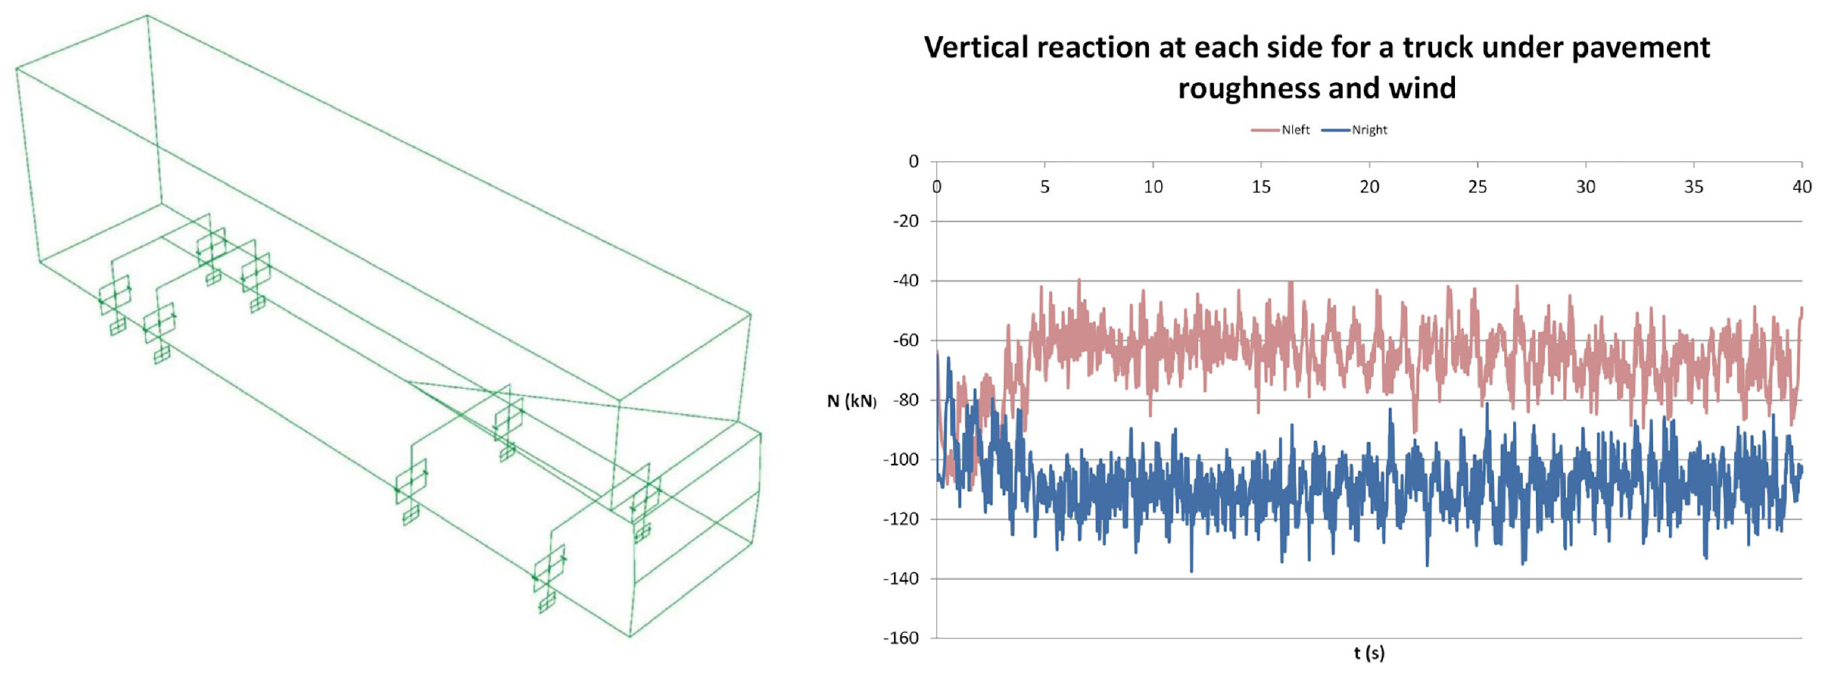
(left) Truck model used in the study of vehicle–bridge interaction and (right) vertical reactions at each side of the truck.
Fire
The contract required verifying the structure against progressive collapse for a 50 MW fire event triggered by a fuel container. This analysis required the use of thermal calculations on the distribution of heat contours at different locations (see Figure 22), which were used to determine the cable capacity reduction from this effect.
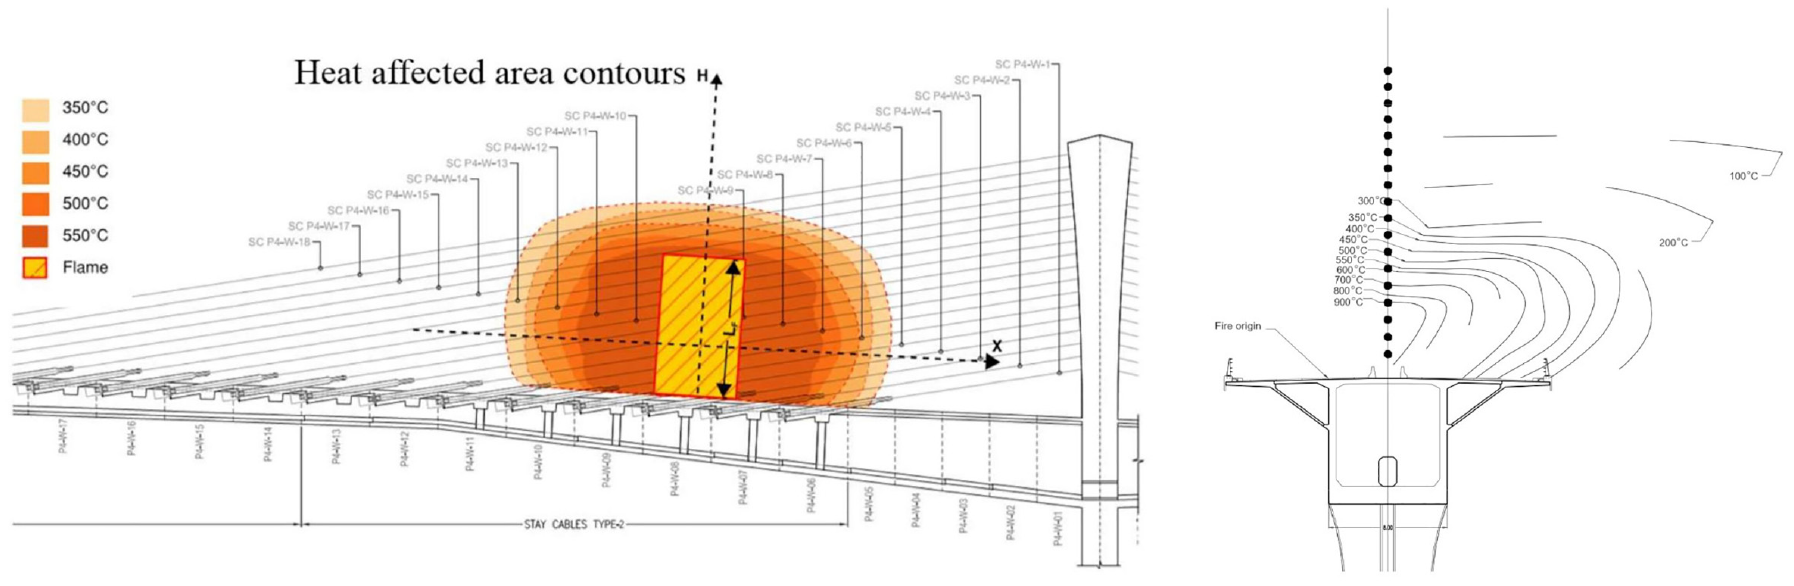
(left) Longitudinal and (right) transversal temperature contours resulting from the fire event.
As a result of this study, it was concluded that through the use of thermal blankets in the interior of the cables and only at their lower sections, the bridge would be able to sustain the considered fire scenario for 60 min.
This duration was established as necessary to allow for the required mitigation services to be deployed considering response times and the location of the structure.
Ship Impact
As indicated in the previous section, it was necessary to determine the effects of a ship’s impact on the towers adjacent to the river, particularly the central pier, which is located within the tidal range of the river.
A simplified analysis using Eurocodes or AASHTO ( 14 ) would have resulted in significant static loads of between 38 and 70 MN (8,500 and 15,700 kip), which led to a more detailed analysis that took into account the actual configuration of the ground and energy dissipation of the ship while approaching the foundation, along with the nonlinear behavior of the soil–structure displacement during the impact scenario, including the energy loss of the ship because of grounding (Figure 23).
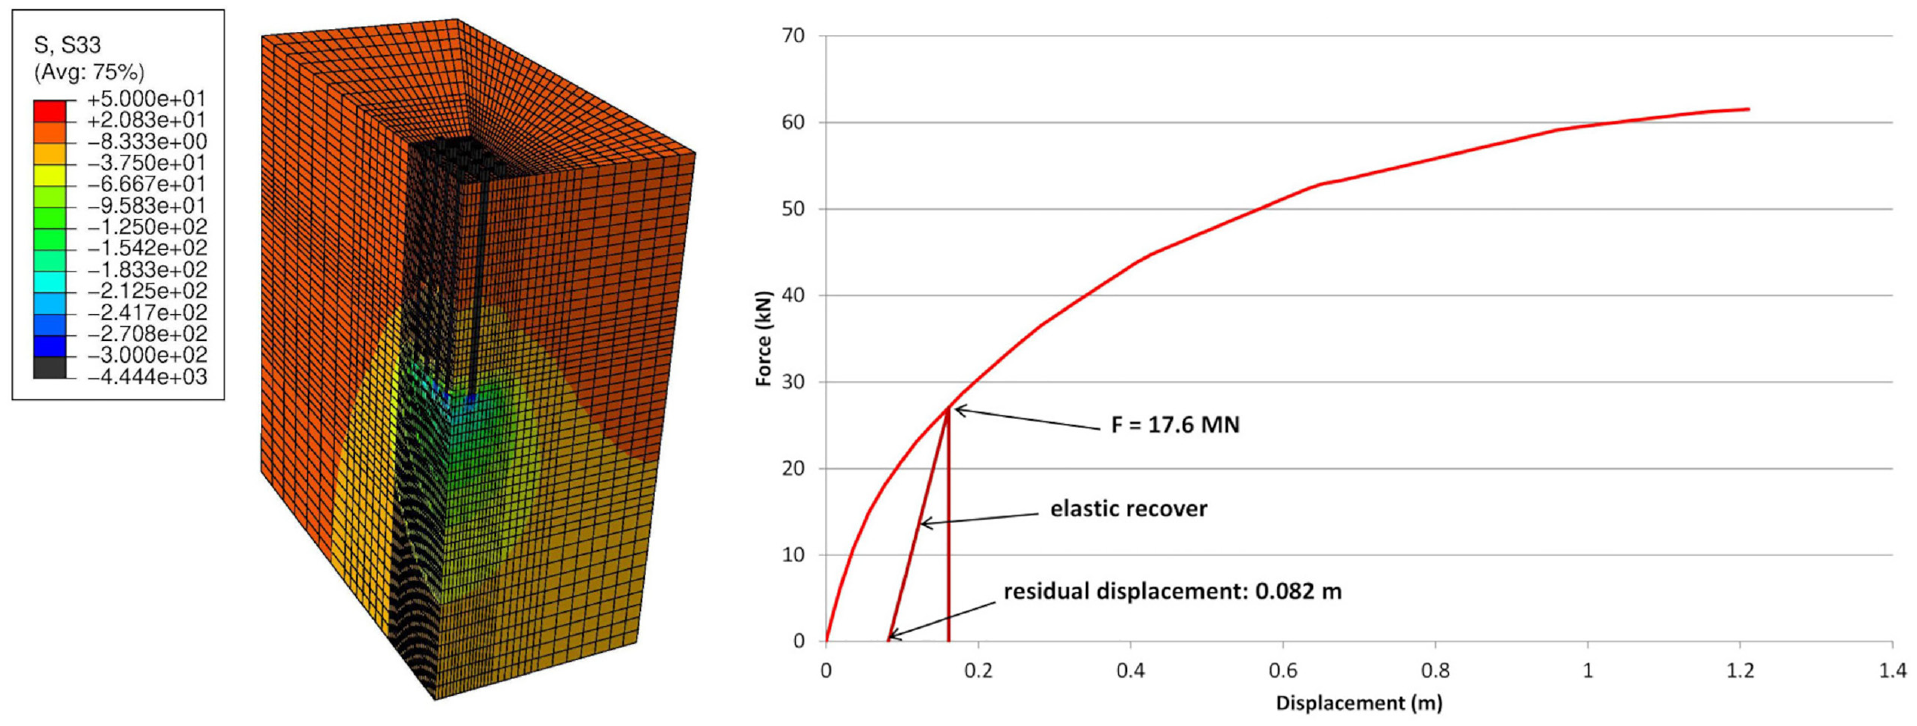
(left) Soil modeling of the central foundation for the study of group effect and (right) force-displacement diagram for the pilecap.
This analysis was repeated using deterministic values for ship speeds, angles, and tonnage to determine the maximum bending moment induced in the foundation. As a main conclusion, the placement of a rock revetment 2.0-m (7-ft) wide around the perimeter of the central pier pile cap was found to greatly reduce the forces transferred to the foundation during a ship impact event. Furthermore, this rock revetment had beneficial effects on scour and minimized the impact on sedimentation patterns of the foundation.
Construction
General
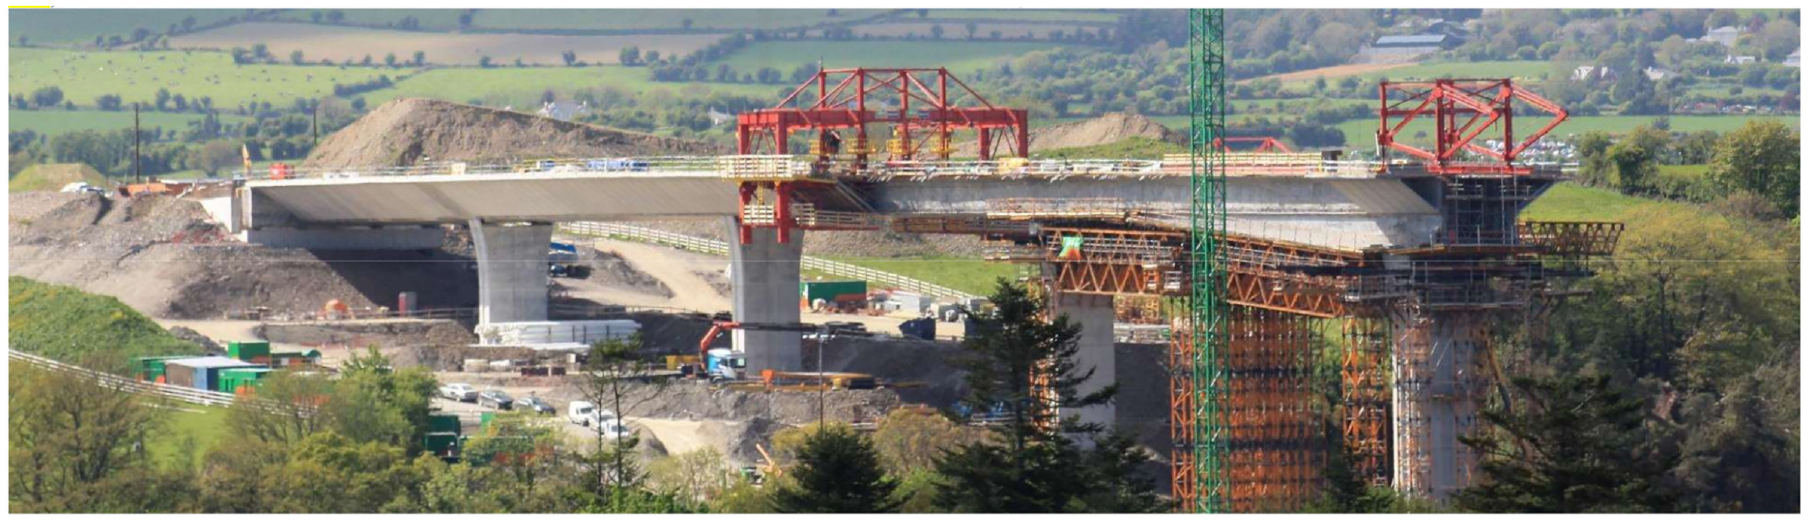
The construction of a long-span extrados concrete bridge represented a massive challenge. Owing to the asymmetry of the pylon heights, the central pylon during construction achieved a cantilever of 140 m, which is a world record. The construction method used for the lateral spans was different than for the main spans.
Because of the relatively short distance from the superstructure to the ground outside the main spans (up to 25 m/82 ft) around Pier 3 on the west side of the bridge), a scaffold to the ground was used for the central core of the box, followed by a wing traveler for the overhangs. The main spans were then built using four separate form travelers: the lateral ones advanced after the side spans were built, and the central tower required a conventional advance in a balanced cantilever. Figure 24 below summarizes the overall superstructure construction and Figure 25 shows the side span construction using scaffold and wing travelers.
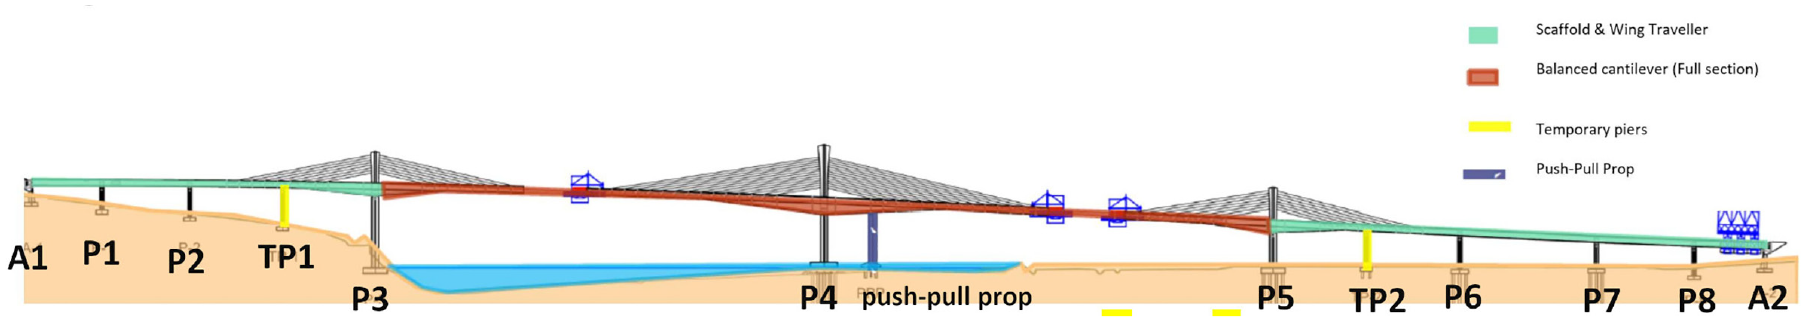
Construction methods used in the River Barrow construction.
East-side scaffold and wing traveler construction (Abutment 1 to Pier 3 including Temporary Pier 1 shown).
Since the balanced cantilever construction was limited to the two main spans, the two 95-m (312-ft) long lateral spans beside the main spans needed a temporary support at midspan as they could not resist their own weight until the main cables were installed and this moment was governed by the construction of the main cantilever (see Figure 24, in yellow).
Additionally, to avoid the bending of the main tower cantilever construction governing the column and foundation design, a temporary pier able to take both tension and compression (i.e., push–pull pier in Figure 24) was located around 20-m east from the main tower, away from the river.
Cantilever Construction
The construction of the cantilevers proved to be a challenge, in particular because of the behavior of the high strength concrete at early age. The construction time for the segments, which varied in length from 4.0 m (13 ft) in the initial segments to 6.5 m (21 ft), coinciding with the cable spacing of the segments after the first four, was initially estimated to be around 10 to 12 days per segment, after taking into account a minimum concrete strength of 30 N/mm2 (4,350 pounds per square inch) (or 36-h concrete age) before stressing concrete and moving formwork. However, the real construction time of the segments had a much larger dispersion.
To ensure the correct prediction of deflections during construction, two separate independent models were used for the geometry control. Creep and shrinkage tests were carried out in a laboratory, but owing to the traveling time to the laboratory, the earliest loading time for a specimen was 14 days rather than the 1.5 or 3 days initially requested by the designer.
During the construction of the cantilever, and particularly after casting Segment 12, by which time construction had achieved a constant pace of 8 to 12 days per segment and the segments were all of high strength concrete (C80/95), it was observed that the deflections predicted started to diverge from the theoretical ones predicted by the two models, with a clear divergence on the lesser-age segments (see Figure 26).
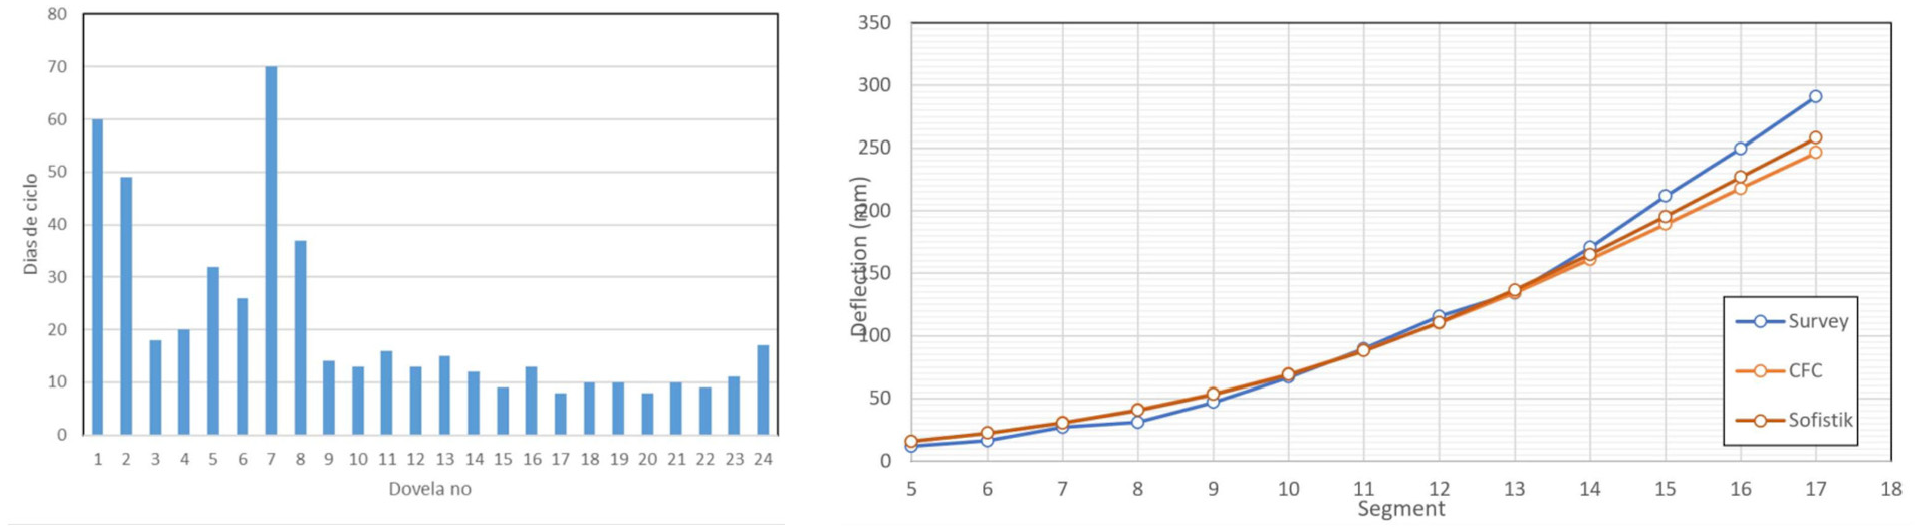
(left) Construction time for each segment and (right) deflections of the main cantilever after stressing Cable 12.
Since there were no tests to study the behavior of concrete at such early age (i.e., cantilever prestressing tendons was applied at 36 h as per the original requirements), it was considered prudent to increase the time before stressing the segment to 50 h to ensure that the Young’s modulus of concrete at the early stages was sufficient to keep the deflections of the cantilever under the predicted values.
Span Closure
Another important effect resulting from the asymmetry of the structure was that the cable stayed cantilevers had different length. The cantilevers built from the lateral towers, supported by nine cables, were approximately 90-m long, whereas the cantilevers supported by the central tower were approximately 140-m (459 ft) long.
This asymmetry in the cantilever geometry resulted in completely different stiffness values for the right and left cantilevers, which required the closure device to be able to resist the tendency of the larger cantilever to deflect further during the pouring of the closure segment. Probably one of the most spectacular moments of the construction was the pour of the last segment of the central cantilever, which resulted in a 600-mm differential deflection between cantilevers before the main Cables 17 and 18 were stressed, as shown in Figure 27.
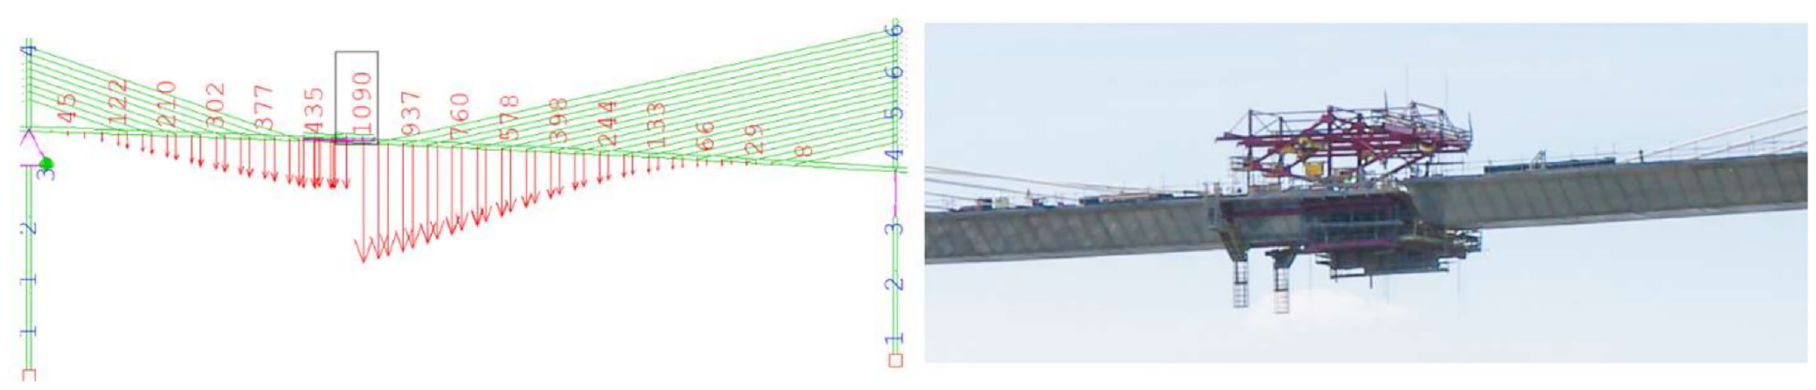
Deflections during the pour of the last cantilever on each segment: (left) values and (right) construction.
The closure device was also designed to be able to correct up to 250 mm (10 in.) of differential deflection between both cantilevers and to resist rotations and displacements during the hardening time of the closure segment. Figure 28 shows the closure segment before the lock-in of the cantilever and an aerial view of the site.
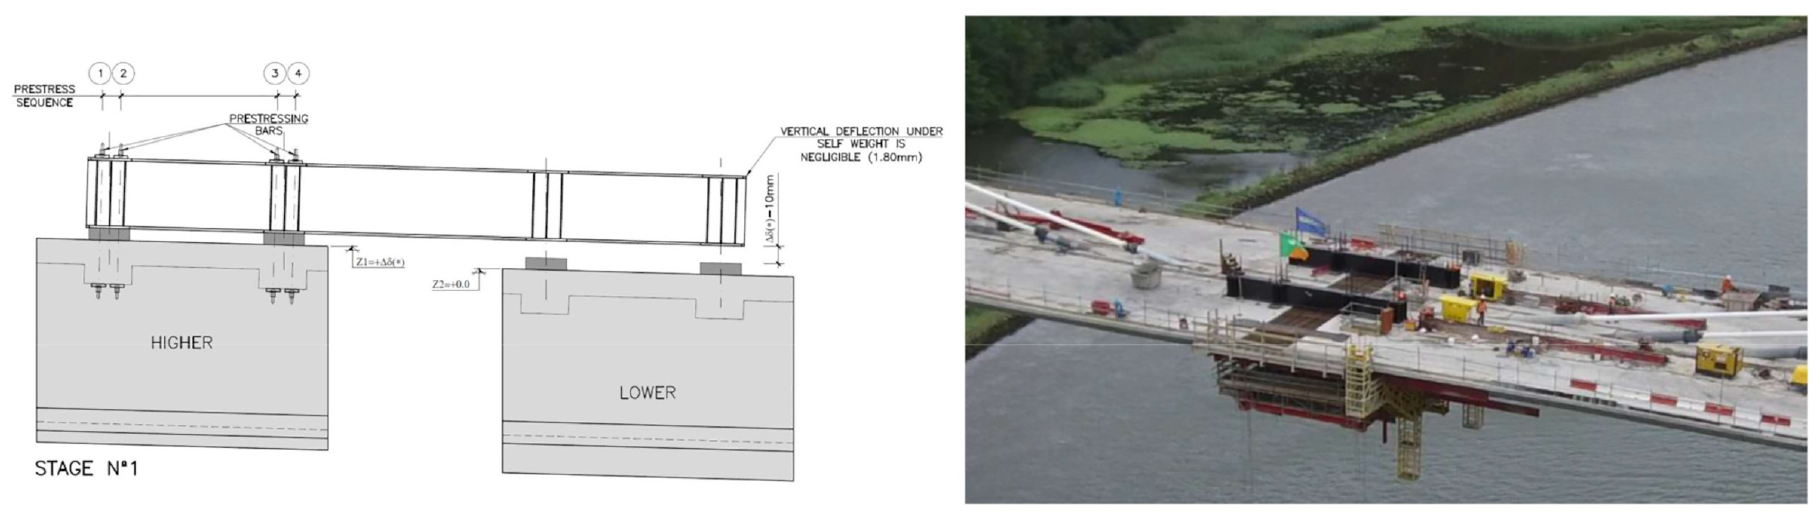
Midspan closure beam: (left) schematic concept (elevation) and (right) aerial view prior to casting the close segment.
Structural Health Monitoring
Finally, it is important to highlight that, as part of the contract requirements and as expected in a structure of this size and importance, a full set of sensors was installed in the bridge, which have been producing information for more than a year since the bridge was opened in early 2020. The sensors installed, in addition to environmental measurements (temperature at the four corners of the six superstructure sections, temperature at eight points of one superstructure section, temperature at 12 cables, temperature at the four faces of each tower, and wind speeds and direction at superstructure level close to the three towers and at the top of the central tower), allow measurement of the following structural parameters in real time:
- Bearing loads, displacements, and rotations at each bearing;
- Cable forces in two cables (shortest and longest, back span and fore span) for the two lateral towers, and three cables for the central tower; and
- Extensometers measuring deformations in the four corners of the box at three locations on each of the two main spans.
As an example, Figure 29 shows the cable force variation throughout a full year in the longest cable of the central tower (i.e., the west cable).
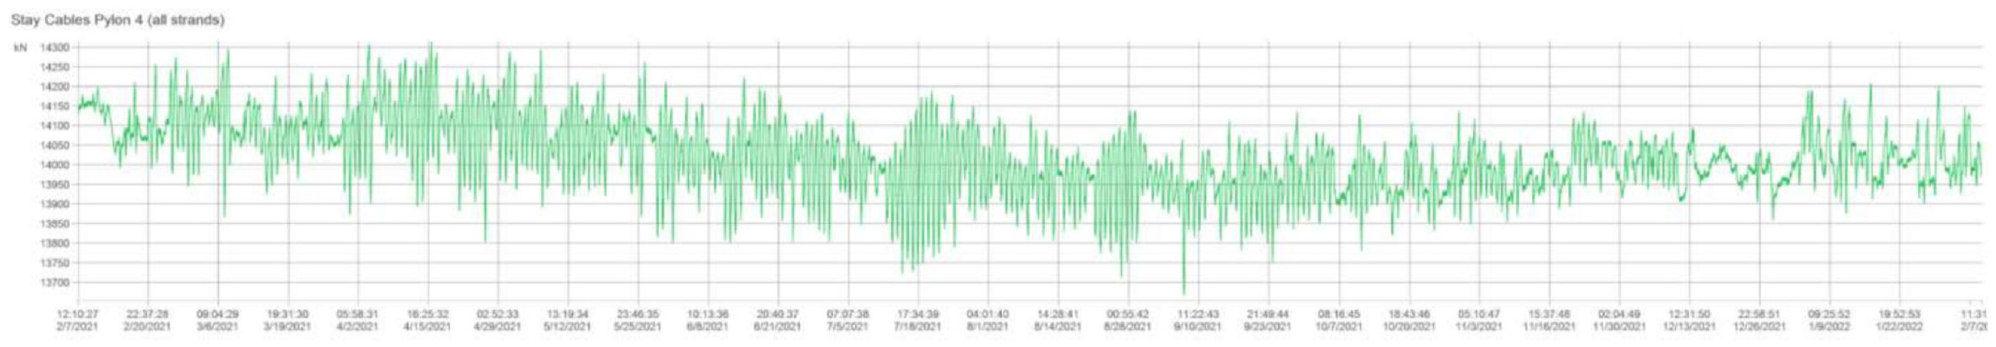
Structural Health Monitoring. Cable forces in C18 West (the longest) between February 2021 and February 2022.
It should be noted that the maximum and minimum values recorded were 14,300 and 13,700 kN (3,210 and 3,076 kip), which represent a range of 600 kN (135 kip), whereas the maximum and minimum cable forces expected in service (unfactored) were 17,438 and 12,494 kN (3,915 and 2,805 kip) with a range of 1,998 kN (449 kip), which clearly showed that the cables were working under values and ranges much smaller than expected.
On close inspection, it was clear that the predominant loads were environmental, with the bridge registering very little traffic load when compared with the thermal gradient (daily) and seasonal temperature changes on the structure.
Conclusions
The River Barrow crossing represents a state-of-the-art achievement in relation to extrados bridges with a concrete superstructure. At 230 m (755 ft), the two main spans are the longest of this type for a full concrete deck, breaking the previous record held by the Kwidzyn Bridge over the Wistula River in Poland (204 m/669 ft main span; Biliszczuk et al. [ 15 ]).
The bridge meets the very strict requirements for aesthetics with its very distinctive profile given by the three low towers of differing heights, an ascending profile, and a slender deck, blending in with the local surroundings (Figure 30).

Completed bridge.
Its design required undertaking significant challenges both during construction and as part of the contractual requirements to ensure the long-term durability and resilience of the structure, capable of facing even the most extreme scenarios envisaged.
Footnotes
Acknowledgements
From the original planning in 2004 until its completion and opening to traffic in early 2020, this project has required the collaboration of a significant number of specialists and consultants in addition to the personnel from Carlos Fernandez Casado SL and ARUP who were involved in the design. The authors acknowledge the contribution of Transport Infrastructure Ireland as the final authority, Mott McDonald as the firm responsible for the preliminary design and acting as the client’s representative during the detailed design stages, Yee Associate Architects for their involvement in development of the concept, Dragados Ireland & UK and BAM Ireland as contractors and Iridium and BAM Concessions as PPP Co.
Author Contributions
The authors confirm contribution to the paper as follows: draft manuscript preparation: M. Sanchez, M. Astiz. Contribution to the design: Lucia Blanco Martin, Guillermo Ayuso Calle, Cian Long. All authors reviewed the results and approved the final version of the manuscript.
Declaration of Conflicting Interests
The authors declared no potential conflicts of interest with respect to the research, authorship, and/or publication of this article.
Funding
The authors received no financial support for the research, authorship, and/or publication of this article.