
Abstract
The purpose of a routine bridge inspection is to assess the physical and functional condition of a bridge according to a regularly scheduled interval. The Federal Highway Administration (FHWA) requires these inspections to be conducted at least every 2 years. Inspectors use simple tools and visual inspection techniques to determine the conditions of both the elements of the bridge structure and the bridge overall. While in the field, the data is collected in the form of images and notes; after the field work is complete, inspectors need to generate a report based on these data to document their findings. The report generation process includes several tasks: (1) evaluating the condition rating of each bridge element according to FHWA Recording and Coding Guide for Structure Inventory and Appraisal of the Nation’s Bridges; and (2) updating and organizing the bridge inspection images for the report. Both of tasks are time-consuming. This study focuses on assisting with the latter task by developing an artificial intelligence (AI)-based method to rapidly organize bridge inspection images and generate a report. In this paper, an image organization schema based on the FHWA Recording and Coding Guide for the Structure Inventory and Appraisal of the Nation’s Bridges and the Manual for Bridge Element Inspection is described, and several convolutional neural network-based classifiers are trained with real inspection images collected in the field. Additionally, exchangeable image file (EXIF) information is automatically extracted to organize inspection images according to their time stamp. Finally, the Automated Bridge Image Reporting Tool (ABIRT) is described as a browser-based system built on the trained classifiers. Inspectors can directly upload images to this tool and rapidly obtain organized images and associated inspection report with the support of a computer which has an internet connection. The authors provide recommendations to inspectors for gathering future images to make the best use of this tool.
Keywords
The National Bridge Inventory (NBI) tracks more than 617,000 bridges in the U.S., and reports that 42% of these bridges were constructed more than 50 years ago, with an expected service life of 50 to 75 years as per the AASHTO LFRD Design Specifications ( 1 , 2 ). It would be reasonable to conclude that this aging infrastructure has entered the phase of becoming structurally deficient in the next 20 years. Furthermore, 12% of all bridges were constructed more than 80 years ago, exceeding their typical design lifespan. On average, bridges deemed structurally deficient are 69 years old (3). These facts show that closely monitoring this critical infrastructure is an important public safety issue, and, as time progresses, an ever-increasing number of bridges will need major rehabilitation or replacement. To evaluate the condition and manage further maintenance for bridge assets, the Federal Highway Administration (FHWA) requires a routine inspection at least every 24 months for public highway bridges exceeding 20 ft in their total span length ( 4 ). Applying innovative and efficient techniques for bridge inspection is critical to ensuring the safety of this aging infrastructure and the public that relies on it.
While different states in the U.S. may have varying inspection requirements, they all include the basic process of tracking defects through a written report and images. Many states require inspectors to take certain standard images during one inspection, such as bridge profile images, in addition to other images of any damaged elements ( 5 ). Post-inspection, these images are stored in bridge databases for reference. In a complete inspection process, bridge inspectors visually assess each bridge element in detail, noting any defects with a detailed description including, but not limited to, the type of defect, geometric information, and the general location. Additionally, the inspector takes photographs of these defects ( 5 ). Following the field observations, the inspector writes a report for each bridge inspected. The images taken are organized and then uploaded into the relevant database. A few key photos are typically included in the written report as evidence of the state of the bridge.
The inspector’s basic tasks can be categorized as: image organization, report generation, defect detection, defect analysis, and bridge condition evaluation. These tasks make the current inspection process time-consuming ( 6 ). Additionally, the inspection process is highly reliant on the inspectors’ subjective decision-making because current rating guides lack clear and quantitative condition definitions. Thus, an alternative workflow that teams inspectors with artificial intelligence (AI) is desirable to improve both efficiency and consistency in the bridge inspection process.
Researchers have explored the application of AI in different fields. At this point in its development, AI is not able to perform most tasks independently, and humans still need to participate in the decision-making process ( 7 , 8 ). In the medical field, doctors use AI to assist with interpreting medical images, and making diagnoses with the help of these results ( 9 ). Economists use AI-based models to predict financial and credit risks ( 10 , 11 ). In agriculture, researchers use automated image processing methods to categorize plants ( 12 ). AI- or machine-learning-supported applications are being successfully applied to reduce the need for repetitive tasks to be performed by humans and provide a certain level of consistency through replacing human subjective decisions with a computer.
In the civil engineering field specifically, researchers are developing machine-aided procedures to assist with human work. Gao and Mosalam applied a deep transfer learning technique for structural damage recognition ( 13 ). Yang et al. designed a robotic system to detect spalling and cracking in a concrete structure ( 14 ). Besides the image classification methods applied in these works, more advanced methods such as semantic segmentation are being applied in the civil engineering field. Chen et al. utilized deep high-resolution representation learning for automatic crack segmentation ( 15 ). Spencer et al. utilized semantic segmentation to assist in vision-based civil infrastructure inspection and monitoring ( 16 ). For post-event building reconnaissance, Yeum et al. used Alexnet to organize post-hazardous event building images rapidly and automatically for assisting structural engineering reconnaissance teams ( 17 , 18 ). Lenjani et al. created an AI-based method for fully automated post-hurricane data collection and information fusion ( 7 ). Liu et al. also developed a method of automating the localization of images collected from structures to support building reconnaissance rapidly within a large-scale area, and to support the classification of the damage state of a building based on the images ( 19 , 20 ). For applications in the bridge engineering field, Zhang et al. explored the use of convolutional neural networks (CNNs) to rapidly extract bridge substructure information for coupling with a typical database to perform an automated seismic vulnerability analysis of typical bridge networks in regions with low-to-medium seismicity such as the American Midwest ( 8 , 21 ). Drones and robots are also being used in collaboration with AI to aid civil engineering researchers or engineers in their work. Choi et al. developed an automated algorithm to localize close-up building façade images ( 22 ). This algorithm is able to provide support for the rapid visual inspection of a planar building façade using drone images. Perry et al. created a deep-CNN-based automated road inspection scheme using unmanned aerial vehicles ( 23 ). Ground-based robots are also being used to detect concrete cracks as well to build an automatic inspection system for tunnels ( 24 ). Besides visual data processing, AI methods are also applied to analyze data obtained from bridges during non-destructive testing evaluation ( 25 ). These research advances aim to assist civil engineers with everyday tasks, thereby increasing their work efficiency and allowing them to focus on analyzing data rather than collecting and processing it.
Bridge inspection is an important civil engineering responsibility that may benefit from the assistance of AI. In this paper, the focus is on aiding the human inspector to perform image organization. CNN-based classifiers are trained for this domain-specific task, and then utilized to efficiently organize bridge inspection images ( 26 ). A schema with pre-defined image categories is designed for training the classifiers based on the understanding of the requirements and definitions set forth in the inspection manuals and discussions with bridge inspectors. A two-level classification workflow is designed and validated. Existing bridge databases maintained by state Departments of Transportation (DOTs) contain many inspection images, which the authors of this work leveraged in validating the proposed AI-based method. All of the images in this work were captured during real-world inspections, reflecting practical bridge image organization tasks performed by a human inspector. For the convenience of potential users, the trained classifiers are embedded in a web-based online tool—the Automated Bridge Image Report Tool (ABIRT)—through which users can upload images from any location with cloud access. The tool automatically categorizes the bridge inspection image sets and generates an inspection report. Exchangeable image file (EXIF) metadata of the images is extracted to sort the inspection images by date, so that engineers can readily study the deterioration of a bridge over time.
In the remaining sections of this paper, the process for machine-supported bridge inspection image documentation using AI is presented. First, the routine bridge inspection work is described, followed by the topic of CNNs, and the classification schema developed in this paper. Next, using the workflow developed in the previous section, a ground-truth dataset containing more than 11,000 bridge inspection images is assembled and labeled for training and then validation. In the Report Generation section, an online tool embedded with trained CNN classifiers is described and a sample report with organized inspection images is created. The final section reflects on the key takeaways, problems being solved, and possible future contributions on this topic.
Technical Approach
As described in the previous section, approximately 42% of all bridges in the U.S. were constructed more than 50 years ago, including many bridges that are over 80 years old ( 3 ). Bridges suffer from deterioration while in service from a wide range of causes ( 2 ). Thus, inspecting a bridge during its in-service stage and ensuring the good condition of a bridge are critical to its lifecycle performance. In the current National Bridge Inspection Standards (NBIS) manual, bridge inspectors are required to evaluate each bridge and its elemental conditions at least every 2 years (4). While different states have their own additional requirements for bridge inspection work, generally inspectors complete the following tasks for each bridge:
▪
▪
▪
▪
Inspectors with varying levels of experience may require different amounts of time to complete these tasks. The authors of this work interviewed some inspectors in Indiana state. These inspectors said that they typically spend 45 to 90 min in the field, but large multi-span bridges may require additional time. After the field inspection is completed, the inspectors take an additional 60 to 90 min to complete the bridge condition evaluation, image documentation, and report generation tasks. In this work, our focus is placed on the image documentation and the report generation tasks and developing a tool for inspectors to use.
The automatic classification of inspection images into separate categories has several potential advantages. Foremost, it can save inspectors time in current and future inspections. Instead of the simple and tedious work of labeling and categorizing images, they can focus on tasks that require more skills and expertise. The automation of this activity may also enable them to capture more images in the field. Collecting more images during inspections would not add any additional processing time once they return to the office. This approach can lead to more comprehensive image databases for inspectors and researchers alike to study. Furthermore, automatic image classification can readily be applied to all past bridge inspection images available in the database. This opportunity would organize existing data and allow inspectors to easily compare categories of a given bridge from the past to the present. For instance, they could view the progression of corrosion across several inspection cycles and use this trajectory to project the condition 2 years into the future, enabling better asset management. This computer-vision and perception task is a problem best approached using a deep-learning algorithm.
An Overview of Convolutional Neural Networks (CNNs)
CNN algorithms can provide a foundation for developing an automated capability to classify the visual contents of images ( 17 ). This feature makes CNNs a suitable baseline technology to build an automated image documentation tool. CNNs involve one or more convolutional layers to extract an image’s features, which can then be utilized to classify the images. Typically, there are a tremendous number of numerical weights in a CNN which directly influence the results of a classification problem. Thus, to obtain a CNN with good classification performance, there is a need to update these weights by training the network. This training process requires many images with ground-truth labels, so that classification results will be validated through a comparison with the ground-truth. The difference between classification results and ground-truth is defined as loss, which is used as an index to update the weights toward lower loss. The image set used during the training process is referred to as the training set. The trained classifier is then used to classify another set of images, called the validation set, used to compare the classification results with the ground-truth labels. Classification scores, such as accuracy, can then be calculated to evaluate the performance of this trained classifier. Usually, the training and validation sets are randomly split from one dataset, and the images in the validation set should be mututally exclusive. A clear definition for each category in the training set should be chosen to maximize the differences between the images in each category.
As CNNs have evolved, their structures have become more complex. At their inception, the structure of CNNs was simple and shallow. For example, a classic structure, VGG 16, only contains 16 convolutional layers ( 31 ). By introducing more complex structures such as bottleneck, more complex and deeper neural networks were created, for example, ResNet ( 32 ). These more complex structures involve more weights and, in turn, may provide better model performance after training.
Design of the Classification Schema
To design a practical schema and useful classification categories, a study of the requirements from manuals and the practical needs of the inspectors was carried out. As discussed in the previous section, there are two manuals defining the bridge elements that inspectors need to evaluate the condition of a bridge. The design of classification categories should first take the range of bridge elements into consideration. These bridge elements are listed in Table 1.
Bridge Element Categories Defined in Manuals
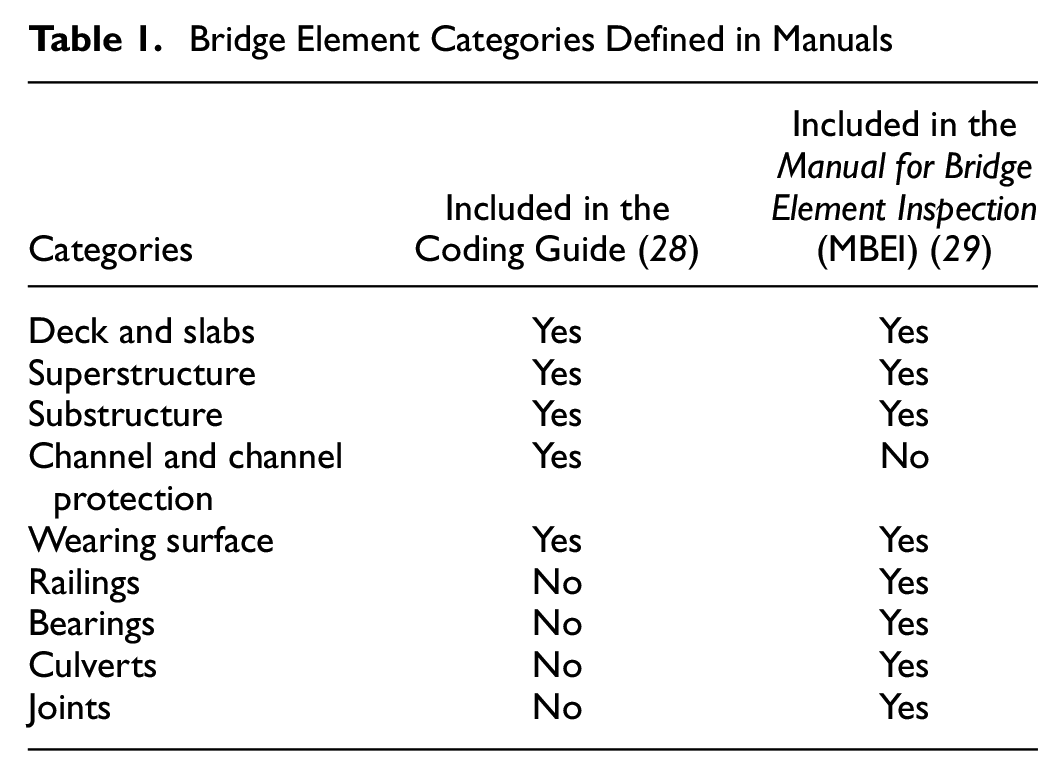
From Table 1, it is clear that the MBEI defines a more detailed set of bridge elements. Inspectors following the MBEI need to inspect bridge elements which are not defined in the Coding Guide, for example, joints ( 28 ). In the Coding Guide, the condition of these more detailed bridge elements is considered to be part of larger elements. For example, the joints are considered a part of the deck, and the bearings are considered a part of the substructure. Thus, the MBEI categories are chosen as the basis for designing the classification schema, as a more detailed classification schema will be more flexible for inspectors to follow.
To capture bridge condition information as much as possible, inspectors may take images of one bridge element from several perspectives or angles. Thus, hierarchical, perspective-based categories are defined to distinguish between these images of the same bridge element. For instance, a bridge substructure element can be further categorized as a pier or an abutment. Bridge element level categories are considered in the level 1 classification, and perspective-level categories are considered in level 2 sub-classification. Clear definitions are needed for successfully classifying the images into the selected categories. These definitions are essential, as they serve to provide guidance to human annotators who seek to establish meaningful and consistent ground-truth data that are suitable for network training ( 17 ). The category definitions chosen for this work are outlined below. The level 1 categories are bulleted, and the level 2 categories are the sub-bullets of level 1 categories. Image examples of these categories are shown in Figure 1.
▪ Bridge overview (OV): An image showing an overall bridge profile. Through these images, people can see almost every bridge element. (See examples in Figure 1a.)
▪ Deck: An image showing the bridge deck and its wearing surface. Sometimes the images may include both the deck and railings. Images are classified as “deck” if the deck takes up the center of the image and “railings” (defined later) if the railings take up the center of the image. These are the level 2 categories defined for the deck category: • Deck OV: This level 2 subcategory is defined as a deck image showing an overall view of the deck. Through these images, people can realize the deck’s overall condition. (See examples in the top row of Figure 1b.) • Deck part: This level 2 subcategory is defined as a deck image showing a smaller part of the deck. Inspectors cannot realize the overall contition of the deck through images in this category, but they can get more detailed information. A typical example is an image showing a small section of the deck with cracking present. (See examples in the second row of Figure 1b.) • Joint: This level 2 subcategory is defined as a deck image showing bridge joints. To distinguish from the deck part subcategory, only images showing joints in the center of the image are categorized in the joint subcategory. Otherwise, the images are categoriezed in the deck part subcategory. (See examples in the third row of Figure 1b.)
▪ Superstructure: An image showing a bridge superstructure element, the deck from the underside position of the bridge, or both. There is frequent overlap between the superstructure and the substructure. To clearly define the superstructure category in this work, when around 75% or more of an image’s content shows the superstructure, then the images will be categorized in the superstructure category. Otherwise, they are considered as substructure images. These are the level 2 subcategories defined for superstructure: • Superstructure OV: This level 2 subcategory is defined as a superstructure image showing an overall view of the superstructure. Through these images, inspectors can see the overall condition of the superstructure but may not see more detailed information. (See examples in the first row of Figure 1c.) • Superstructure part: This level 2 subcategory is defined for a superstructure image showing a small area of the superstructure. It is difficult for inspectors to gauge the overall condition of the superstructure through images in this category. Most of the superstructure area has been excluded in these images. (See examples in the second row of Figure 1c.)
▪ Substructure: An image showing a bridge substructure element. There is frequently overlap between the superstructure and the substructure. To clearly define the substructure category, in this work, when around 75% or more of an image’s content shows the substructure, these images will be categorized in the substructure category. These are the level 2 subcategories defined for substructure images: • Bearings: This level 2 subcategory is defined as a substructure image showing the bearnings in detail. These images show a close-up view of one or two bearings where the bearing(s) is(are) clearly visible and the focus of the image. This may include front views or side views. (See examples in the first row of Figure 1d.) • Pier OV: This level 2 subcategory is for high-level images showing all or most of a pier structure. This may include rectangular wall piers, flared piers, and capped column piers. These images illustrate the overall condition of a pier to the inspector. If an image shows most of a pier but is at a low angle capturing the side of the pier, it is not included in this category. (See examples in the second row of Figure 1d.) • Pier part: This level 2 subcategory is for images showing a more detailed view of a pier, where only a small portion of the pier is visible. This may include a single column or a close view of a defect such as spalling. This category also includes images where the side of the pier is the focus of the image. Inspectors can use these images to better understand smaller defects and how they fit into a pier overall. (See examples in the third row of Figure 1d.) • Abutment OV: This level 2 subcategory is for high-level images that show all or most of an abutment structure. This may include end-bents, slopes, and mechanically stabilized earth walls. The image captures all or most of an abutment structure for one end of the bridge. The inspector would be able to gauge the overall condition of an abutment from these images. (See examples in the fourth row of Figure 1d.) • Abutment part: This level 2 subcategory is for images showing a more detailed view of an abutment, where only a small portion of the abutment is visible. This category typically includes bearings, but they are not the focus of the image or there are more than two bearings visible. Inspectors would use these images to illustrate more detailed damage on the bridge that is not evident from images in the OV category. (See examples in the fifth row of Figure 1d.)
▪ Railing: This category is defined as an image showing a bridge railing. As demonstrated in the deck category definition, sometimes railing images contain bridge deck elements. However, images in the railing category only contain images showing railings in the center. (See examples in Figure 1e.)
▪ Detail: This category is defined as an image showing a very small part of a bridge element. It is difficult for a human to recognize which element this image shows without additional context. (See examples in Figure 1e f .)
▪ Other: During a bridge routine inspection, inspectors may take images upstream or downstream of the river beneath the bridge. Additionally, some inspectors take images of road signs to help them record the bridge’s location. These types of images are categorized into the “other” category because they are not relevant to the condition of the bridge itself but may still provide the inspector with useful information. (See examples in Figure 1g.)
This schema is designed using the definitions in both bridge manuals (MBEI and Coding Guide) and with practical input from conversations with inspectors. Several elements defined in the manuals are not included because of their lack of relevance to bridge inspection, for example, culverts and channels. Modifications can be made to the categories, as it should consider the needs of the application. For instance, higher numerical accuracy can be achieved by combing the “part” and “OV” subcategories of a given element. However, for purposes of inspection it is likely more useful to have more categorical resolution. This possibility will be discussed further in the Experimental Validation section of the paper.

Image examples from Indiana for Designed Documentation Categories ( 30 ): (a) bridge overview (OV), (b) deck, (c) superstructure, (d) substructure, (e) railings, (f) detail, and (g) other.
Design of CNN-based Classifier Workflow
According to the categories defined in the Design of Classification Schema section, there are two levels of classification, which are designated as classifier 1 and classifier 2. The first classifier takes in the entire dataset and sorts them into one of the seven level 1 categories: bridge OV, deck, superstructure, substructure, railings, detail, and other. After the initial classification, the deck, superstructure, and substructure categories are split up further into level 2 categories using the level 2 classifier. The complete workflow is shown in Figure 2.
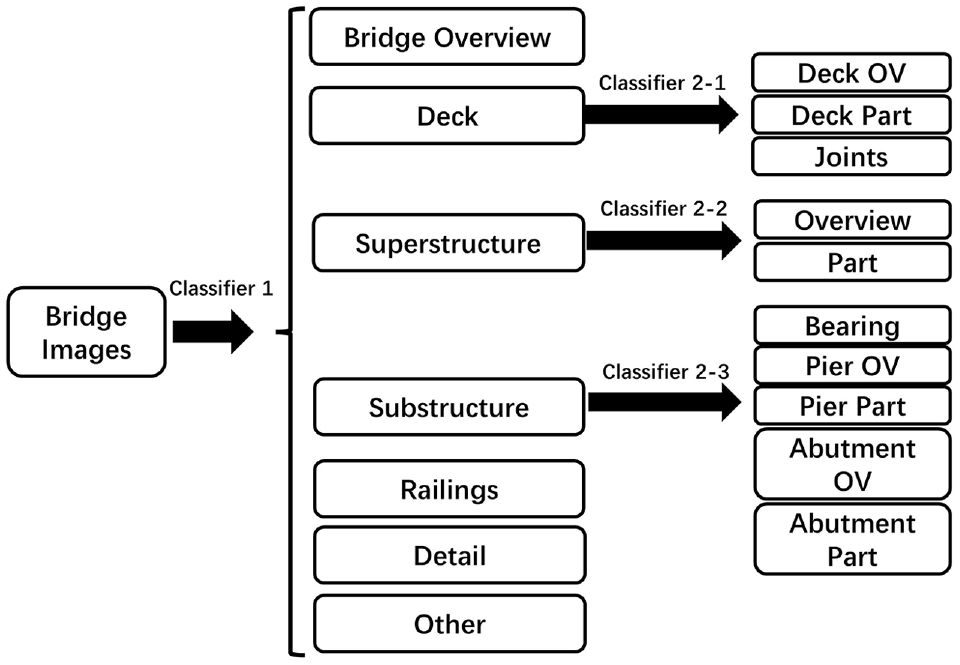
Convolutional neural network (CNN)-based classification workflow designed for data organization.
Experimental Validation
In this section, a complex ground-truth dataset containing real-world bridge inspection images is built to validate the CNN-based classifiers and the overall automated image organization method.
Description of the Ground-Truth Dataset
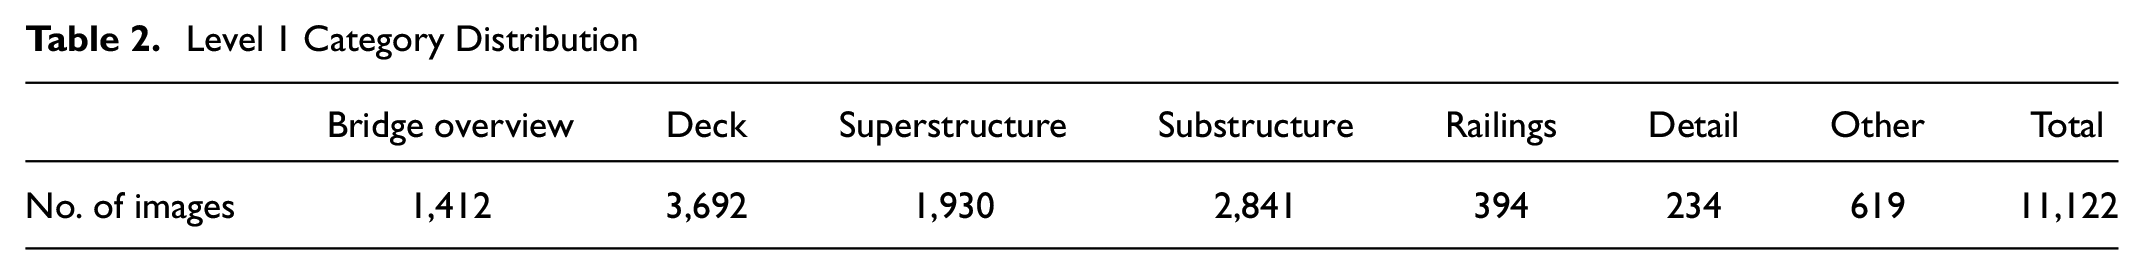
A real-world bridge inspection image dataset containing approximately 11,000 bridge images is established for the training and validation of the method. These images are from more than 100 bridges and were taken by inspectors during routine bridge inspections. Only bridges with concrete or steel beams and concrete decks are chosen for this application, as this represents the majority of bridges in the U.S. Other, less common, bridge types, for example, bridges with steel decks or truss bridges, are not included in the dataset. If needed in the future and with enough image data for training, extra categories can be designed for these less common bridges in the classification schema. To prevent bias caused by regional construction differences, about 2,000 images in the dataset are from Texas (provided by Texas inspectors) and the remaining 9,000 are from Indiana ( 30 ). The image capture dates also range from the year 2000 to the year 2020 to eliminate potential bias of images taken in a single year. To establish the ground-truth dataset and training classifiers, the authors first manually labeled all of the images in the dataset into the level 1 categories discussed in the Technical Approach section. Table 2 shows the level 1 category distribution included in the dataset.
Level 1 Category Distribution
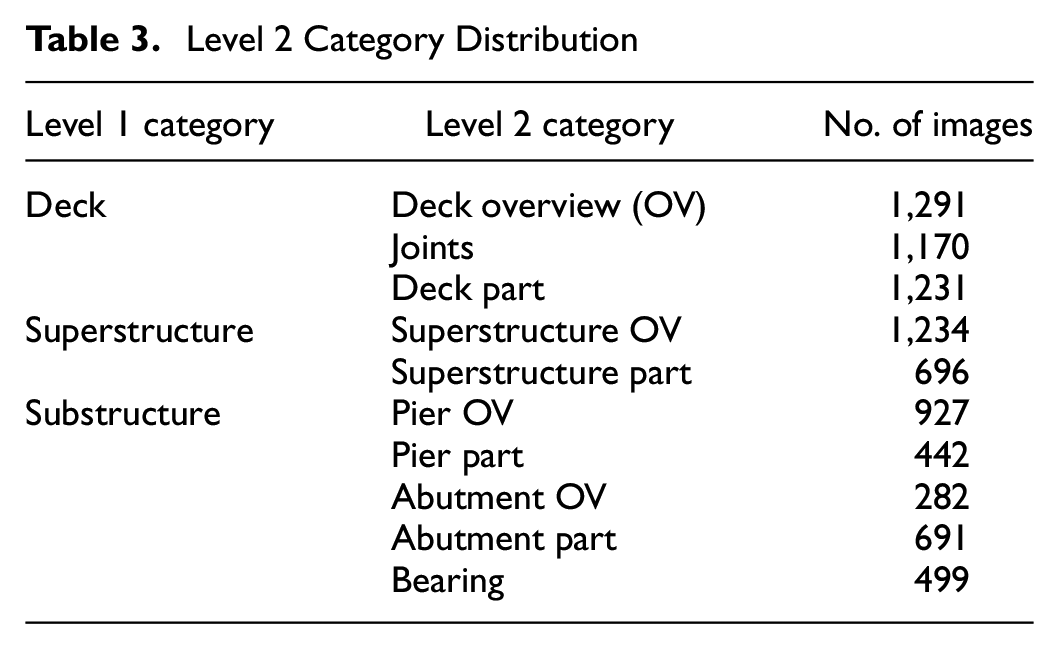
According to the classification schema, the images in the deck, superstructure, and substructure categories are further labeled according to the definitions for the level 2 categories. The level 2 category distribution information has been shown in Table 3.
Level 2 Category Distribution
Typically, researchers find that using low-resolution images will not influence the feature extraction process using CNNs ( 26 ). Additionally, smaller images are processed faster, and reducing the image resolution reduces the time needed to train the networks. Past researchers have studied the impact of resizing images on classification performance and concluded that resizing the images within a proper range will not strongly influence classification accuracy ( 33 ). Therefore, all of the red-green-blue (RGB) images utilized for training in this work are resized to be 512 (height) × 512 (width) × 3 (color channels) pixels.
Configuration of Convolutional Neural Network (CNN)
The authors make use of an existing CNN structure, ResNet50, as the basic network structure. The choice of ResNet50 for this demonstration is somewhat arbitrary and used to demonstrate the method. Other models may be explored in the future and may yield slightly different results. To conduct the classification work, a SoftMax layer is added as the output layer of the CNN model. The SoftMax layer generalizes logistic functions into multiple dimensions, which can be used to normalize the output of a network to a probability distribution over a predicted output category. The dimensions of probability output from the Softmax layer are equal to the number of categories set for that classifier. In this work, the number of dimensions set for level 1 classifier, level 2 classifier for deck, level 2 classifier for superstructure, and level 2 classifier for substructure are seven, three, two, and five, respectively. As explained in the previous section, all of the images are resized into 512 × 512 × 3 pixels, and thus the input size of the CNN model is set as (512, 512, 3). The dataset is then split into training and validation sets using ratio of 4:1. It follows that the level 1 classification work uses around 9,000 images for training, and it uses the remainder for model validation. To eliminate potential bias caused by splitting the dataset, five random splits are created for training five different models. Since the number of each category is not balanced, class weights were added to eliminate such imbalance. Data augmentation by rotating, shifting, zooming, and flipping the images in the current training set to make more images has been used during the training process to improve the robustness ( 34 ). The initial weights in ResNet50 are the pretrained weights, but then all of these weights will be updated during the training process. The learning rate for each classifier is set to 10-6. The loss function used for training is cross entropy. A computer equipped with an NVIDIA Titan X GPU was used for training and testing the model. Accuracy, precision, and recall are calculated to present the performance of the trained classifiers.
Classification Results
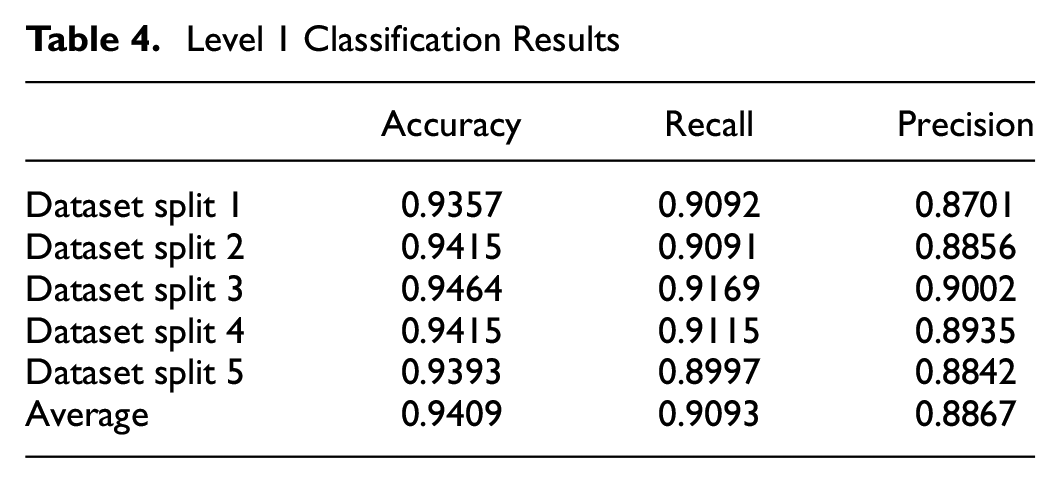
As demonstrated in the previous section, for each classification there are five different training and validation splits and, thus, there are five different training results. One of the training processes is shown in Figure 3, a and b . Figure 3a exhibits the convergence of loss during the training process while Figure 3b exhibits the change of accuracy during the training process. By using the hardware introduced in the last section, the overall training time for level 1 classifier (around 9,000 images are used in the level 1 classifier training process) is around 6–8 h and, after the trained model is obtained, it takes less than 1 s to label each image. The results for the five different training processes of level 1 classification have been summarized in Table 4.
Level 1 Classification Results
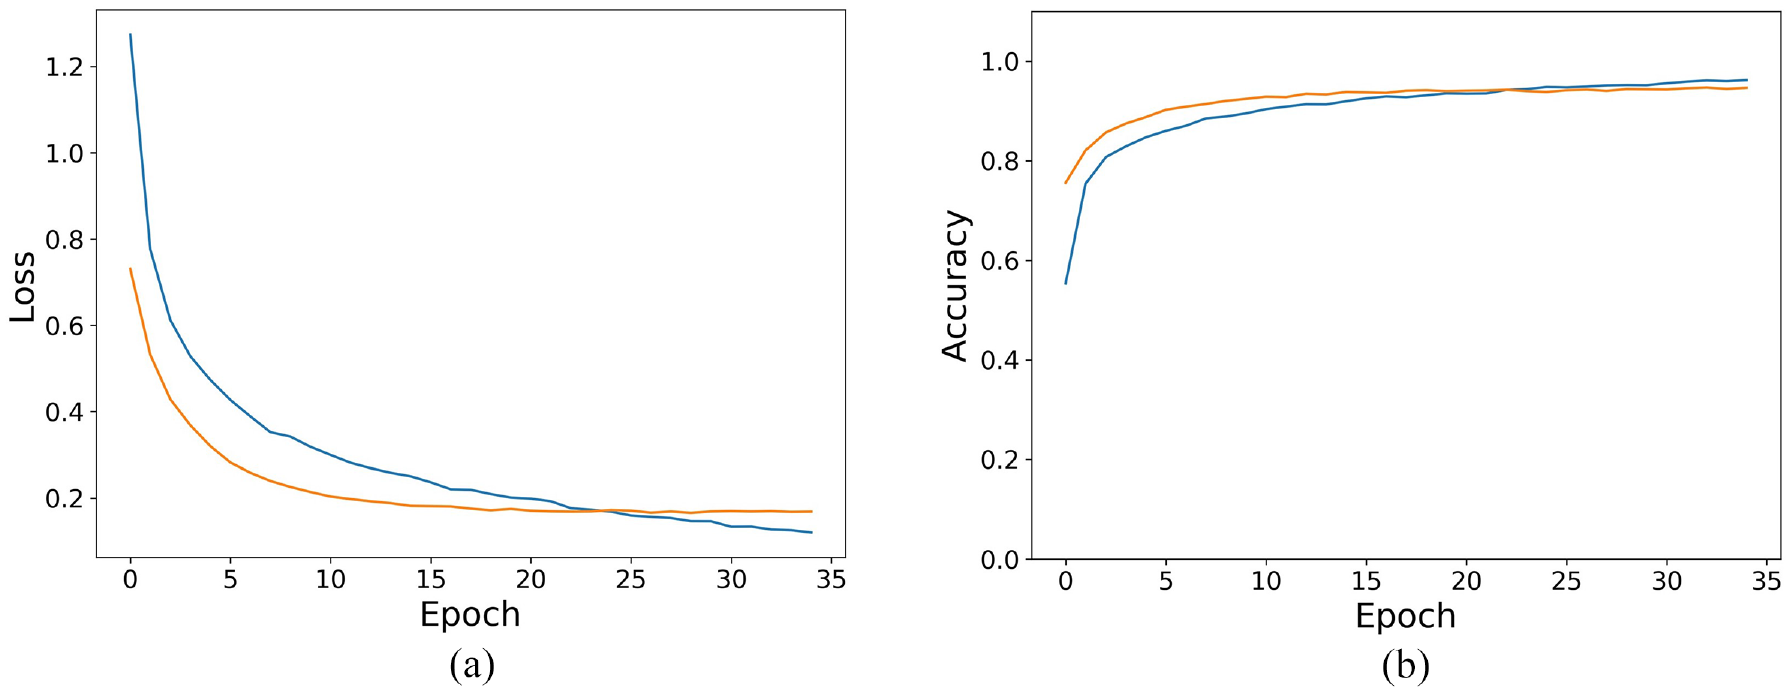
Representative results of the training process from level 1 organization: (a) loss, and (b) accuracy.Blue line is the training result and Orange line is the validation result.
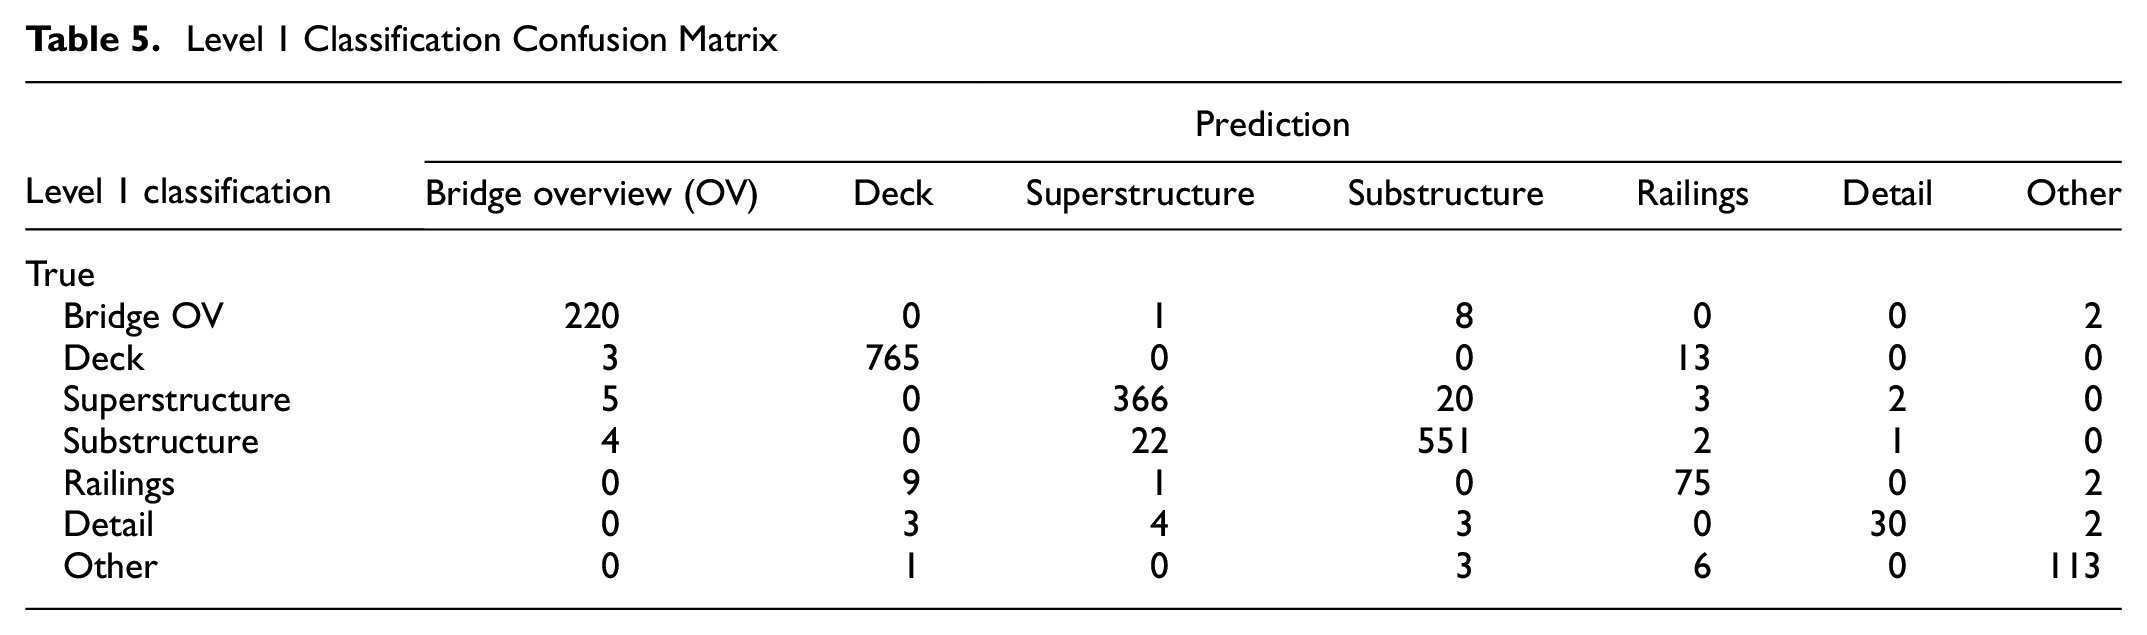
According to the results shown in Table 4, the average accuracy that level 1 classification achieves is around 94.1% and the variability is neglible between data sets. Further, the recall of each classifier is above 90% and the precision of each classifier is above 88%. A representative confusion matrix for the level 1 classification is shown in Table 5.
Level 1 Classification Confusion Matrix
Level 2 classifiers are also trained and validated under five different dataset splits. The same process is carried out for level 2 classifications to evaluate the performance of the level 2 classifier. The accuracy of the level 2 deck, superstructure, and substructure classifiers ranges from 89.0% to 93.1%, 94.8% to 96.9%, and 84.2% to 87.7%, respectively. The recall of level 2 deck classifier, superstructure classifier, and substructure classifier ranges from 90.2% to 93.6%, 93.1% to 96.6%, and 82.1% to 86.5%, respectively. The precision of level 2 deck classifier, superstructure classifier, and substructure classifier ranges from 89.1% to 93.1%, 92.6% to 96.6%, and 82.0% to 86.3%, respectively.
The substructure classification has the poorest results, with an average accuracy of 85.6% and an average precision of 83.8%. This error occurs primarily in delineating the part images from the OV images, for both the abutments and the piers. For example, the model is accurate when deciding whether an image is a pier; however, it is less accurate when deciding if the image belongs to the pier part or pier OV categories. To illustrate this point, an alternative classifier is trained for the substructure level 2 categories. For this classifier the part and OV perspectives are combined, leaving three categories: bearing, pier, and abutment images. The accuracy for this alternative classifier ranges from 92.1% to 94.1%, with an average of 93.3%. These results are improved over the previous version with five categories; however, there exists a tradeoff between numerical performance and utility. As inspectors do not follow particular guidelines when taking photographs, the differences between the part and OV categories can be ambiguous, even to a human organizing the images. More importantly, errors between the two categories do not affect the ability to interpret the results. Therefore, 86% accuracy is deemed acceptable and preferrable to the case with 93% accuracy, because of the low-consequence nature of the errors and the usefulness of the further-classified results.
Report Generation
As introduced in the Technical Approach section, one of the main tasks that bridge inspectors perform is generating the bridge inspection report. Thus, in this section, the authors describe the design and development of the web-based ABIRT, to assist inspectors in generating a general inspection report. The classifiers developed in the Experimental Validation section are embedded into this tool to automatically classify the pictures in the report.
Design of the Bridge Inspection Report Generated
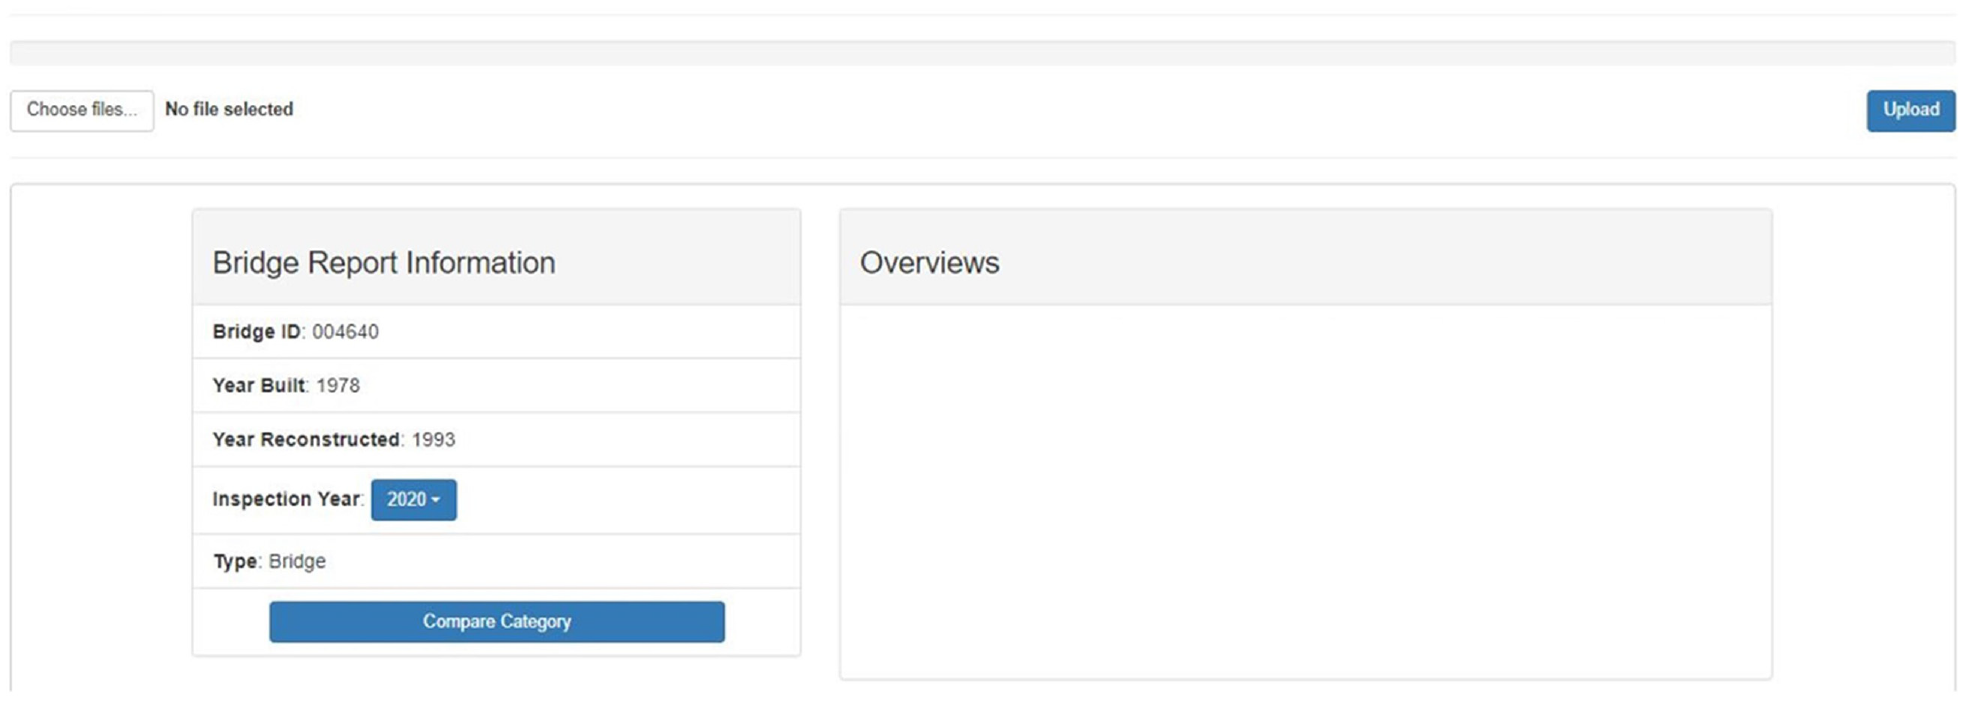
The items contained in a bridge inspection report can separated into “invariant” information that is always the same for a given bridge and “variant” information that changes with each inspection. Reports created using ABIRT will also include these two types of information. The invariant information is entered once, and the tool stores this information for a given bridge. Then, each time an inspection is performed, inspectors may upload inspection images into the tool, and the tool automatically labels and organizes them using the CNN-based classifiers described earlier. Later, the inspectors can use these images to write bridge condition comments and evaluate the bridge’s condition rating. For each bridge, all the relevant images are stored in the system, and ABIRT automatically generates different reports of the same bridge based on the bridge inspection years. Users can access these reports on the same webpage by switching the Inspection Year in the Bridge Report Information section (shown in Figure 4) for easy reference.
The main/home page of the Automated Bridge Image Reporting Tool (ABIRT).
Another capability built into ABIRT is the ability to track the history of a bridge element over time based on inspection images collected. According to our discussions with bridge inspectors, the ability to track bridge defects is vital, and can be used to determine future inspection periods and maintenance actions. However, bridge inspectors currently need to spend significant time finding previous reports and images if they wish to view them and compare with the current state of the bridge. ABIRT is designed to extract the EXIF data of bridges and automatically store the images according to their inspection date. Further, we included a function where inspectors can select a single level 1 image category and compare the images in this category between inspections across different past years. For instance, one can select the deck category and see the propagation of deck cracking over time, in side-by-side images. The location information in the EXIF data is also extracted from the images to show the bridge location on a map such as Google Maps. Thus, ABIRT is able to generate a detailed and organized image-based report with the aid of our trained CNNs in dozens of seconds. The introduction of the tool and a sample report are demonstrated in the following Sample Report section.
Sample Report
In this section, the authors share how this research comes together to realize the ABIRT interface. Figure 4 shows the primary page of the tool where a user enters the bridge information, and then can upload each set of bridge inspection images. Figure 5 shows the interface for uploading the images. In this step, a user can review and choose the images to upload. Figure 6 shows the sample report after uploading the inspection images. These images are then automatically organized. The location of the inspection is also shown on the embedded Google map (the red pin on the map). Figure 7 shows the details of some classified and organized images. Both level 1 and level 2 labels are assigned to these images, as applicable. Figure 8 shows the comparison of the bridge’s deck category images over time, so that the inspectors can compare the condition of the deck in different inspection years side-by-side. Other categories can be selected for comparison as well.
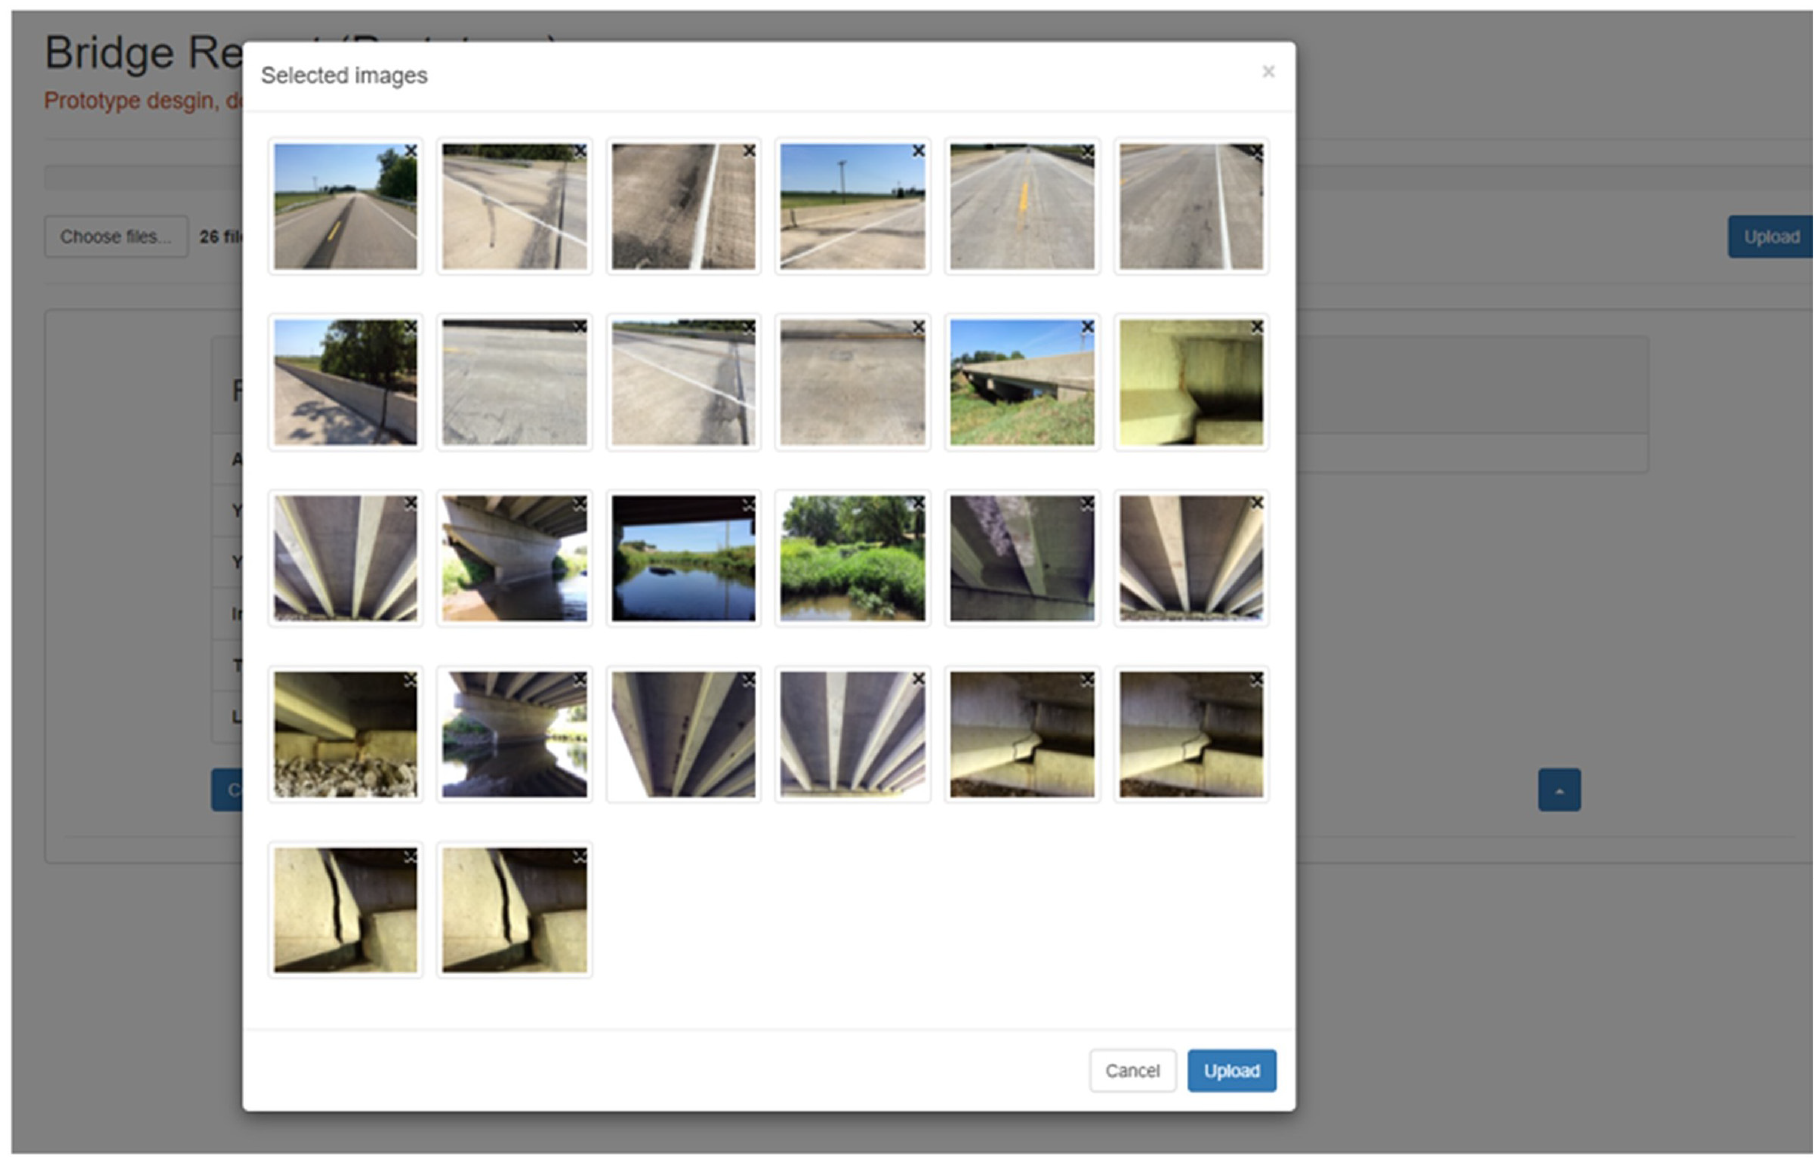
Selecting bridge inspection images to upload to the report generation tool.
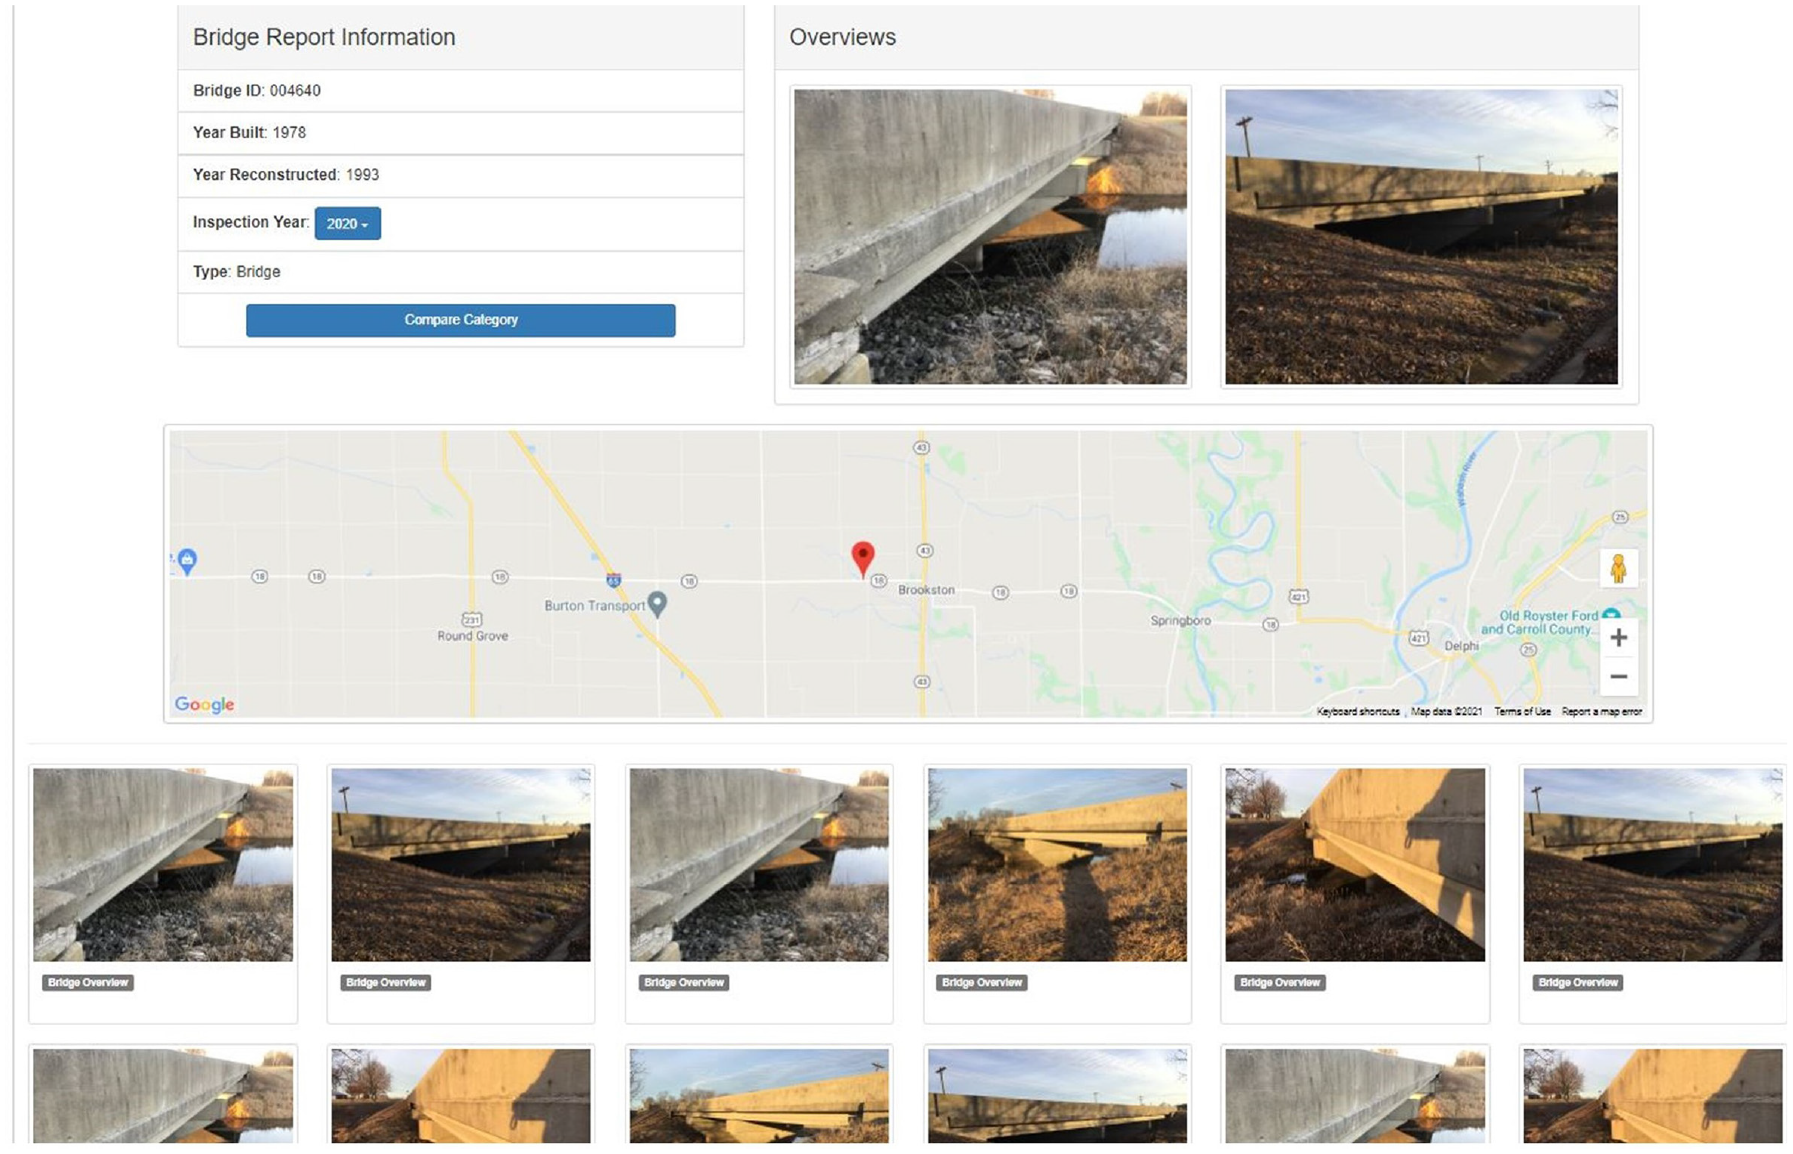
Sample report with organized images of bridge with ID 004640 in Indiana ( 30 ).
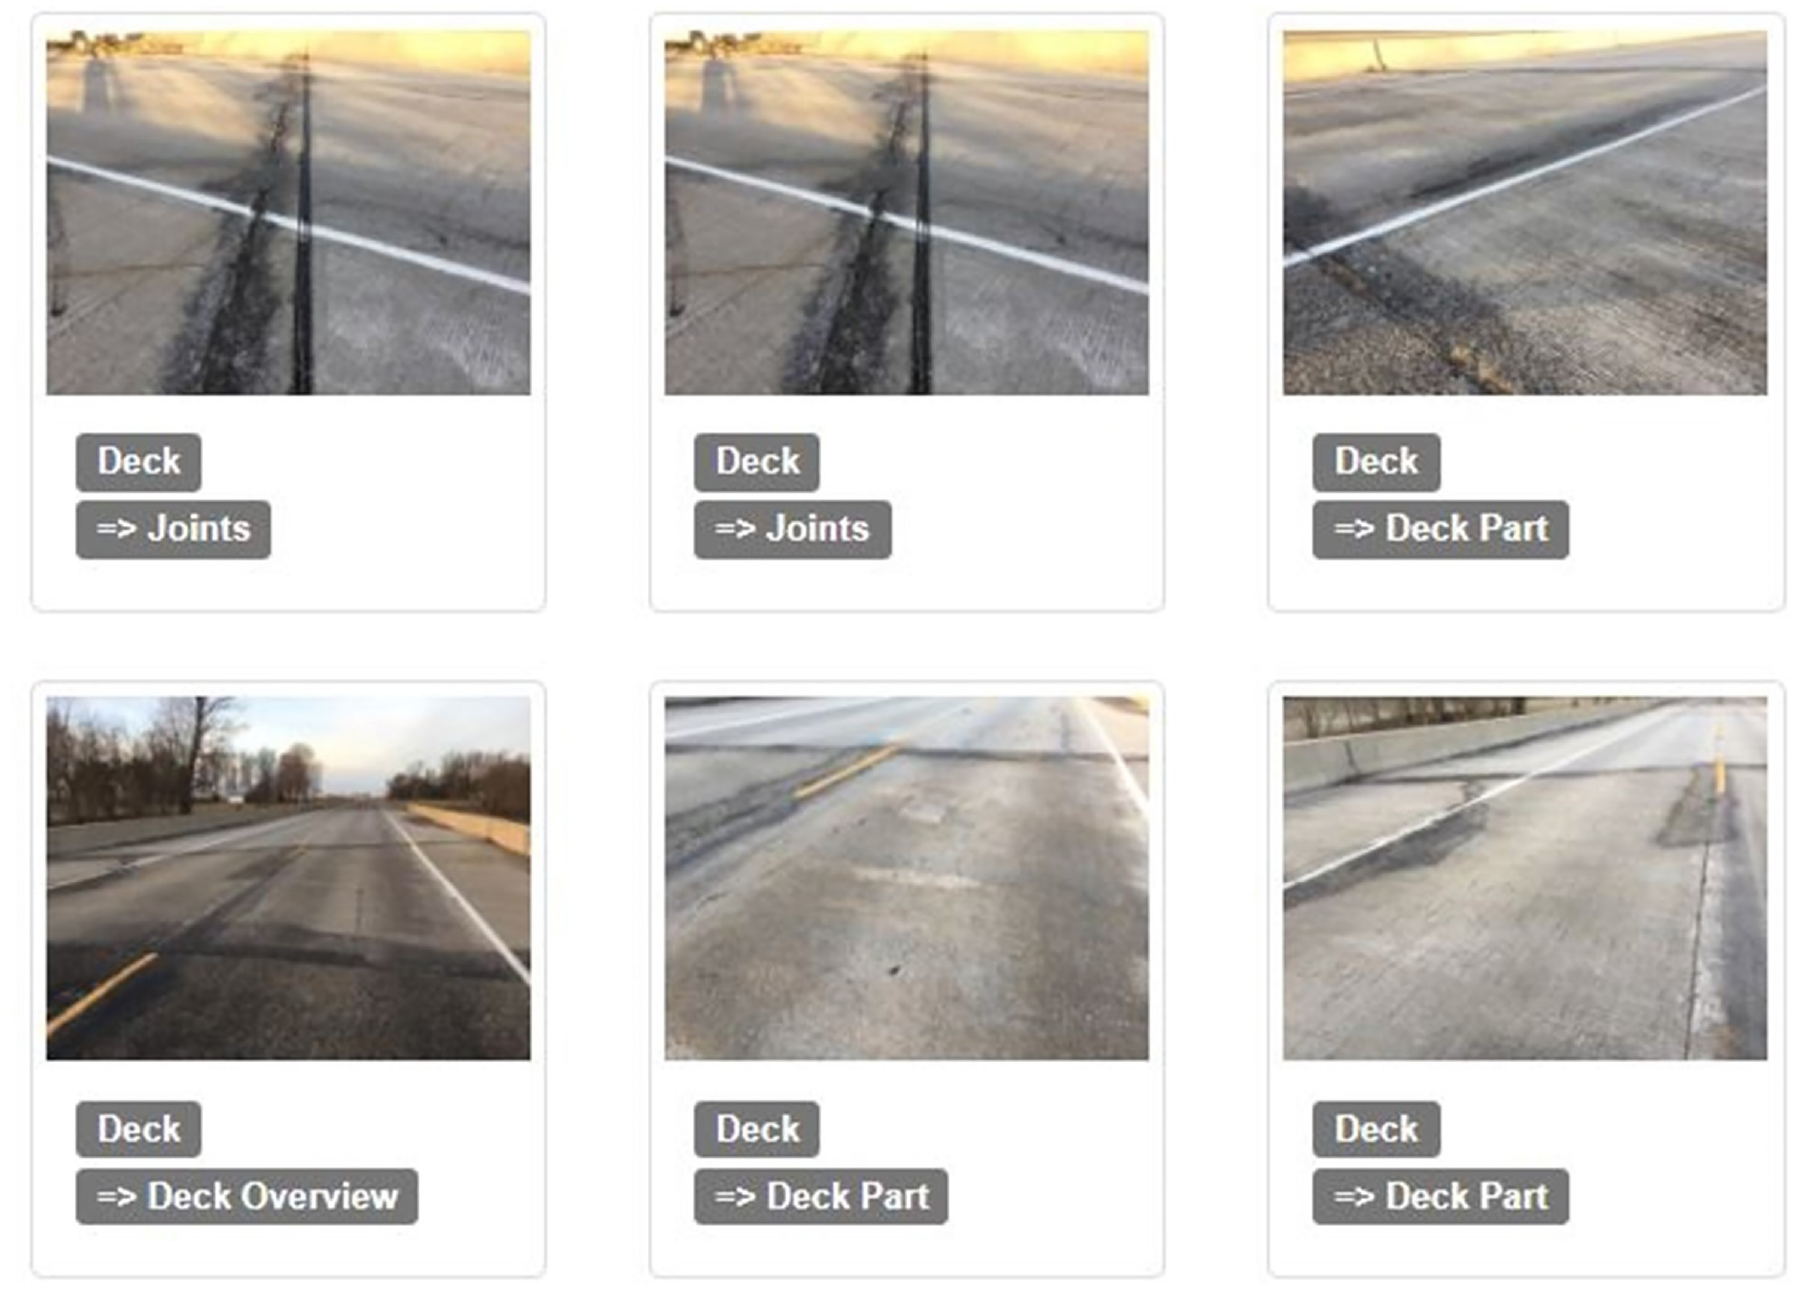
Image documentation details after one inspection.
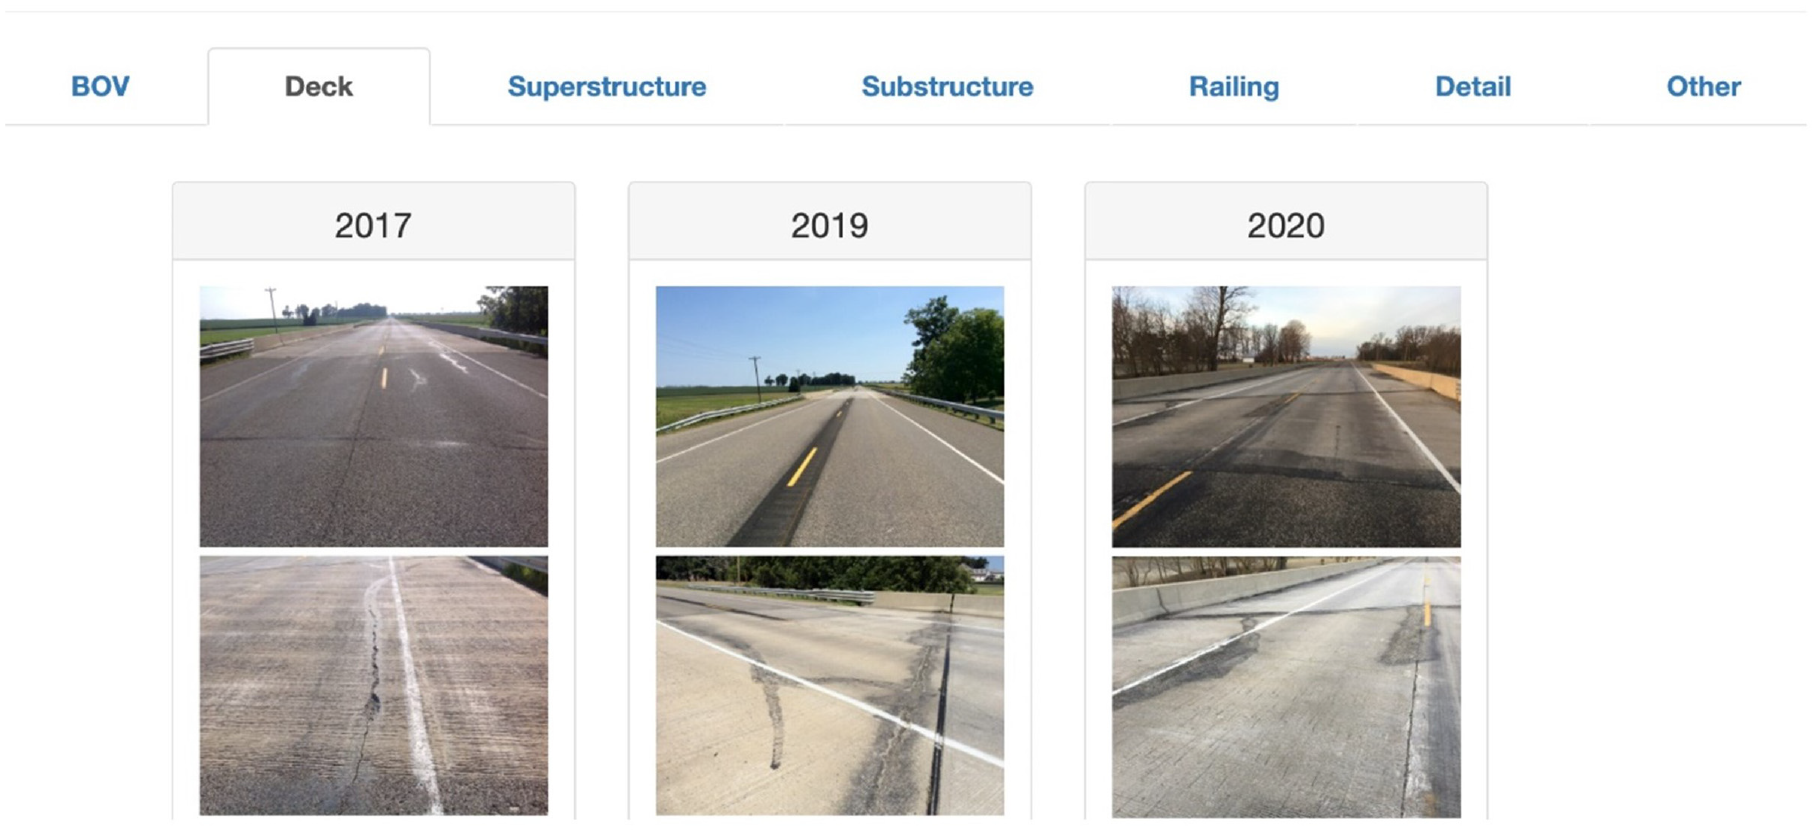
Chronological comparison capability of the Automated Bridge Image Reporting Tool (ABIRT) for deck category.
Recommendations and Future Work
ABIRT is able to organize typical images collected during routine inspections, as the embedded classifiers are designed and trained using realistic field images. However, several recommendations are discussed to make optimal use of this system. Following these recommendations can improve the processes related to image classification and organization and, ultimately, the quality and thoroughness of bridge inspection reports.
The first suggestion is to consider the categorical definitions when capturing images. This slight adjustment will enable the best organization results. Although the categories defined in this work can be changed according to the preference of the manuals and the inspectors in the future, once they are determined, the inspector’s workload will be reduced if they consider the categories defined for the categories when performing image acquisition. This guideline is helpful in any application of scene classification and, in some cases, an adjustment is possible. Certain standardized bridge image contents and locations would likely lead to highly consistent classification with few, if any, errors. The second recommendation is related, and is to suggest to users to avoid taking images that result in high overlap between two categories. For instance, they should focus on the substructure only or the superstructure only. This strategy can help the tool to organize the images with high accuracy, precision, and recall indexes. The third suggestion is that inspectors use cameras with the capability to store location and date information via EXIF metadata, so that the mapping and time comparison functions can be readily utilized. Finally, it is recommended that inspectors take advantage of the automated image processing of this tool by taking more images than they do currently. This step will ensure that all elements of the bridge have a steady historical record, and it will increase the amount of data available have for expanding the capabilities of this tool and other machine-learning-based tools.
ABIRT is also extensible as new capabilities of AI are developed. Currently, the tool is useful for performing the image documentation and report generation tasks. As introduced earlier in this paper, inspection reports also require damage analysis and condition evaluations. In the future, automated damage analysis can be added to further help inspectors in their daily work. For example, civil engineering researchers have shown success with AI-based crack detection in different types of crack images (see Zhou and Song) ( 35 , 36 ). Once these methods are validated and can detect and quantify cracks in real inspection images, for example, cracking on decks with tiny appearance, those abilities can be implemented in ABIRT. As depth cameras become more affordable, it may also be possible to collect measurements of damage. For instance, a depth image could help to predict the length and spacing of deck cracking. This quantitative measure would allow researchers to evaluate the overall condition of each element using the MBEI, and perhaps propose a condition rating for the whole bridge. A final possible expansion of the tool is to leverage EXIF information further to locate individual images with respect to the bridge. In this way, inspectors could have precise location context for all of the images in the database, leading to a better historical damage trace. Further research in these areas, in close collaboration with professional inspectors, could lead to a more useful tool for inspecting and managing more than 617,000 bridges in the U.S.
Conclusions
This study utilizes the recent advances in machine learning, namely CNNs, to establish and validate novel image classifiers tailored specifically to the bridge inspection industry. We first designed a two-level classification schema for bridge inspection tasks based on existing inspection rating manuals and discussions with bridge engineers. Next, we trained and validated several classifiers with the schema using training and validation sets that randomly split from the real-world bridge inspection image dataset we gathered. Then, the validated classifiers are integrated into a web-based tool, ABIRT, which we designed and developed, to demonstrate the usability and efficiency of our method. This tool allows inspectors to upload images from the field or office and supports the inspectors by automatically generating a report with the categorized images. Images are organized into separate report entries automatically based on their inspection year, allowing inspectors to isolate categories and track the damage status across several inspections. This historical comparison may be used to quantify damage development and inform better maintenance actions. ABIRT also enables inspectors to collect more data without spending extra time for manual processing. Ultimately, this machine-supported inspection tool can save inspectors valuable time and provide them with more comprehensive data to base their decisions on. The time saved allows the inspectors to focus more on the skilled engineering tasks using this evidence, such as damage analysis and condition evaluation. In the future, automatic bridge damage analysis can be developed and embedded in this tool. This functionality would assist the inspectors with making a condition decision, and enable further research on the reliability of bridge inspections.
Footnotes
Acknowledgements
The authors would like to thank the personnel from the Indiana Department of Transportation and the Texas Department of Transportation who collected bridge inspection data. The authors would also like to thank the helpful suggestions and practical inspection training from Mark Pittman and Keith Lytton of the Indiana Department of Transportation.
Author Contributions
The authors confirm contribution to the paper as follows: study conception and design: X. Zhang, B. Wogen, S. Dyke, R. Poston; data collection: J. Hunter, P. Baah; analysis and interpretation of results: X. Zhang, B. Wogen, Z. Chu, S. Dyke, X. Liu, L. Iturburu; draft manuscript preparation: X. Zhang, B. Wogen, Z. Chu, S. Dyke, R. Poston, T. Hacker, J. Ramirez, X. Liu, L. Iturburu, P. Baah, J. Hunter.
Declaration of Conflicting Interests
The author(s) declared no potential conflicts of interest with respect to the research, authorship, and/or publication of this article.
Funding
The author(s) disclosed receipt of the following financial support for the research, authorship, and/or publication of this article: This work is supported in part by the National Science Foundation, United States, under Grant No. NSF-OAC-1835473 and by the Joint Tranportation Research Program administered by the Indiana Department of Transportation and Purdue University (project SPR-4222).
ORCID iDs
The contents of this paper reflect the personal views of the authors, who are responsible for the facts and the accuracy of the data presented here, and do not necessarily reflect the official views or policies of the sponsoring organizations. These contents do not constitute a standard, specification, or regulation.