
Abstract
The Indirect Tensile Cracking Test (IDT-CT) is performed in accordance with ASTM D8225-19. This test method does not currently contain precision estimates. This creates potential issues when different test results are measured by individual laboratories conducting testing on the same asphalt mixture. In 2020, Phase I of an IDT-CT interlaboratory study (ILS) was conducted to establish precision estimates and statements for several indices associated with the IDT-CT (cracking tolerance index [CT index], fracture strain tolerance [FST], strength [St], and cracking resistance index [CRI]). This phase involved the evaluation of specimens fabricated and compacted by a third party laboratory and sent to participant laboratories for testing only. The objective of this paper was to assess the impact of device type and specimen preparation on the variability of IDT-CT results. This was accomplished through a second phase (Phase II) of the ILS program. This analysis involved the evaluation of specimens fabricated by the participant laboratories from loose mixtures, which were produced and sent from a third party laboratory along with detailed instructions for specimen fabrication and testing. The Phase II results suggest that device type might be a significant factor for mixtures with relatively low IDT-CT index values. Moreover, the precision estimates for the CT index, FST index, St, and CRI were determined. The precision estimates for single-operator conditions were similar, whether specimens of a given mixture were fabricated by the same laboratory or not. Finally, specimen preparation was found to induce additional variability in the precision estimates for multi-laboratory conditions.
Keywords
Introduction
The Virginia Department of Transportation (DOT) currently requires the use of the Indirect Tensile Cracking Test (IDT-CT) in its balanced mix design (BMD) specifications to evaluate the cracking resistance of dense-graded asphalt surface mixtures (SM) with A and D designations. Mixtures with A and D designations are usually designed to withstand a traffic range of 0 to 3 million and 3 to 10 million equivalent single axle loads (ESALs), respectively. A performance criterion requiring a minimum cracking tolerance (CT) index of 70 was recommended to lessen the cracking susceptibility of the asphalt mixtures based on extensive mixture testing ( 1 – 4 ). This CT index was determined based on testing of compacted specimens from reheated plant-produced asphalt mixtures ( 1 – 3 ).
The IDT-CT is performed in accordance with ASTM D8225-19, Determination of Cracking Tolerance Index of Asphalt Mixtures using the Indirect Tensile Cracking Test at Intermediate Temperatures ( 5 ). This test method does not currently contain precision estimates and statements. This can lead to comparison concerns when different laboratories report different test results when testing the same asphalt mixture. Thus, in 2020, the Virginia Transportation Research Council (VTRC), in collaboration with the Virginia Asphalt Association (VAA), initiated the first phase of a round robin evaluation, or interlaboratory study (ILS), referred to here as “Phase I,” in an effort to establish the acceptable variability of the test method. The CT index, defined in ASTM D8225-19 and currently used in Virginia DOT BMD specifications, and three additional performance indices (fracture strain tolerance [FST], strength [St], and cracking resistance index [CRI]) were evaluated as part of this effort. Some of these parameters are being considered by the research team as a potential addition (St), replacement (FST and CRI), or both, to the CT index parameter. Previous studies have shown that these indices are highly correlated, with some showing a better repeatability of characteristics and performance discrimination potential among asphalt mixtures ( 6 , 7 ).
Review of Phase I
Phase I of the IDT-CT ILS was a two-stage study conducted to develop precision estimates and statements for the CT index, FST, St, and CRI through the evaluation of two asphalt mixtures ( 6 ). This phase involved the evaluation of specimens fabricated and compacted by a third party laboratory and sent to participant laboratories for testing only. Stage 1 of this effort, referred to here as Phase I.1, focused on non-Virginia DOT laboratories and included 41 participants with 46 submitted data sets. The difference between the number of participants and the number of submitted data sets was a result of several laboratories receiving more than one set of test specimens per mixture to perform testing using devices from different manufacturers. The effects of device and loading rate on the selected IDT-CT indices were also investigated as part of Phase I.1. Stage 2 of this effort, referred to here as Phase I.2, focused on Virginia DOT laboratories and included eight participants with eight submitted data sets. Phase I.2 was performed one year after Phase I.1 using similar specimens compacted and stored in a climate-controlled area. For consistency, all IDT-CTs were performed at 25°C on dry specimens. However, challenges related to keeping the IDT-CT specimens dry when conditioned in a water bath using leak-proof plastic bags were reported. All participants of both stages were asked to submit the raw data files from their equipment in addition to reporting the CT index values for each specimen. These data files were used to perform quality checks on the data before conducting any further analysis to determine if the tests performed were in accordance with ASTM D8255-19. More details related to the test data quality evaluation can be found elsewhere ( 6 – 8 ).
In Phase I.1, three of 41 participating laboratories were unable to perform testing because of machine related issues (i.e., three of 46 data sets). Additionally, three of 41 participating laboratories were unable to provide the raw data from their tested specimens (i.e., three of 46 data sets). Furthermore, from data quality checks, it was observed that 10 of 41 participating laboratories (i.e., 10 of 46 data sets) were unable to perform the test correctly, indicating a need for training. Moreover, 14 of 41 participating laboratories (i.e., 14 of 46 data sets) performed testing using equipment incapable of meeting the loading rate requirement of 50 ± 2 mm/min as per ASTM D8225-19. This resulted in only 14 out of 41 participating laboratories submitting results for both mixtures in full accordance with ASTM D8225-19 (i.e., 16 of 46 data sets, or about 35% of the submitted data). Each participant laboratory tested a set of five replicate specimens for each of the two mixtures. The research team separated the received data into two data groups or categories to develop the precision estimates and statements for the CT index: Category (i) a data group fulfilling all ASTM D8225-19 requirements, including the loading rate of 50 ± 2 mm/min (i.e., 16 data sets per mix type), and Category (ii) a data group consisting of all submitted test results including those that did not satisfy the loading rate requirement of 50 mm/min (i.e., 30 data sets per mix type including the 16 data sets that fulfilled the loading rate requirements of 50 ± 2 mm/min). While analyzing the data, two approaches were considered: an untrimmed approach (i.e., original data) of which the five IDT-CT index values per mix type were included in the analysis, and a trimmed approach (i.e., trimmed data) of which the highest and lowest IDT-CT index values were eliminated from the data set per mix, resulting in three replicate test results for each data set. Table 1 summarizes the precision estimates resulting from the Phase I.1 study for the four selected IDT-CT indices ( 6 , 7 ). The findings also indicated that the magnitudes of CT index, FST, and CRI are not dependent on the type of device used. Additionally, the initial findings suggested that slight deviations from the loading rate of 50 ± 2 mm/min do not appear to significantly affect the calculated IDT-CT indices.
Summary of Precision Estimates for Phase I.1 of the IDT-CT Indices
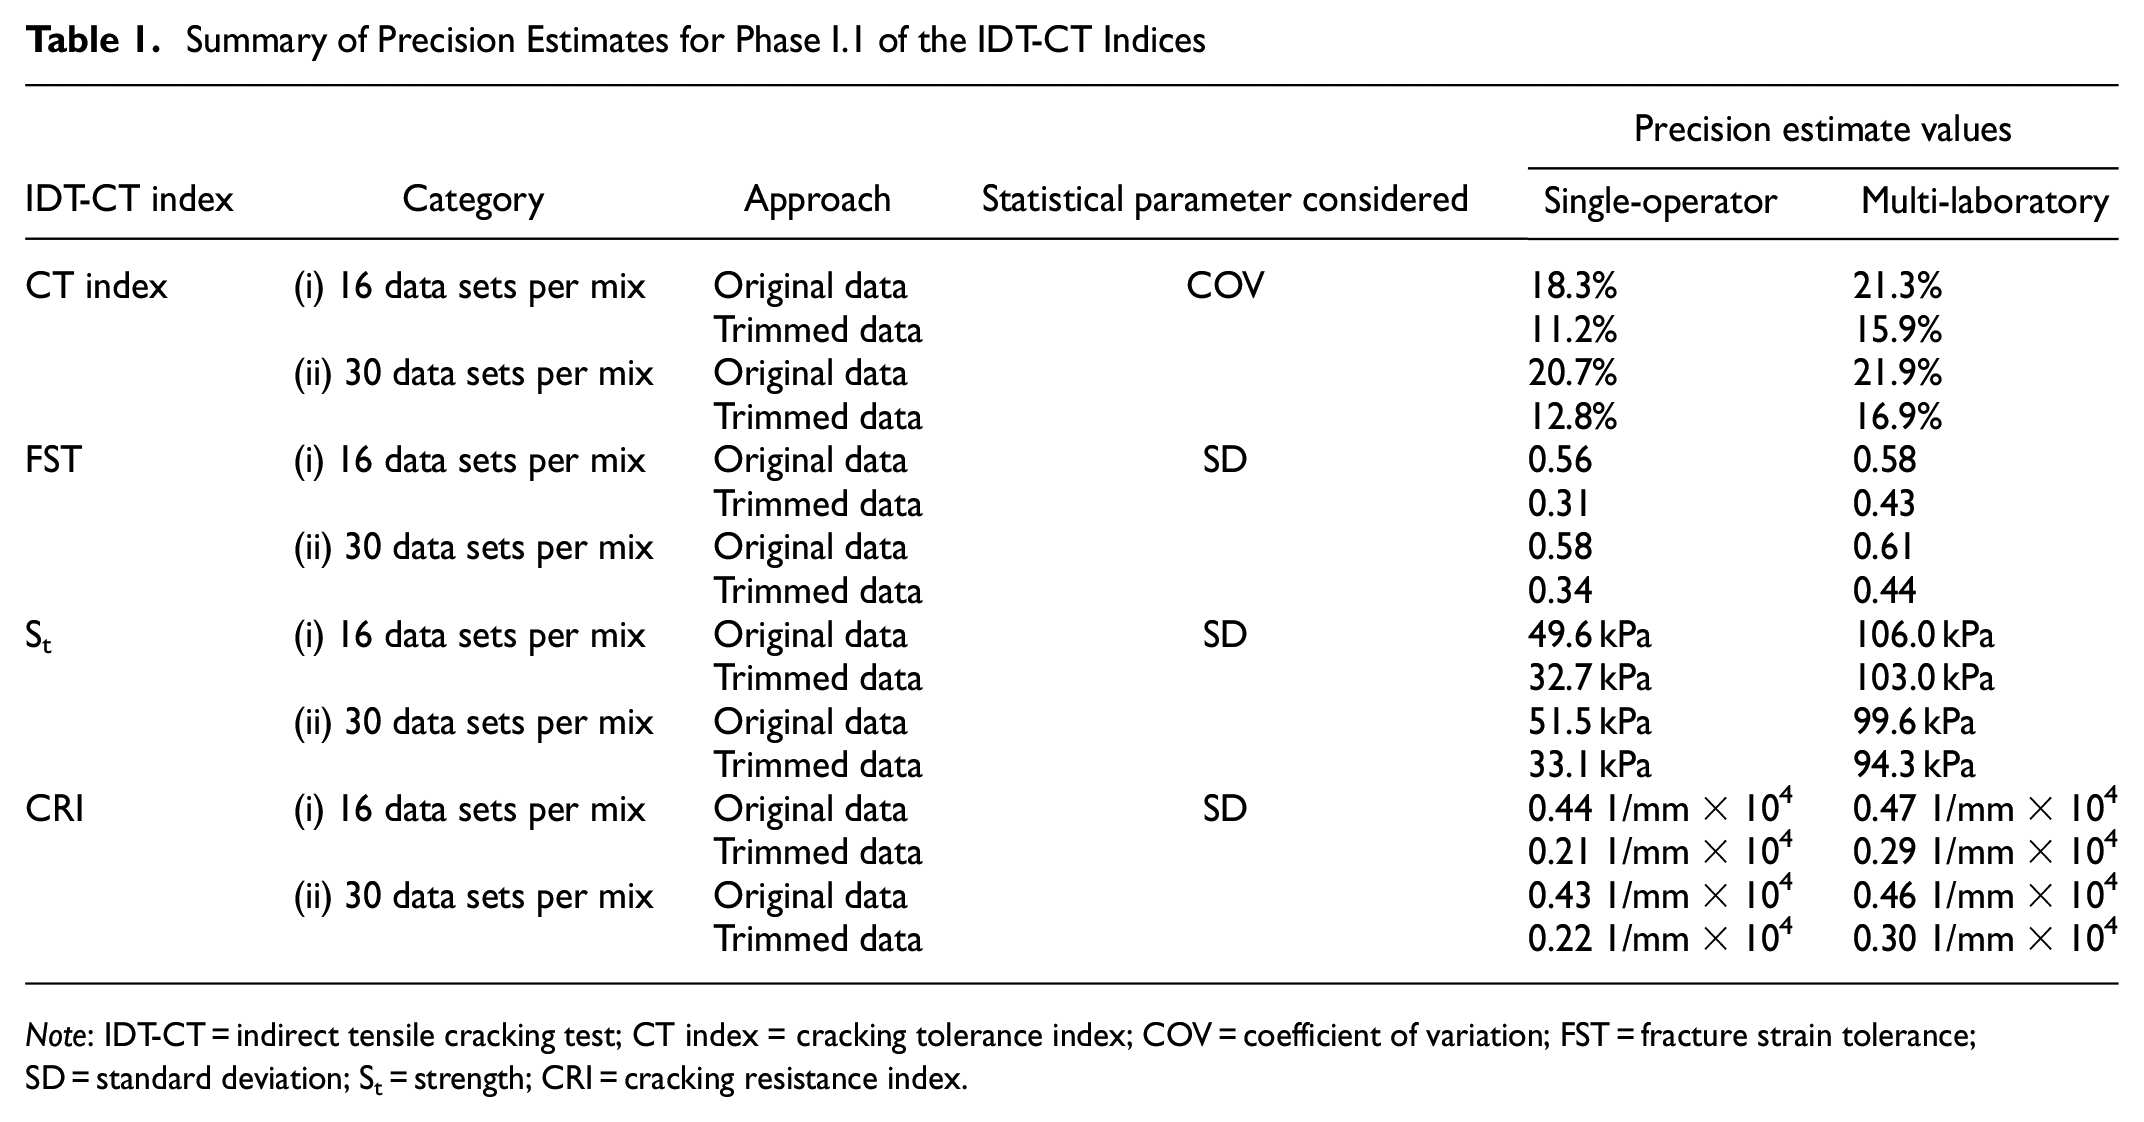
Note: IDT-CT = indirect tensile cracking test; CT index = cracking tolerance index; COV = coefficient of variation; FST = fracture strain tolerance; SD = standard deviation; St = strength; CRI = cracking resistance index.
The data collected in Phase I.2 (i.e., results from Virginia DOT laboratories) showed a relatively high variability when compared with the variability observed in Phase I.1. This was attributable to several factors including the relative lack of operator experience, a need for training, and potential changes in the material properties during storing, handling, and the shipping and/or testing process. The data collected from Phase I.1 and Phase I.2 also revealed that there was no statistically significant impact of one year of climate-controlled storage of compacted specimens on the calculated IDT-CT indices.
Phase I of the ILS program for the IDT-CT at intermediate temperatures recommended that a follow-up study (referred to here as “Phase II”) be conducted to assess the impact of the specimen preparation process on the repeatability (i.e., single-operator variability) and reproducibility (i.e., multi-laboratory variability) of IDT-CT test results through an ILS program with asphalt mixtures sent to participating laboratories in the loose-mixture state. Use of the loose asphalt mixtures as part of an ILS program was suggested to better reproduce the actual state of practice during design and production. Phase I also recommended assessing the impact of testing IDT-CT after temperature conditioning in water (wet conditioning) as compared with testing under dry conditions. Additionally, Phase I recommended assessing the impact of loading rate on the IDT-CT results in a more controlled manner, as a factor, which was not solely varied in the Phase I of the study.
Objective and Scope
While the overarching objective of both phases was to determine the acceptable variability and develop precision estimates and statements for the IDT-CT results under various conditions, this paper addresses the impact of device type and specimen preparation process on the variability of IDT-CT test results. This was accomplished during the second phase of the ILS program (i.e., Phase II) for IDT-CT at intermediate temperatures. This analysis involved the evaluation of test results obtained from specimens fabricated by the participant laboratories from loose mixtures, which were produced and sent by a third party laboratory along with detailed instructions for specimen fabrication and testing.
Experimental Program
Design Properties of Evaluated Asphalt Mixtures
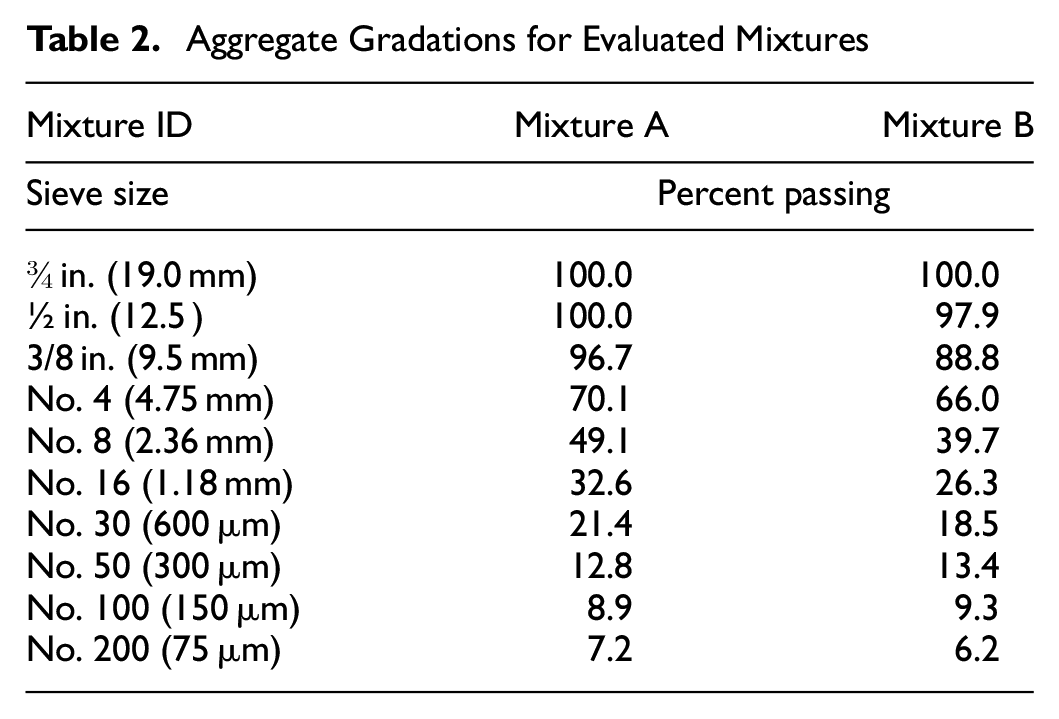
Two mixtures, Mixture A and Mixture B, designed and evaluated as part of Phase I were also evaluated as part of Phase II. Mixture A was a 65-gyration 9.5 mm nominal maximum aggregate size (NMAS) Superpave mix. Mixture A was produced using a performance grade (PG) 64E-22 asphalt binder and a reclaimed asphalt pavement (RAP) content of 30%. Mixture B was a 50-gyration 12.5 mm NMAS Superpave mix. Mixture B was produced using a PG 64S-22 asphalt binder and did not contain any RAP.
Two additional mixtures, Mixture C and Mixture D, were designed and evaluated in Phase II for validation of few selected concepts. Mixture C was a 65-gyration 9.5 mm NMAS Superpave mix. Mixture C was produced using a PG 64S-22 asphalt binder and an RAP content of 15%. Mixture D was a 65-gyration 9.5 mm NMAS Superpave mix. Mixture D was produced using a PG 58S-28 asphalt binder and a RAP content of 30%.
The four mixtures were designed and produced by a third party independent laboratory. Tables 2 and 3 summarize the aggregate gradation and volumetric properties for the four mixtures, respectively. The mixtures were designed such that the CT index values determined for each mixture were spread out to ensure a wider applicability of the study to a range of CT index values from 50 to 300.
Aggregate Gradations for Evaluated Mixtures
Volumetric Properties for Evaluated Mixtures
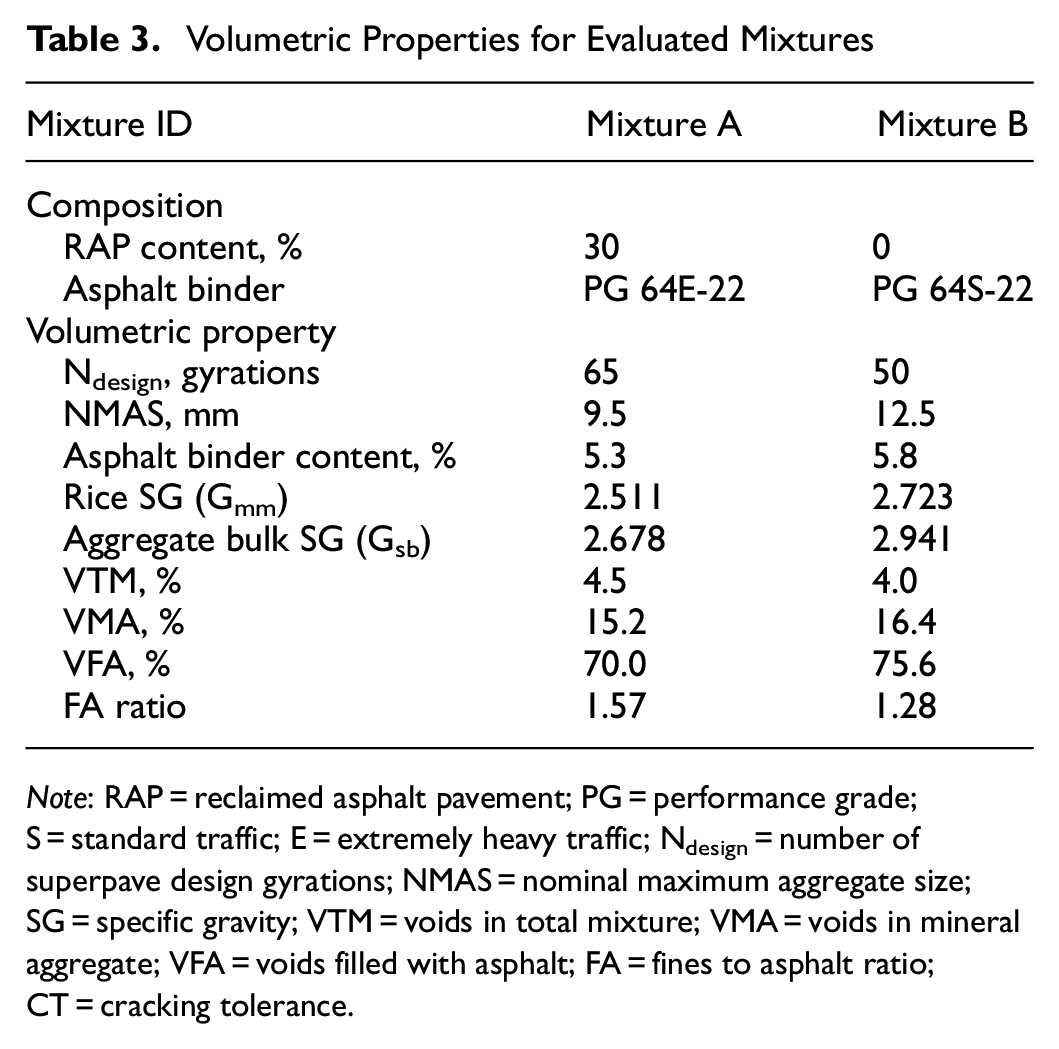
Note: RAP = reclaimed asphalt pavement; PG = performance grade; S = standard traffic; E = extremely heavy traffic; Ndesign = number of superpave design gyrations; NMAS = nominal maximum aggregate size; SG = specific gravity; VTM = voids in total mixture; VMA = voids in mineral aggregate; VFA = voids filled with asphalt; FA = fines to asphalt ratio; CT = cracking tolerance.
IDT-CT Testing
The IDT-CT testing was conducted at 25 ± 0.5°C in accordance with ASTM D8225-19 ( 5 ). The test load-displacement curve and specimen dimensions for diameter and thickness were then used to calculate the CT index (refer to Equation 1), FST index, St, and CRI (refer to Equations 3 through 5).


where
CT index = cracking tolerance index expressed in Equation 1,
Gf = total area under the load-displacement curve divided by the product of the specimen thickness [t] and diameter [D], kN/mm,
m75 = slope of interest expressed in Equation 2,
p85 = 85% of the peak load (Pmax) at the post-peak stage, kN,
p75 = 75% of Pmax at the post-peak stage, kN,
p65 = 65% of Pmax at the post-peak stage, kN,
l85 = displacement corresponding to p85, mm,
l75 = displacement corresponding to p75, mm,
l65 = displacement corresponding to p65, mm,
FST = fracture strain tolerance expressed in Equation 3,
St = indirect tensile strength expressed in Equation 4, kPa,
CRI = cracking resistance index expressed in Equation 5,
D = specimen diameter, mm,
t = specimen thickness, mm.
Description of ILS Phase II
The Phase II of the IDT-CT ILS included non-Virginia DOT laboratories and Virginia DOT district laboratories. The ILS was conducted in accordance with ASTM E691-19, Standard Practice for Conducting an Interlaboratory Study to Determine the Precision of a Test Method ( 9 ). The following defines four test-measurement exactness terms of interest according to ASTM E691-19 ( 9 ):
precision, the closeness of agreements between independent test results obtained under stipulated conditions;
bias, the difference between the expectation of the test results and an accepted reference value,
repeatability, precision of test results from tests conducted within the shortest practical time period on identical material by the same test method in a single laboratory with all known sources of variability conditions controlled at the same levels; and
reproducibility, precision of test results from tests conducted on identical material by the same test method in different laboratories.
The experimental plan for the ILS study included:
identification of qualified laboratories to participate;
full-scale execution which included material preparation and handling, distribution, tracking the testing progress of participant laboratories, and data inspection and examination;
statistical analysis of the generated data;
determination of precision estimates in accordance with ASTM E691-19 ( 9 );
development of precision statements in accordance with ASTM C670-15, Standard Practice for Preparing Precision and Bias Statements for Test Methods for Construction Materials ( 10 ). No statement on bias was made since there is no accepted reference material suitable for determining the bias in this test method; and
reporting of individual results to each participant laboratory along with the study outcomes.
The requirements for each step as detailed in ASTM E691-19 were fulfilled in Phase II with the exception of including at least three materials representing different test levels for developing precision statements. Only two materials were included. Similar to Phase I, the reason for such an exception was to involve more laboratories rather than to evaluate more materials. Supporting this, the analysis in Phase I revealed that the precision is relatively constant when compared with the average level over the range of values of interest.
Test Results, Data Analysis, and Discussions
ILS Phase II - Participant Laboratories
A total of 50 laboratories participated in Phase II of the IDT-CT ILS. These laboratories consisted of Virginia DOT districts and VTRC, along with other university, DOT, contractor, and independent testing laboratories. In total, 55 pairs of buckets each for Mixture A and Mixture B were shipped out and 55 corresponding data sets per mixture type were collected. Similar to Phase I.1, the difference between the number of participants and the number of collected data sets was a result of several laboratories receiving more than one set of test specimens per mixture to perform testing using devices from different manufacturers.
In Phase II, four of 50 participating laboratories did not submit their testing results (i.e., four of 55 data sets). Four of 50 participating laboratories were also unable to provide the raw data from their tested specimens (i.e., four of 55 data sets). Furthermore, seven of 50 participating laboratories (i.e., seven of 55 data sets) were unable to perform the test correctly or performed the tests on specimens outside the 7 ± 0.5% air voids range as stated in ASTM D8225-19. Moreover, 11 of 50 participating laboratories (i.e., 11 of 55 data sets) performed testing using equipment incapable of meeting the loading rate requirement of 50 ± 2 mm/min. This resulted in only 24 of 50 participating laboratories submitting results for both mixtures in full accordance with ASTM D8225-19 (i.e., 29 of 55 data sets, about 53% of the submitted data). All participants of Phase II were asked to submit the raw data files from their equipment in addition to reporting the CT index values for each specimen. These data files were used for data quality checks before performing further analysis to determine if the tests performed were in accordance with ASTM D8255-19. Figure 1 shows the breakdown of submitted data status for the IDT-CT ILS Phase I.1 and Phase II. The significant increase in percentage of participants submitting data fully conforming to ASTM D8225-19 is notable. Each participant laboratory was asked to compact and test a set of at least five replicate specimens each for Mixture A and Mixture B. As an example, Figure 2 presents the original untrimmed distribution of the individual CT index values collected from all participant laboratories for Mixture A and Mixture B.
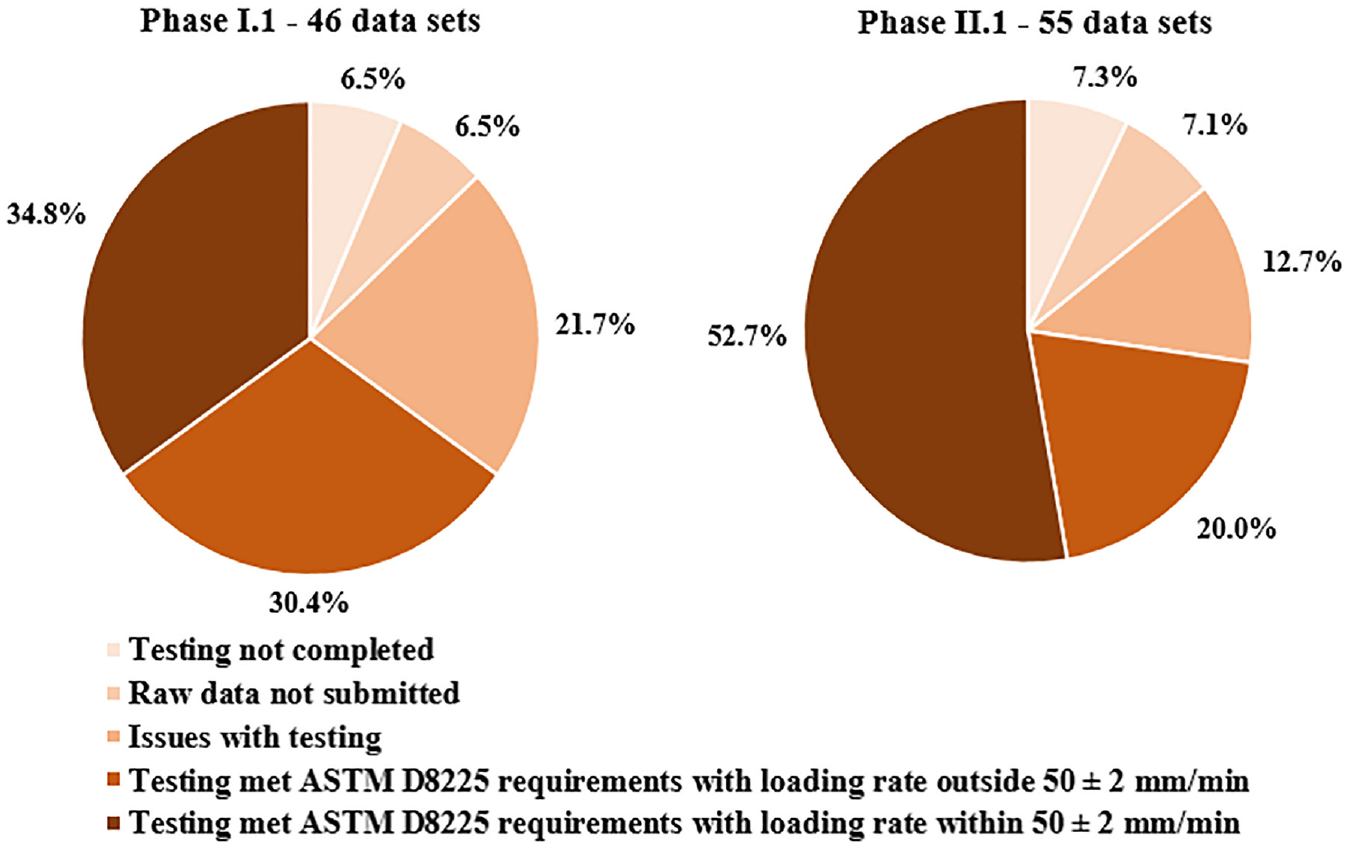
Status of submitted data for Indirect Tensile Cracking Test (IDT-CT) Round Robin Phase I.1 and Phase II.1.
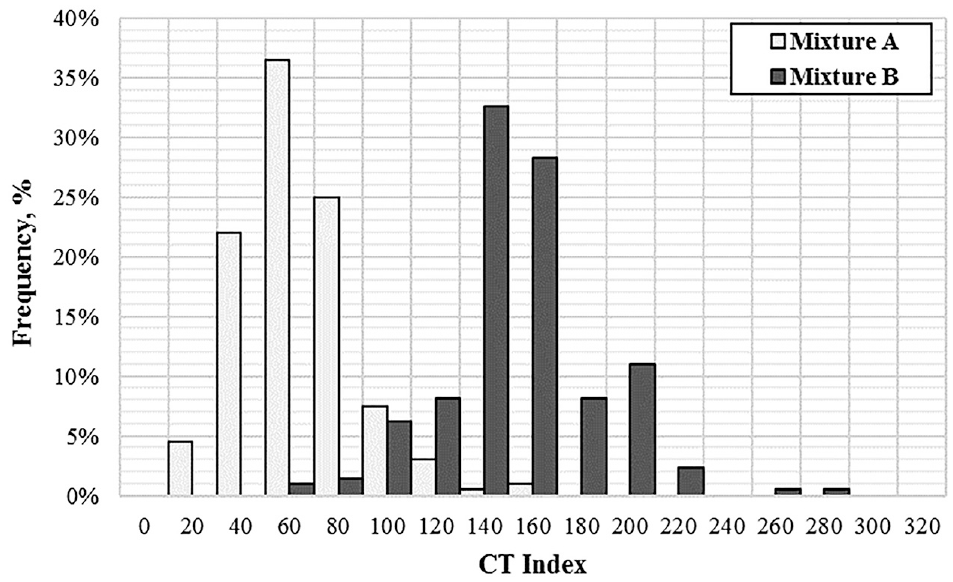
Distribution of cracking tolerance (CT) index values for Mixture A and Mixture B collected as part of Phase II.1.
Effect of Using Different Devices on IDT-CT Indices
Phase II of the IDT-CT ILS effort featured the use of 10 devices labeled Devices I through X with three participating laboratories capable of testing using multiple devices. Device I and Device X were servo-hydraulic (SH) machines and Device II through IX were screw-drive (SD) machines. This presented an opportunity to assess the impact of devices employed on the IDT-CT indices considered in this study. Two approaches were considered.
The first approach evaluated the data sets collected from all laboratories. An analysis of variance (ANOVA) at a 95% confidence interval was performed to determine if there was a statistically significant difference in the CT index results when different devices were used for testing. Similar to the analysis provided in Phase I, two categories were considered as part of the analysis in Phase II: Category (i), a data group fulfilling all ASTM D8225-19 requirements, including the loading rate of 50 ± 2 mm/min (i.e., 29 data sets per mix type); and Category (ii), a data group consisting of all submitted test results including those that did not satisfy the loading rate requirement of 50 mm/min (i.e., 40 data sets per mix type including the 29 data sets that fulfilled the loading rate requirements of 50 ± 2 mm/min). For the response variable, CT index, the factors considered were “device,”“laboratory” nested under the factor “device,” and “mixture type” nested under the factors “device” and “laboratory.” The mixture type was found to be a statistically significant factor for the data sets of both categories, Category (i) and Category (ii), for specific laboratory and device combinations. A pairwise comparison using the Bonferroni method indicated that, for a given mixture, a few laboratories with different device types had statistically different test results compared with the test result from the rest of the laboratories. It was also observed that these laboratories with and without statistically similar test results shared the same device types. In other words, for example, Laboratory M with Device I fell under the statistically different test results group, but Laboratory N with Device I fell under the statistically similar test results group. This indicates that the source of statistical difference may not be the device type, but potentially the mixture and/or laboratory/operator variability. Thus, further analysis using a second approach was carried out to study the impact of device type on the test results.
The second approach evaluated only the data sets of the three participating laboratories with multiple devices, Lab X, Lab Y, and Lab Z. Lab X and Lab Y were each provided with two buckets per mixture to be tested using different devices by the same operator. The third participant, Lab Z, was provided with four buckets per mixture for the same reason. The analysis was only performed on the data compiled in Category (ii). Among the equipment used by the three laboratories, five devices were also identified and highlighted in the corresponding analysis: Device I (SH) (Lab X, Lab Y, and Lab Z); Device II (SD) (Lab X); Device III (SD) (Lab Y and Lab Z); Device IV (SD) (Lab Z); and Device VIII (SD) (Lab Z). Both data analysis approaches, original untrimmed and trimmed, were considered. Figures 3 to 5 show the average CT index of data reported by Lab X, Lab Y, and Lab Z, respectively. The average CT index results from the original untrimmed data were similar to the average CT index results from the trimmed data for all three laboratories (i.e., Lab X, Lab Y, and Lab Z). The results of a paired t-test at a 5% significance level on each pair of data points for each laboratory indicated no statistically significant differences between the CT index results before and after trimming, confirming the findings of Phase I.1 of the study ( 6 , 7 ). There was a considerable decrease in the average coefficient of variation (COV) when the trimmed approach was employed. The COV for the original data with all data points of the three laboratories ranged from 5.9% to 27.9% with an average COV of 17.0%. The COV for the trimmed data ranged from 3.4% to 23.9% with an average COV of 10.9%.
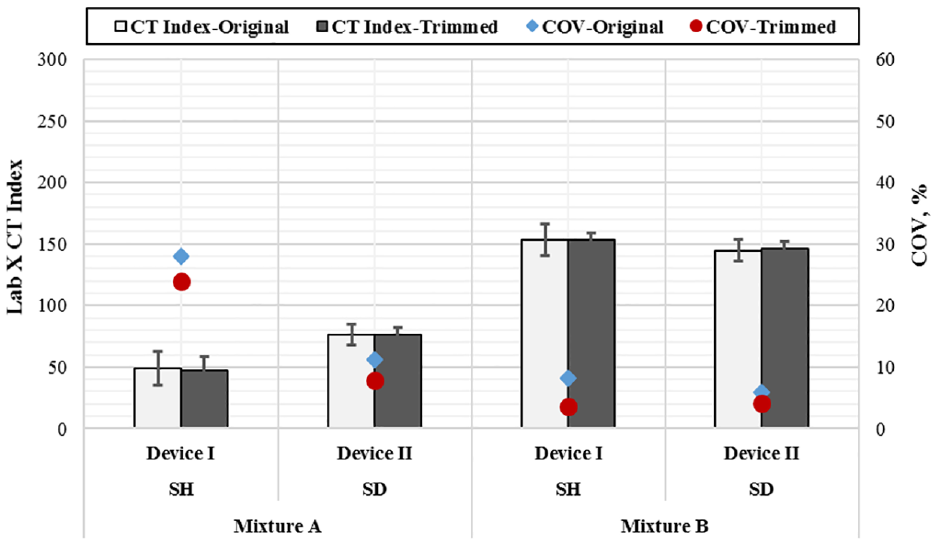
Cracking tolerance (CT) index values reported by Lab X for Mixture A and Mixture B collected as part of Phase II.1 using two devices.
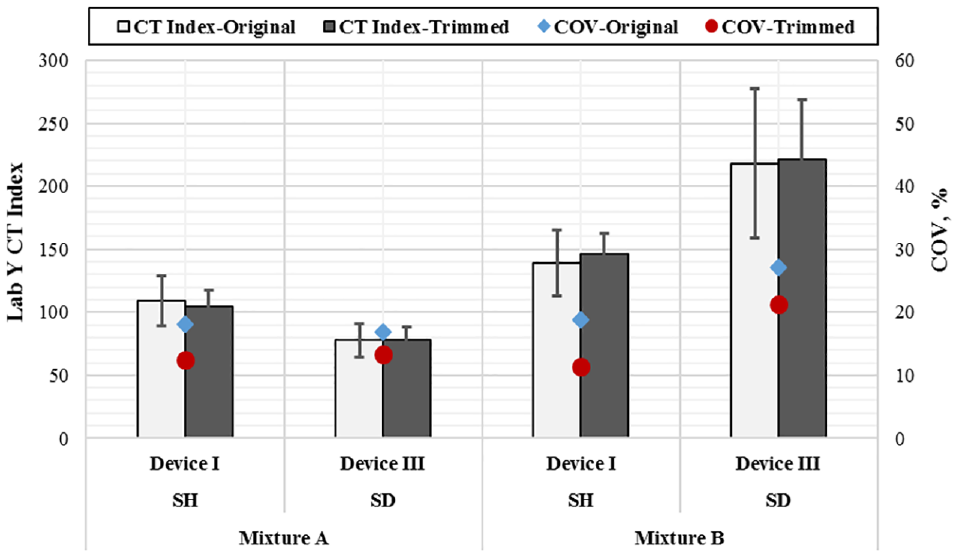
Cracking tolerance (CT) index values reported by Lab Y for Mixture A and Mixture B collected as part of Phase II.1 using two devices.
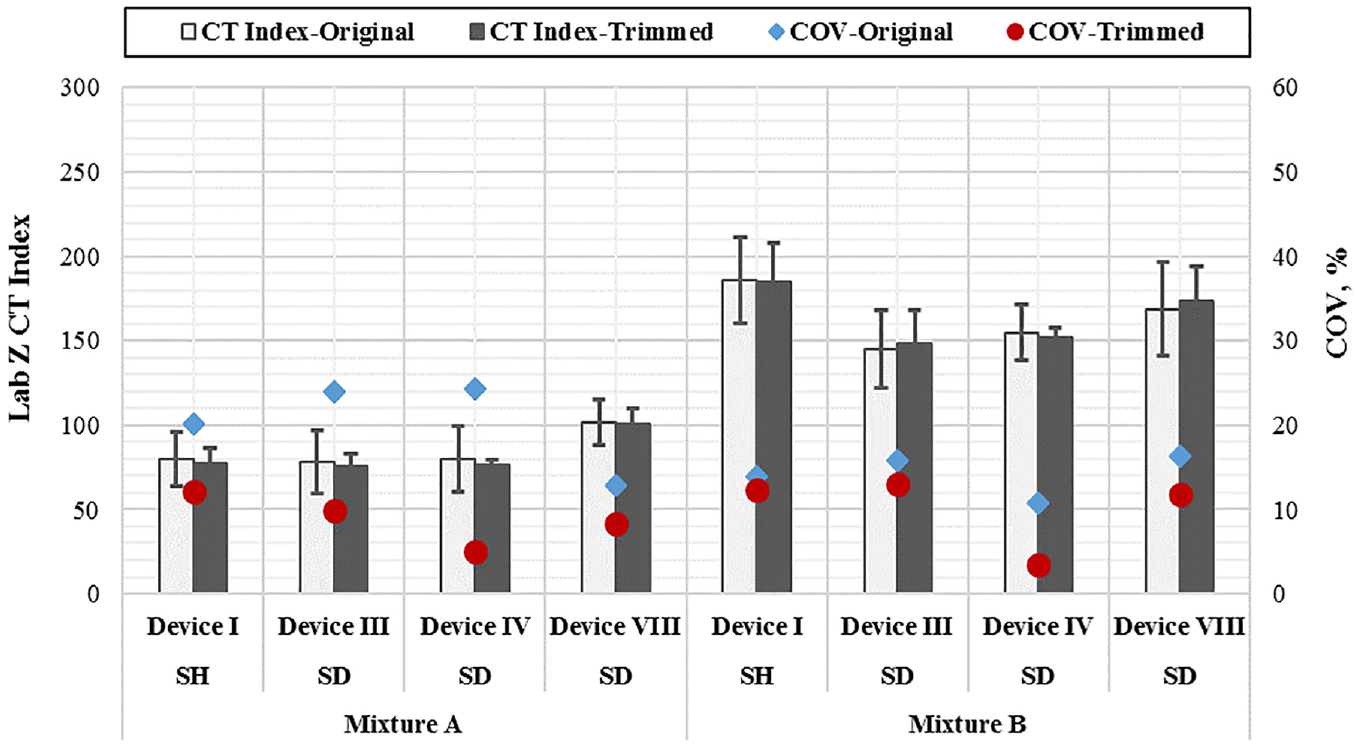
Cracking tolerance (CT) index values reported by Lab Z for Mixture A and Mixture B collected as part of Phase II.1 using four devices.
An ANOVA at a 95% confidence interval was performed to determine if there was a statically significant difference in the CT index results when different devices were used for testing. For the response variable CT index, the parameters used as factors in the analysis model were “mixture type” and “device.” An interaction term “mixture type*device” was also added into the model as a factor. The assumption of normality was satisfied for the CT index data obtained from any of the three laboratories. Table 4 presents the ANOVA statistics for the CT index for the three laboratories, Lab X, Lab Y, and Lab Z, using both the original untrimmed and trimmed data. The data confirmed an expected observation that “mixture type” was a statically significant factor across the three laboratories for both original untrimmed and trimmed data. The factor “device” was observed to be statistically significant for the trimmed data of Lab X and for both the original untrimmed and trimmed data for Lab Z.
Summary of ANOVA Results for Cracking Tolerance (CT) Index Using Original Untrimmed and Trimmed Data for Lab X, Lab Y, and Lab Z
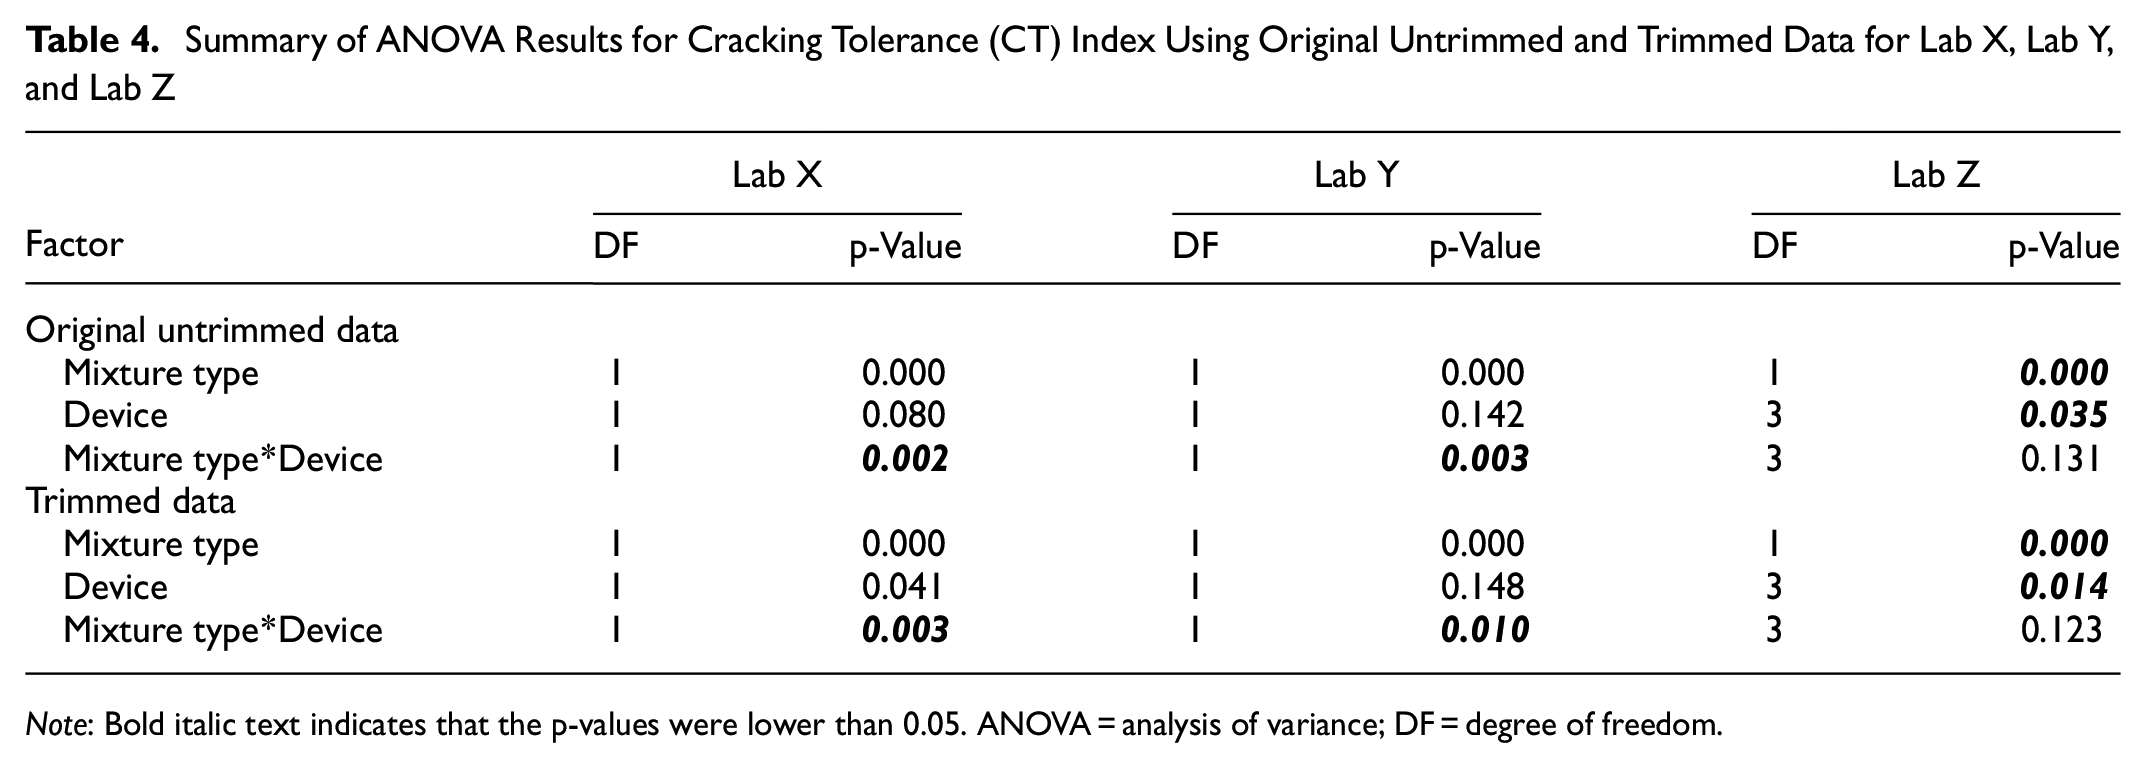
Note: Bold italic text indicates that the p-values were lower than 0.05. ANOVA = analysis of variance; DF = degree of freedom.
A pairwise comparison using the Tukey method on all data subgroups indicated for Lab X that Device I and Device II resulted in statistically different CT index values for Mixture A for both original untrimmed and trimmed data. For Lab Y, Device I and Device III resulted in statistically similar CT index values for Mixture A for both original untrimmed and trimmed data. Finally, for Lab Z, the factor “device” was not found to be a statistically significant factor regardless of the mixture type and trimming. The results here suggest that device type might be a significant factor for mixtures with relatively low CT values, although further evaluation is necessary to confirm this observation.
Similar to the CT index, evaluations were carried out to assess the impact of test device on the FST index, St, and CRI. The statistical analyses were limited to the original untrimmed data sets of Category (ii). The same observations made for the CT index remain valid for the FST index, St, and CRI.
Impact of Specimen Preparation on IDT-CT Indices
ASTM E691-19 was used to determine the precision estimates for the four considered indices. Both approaches, original untrimmed and trimmed, were considered when data was analyzed. Similar to Phase I.1, the data obtained as part of Phase II were grouped and analyzed in two categories labeled Category (i) and Category (ii). Category (i) considered 29 data sets from laboratories that were able to perform the IDT-CT in full accordance with ASTM D8225-19 including satisfying a loading rate of 50 ± 2 mm/min. Meanwhile, Category (ii) considered 40 data sets collected from laboratories that were able to perform the IDT-CT in accordance with ASTM D8225-19 with the exception of satisfying the specified loading rate. The 40 data sets from Category (ii) include the 29 data sets from Category (i). Category (ii) was considered because small deviations from a loading rate range of 50 ± 2 mm/min appear to not have a statistically significant impact on the four considered IDT-CT indices.
Selection of an Appropriate Statistical Parameter
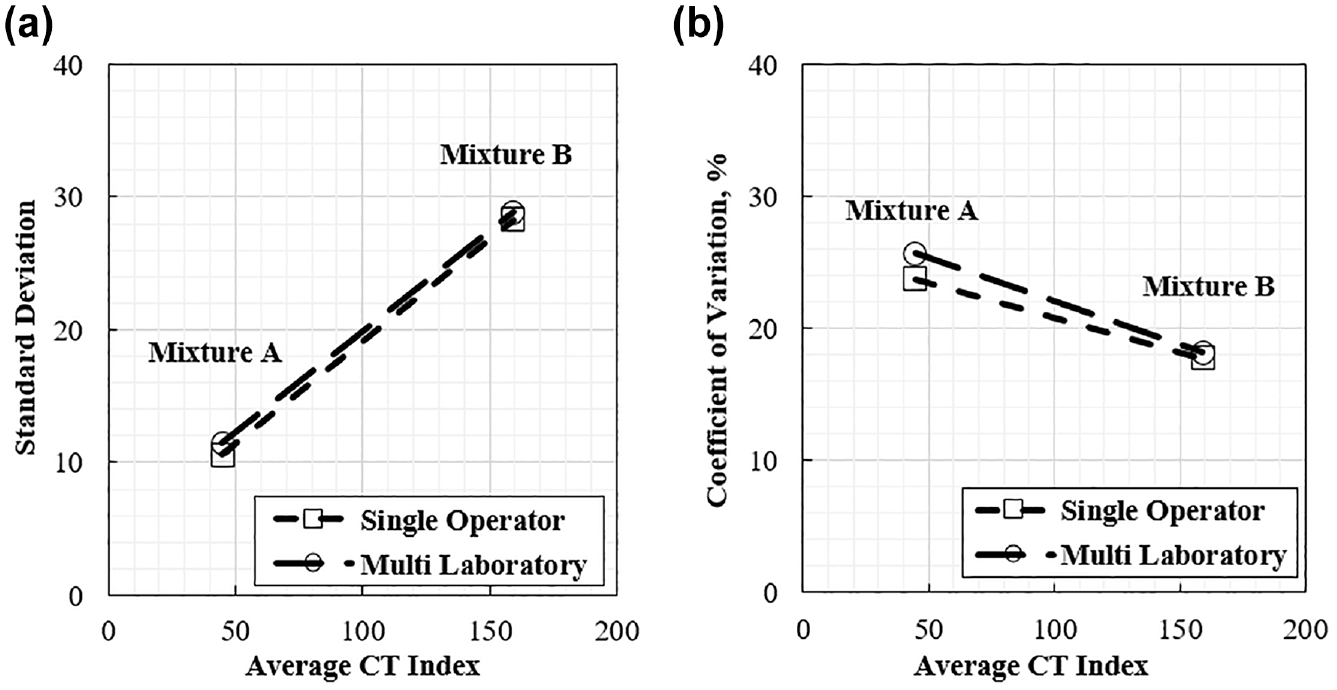
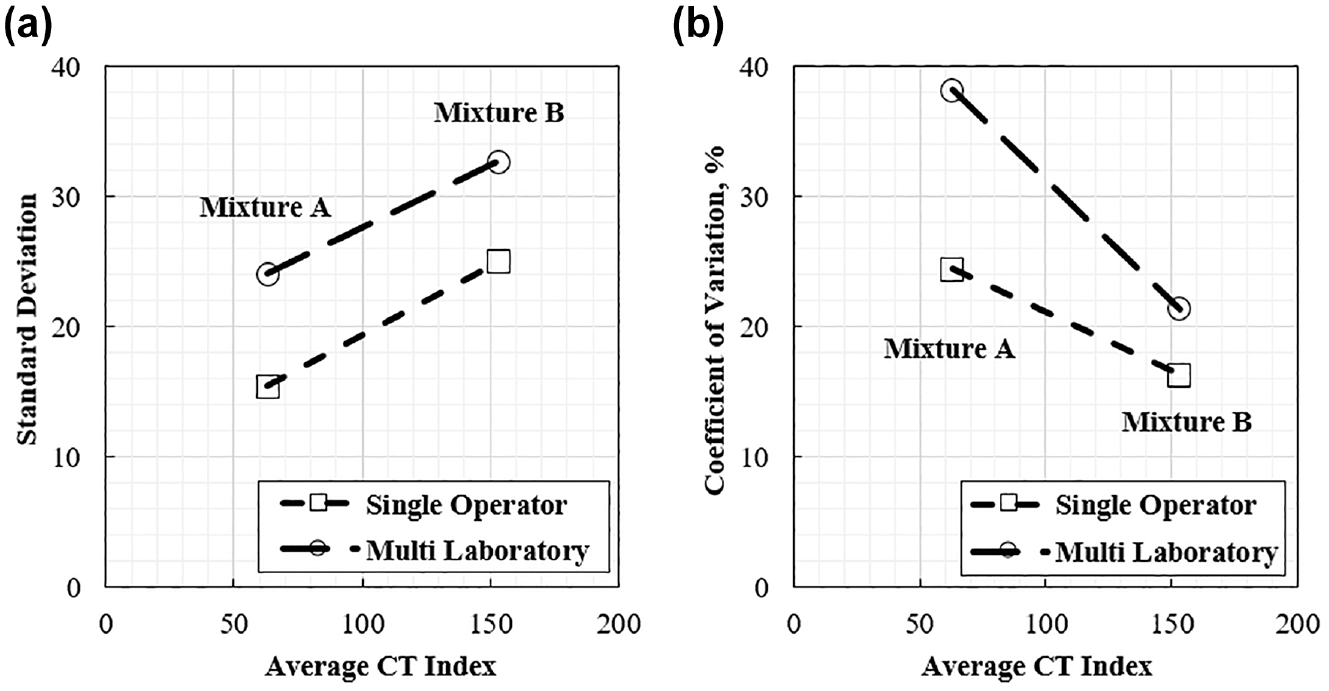
To determine the precision estimates, the relationship between each IDT-CT index/parameter and the statistical parameters of interest for single-operator and multi-laboratory were investigated for Categories (i) and (ii) of the data sets. The statistical parameters considered were the standard deviation (SD) and coefficient of variation (COV). Table 5 presents the variation of SD and COV functions of the CT index collected in Phase I.1 and Phase II for Mixtures A and B, for Categories (i) and (ii), and using both the untrimmed original and trimmed approaches. The variation was evaluated by computing the SD and COV rate changes and the parameter associated with the lowest absolute value rate change was selected as the preferred. The SD or COV rate change is defined as the difference between the SD or COV of the CT index for Mixture B and the SD or COV of the CT index for Mixture A normalized by the average of the SD or COV of the CT index for Mixtures A and B. A positive rate indicates that the statistical parameter (SD or COV) increased with the increase of CT index value (as the CT index for Mixture B is greater than the CT index for Mixture A), and a negative value indicates the opposite. Figures 6 and 7 illustrate the variation of SD and COV over the range of evaluated CT index values for data collected in Phase I.1 and Phase II, respectively. The data in Table 5 and Figures 6 and 7 indicate that the COV had a lower rate of change when compared with the SD for the same data sets for Mixtures A and B during both Phase I.1 and Phase II.
Variation of Standard Deviation and Coefficient of Variation Functions of Cracking Tolerance (CT) Index for Phase I.1 and Phase II
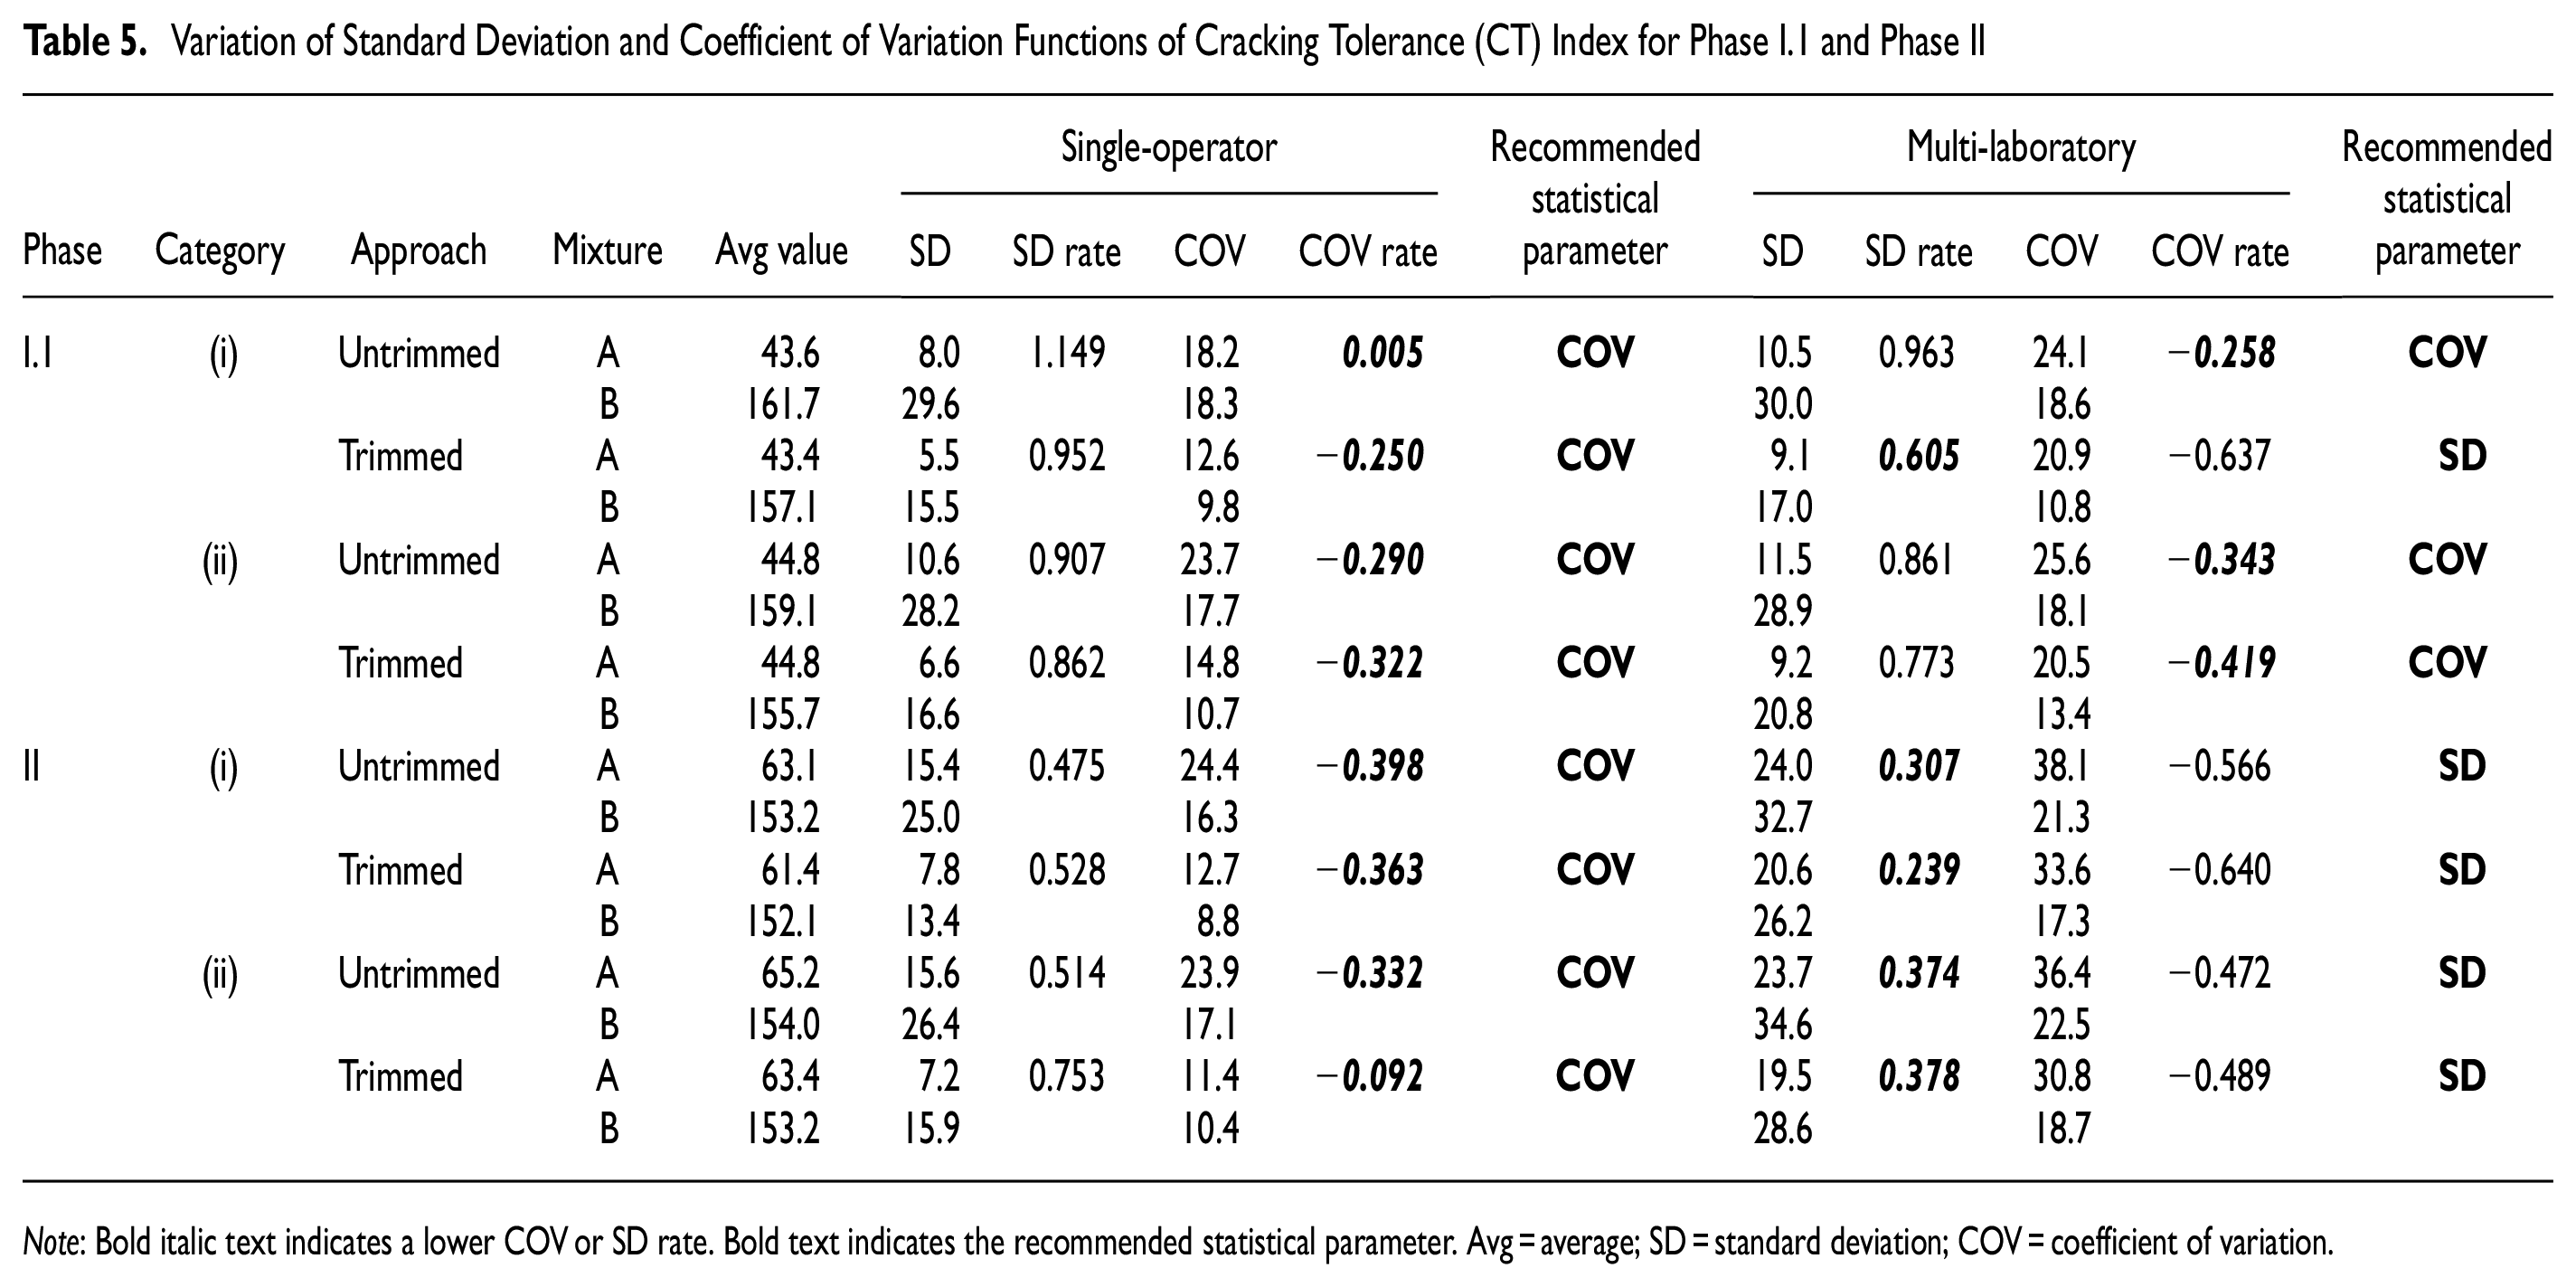
Note: Bold italic text indicates a lower COV or SD rate. Bold text indicates the recommended statistical parameter. Avg = average; SD = standard deviation; COV = coefficient of variation.
Variation of statistical parameters over the range of evaluated cracking tolerance (CT) index values for data collected in Phase I.1: (a) standard deviation and (b) coefficient of variation.
Variation of statistical parameters over the range of evaluated cracking tolerance (CT) index values for data collected in Phase II: (a) standard deviation and (b) coefficient of variation.
Similar analyses were performed for the FST index, St, and CRI. In summary, the SD had an overall lower rate of change when compared with the COV for both the FST index and CRI. However, for the St, SD exhibited a lower rate of change for the data sets of Phase I.1, while COV exhibited a lower rate of change for the data sets of Phase II.
Development of Precision Estimates
Table 6 summarizes the precision estimates resulting from Phase II for the four IDT-CT indices (i.e., CT index, FST, St, and CRI). Trimming of the data resulted in a substantial decrease in SD and COV for both single-operator and multi-laboratory conditions. Overall, the SD and COV for both single-operator and multi-laboratory conditions were similar for the original untrimmed or trimmed approach regardless of the category ([i] or [ii]) and number of data sets considered as part of the analysis.
Summary of Precision Estimates for Phase II.1 of the Indirect Tensile Cracking Test (IDT-CT) Indices
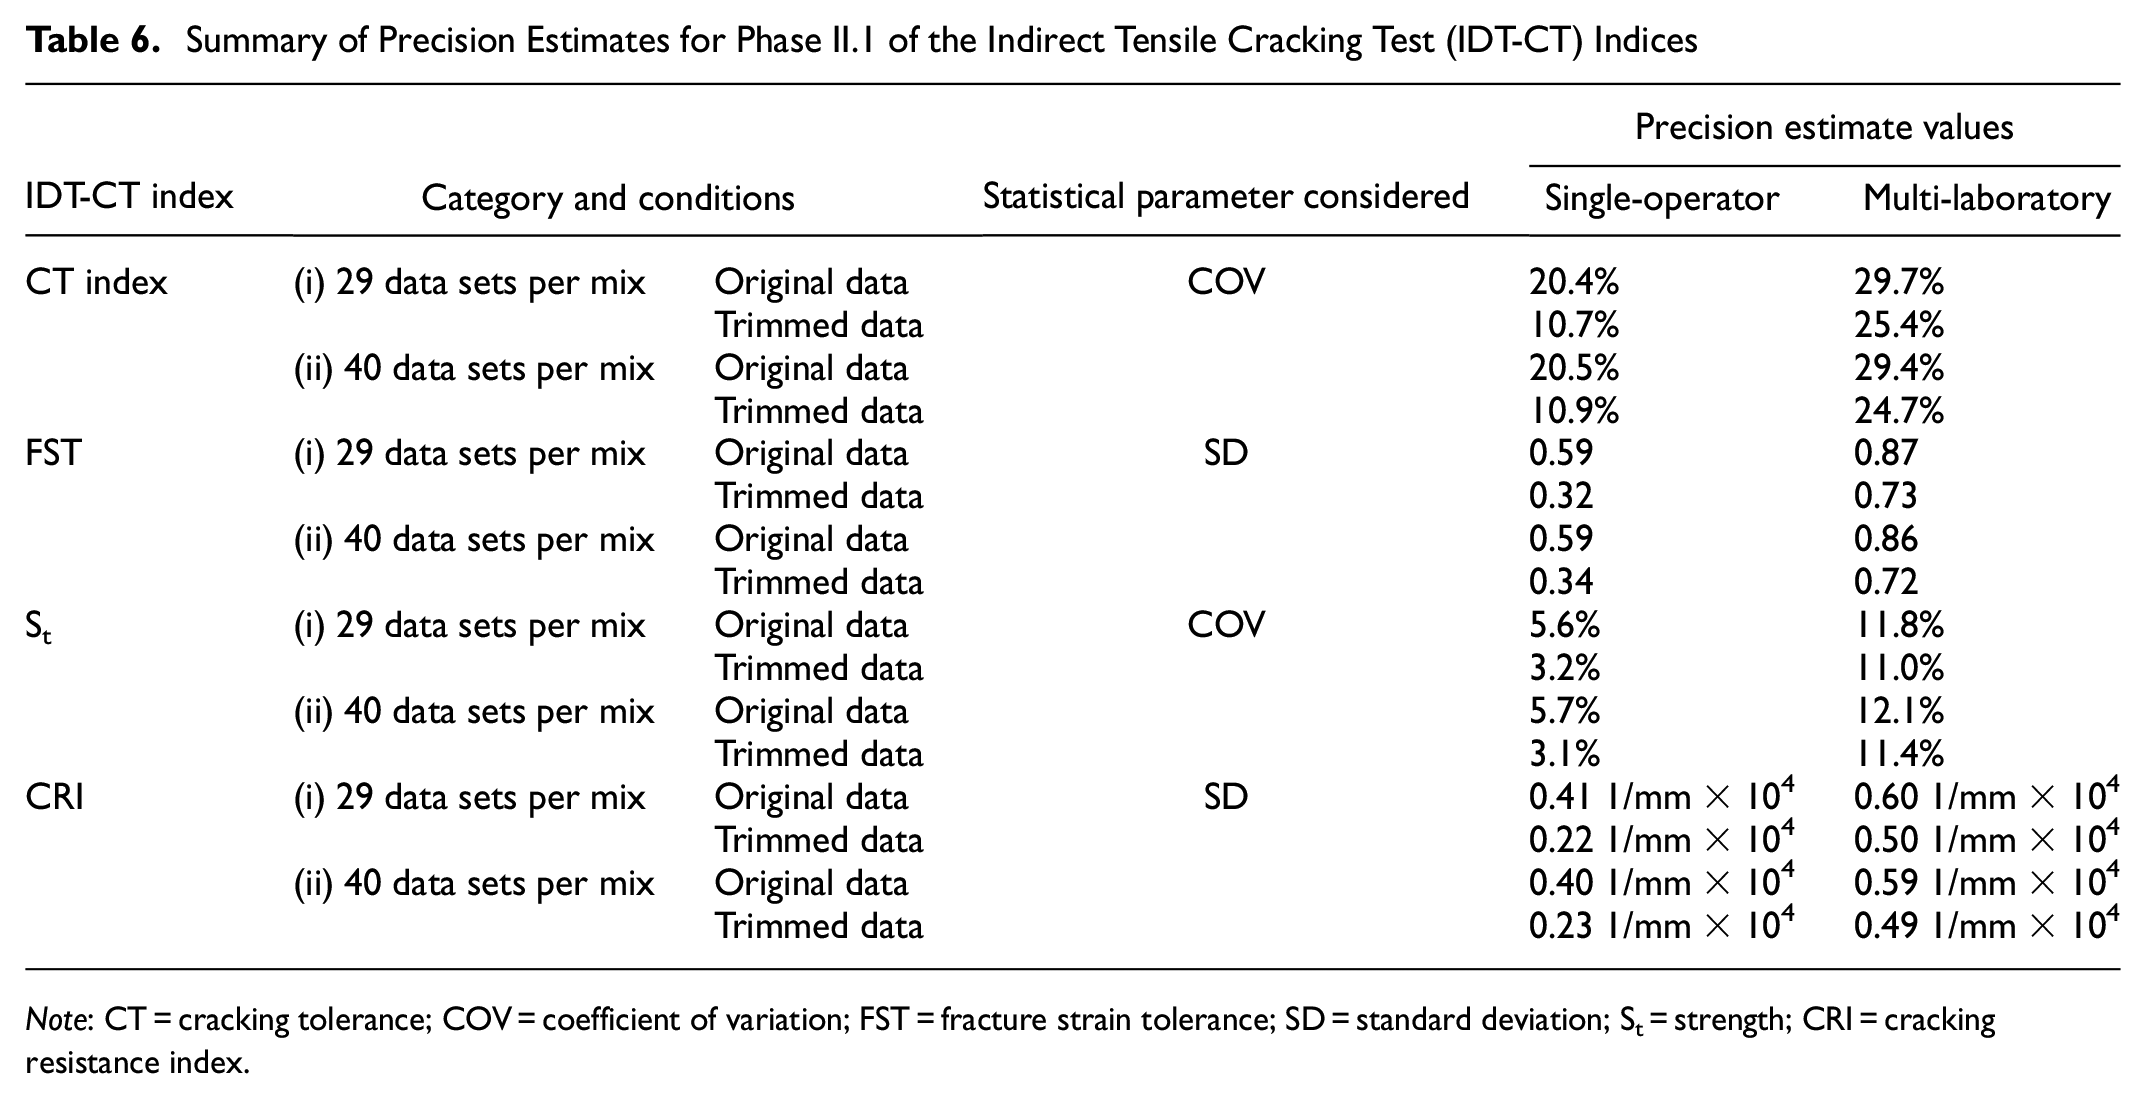
Note: CT = cracking tolerance; COV = coefficient of variation; FST = fracture strain tolerance; SD = standard deviation; St = strength; CRI = cracking resistance index.
Table 7 compares the precision estimates for COV for the CT index determined in Phase I.1 and those determined in Phase II. The precision estimates for single-operator conditions were similar for Phase I.1 and Phase II across the same approach and regardless of the category. However the multi-laboratory precision estimates for Phase II were observed to be greater than the multi-laboratory precision estimates for Phase I.1. This reflects the additional variability caused by specimen preparation. Similar observations remain valid for the FST index, St, and CRI.
Comparison of Precision Estimates for the Cracking Tolerance (CT) Index Determined in Phase I.1 and Phase II
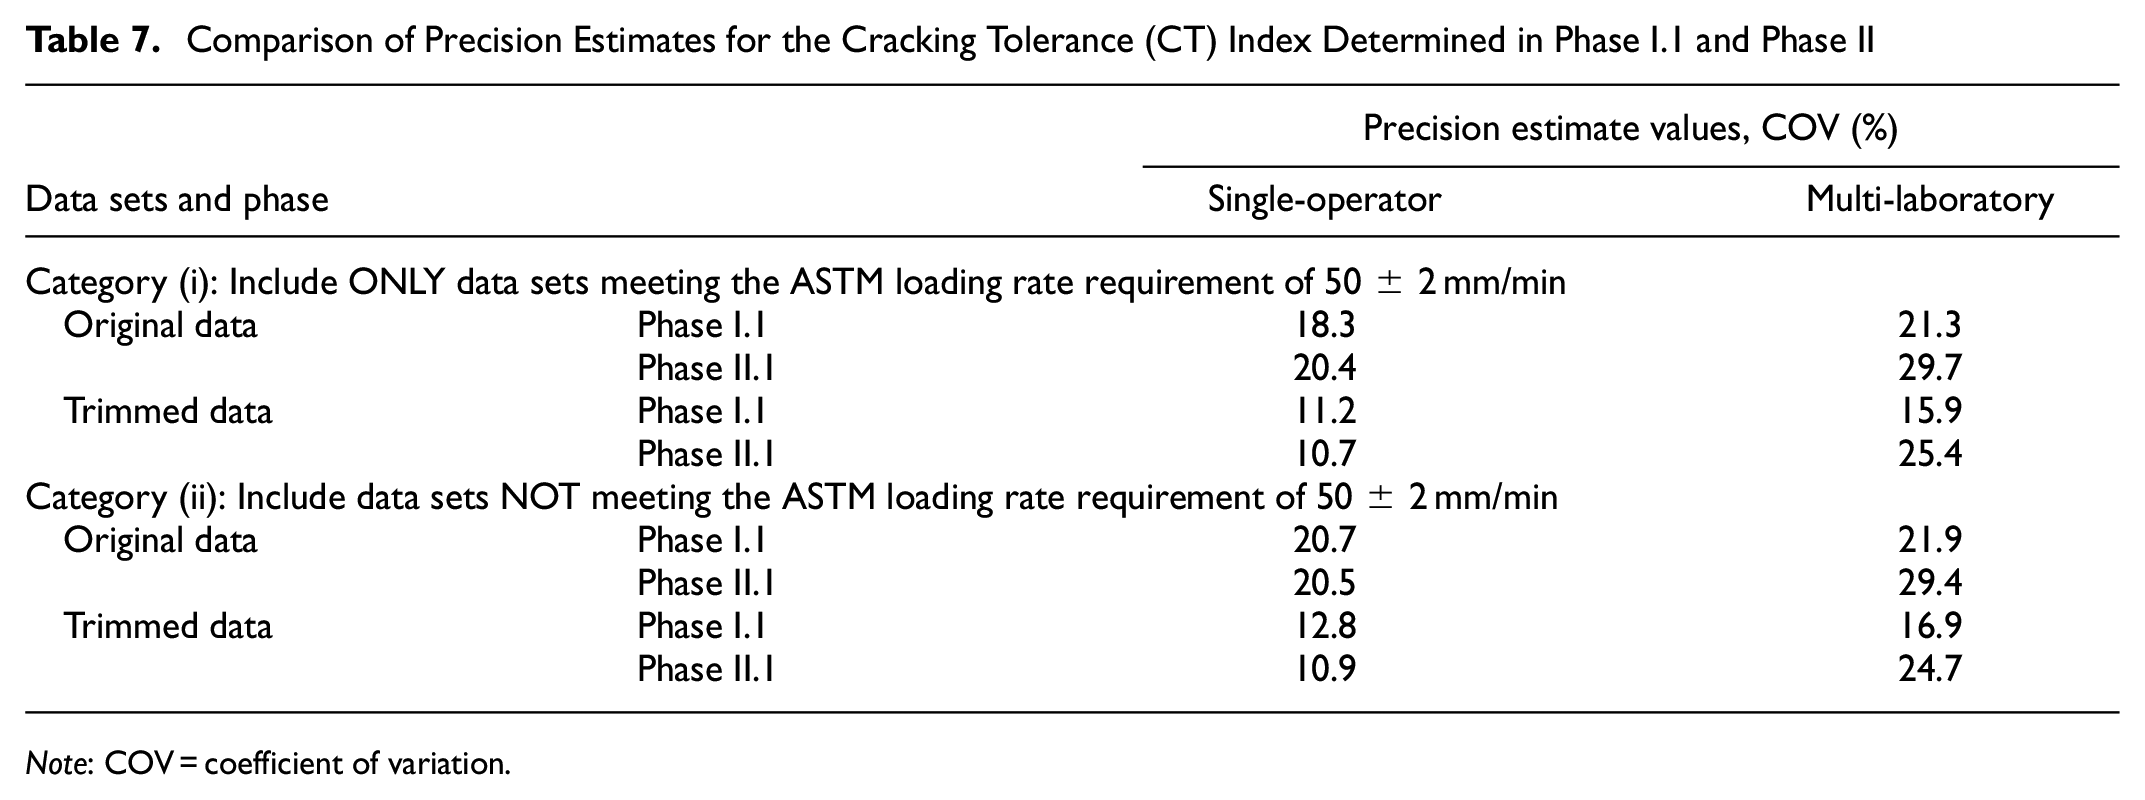
Note: COV = coefficient of variation.
Conclusion
The objective of this paper was to assess the impact of device type and specimen preparation on the variability of the IDT-CT at intermediate temperatures. This was achieved by analyzing the data generated as part of an ILS program for IDT-CT at intermediate temperatures. This analysis involved the evaluation of test results obtained from specimens fabricated by the participant laboratories from loose mixtures, which were produced and sent by a third party laboratory along with detailed instructions for specimen fabrication and testing. Based on the data collected and the analyses provided in this paper, frequent hands-on training and demonstrations of IDT-CT executed between when Phase I.1 and Phase II were completed had led to significant increase in percentage of participants submitting data fully conforming to ASTM D8225-19. Moreover, the Phase II results of the ILS for the IDT-CT indices suggests that device type might be a significant factor for mixtures with relatively low IDT-CT index values. This may raise a significant concern when long-term aged asphalt mixtures are evaluated using IDT-CT. For that case, the CT index is expected to be low and the device type may have a significant impact on the test results.
Moreover, different statistical parameters are appropriate for evaluating the variability of different IDT-CT indices. The COV is a better metric for the CT index, meanwhile the SD is a better metric for FST index, St, and CRI. Trimming of the data will help eliminate outliers whenever they exist. In fact, trimming of the data results in a substantial drop in the magnitude of the selected statistical parameter for both single-operator and multi-laboratory precision estimates. Finally, the precision estimates for single-operator conditions are similar whether specimens of a given mixture are fabricated by the same laboratory or not. Specimen preparation induces additional variability in the precision estimates for multi-laboratory comparisons. The multi-laboratory precision estimates for Phase II were observed to be greater than the multi-laboratory precision estimates for Phase I.1.
Footnotes
Acknowledgements
The authors are grateful to the following individuals who served on the technical review panel for this study: Sungho Kim (Project Champion and Statewide Asphalt Program Manager, Virginia DOT Materials Division); Robert Crandol (Assistant State Maintenance Engineer, Virginia DOT Maintenance Division); Thomas Schinkel (District Materials Engineer, Virginia DOT Richmond District); Travis S. Higgs (District Materials Engineer, Virginia DOT Salem District); Candice Entwisle (Assistant Asphalt Program Manager, Virginia DOT Materials Division); Todd Rorrer (Asphalt Pavement Field Engineer, Virginia DOT Materials Division); and Bernard L. Kassner (Senior Research Scientist, VTRC). The authors acknowledge Mike Dudley from the Virginia Asphalt Association for his assistance in developing and executing both phases of this IDT-CT round robin. The contributions of Bluegrass testing laboratory staff in design and producing loose mixtures and test specimens are deeply appreciated. Appreciation is also extended to all participant laboratories involved in any testing in this study.
Author Contributions
The authors confirm contribution to the paper as follows: study conception and design: J. Habbouche, I. Boz, and S.D. Diefenderfer; data collection: J. Habbouche, I. Boz, and S.D. Diefenderfer; analysis and interpretation of results: J. Habbouche, I. Boz, and S.D. Diefenderfer; draft manuscript preparation: J. Habbouche, I. Boz, and S.D. Diefenderfer. All authors reviewed the results and approved the final version of the manuscript.
Declaration of Conflicting Interests
The author(s) declared no potential conflicts of interest with respect to the research, authorship, and/or publication of this article.
Funding
Data Accessibility Statement
The contents of this paper reflect the views of the authors, who are responsible for the facts and the accuracy of the data presented here. The contents of this paper do not necessarily reflect the official views or policies of the Virginia Department of Transportation, the Commonwealth Transportation Board, or the Federal Highway Administration at the time of publication. This report does not constitute a standard, specification, or regulation. Any inclusion of manufacturer names, trade names, or trademarks is for identification purposes only and is not to be considered an endorsement.