
Abstract
Work zones on two-lane highways with one lane closed require sharing the open lane with traffic from the closed directions. In such work zones, traffic control resembles operating a two-phase traffic signal and, in rare cases, a three-phase traffic signal. Temporary traffic signals (or flaggers) allow the open lane to be used in an alternating manner. Signal timing (green times and cycle length) of the temporary traffic lights directly affects the delay and queue in the work zones. Delay and queue computations must consider queue build up that often happens in oversaturated conditions. Another influential variable is the average operating speed of the work zone. The operating speed is affected by the work zone speed limit, work intensity, speed control technique, lane and shoulder widths, acceleration capability of vehicles, and work zone length. WorkZoneQ-Pro (WZQ-Pro) is developed with a new signal timing method that considers the above-mentioned factors. The procedure can handle multiple hours of analysis with two- or three-phase signal operations. Test scenarios are real-world work zone examples from three different U.S. states that were used to compute signal time variables and use them to compute queue and delay. These values were also computed using Highway Capacity Manual (HCM) 2016 procedures and are compared. In addition, the computed values were input into Vissim simulation software, and the results were compared. It showed that the WZQ-Pro results are reasonably close to Vissim simulation results, and that further validated that an acceptable agreement existed between the analytical and simulation results.
Keywords
Two-lane highways are common in the rural areas, and rural paved two-lane highways account for 85% of the state and county highway systems in the U.S. ( 1 ). Usually, during construction or maintenance of two-lane highways, one of the lanes is closed and the open lane is shared by opposing traffic in an alternating manner. Thus, work zones on two-lane highways require a two-phase signal operation and, in some cases, even a three-phase signal operation.
During construction or maintenance, the performance of the roadway deteriorates because of lower capacity ( 2 ). Work zones on two-lane highways often require the open lane to be used by both sides ( 3 , 4 ). The operation resembles having a split-phase at a signalized intersection, except that road clearance time is much longer. Phase plan and green time allocation can heavily influence the performance of a signalized intersection ( 5 , 6 ). Similarly, an efficient signal (or flagger) operation on two-lane highway work zones requires proper green time allocation to minimize the delay and queue. The Highway Capacity Manual (HCM) 2016 and the HCM 7th Edition have the same procedure for computing the operating speed in the work zone and road clearance time for a temporary traffic signal for one-lane operation on two-lane highway work zones that is based on the work zone length, outside speed limit, access point density, lane width, and shoulder width ( 6 , 7 ). HCM-computed work zone operating speed has some limitations, such as not considering work zone speed limit, work intensity, barrier type, speed control technique, work zone operating speed, road clearance time, acceleration rate, and operation of a three-way phase plan. An appropriate phase plan can minimize delay and queues for motorists ( 8 ). Since work zones with one lane closed on two-lane highways operate like signalized intersections, it is important to find an appropriate good signal timing plan. Some previous studies on one-lane closure on a two-lane highway have focused on finding the optimal length of the work zone and traffic control to minimize user costs ( 4 ). Chien et al. optimized cycle time and work zone length ( 1 ). Often, work zone length is determined by construction type and is not something that a traffic analyst would change. WorkZoneQ-Pro (WZQ-Pro) uses a method that will be discussed in this paper to determine “near” optimal signal timing while considering work zone speed limit, work intensity, speed control technique, lane and shoulder widths, acceleration capability of vehicles, and the length of the work zone. This paper presents the method used in WZQ-Pro and its capabilities for two-phase and three-phase operations on a two-lane highway work zone and compares its results with Vissim simulation results.
Literature Review
Cassidy and Han developed a model to estimate vehicle delay and queue length on one-lane closure on a two-lane highway ( 3 ). They used empirical data from a work zone on a two-lane highway to find the average delay. However, green time and cycle length were not optimized based on the given condition.
Schonfeld and Chien developed a model to optimize the work zone length and traffic control on one-lane operation in a two-way work zone ( 4 ). They used the total cost function as an objective function. Chien et al. further optimized work zone lengths, cycle time, the duration of construction, and idle time between two work zones ( 1 ). However, work zone length is restricted by regulation and construction equipment used in the work zone, so it would be difficult to use this equation in real-world traffic conditions.
Schrock et al. found a saturation headway of 3.3 s and a start-up lost time of 6.0 s from field data ( 9 ). Their work zone sites had a flagger or portable traffic signals (PTS). They also developed a model to find an appropriate green interval and annual average daily traffic (AADT) thresholds, the speed of the pilot car, the round-trip time of the pilot cars, and the work zone length ( 9 ). Their model finds an appropriate green interval for each peak hour volume assuming it is 15% of AADT and directional distribution is 50%.
Washburn et al. developed the FlagSim simulation tool to estimate the two-lane work zone capacity by measuring saturation flow rates and the proportion of the green time ( 10 ). They proposed a saturation flow at the work zone located on a two-lane highway with headway adjustment that is based on average travel speed. This approach can be used after finding a good initial green time for each direction.
Zhu et al. developed a capacity model based on a phase plan consisting of green time in each direction, road clearance time, and start-up lost time ( 11 ). Their road clearance time is computed as work zone length divided by the speed in that direction. They used the HCM 2010 method for signalized intersections to find the delay caused by work zone operation ( 11 ).
Zhang and Wang optimized minimum and maximum green times on an isolated intersection ( 12 ). Minimum and maximum green times are important parameters that could affect the performance of an intersection, because they control the length of green time in the actuated traffic signal. They dynamically optimized minimum and maximum green times.
Benekohal et al. analyzed the impact of automated speed photo-radar enforcement (SPE) in work zones ( 13 ). Researchers found a 4.2–7.9 mph speed reduction in average free-flowing cars and 3.4–6.9 mph for trucks at a location near the SPE van. Also, SPE reduced the percentage of cars and heavy vehicles that were exceeding the work zone speed limit ( 13 ).
Medina et al. examined the downstream effects of automated SPE and traditional speed reduction treatments (speed feedback trailer, police presence with emergency lights on and off, and combination of speed feedback trailer and police presence) ( 14 ). Their analysis showed that the SPE reduced average speed from 2 mph to 3.8 mph for cars and 0.8 mph to 5.3 mph for trucks at the downstream location from the treatments. Speed feedback trailer and police presence had a lesser impact than SPE, but other treatments had no significant impact on downstream traffic ( 14 ).
Benekohal et al. developed a procedure to estimate work zone capacity and operating speed for freeway work zones ( 15 ). Free-flow speed is required to compute operating speed and is affected by the speed control technique. The researchers created a table of speed reduction caused by treatment using data from their previous study and other papers ( 15 ).
Speed control treatments have some impact on motorists’ speed in freeway work zones ( 13 – 19 ). However, the authors are not aware of any such study on two-lane highway work zones. Until such studies are conducted, it is reasonable to assume that speed control treatments on two-lane highway work zones would have a similar impact as speed control treatments placed in freeway work zones.
Data Collection
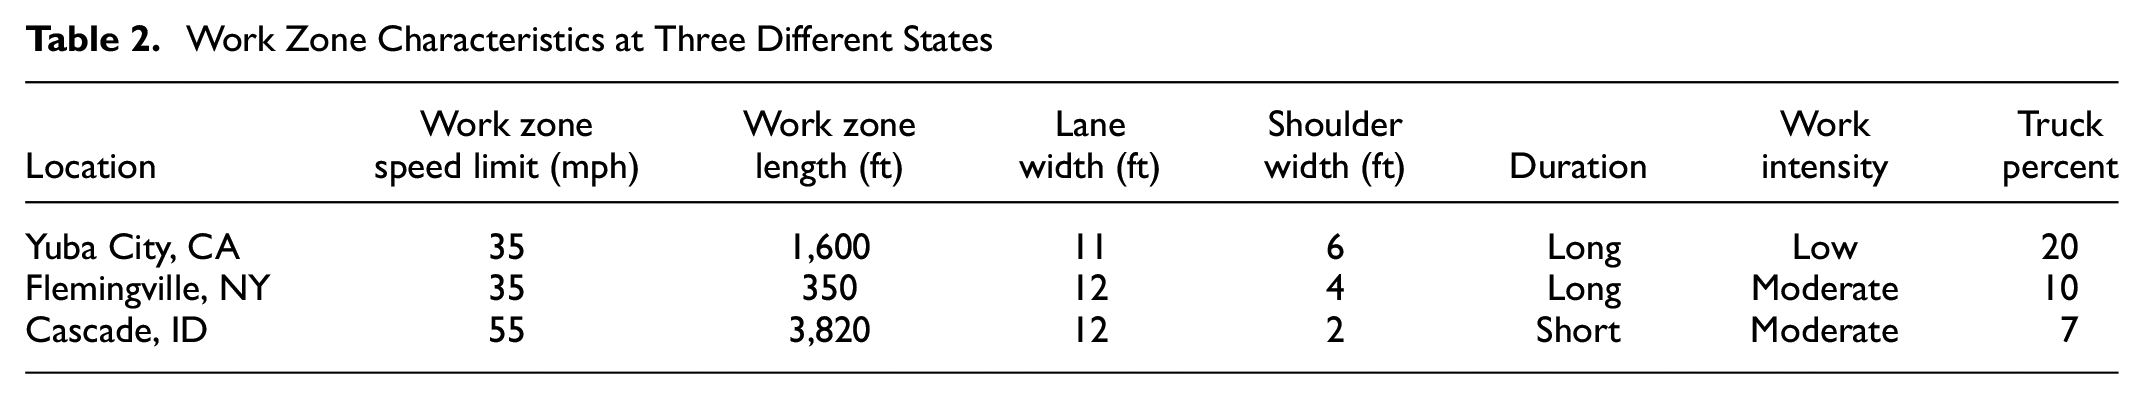
Data were collected during a nationwide work zone training class conducted by the researchers. Each state was asked to provide real-world traffic data for one-lane operation on two-lane highway work zones. Data from three states, as shown in Tables 1 and 2, are used in this paper. Table 1 summarizes the directional distribution traffic and Table 2 gives the traffic volumes. Directional distribution for most peak hours is not 50%, and some of them are 65%–70%. Therefore, it is important to consider the directional distribution of traffic when finding a phase plan for a one-lane operation on two-lane highways.
Directional Distribution of Traffic in Work Zones in Three States
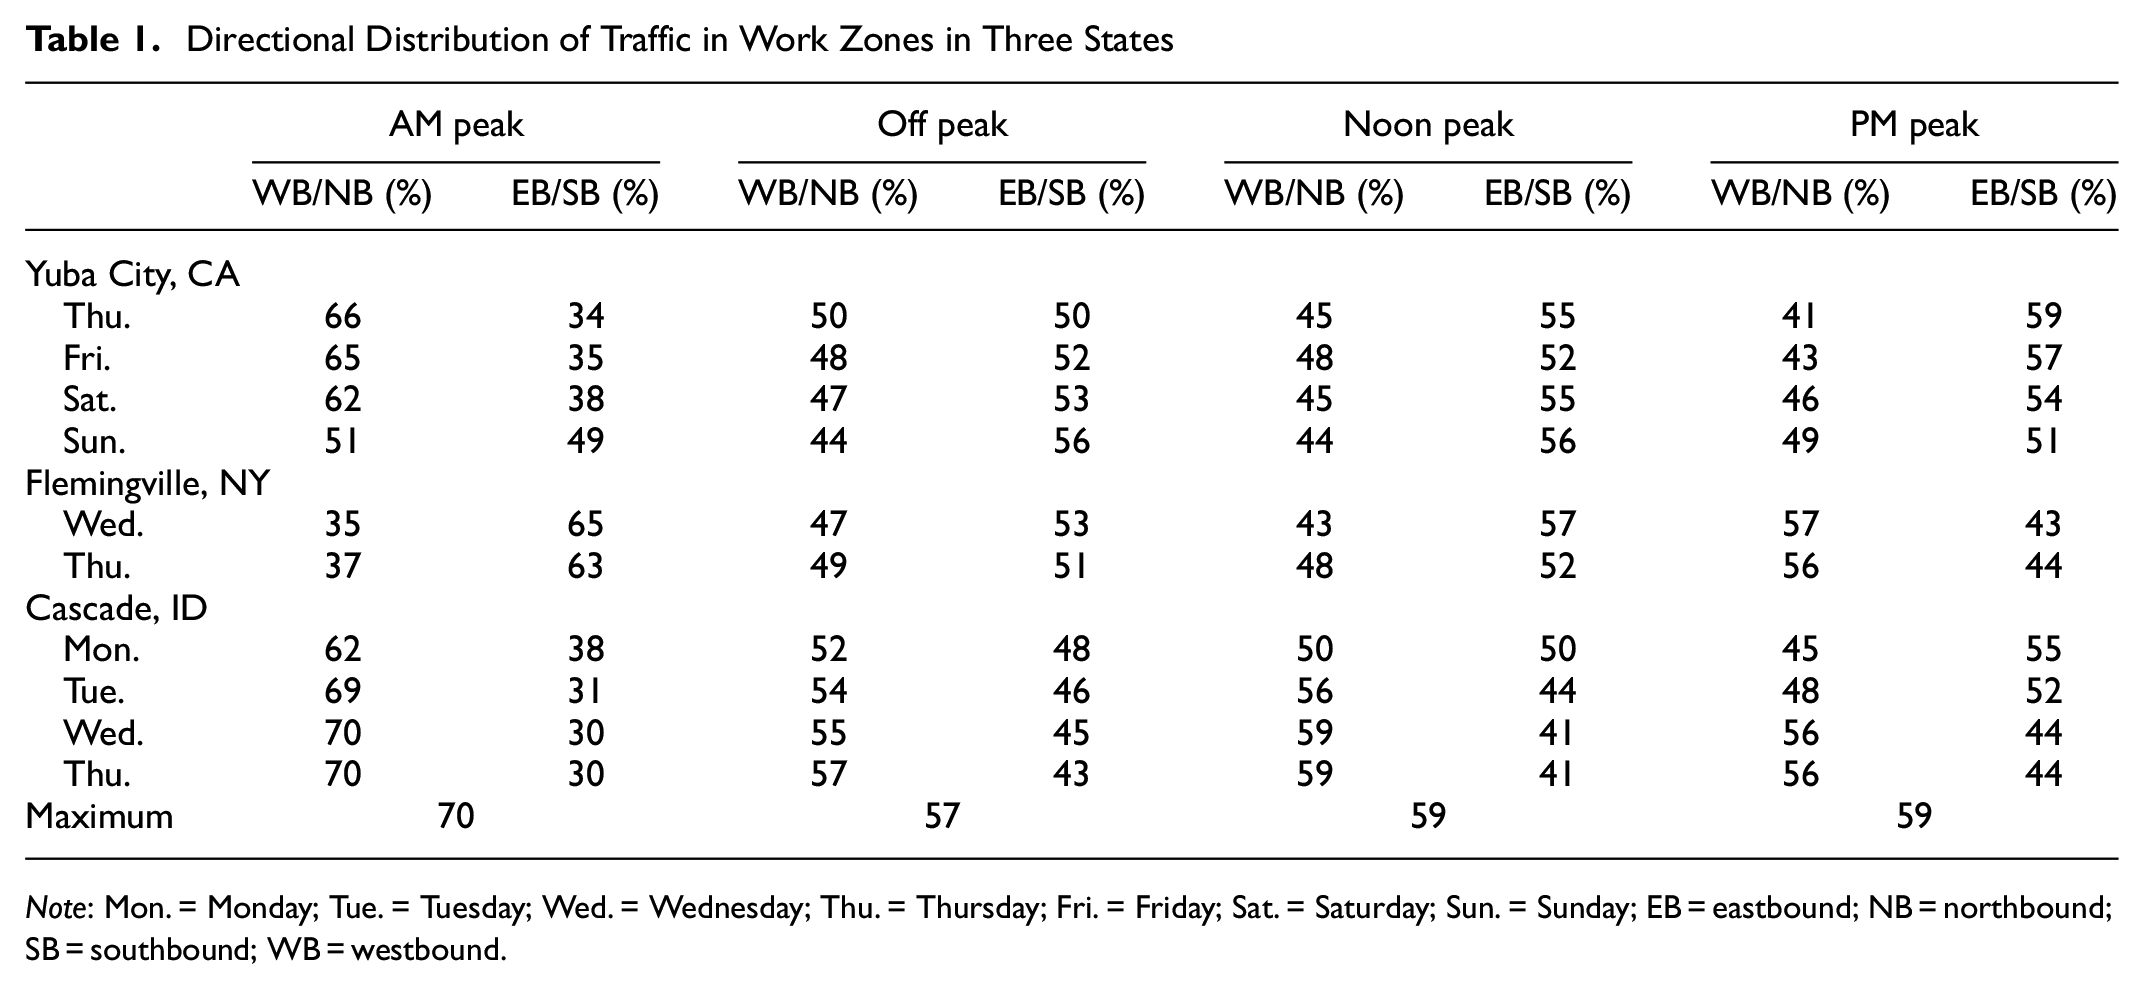
Note: Mon. = Monday; Tue. = Tuesday; Wed. = Wednesday; Thu. = Thursday; Fri. = Friday; Sat. = Saturday; Sun. = Sunday; EB = eastbound; NB = northbound; SB = southbound; WB = westbound.
Work Zone Characteristics at Three Different States
Methodology
A typical work zone set up on a two-lane highway is a one-lane two-way operation. The temporary traffic signals are operated as a two-phase signal. In rare cases, a side street comes in the middle of the one-lane section and the signal operation resembles the operation of a three-phase directional signal. With the one-lane operation, only one approach is allowed to move while all other directions are stopped. So, it is important to allocate green time appropriately so there is no waste of it. In the one-way operation, a cycle failure means the vehicles in the queue do not clear during the green time, and the remaining motorist must wait two or three road clearance times. Excessive delays can cause drivers to become frustrated and ignore traffic control devices, creating a potentially unsafe driving situation. Therefore, it is important to avoid cycle failure with an optimal signal operation.
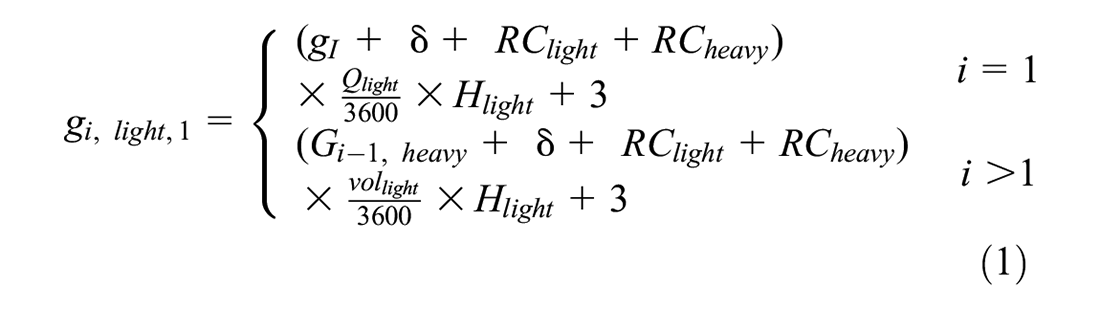
WZQ-Pro uses a methodology that considers adjusted free-flow speed, travel length, and road clearance time, in addition to the signal timing element. Adjusted free-flow speed considers posted work zone speed limit, lane width, shoulder width, work intensity, and speed control technique. Travel length considers acceleration rate to reach adjusted free-flow speed. Road clearance times are computed for both closed direction(s) and open direction, which consist of start-up lost time, acceleration time, and travel time of the work zone length. Considering all these factors, the program suggests an initial green time allocation that can be changed by the user. The suggested initial green time is a starting point. It is found by an iteration process that minimizes the queue length, as described below. Before going into details, light direction, and heavy direction require to be determined. Light direction has a smaller volume and heavy direction has a larger volume. It requires running iteration to find the suggested initial green time. Green time for light direction is computed using Equations 1 and 2. Each

where
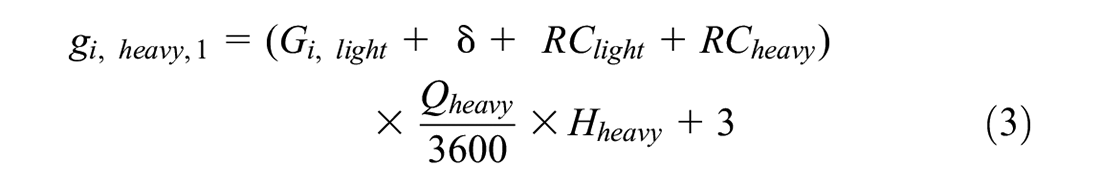
Similarly, green time for heavy direction is computed using Equations 3 and 4.

where
Cycle length is computed using Equation 5 for each iteration.

where
The stopping criterion for the iteration is shown in Equation 6.

The calculation sequence starts from Equations 1 to 5, consecutively. Once Equation 5 finishes, then check if Equation 6 is satisfied or not—if it is not satisfied, then the process starts from Equations 1 to 5 again until Equation 6 is satisfied. Once Equation 6 is satisfied, then
The proposed methodology is implemented for multi-period analysis in WZQ-Pro for one-lane two-way operation on two-lane highway work zones. In multi-period analysis, the leftover queue is added to the volume in the next analysis period. Figure 1 shows an example output from WZQ-Pro about queue propagation and shrinkage.
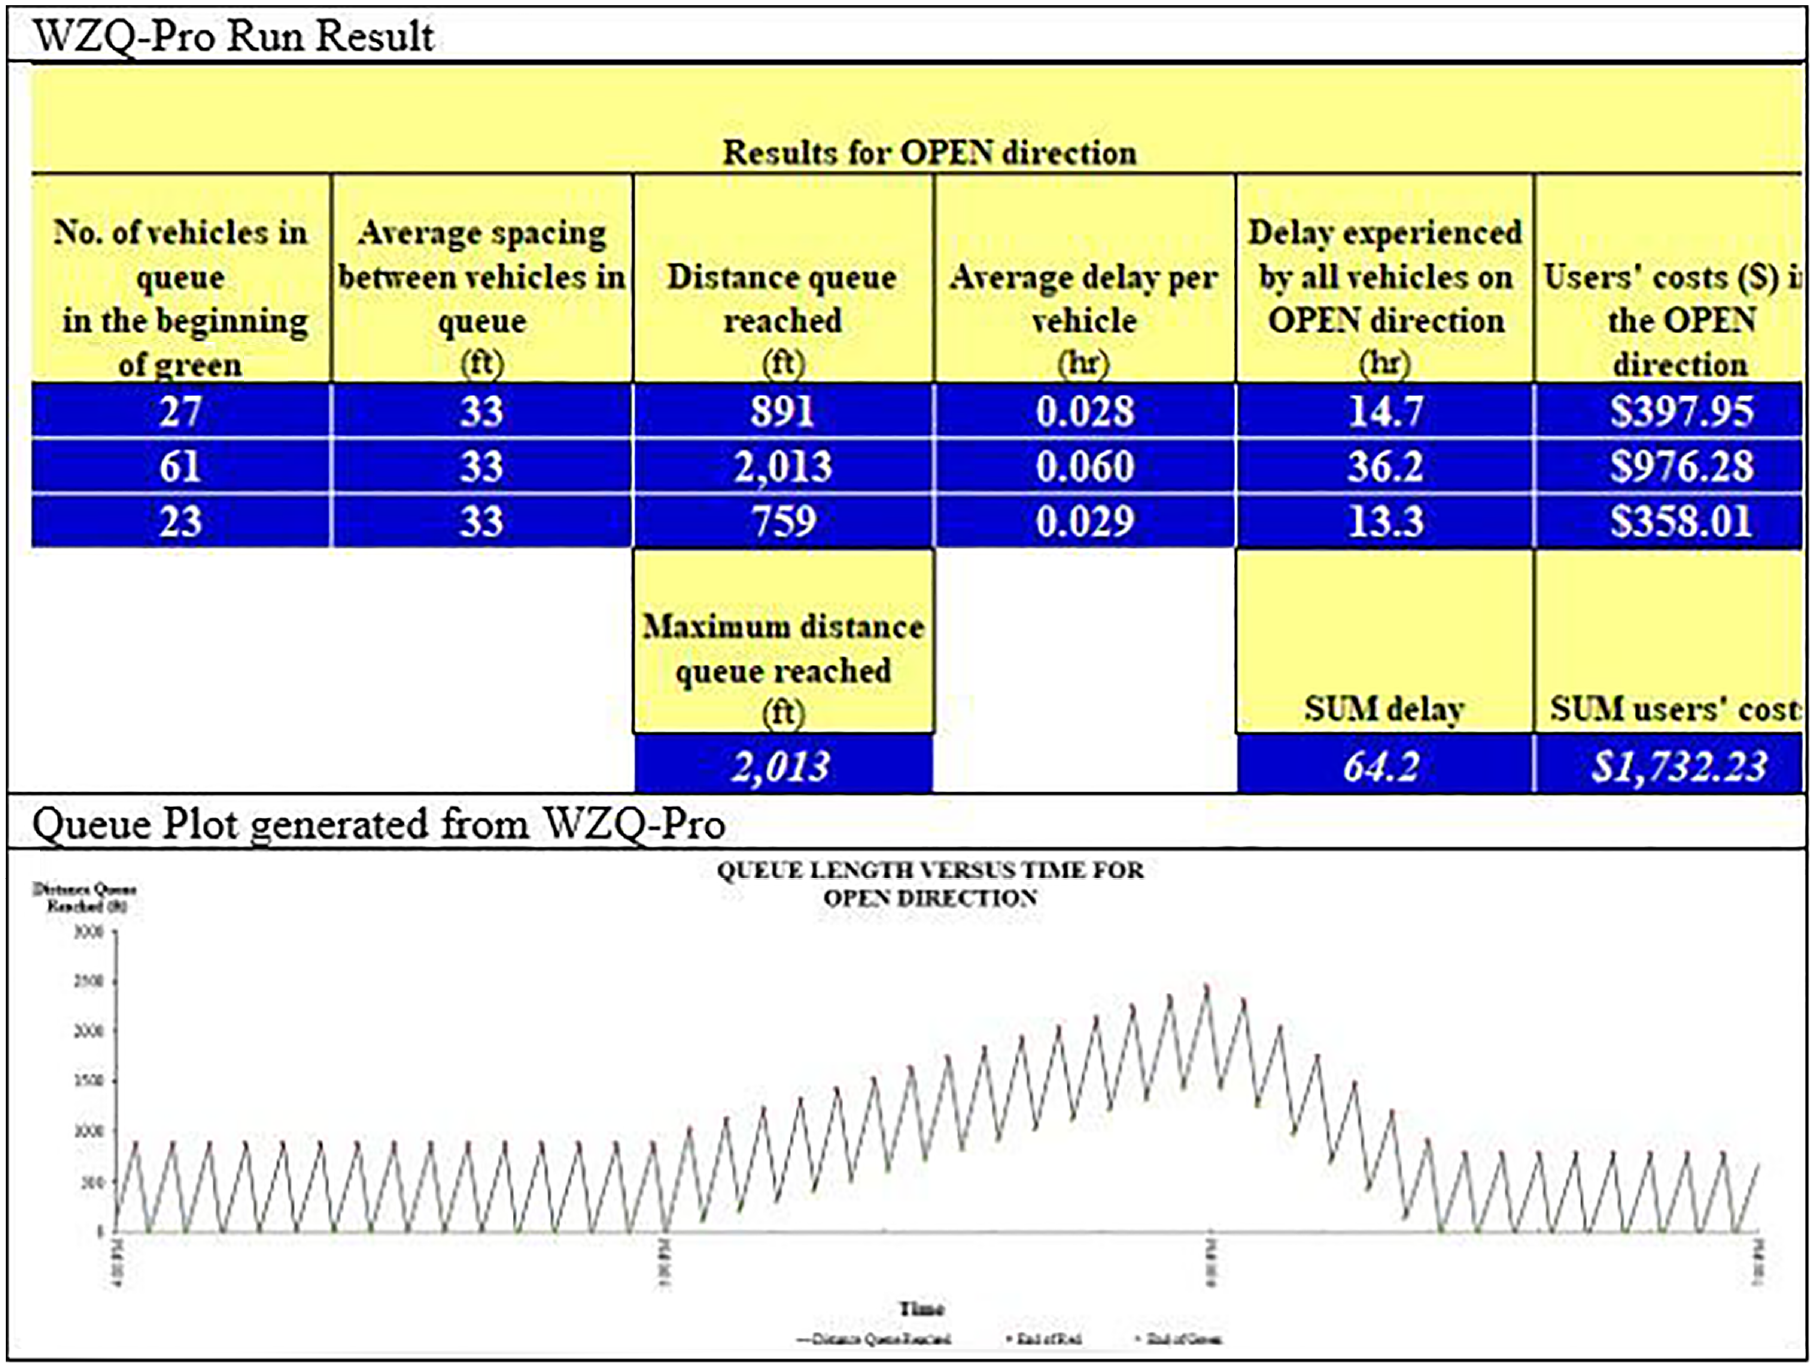
Example of queue length plot provided from WZQ-Pro.
Comparison
The model results are compared with optimal green times computed by the HCM 2016 (which is the same as HCM 7th Edition) procedure. The fully utilized HCM 2016 procedure is used to compare with the WZQ-Pro model. The fully utilized HCM 2016 procedure uses green time computed in HCM 2016. First, start with a green time for each direction and update each green time until the cycle length is converged. Converged green time is used for the optimal phase plan computed by the HCM 2016 procedure and results are compared with the model used in WZQ-Pro. Table 2 shows the real-world work zone setup used for the comparison of the WZQ-Pro model with the HCM 2016 procedure. This procedure will be called “HCM 2016 procedure” for further comparison.
Using Table 2 work zone characteristics, the signal timing plans have been computed by both WZQ-Pro and HCM 2016. Table 3 presents the comparison result of the WZQ-Pro model with the HCM 2016 procedure. It shows that the difference in the road clearance time for a short work zone (Flemingville, NY) is about 2–3 s, and the WZQ-Pro model is higher than HCM 2016. However, for a long work zone, the road clearance time computed in the HCM 2016 procedure is too conservative, as shown in Table 3. They are allocating about 14–27 s more road clearance time in each direction, which would significantly increase queue and delay.
Road Clearance Time Computation Comparison between WZQ-Pro Model and Highway Capacity Manual (HCM) 2016 Procedure
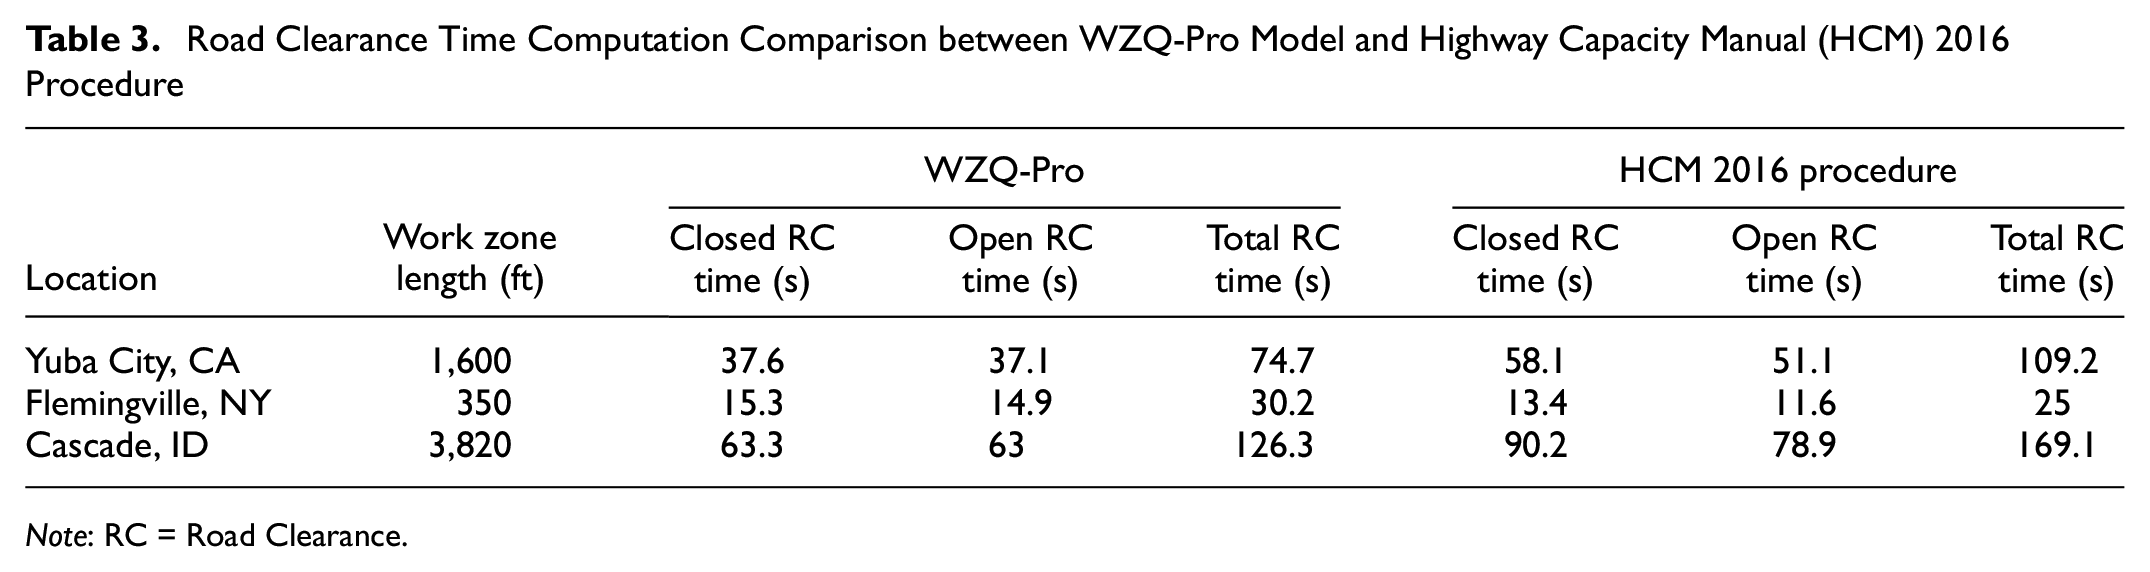
Note: RC = Road Clearance.
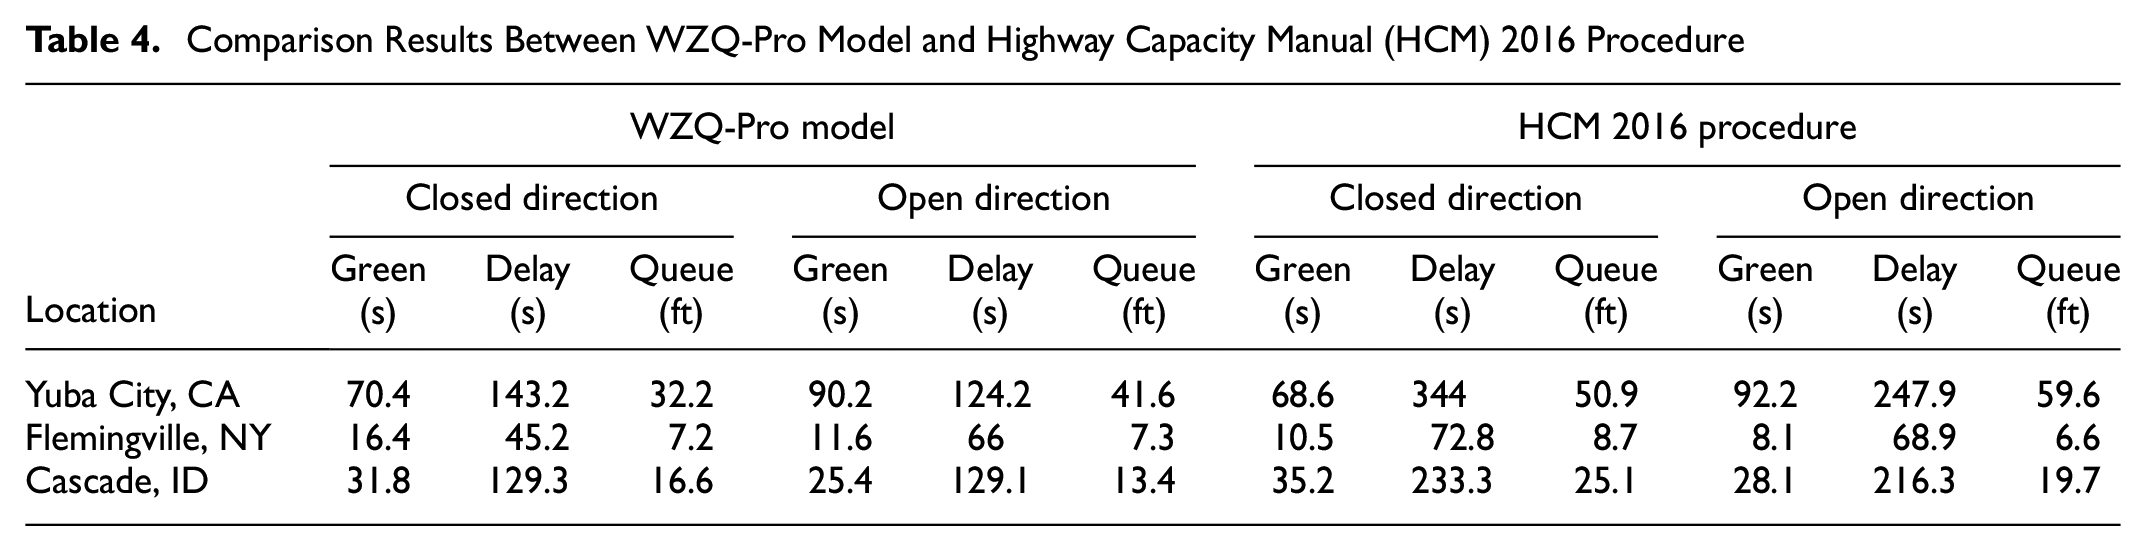
To provide a comparison, delay and queue are obtained from Highway Capacity Software (HCS7) runs ( 20 ). Since road clearance times computed by the HCM 2016 procedure in Yuba City, CA, and Cascade, ID, are larger than the WZQ-Pro model, the WZQ-Pro model outperformed the HCM 2016 procedure. For the short work zone in Flemingville, NY, HCM 2016 yielded shorter road clearance times than the WZQ-Pro model, but delays were higher and queue lengths showed mixed results; the closed direction had 1.5 vehicles less in a queue, but the open direction had 0.7 vehicles more in a queue. The results confirm that the green time allocation suggested in the WZQ-Pro model is appropriate for the work zones. A detailed analysis of comparison results is shown in Table 4.
Comparison Results Between WZQ-Pro Model and Highway Capacity Manual (HCM) 2016 Procedure
Validation Using Vissim Simulation
Another approach to validate the WZQ-Pro model is using the simulation package Vissim. Vissim has been programmed to match traffic operating conditions under one-lane two-way operation. Additionally, the saturation flow rate is adjusted to match with work zone geometric configuration by updating the average standstill distance, additive part of the safety distance, and multiplication part of the safety distance in Vissim. After matching the adjusted saturation flow rate, the Vissim simulation result using the WZQ-Pro phase plan is compared with the WZQ-Pro model result. Similarly, the Vissim simulation result with the HCM phase plan is compared with the HCM model result. Because of assumptions such as uniform arrival used in the WZQ-Pro model and the HCM model, the research team does not expect Vissim simulation results to exactly match with WZQ-Pro model results. Figure 2 shows the number of stopped vehicles used in both phase plans from the WZQ-Pro model and the HCM model.
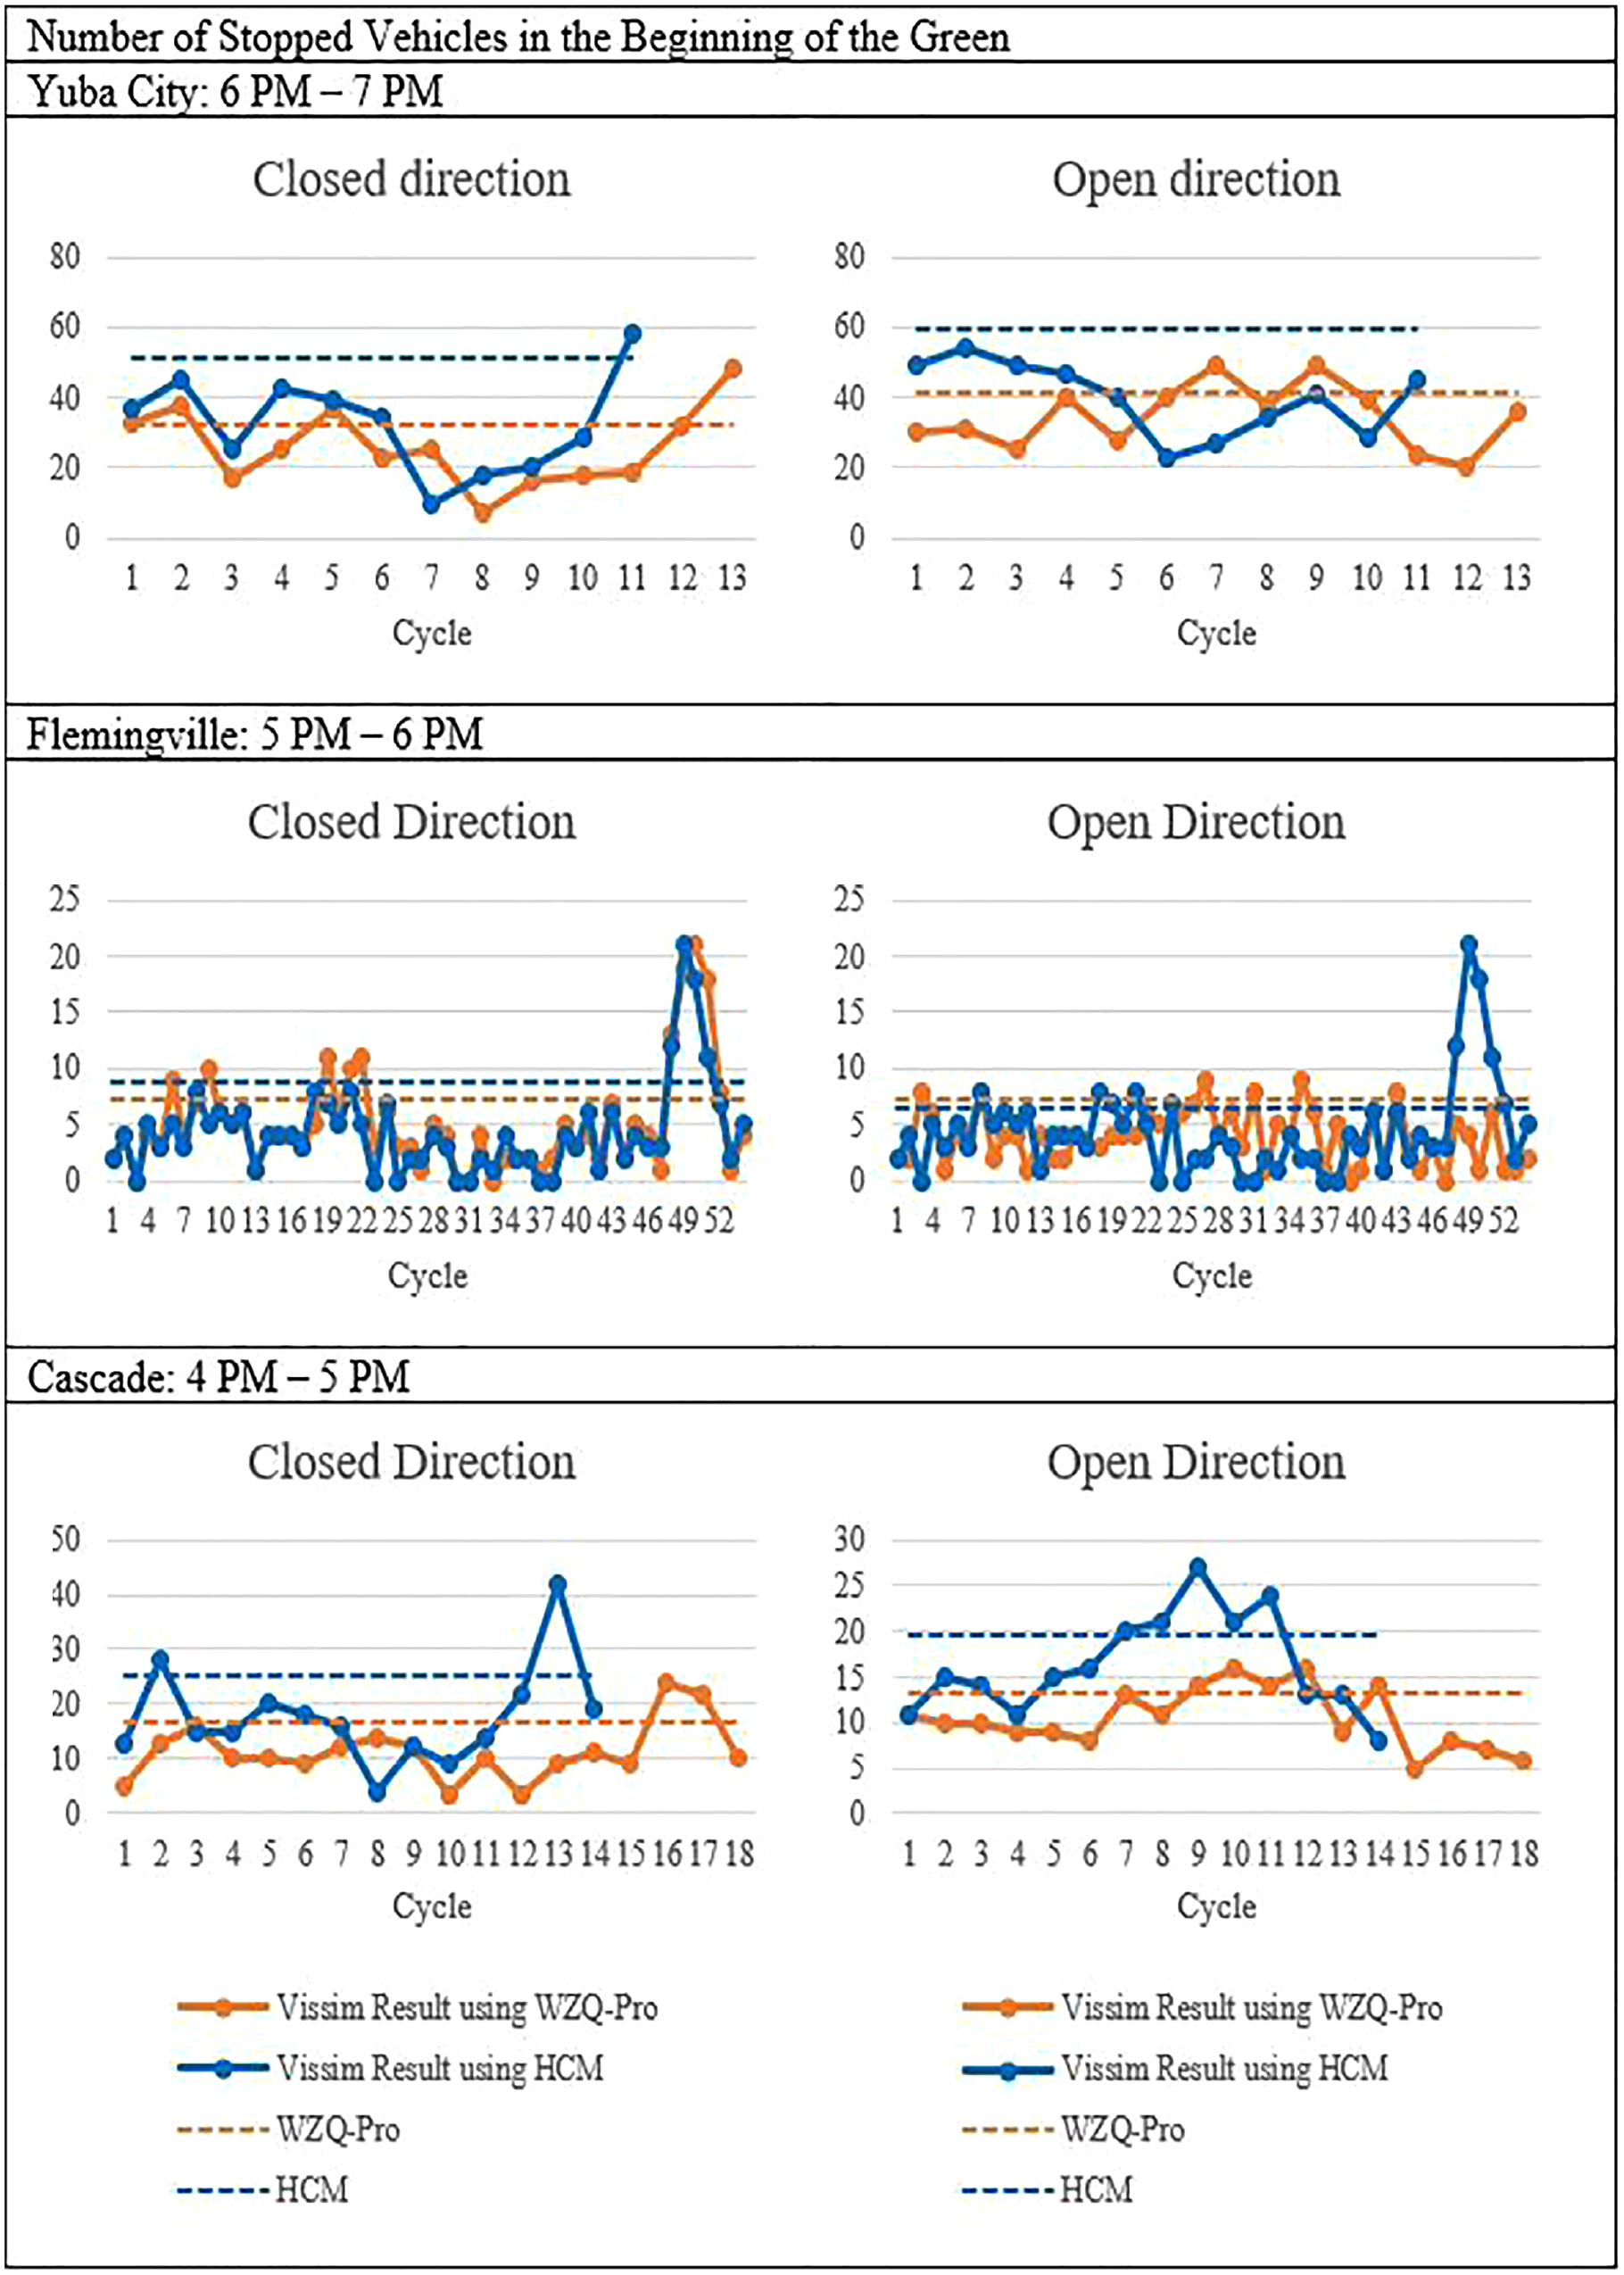
Vissim simulation results in comparison with WZQ-Pro phase plan and Highway Capacity Manual (HCM) phase plan.
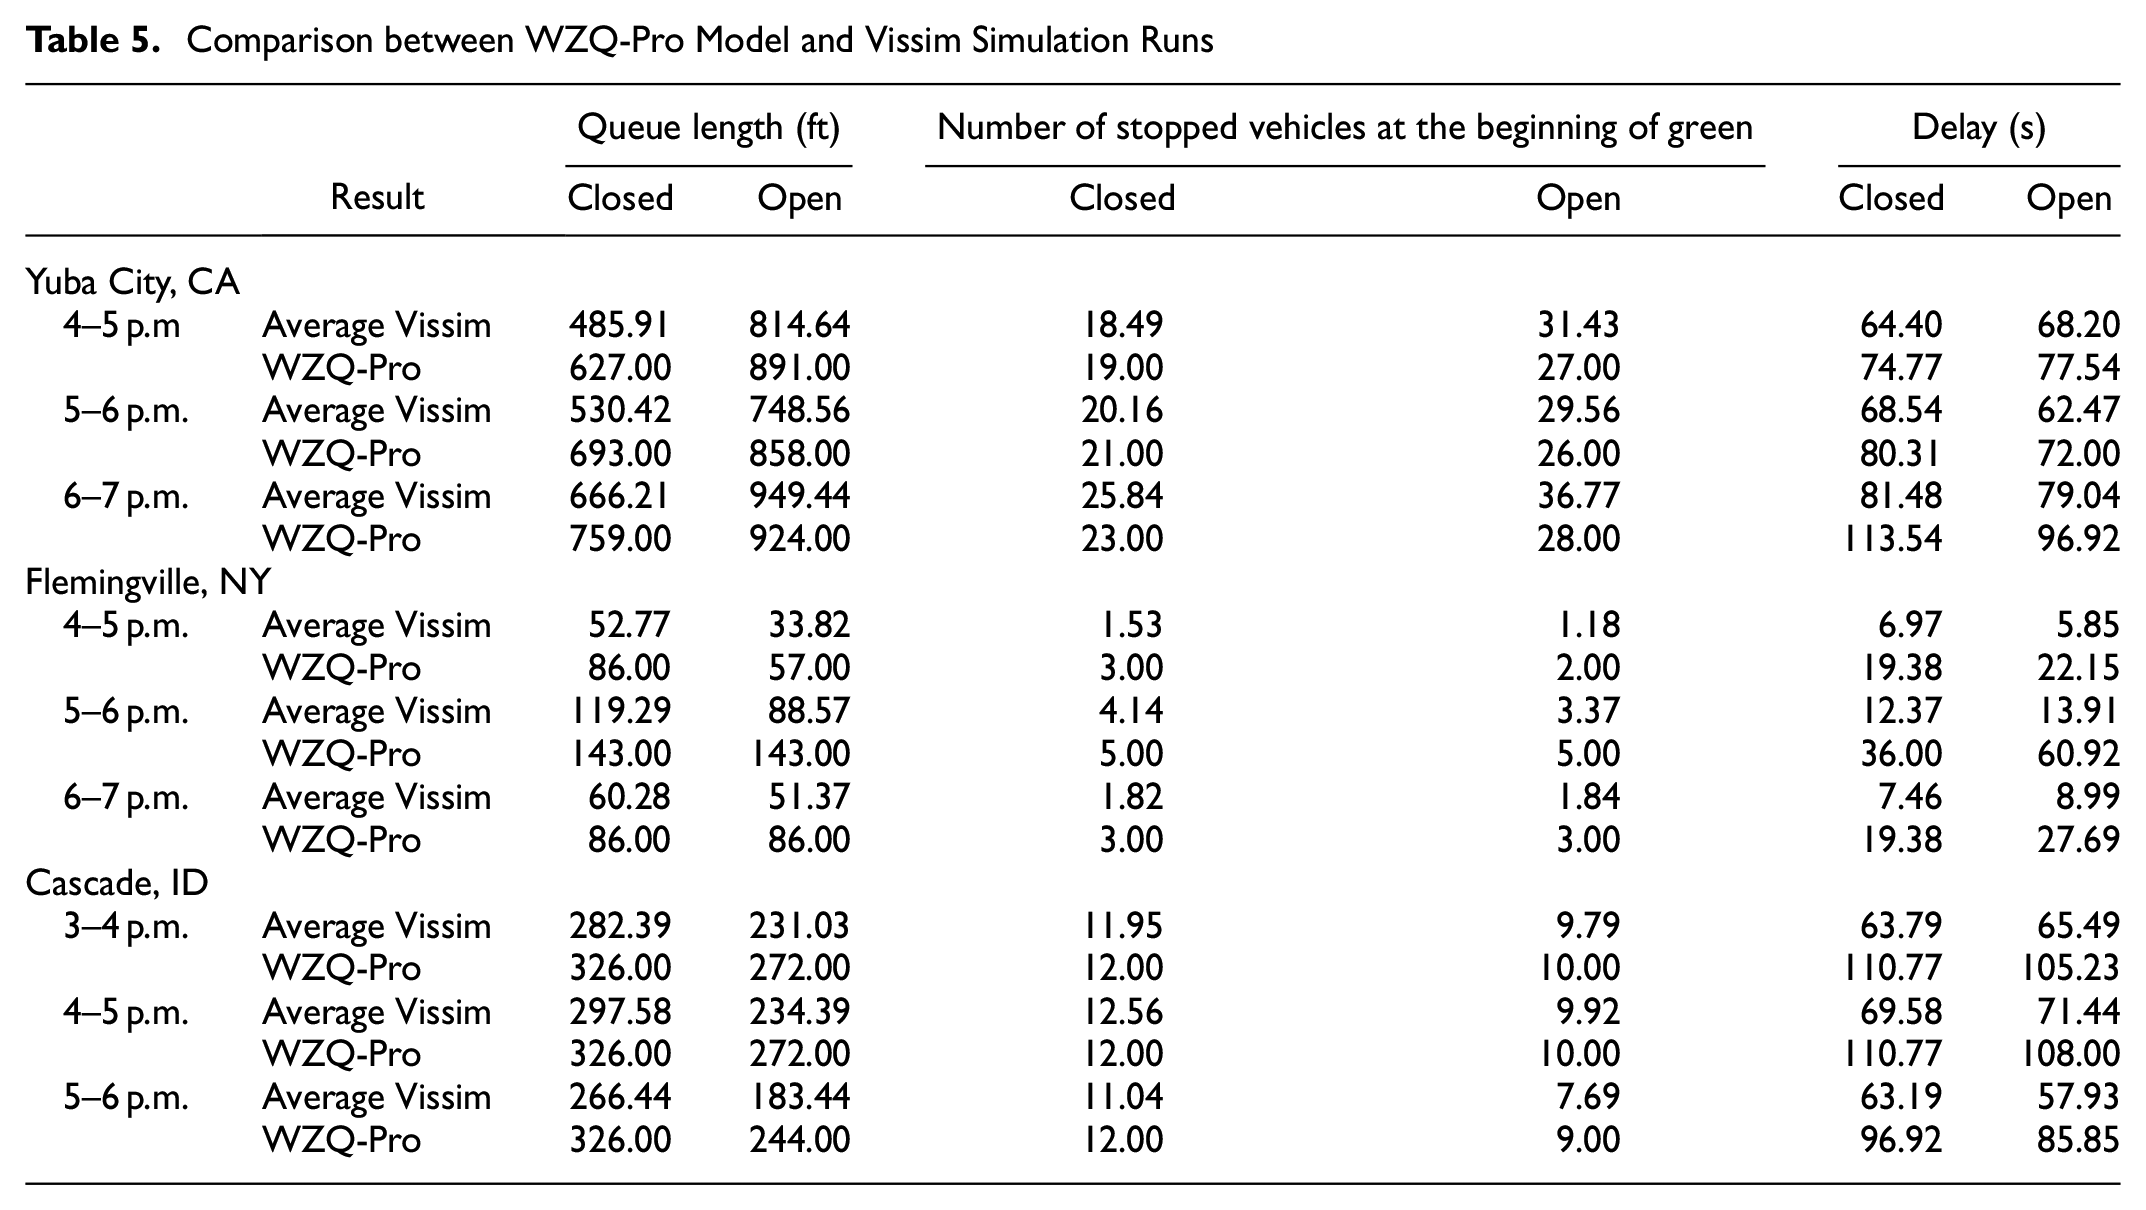
Even though the Vissim simulation results do not match exactly with both WZQ-Pro and HCM model results, as expected, the Vissim simulation results show the range of WZQ-Pro and HCM results. Furthermore, Vissim simulation results were compared with the WZQ-Pro model for more analysis periods. Table 5 shows the comparison between the WZQ-Pro model and Vissim simulation results. They are not exactly matching, as expected, but it shows that the average of simulation results is relatively close to the WZQ-Pro result.
Comparison between WZQ-Pro Model and Vissim Simulation Runs
Lastly, the WZQ-Pro result with cycle failure caused by inputted phase plan was compared with the Vissim simulation result. In Figure 3, there was a cycle failure in the open direction while the closed direction did not see any queue backup.
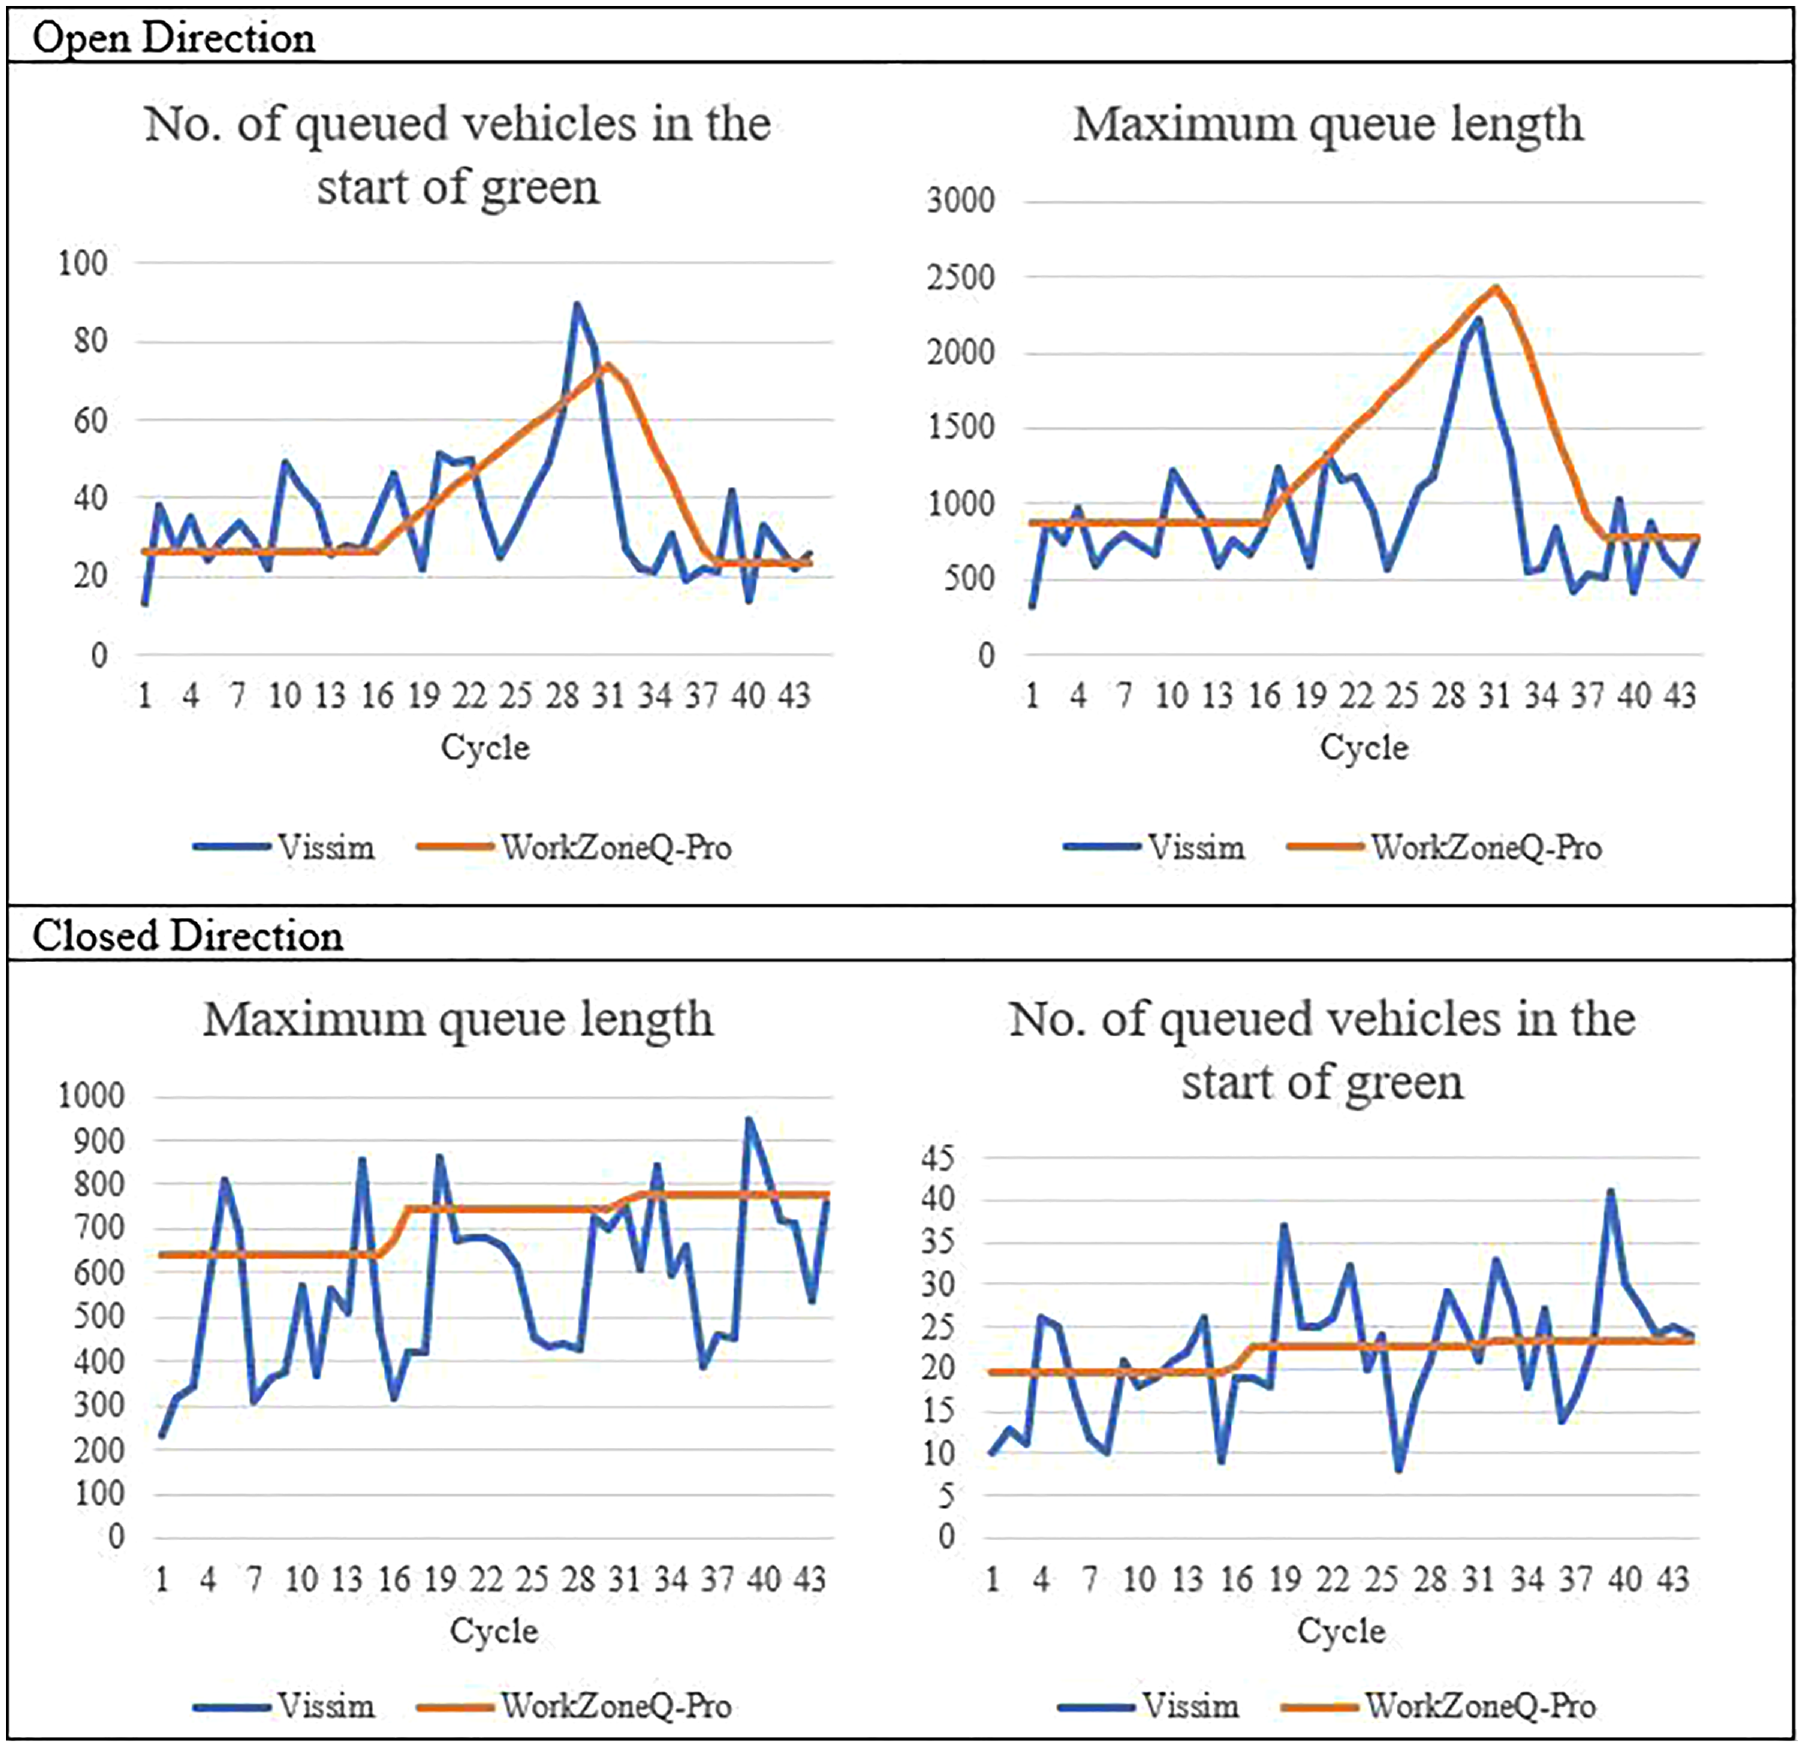
Vissim simulation results in comparison with WZQ-Pro results during a cycle failure scenario.
Conclusions
The results from WZQ-Pro are compared with those computed from the fully utilized HCM 2016 procedure. The WZQ-Pro procedure yielded more efficient signal timing operation for work zones that are longer than 350 ft. For shorter work zones, WZQ-Pro resulted in a lower delay, but mixed results in queue length. In comparison with the microsimulation package, Vissim result shows that WZQ-Pro finds a reasonable estimate of one-lane two-way operation on a two-lane highway.
Footnotes
Author Contributions
The authors confirm contribution to the paper as follows: study conception and design: H. Jeon, R. F. Benekohal; data collection: H. Jeon; analysis and interpretation of results: H. Jeon, R. F. Benekohal; draft manuscript preparation: H. Jeon, R. F. Benekohal. All authors reviewed the results and approved the final version of the manuscript.
Declaration of Conflicting Interests
The author(s) declared no potential conflicts of interest with respect to the research, authorship, and/or publication of this article.
Funding
The author(s) received no financial support for the research, authorship, and/or publication of this article.