
Abstract
Machine learning (ML) solutions have been proposed to make public transportation more attractive. Works that employ ML in bus transportation focus on various problems, such as travel time prediction or passenger flow prediction. These solutions look to improve elements of transportation services, such as the availability of information on passengers’ travel time and the reliability and regularity of the service. An analysis of the solutions proposed in the literature for public transportation by bus can reveal opportunities for data scientists and transportation professionals, and highlight problems that have been only slightly explored. In addition, mapping information about modeling these solutions (e.g., types of data produced by devices on the transportation network, which can be used in modeling a solution) could help beginner data scientists develop public transportation solutions. Transportation professionals can benefit from an overview of possible transportation solutions to improve transportation problems and direct government agency efforts to implement these solutions. This paper presents a survey of ML-based solutions for public bus transportation and details the modeling of these solutions (e.g., data types, ML algorithms). In addition, the problems tackled in the literature are categorized into four themes, and the solutions proposed to deal with them are schematized, highlighting problems that are little explored.
Keywords
In the public transportation domain, including by bus, data collected from transportation network devices can be used to model solutions based on machine learning (ML) ( 1 – 3 ). In this context, ML is used to construct solutions to minimize problems related to the bus transportation domain, supporting the development of intelligent transportation systems (ITSs) ( 4 ). For example, a travel time prediction can provide information about the duration of a bus trip, enabling better travel planning ( 5 , 6 ). On the other hand, passenger flow prediction and passengers count solutions may provide information to assist in companies’ operational planning ( 3 , 7 ). These solutions try to improve elements of the transportation service, such as the availability of information on passengers’ travel time, the reliability and regularity of the service, and others that influence users’ perceptions in measuring the satisfaction with the service provided.
A survey of various solutions for public transportation by bus proposed in the literature employing ML and how they were modeled (e.g., data types and ML techniques) can reveal opportunities for data scientists and transportation professionals, and highlight the problems that have been little explored. In addition, data scientists new to the development of solutions for public transportation can benefit from mapping information about this domain, such as the devices available on the transportation network, the data types they produce, and which data types could be used to construct the solution. Transportation professionals can benefit from an overview of what solutions can be used to solve public bus transportation problems and strategically direct the efforts of government entities or companies to implement these solutions. Therefore, this work aims to present a survey on the use of ML for constructing solutions in public transportation by bus domain.
We used the systematic literature review (SLR) methodology to conduct our survey. We gathered from the literature several problems pointed out by different works, such as the absence of more realistic information for passengers, inadequate operational planning by transportation companies, bus bunching, and so on. We grouped the problems into four main groups: “bidding procedure,”“operational planning,”“operational control,” and “passenger demand.” For each problem, we mapped the solutions presented by the analyzed works. We classified these solutions into two main groups: the most recurrent solutions, such as “travel time prediction” and “passenger flow prediction,” and the less recurrent ones, which had only one work retrieved. To deepen the analysis of using ML algorithms, we also presented an overview of the sources and data types used in modeling these solutions and detailed the algorithms and ML methods used to build these solutions.
The main contributions of our survey are as follows: (1) provide a catalog of ML-based problems and solutions related to the bus transportation domain; (2) outline the data sources that can be used in the modeling of solutions; (3) identify the ML algorithms adopted; (4) show opportunities and challenges for solutions; (5) encourage new researchers to build solutions for the domain of public transportation by buses, exploring existing lines of research or proposing new solutions based on insights obtained through the reading of this survey.
Related SLR
Other literature reviews and surveys have already addressed ML-based solutions for transportation (Table 1). In the literature, we did not find any work specifically focused on reviewing ML-based solutions for bus transportation. The reviews and surveys that addressed ML-based solutions were aimed at transportation in general, including bus transportation solutions. We can point out that the most significant differential of this SLR is the focus on reviewing solutions for transportation by bus. In addition, we provide a feature-based comparison that summarizes other survey differences. We consider the following features in this comparison: ML traditional algorithms (MLTAs) indicates works that discuss the use of traditional ML algorithms (e.g., k-nearest neighbor [k-NN], random forest [RF]) in the construction of solutions; deep learning (DL) indicates works that discuss the use of deep neural networks (DNNs) in the construction of solutions; and the analysis of data sources (ADS) indicates works that discussed the data types used in the construction of the solutions. In this comparison, we also used three levels to characterize the scope of the works and the defined features (features not assessed, briefly assessed, and assessed in depth by the compared works).
A Comparison of Surveys Related to this Survey
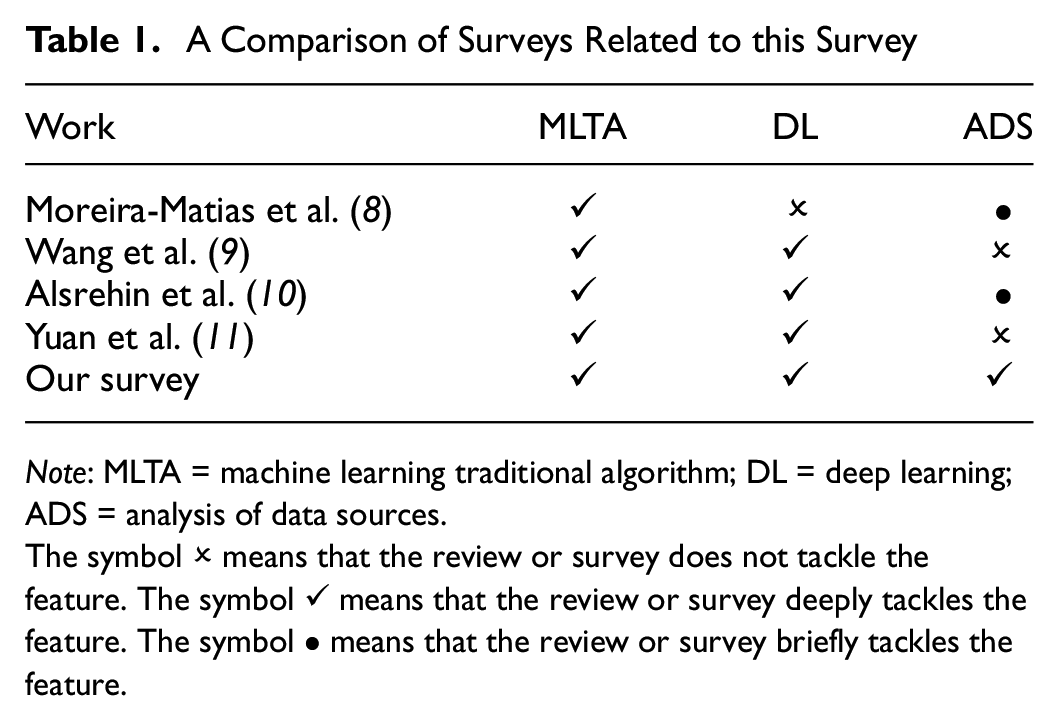
Note: MLTA = machine learning traditional algorithm; DL = deep learning; ADS = analysis of data sources.
The symbol ✗ means that the review or survey does not tackle the feature. The symbol ✓ means that the review or survey deeply tackles the feature. The symbol • means that the review or survey briefly tackles the feature.
Moreira-Matias et al. ( 8 ) analyzed solutions to improve the planning and control of public road transportation using automatic vehicle location (AVL) data. However, only the ML-based travel time prediction solution was deeply addressed, not showing a comprehensive view of public transportation by bus solutions. Wang et al. ( 9 ) and Alsrehin et al. ( 10 ) focused on employing DL models to build solutions for the transportation network, not specifically for buses. Wang et al. ( 9 ) surveyed how DL models (e.g., traffic sign recognition, traffic flow prediction, traffic congestion prediction, traffic signal control, etc.) have been applied in transportation applications. Only the prediction of passenger demand was mentioned in public transportation by bus.
Alsrehin et al. ( 10 ) focused on traffic management approaches (e.g., traffic flow prediction, travel time prediction, traffic density prediction, counting of real-time pedestrians) that employed data mining and ML. Passenger flow prediction, travel time prediction, bus routing optimization, and evaluation of driver distraction were some solutions discussed in the scenario of public transportation by bus. Yuan et al. ( 11 ) explored how ML was applied to many ITS applications and services. The ITS tasks were categorized into perception tasks (e.g., traffic sign, marking recognition, and obstacle detection), prediction tasks (e.g., traffic prediction, travel time prediction, predicting pedestrian actions), and management tasks. When considering buses, only time travel prediction was addressed. Therefore, none of these works explicitly focused on bus transportation problems, investigating solutions based on ML, or the data sources employed in building these solutions.
Our SLR Methodology
This section details the steps used for planning and conducting the SLR. The SLR was conducted based on the procedure established by Kitchenham ( 12 ), considering the planning, conducting steps, and presenting of the results. The purpose of this SLR was to answer the following research questions.
Q1: What are the public bus transportation problems being addressed with ML-based solutions?
Q2: How can the proposed solutions be categorized?
Q3: What data sources/types were used in the construction of these solutions?
Q4: What were the ML algorithms used to build these solutions?
To answer these research questions, seven digital libraries were used to search for works—ACM, IEEE, El Compendex, Web of Science, Science Direct, Scopus, and MDPI—and the following search string was used: (“Public Transport” OR “Mass Transit” OR “Public Transportation”) AND (“Machine Learning”). This search string aims to return the works in the literature that used ML techniques (e.g., regression, cluster classification) to build solutions for public transportation. In digital libraries, retrieved papers had incidences over the title, abstract, or keywords. The type of bus transportation was not specified in the search string so as not to exclude works that use more generic terms (e.g., public transport) in these parts of the document.
As an inclusion criteria, papers from journals or conferences that proposed ML-based solutions to problems related to bus transportation were considered. Based on these criteria, all works that used ML techniques as a central part of the proposal were considered. The exclusion criteria were as follows: papers that did not address urban mobility problems in the context of bus transportation; papers where the proposed solution did not employ ML techniques as a main part of the solution; papers that addressed temporary solutions for bus transportation during the SARS-COVID-19 pandemic; papers that were not written in English; and papers not available in full format.
During the search, only papers published between 2015 and 2021 were considered. In total, 549 works were retrieved and stored in the Parsifal (a tool to support the planning and execution of systematic reviews; available at: https://parsif.al). With this tool, 203 works were removed by duplication. Subsequently, the 192 remaining works were analyzed by reading the abstracts, and 154 were discarded according to this work’s inclusion and exclusion criteria. The discarded works were organized into four groups. The first group includes works discarded because they are not directly related to urban mobility, such as the work done by Kumar and Aggarwal ( 13 ), who used ML methods and tweets to analyze women’s safety in different vulnerability situations. The second group includes works discarded for addressing other issues related to urban mobility, such as the work done by Kim ( 14 ), which used data collected from automatic bus collection systems to identify the structure of cities.
The third group includes works excluded because they deal with problems related to other transportation systems (e.g., bike, rail). The fourth group includes works that addressed bus transportation problems but were discarded because they did not employ ML techniques or secondarily used ML techniques in the solution. For example, Wongthai et al. ( 15 ) presented a mobile application to provide passengers with information about the route using various technologies (e.g., Internet of Things, Google Maps). However, no ML techniques have been applied to produce this information for passengers. The authors only indicate that ML techniques can be applied to the data collected by such an application. Finally, of the 48 works we considered related to our scope, eight were discarded because they were not available in the full version at our institution. Thus, 40 works were selected for full reading, and the results are presented below.
Survey Structure
This paper is organized as follows (Figure 1): the second section presents the problems and solutions related to the public bus transportation domain; the third section presents how solutions are categorized; the fourth and fifth sections provide an overview of the data sources and types as well as the algorithms used in model construction; the sixth section discusses some opportunities and challenges in the most and less recurring solutions explored in the literature, and finally, the seventh section concludes this SLR.
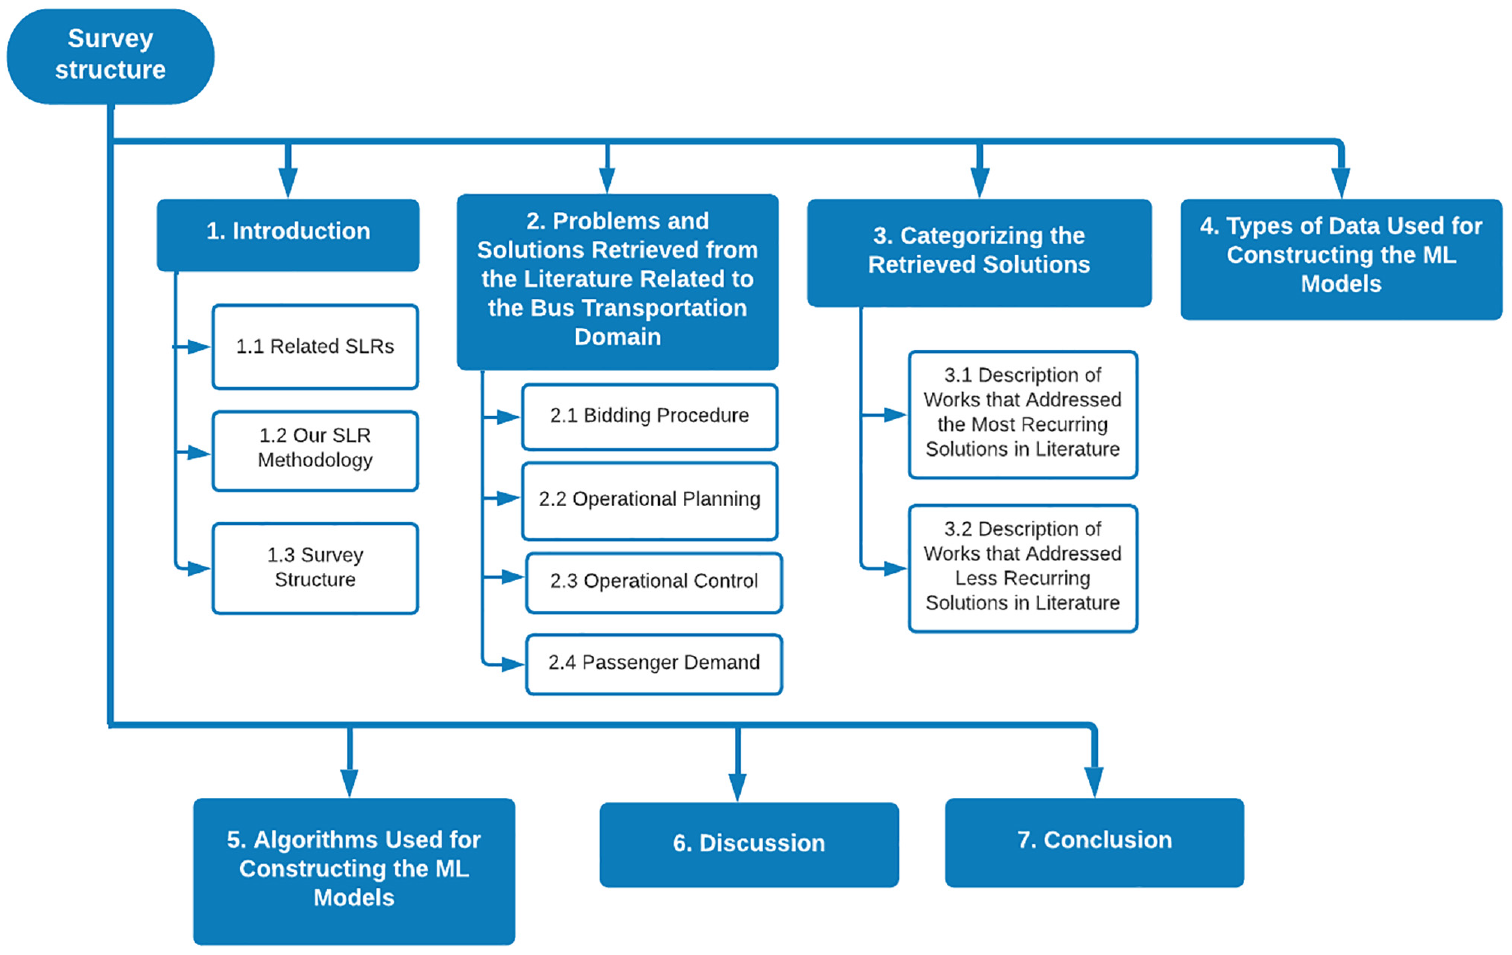
An overview of the structure of this paper.
Problems and Solutions Retrieved From the Literature Related to the Bus Transportation Domain
This section details the problems and solutions found in ML research for bus transportation in the literature. So, RQ1 is answered in this section. The problems encountered were categorized into four themes:
bidding procedure;
operational planning;
operational control;
passenger demand.
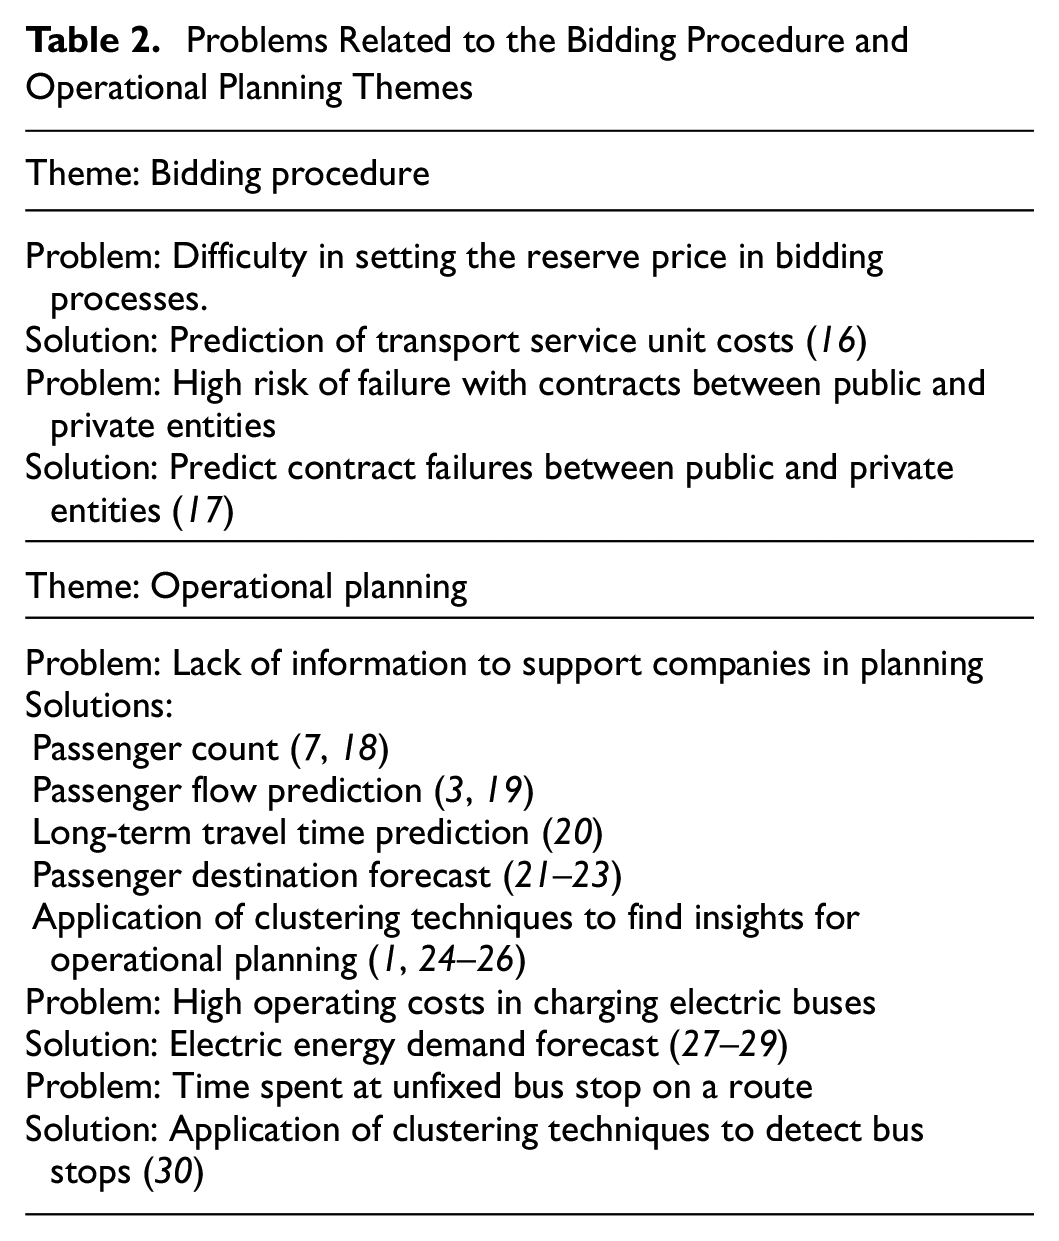
These themes are considered a sequence of steps starting from designing and offering the public transportation service to companies interested in managing all the steps and expected to provide a service with quality. The management of this service includes planning, executing, and observing the stakeholders’ demands during the contract term. These themes were inspired by the plan-do-check-act (PDCA) method. The themes are shown in Figure 2. The bidding procedure deals with problems related to bidding processes carried out by government entities for contracting public transportation services. Operational planning and control groups together issues related to planning and control functions in business management. Finally, passenger demand encompasses service problems that occur from the point of view of passengers using the public services. As this process is similar to the PDCA method, managers can iteratively act correctively and reconduct all the steps. In this context, it is important to identify the main problems tackled in each theme. They could guide transportation professionals in adopting intelligent solutions supported by current methods using ML algorithms. So, Table 2 shows the problems and solutions addressed by works in the literature grouped by bidding processes and operational planning themes. Table 3 shows the problems and solutions grouped by operational control and passenger demand. Below we describe the topics, problems, and solutions related to the outlined topics.

Related themes retrieved from problems found in the literature.
Problems Related to the Bidding Procedure and Operational Planning Themes
Problems Related to Operational Control and Passenger Demand Themes
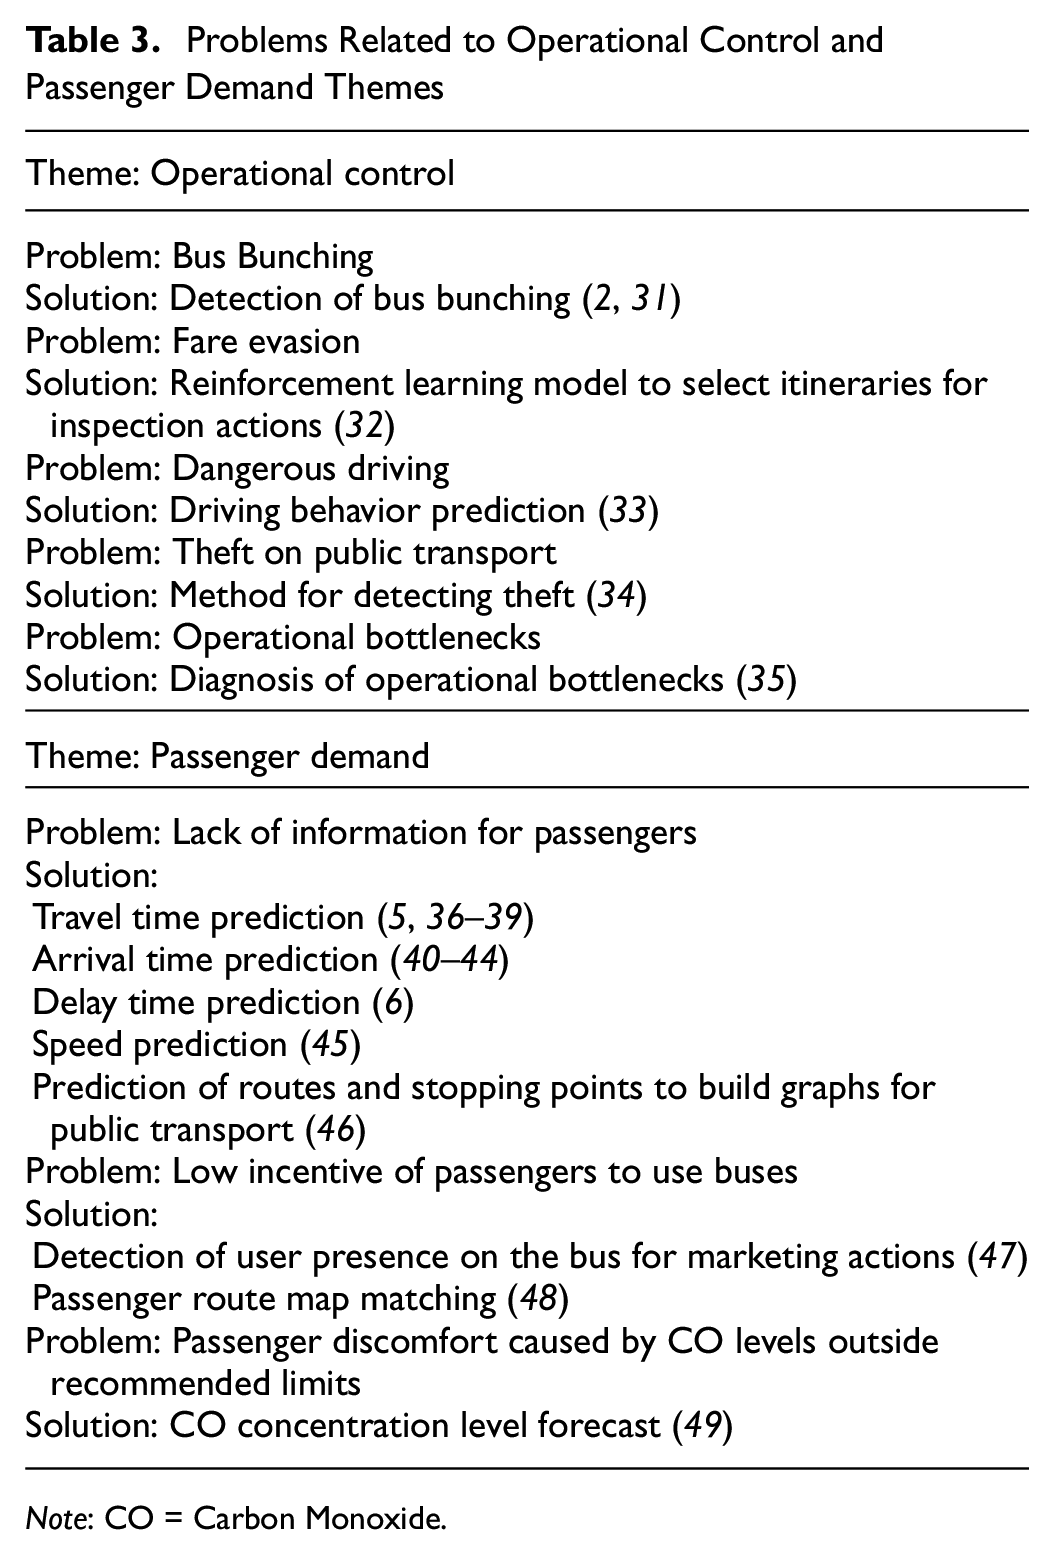
Note: CO = Carbon Monoxide.
Bidding Procedure
Transportation companies can be contracted through a bidding process to provide transportation services in a city. In these processes, the reserve price can be used as a strategy by government entities for more efficient companies to participate in the bidding and for other companies considered less efficient to be blocked. However, determining the appropriate reserve price is not a trivial task. In the literature, Avenali et al. ( 16 ) proposed two ML models to predict the unit cost of the public transportation service considering the main characteristics of the service provided. These models can be a valuable tool for government entities to validate reserve prices in bidding procedures.
Another problem addressed in the literature was the prediction of contractual failure in executing service contracts between public and private entities. These contracts intend to provide better services for public transportation. However, contracting services have a risk of failure that, if discovered in the initial planning stage, can facilitate decision-making by public entities. In this scenario, Wang et al. ( 17 ) focused on understanding factors that included the failure of a contract. They built a ML model to predict the contract’s final status (success or failure).
Operational Planning
Operational planning consists of four main tasks in public transportation by bus that occur sequentially: route design, travel schedule definition, vehicle scheduling, and crew assignment ( 50 , 51 ). The design of routes comprises the definition of lines, routes, and stopping points. When defining travel schedules, buses’ arrival and departure times at bus stops are programmed. Finally, in the vehicle scheduling and crew assignment tasks, the vehicles for each trip and the drivers who will drive these vehicles are respectively defined in these tasks ( 50 ).
In the literature, the solutions focused on defining travel times, scheduling vehicles, and assigning drivers. In these tasks, travel schedules are based on the number of passengers boarding at stopovers, the travel time spent on each trip, and the frequency established for offering the service ( 50 ). The availability of this information for transportation companies is a critical factor for the service offer to be closer to its demand.
Some solutions focus on providing information to help transportation companies in operational planning. Passenger count solutions—predicting the number of passengers who have boarded at stopping points—and passenger flow or demand prediction—predicting the number of passengers who will board at a place and time—provide information for transportation companies to understand the variability of passenger demand (e.g., time range with higher demand, working days × holidays) ( 3 , 7 ). The long-term travel time prediction solution aims to forecast the time needed to travel a route by looking at a time window with more significant advance (e.g., weeks, months) ( 25 ). Finally, the passenger destination forest solution aims to predict the destination of absent passengers on the bases of information collected from automatic billing systems, enabling a better understanding of the behavior of passengers’ travel ( 22 ).
Based on the information obtained from the flow prediction or passenger count, it is possible to investigate whether the frequency of buses on a given line supports the number of passengers who use this service daily. Transportation companies can adjust the service offered (e.g., decreasing or increasing frequency, implementing reinforcements) if necessary. With the travel time prediction, transportation companies can, if necessary, adjust timetables by observing the variability of the time to travel a route. In addition, this information can also help with fleet programming, crew assignment, or actions to restructure the designed routes ( 52 ).
Other solutions applied clustering techniques in databases collected from transportation network devices to find insights for operational planning. Mendes-Moreira et al. ( 25 ) applied clustering techniques using bus location data to understand whether the service schedules (e.g., weekdays and holidays) suit the transportation network studied. Mohamed et al. ( 1 ) focused on understanding urban mobility patterns using two clustering approaches to identify bus station usage patterns and passenger behavior from a time perspective using data collected by the automatic fare collection (AFC) system. Khiari et al. ( 24 ) proposed a framework to automatically select the best number of schedules for a given route by applying clustering as one of the steps of this definition.
Another solution that can contribute to operational planning is detecting stopping points along the route and information on the time spent at these stops. This information can help in travel time prediction, especially in cities such as Ahmedabad, India, where travel time may be affected by not considering stops at unfixed points ( 30 ). Finally, the last solution focused on developing strategies to reduce electric buses’ operating costs, which still is a challenge for transportation companies. In this sense, Nageshrao et al. ( 28 ) proposed an electric energy demand forecast model to develop electric charging strategies and thus reduce the costs involved.
Operational Control
Operational control consists of verifying that the controlled activity is taking place by the adopted plan and the desired results, adopting, if necessary, corrective actions ( 53 ). In this topic, two solutions were found. The first solution aims to detect and correct the occurrence of bus bunching. Bus bunching can cause excess bus passengers and reduced reliability in the service offered. Moreira-Matias et al. ( 2 ) proposed a framework to detect the occurrence of bus bunching in real-time using a combination of an offline and online model to detect the travel time between two consecutive stopping points—link travel times (LTTs). On detecting bus bunching, the framework automatically implements a corrective action.
The second solution classified in this topic focused on the problem of fare evasion faced by public transportation companies. In this scenario, the challenge is to create non-repetitive routes so that evaders do not adapt to the inspection routine of control agents. For this, Delfau et al. ( 32 ) proposed a method for generating optimized scripts for inspecting control agents. In this solution, a reinforcement learning model was used to select some stations to be visited by the control agents.
With respect to the problem of safety in bus transport, two solutions were found. In the first, the authors focused on driving behavior prediction for detecting dangerous driving in public transportation. Some challenges in modeling this solution include the absence of data on accidents (unsafe behavior), high error rates in the methods proposed, and the lack of database attributes collected from the controller area network. The second focused on combating theft using camera images commonly present on buses ( 34 ). The proposed method can identify images with suspicious activities even with the low quality of the images. From these solutions, anomaly detection in the behavior of drivers and passengers is easily detected.
The last problem addressed in this topic focuses on identifying operational bottlenecks (e.g., increased travel time, overcrowding) in the bus transportation service. Analyzing the causes of these bottlenecks can help in corrective actions. In this scenario, Zhou et al. ( 35 ) evaluated the factors affecting operational functioning (e.g., road, cross, and station delays). They proposed a ML model to assess the impact of these factors. Therefore, the transportation professional can verify what is disturbing the operational routine.
Passenger Demand
The passenger demand topic contains passengers’ negative perceptions of service consumption. In this topic, three problems were the focus of the solutions. The lack of more realistic information for passenger travel planning was the problem that had the most significant number of works in the literature. Despite the itineraries provided by the transportation companies, this information may change because of events (e.g., weather conditions, accidents, and congestion) that may occur along the route. For this, the travel time prediction solutions and their variations (delay time, arrival time, speed) aim to provide the estimated time or speed to travel a route by observing a short-term window (e.g., minutes or hours) before the next trip.
This model can be used as a key element in advanced traveler information systems ( 54 ). In travel time prediction, the target attribute is the travel time of a bus between two points of interest ( 55 ). In arrival time prediction, the arrival time of the bus at a stopping point is the target attribute. In delay time prediction, the target attribute is the delay time, which is the difference between the observed and planned travel time ( 6 ). In speed prediction, the target attribute is the future speed of the bus on a given segment of the route ( 56 ).
The solution proposed by Iovino et al. ( 46 ) also focused on providing information to passengers about the itinerary, stopping points, and the average travel time of the bus routes. For this, the proposed solution built a graphical representation of bus routes.
The second problem addressed in this topic was the low incentive of passengers to choose the bus as their daily means of transportation. For this, some solutions in the literature proposed to identify the presence of users on the buses or their route so that marketing actions (i.e., coupons, discounts) can be promoted to encourage them to use public transportation more. In this scenario, the solution proposed by Salvador et al. ( 48 ) was to automate the mapping of passengers’ journeys (network matching) using the data collected from applications installed on their smartphones, allowing one to offer incentives related to their journey.
Heydary et al. ( 47 ) proposed a solution capable of automatically identifying a passenger when using a bus; the bus route is also proven. In this solution, a classification model was employed to identify the use of a car or bus by a passenger. From this identification, marketing actions can be broadcast when the user uses the bus. Finally, the last problem in this topic was the level of carbon monoxide contamination. If the limits are outside those recommended, passengers may experience discomfort and adverse health effects. To address this problem, Kadiyala and Kumar ( 49 ) proposed a hybrid model of time series to monitor the level of contamination of these gases, allowing control measures to be taken.
Categorizing the Retrieved Solutions
In this section, the solutions found in the literature are categorized, and RQ2 is also answered. Firstly, the works that have similar research objectives were grouped. Afterward, the solutions were divided into two groups: the most and less recurrent solutions. The group of the most recurrent solutions in the literature includes the solutions addressed by two or more works. On the other hand, the group of less recurrent solutions includes the solutions addressed by only one work. Finally, the description of the works that addressed the most recurrent and the least recurrent solutions are respectively presented in the Description of Works that Addressed the Most Recurring Solutions in the Literature and Description of Works that Addressed Less Recurring Solutions in the Literature sections.
The travel time prediction, arrival time prediction, delay time prediction, and speed prediction solutions are considered equivalent because when predicting the target attribute by one of these models, it is possible to obtain the corresponding target attribute expected by the other models. For example, Agafonov and Yumaganov ( 56 ) and Zheng et al. ( 57 ) used a speed predictor to predict the bus speed on a segment and thus indirectly obtain the bus’s travel time or arrival time. Thus, these solutions were grouped, and the name travel time prediction was adopted in this paper to refer to this group of equivalent solutions.
So, the solutions were categorized into two groups, the most recurrent and the least recurrent solutions, as shown in Table 4. The most recurrent solutions focus on problems related to the operational planning topic. Less recurrent solutions, on the other hand, gather the solutions that address the problems related to all themes. Most of the work was concentrated on travel time prediction solutions and the application of clustering techniques.
Categorization of Solutions Found in the Literature
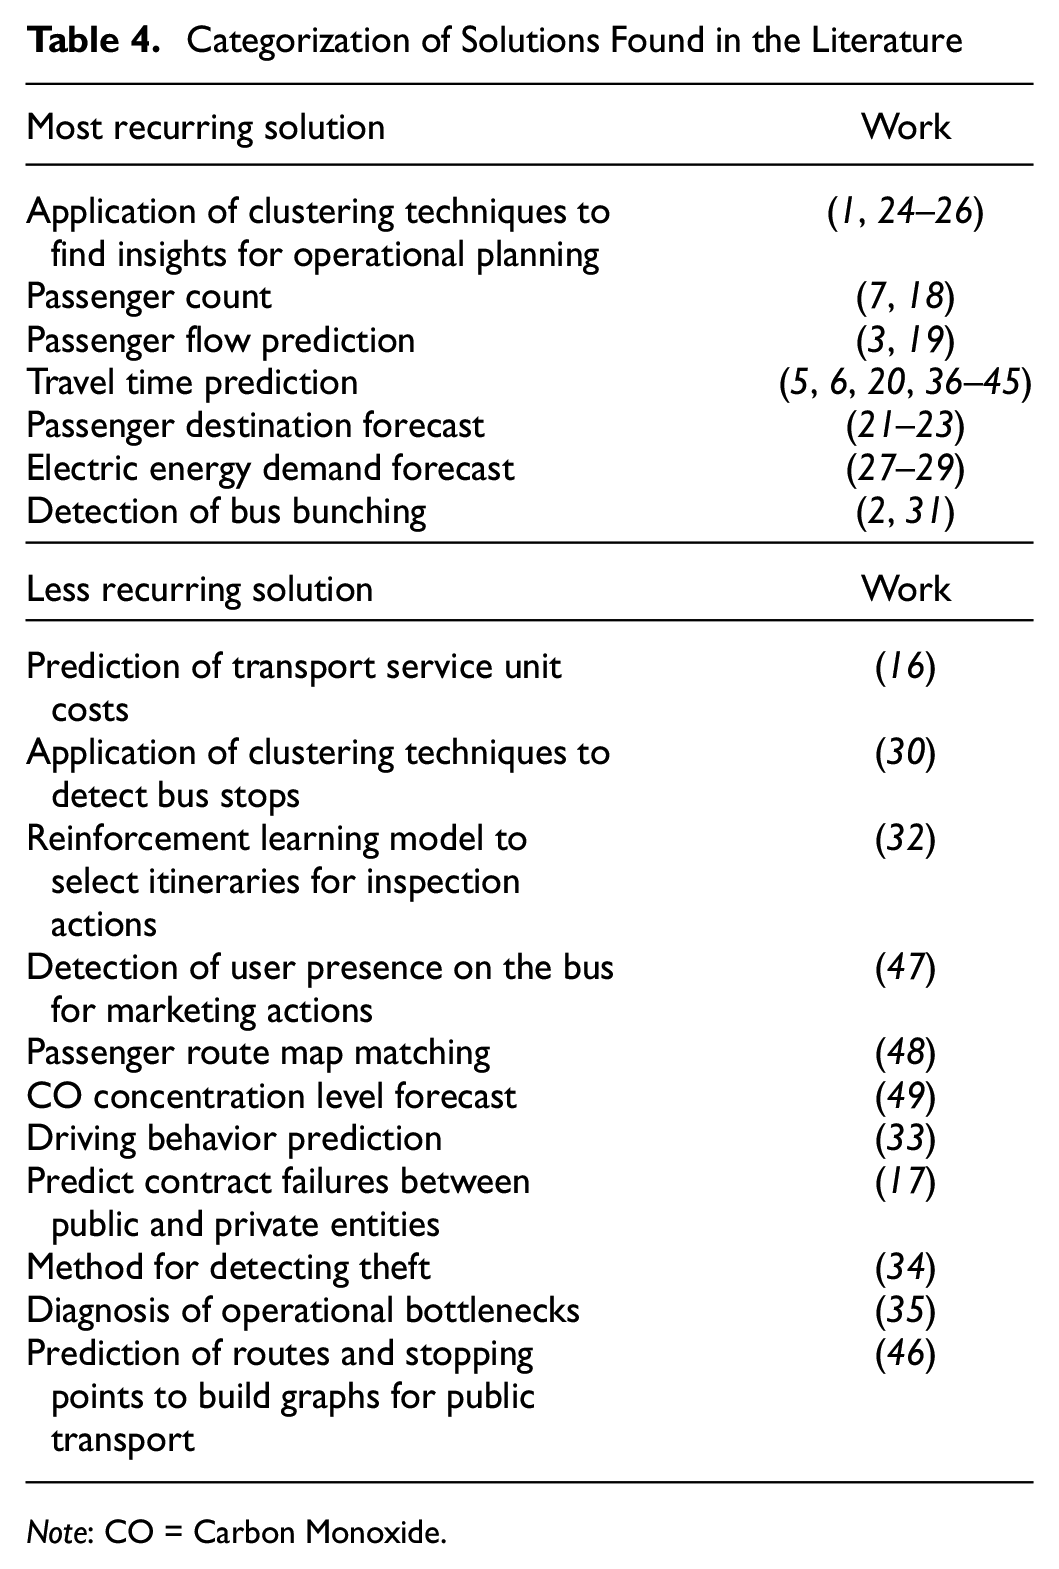
Note: CO = Carbon Monoxide.
Description of Works that Addressed the Most Recurring Solutions in the Literature
This section presents a description of the works that addressed the most recurrent solutions listed in Table 4.
Application of Clustering Techniques to Find Insights for Operational Planning
Mohamed et al. ( 1 ) applied two clustering approaches to identify groups of stations with a similar usage profile, highlighting the times and locations. They also extracted travel patterns, identifying groups of passengers who behave similarly when boarding from the data collected from the STAR company’s fare collection system in Rennes (France). For the clustering of stations, they built a model based on counting the use of stations using the Poisson mixture. The clusters allowed the identification of different types of station use at specific times of the day. For the grouping of passengers based on their temporal behavior, the approach was based on estimating a mixture of unigrams model from the passengers’ temporal profiles: different passenger behavior profiles and classic travel habits (e.g., from home to work). The analysis of this information can help transportation companies to adapt their services according to the demands of passengers.
Mendes-Moreira et al. ( 25 ) proposed a framework that can assess whether the coverage of the current bus schedule is adequate for the demand of the transportation network. Data were collected from the AVL system of the company Sociedade de Transportes Coletivos de Porto (STCP). The framework is explained in three steps: (1) it groups the days with similar profiles for each route into a predefined number of k clusters/schedules using the k-means algorithm; (2) the consensus clustering technique obtains a single set of clusters for all routes; (3) rules are extracted from the consensus clusters using the repeated incremental pruning to produce error reduction (RIPPER) algorithm, and then these rules are compared with the existing plan. In the experiment, the framework provided helpful ideas (e.g., reducing the number of trips on Saturdays) about the coverage of bus schedules.
Khiari et al. ( 24 ) proposed a data-driven framework to automatically select the best number of schedules for a given route from data collected from a company’s automatic vehicle tracking and passenger counting systems in Sweden by extracting the travel, boarding, and alighting times for each stop. The dynamic time warping algorithm constructed a matrix of the distance between days from generated daily profiles. The next step was the clustering performed by the Gaussian mixture model individually for each route. The last step is to select the most suitable “k” to define the best number of schedules for a route. A new ad hoc metric was used to evaluate this choice. The experimental results showed potential gains with the proposed framework and the suggested changes were adopted in the proposed transportation network’s current schedule.
Thiagarajan and Prakashkumar ( 26 ) proposed a hybrid model to select the best network schedule coverage using data obtained from an AVL and automatic passenger counting (APC) system. This model can predict the flow of passengers on a route and select the best schedule number using density-based spatial clustering of applications with noise (DBSCAN) with the seasonal autoregressive integrated moving average (SARIMA). The proposed model was promising and proved adaptable to changes in the passenger flow on buses.
Passenger Count
Nakashima et al. ( 7 ) introduced a method for counting passengers who boarded or disembarked at bus stops. The number of passengers near the front door of buses was estimated by processing images captured by cameras using DNNs. When the number of passengers was estimated using only image processing, the performance obtained was impaired by occlusions and passengers located on the borderline. The authors used the RF algorithm to correct the number of passengers estimated by processing the images. For the construction of this model, the data was collected from Global Positioning System (GPS) devices and the digital tachograph. The experiments showed that the correction proposed by the RF method proved effective compared to the results obtained only with the image processing method.
Li et al. ( 18 ) presented two models that use carbon dioxide sensors to estimate the level of passenger occupancy. The proposed models are considered passive passenger detection methods and can also be used in other means of mass transportation, such as trains. The authors used data collected from MH-Z16 sensors that offer a set of attributes, but the number of occupants on the buses was manually recorded. The sensor was installed in the central part of the buses, where passengers must pass to disembark from the vehicle. The models were built using the linear regression (LR) algorithm and extreme learning machine (ELM). In theory, there is a linear relationship between the number of people on buses and the concentration of carbon dioxide. However, experiments have shown that this relationship can be affected by the sealing degree of airflow in the bus. The ELM presented a trend of prediction results similar to the real number.
Passenger Flow Prediction
Samaras et al. ( 3 ) presented predictors for predicting passenger demand using data collected from the AVL and APC systems of the company OASTh in Thessaloniki (Greece). The RF and Bagging (BG) methods were used to build regression models tested with two distinct attribute sets. The performance of these ML models was compared with the mean value and the median of the passenger count present in the training base and with a k-NN model. Two types of experiments were conducted: in the first, the test was performed with data from the routes and stopping points present in the training set (E1) and, in the second, the tests used data from new routes and stopping points (E2). This was done to assess the generalization power of the constructed model. The models generated by the RF algorithm obtained the best results in both types of experiments (E1: root mean square error [RMSE] = 7.04, E2: RMSE = 6.82).
Jin et al. ( 19 ) presented a model based on Shepard’s interpolation method (SIM)—similarity-based prediction—to predict bus passenger flow from data collected on route 218 in Guangzhou (China) and from unidentified sources. Its performance was compared to two other ML models: support vector regression (SVR) and artificial neural networks (ANNs). In this sense, data with more significant similarity in influencing factors tend to be more similar in defining the state of passenger flow. The built model performed better than the models generated by the ANN and SVR in predicting the flow of passengers on working days or holidays. On holidays, the results of the SIM were superior, showing its ability to deal with noise and its low dependence on parameters to calibrate the method.
Travel Time Prediction
Bahuleyan and Vanajakshi ( 5 ) presented a model to predict the travel time of buses on some of the main routes of the transportation network of the city of Chennai by collecting data from GPS devices. A link-to-link approach was used to model the problem, representing the transportation network as nodes and links. The k-NN algorithm was used to predict the travel time, considering a complete connection (between two nodes). Two approaches have been proposed considering the following: (1) the total travel time is calculated by adding the predicted travel time in an intermediate link using k-NN with the predicted travel time in the intersection area using RF (k-NN-RF); (2) the time spent in the intersection area was predicted using the k-NN and data collected from the inductive loop detectors. The k-NN model presented high values of mean absolute percentage error (MAPE) in predicting travel time on a route with important intersections. The k-NN-RF model obtained a better result than the k-NN since the first one could better capture the travel time in the intersection areas, analyzing them separately. With respect to the prediction of travel time only in the intersection areas, the second approach proved to be more promising, presenting better results than the RF algorithm.
Reddy et al. ( 38 ) showed two approaches to predicting bus travel time under high variability conditions, causing greater uncertainty in the prediction. These conditions can occur because of traffic signs, adverse weather conditions, or heterogeneous traffic conditions, such as several types of vehicles sharing the same road without any type of separation (e.g., Chennai). The first approach used the Kalman filter (KF) and the second used the SVR algorithm for travel time prediction. The second approach used an approximate entropy technique to identify the ideal number of trips before the model training stage. In stretches with high variance, the SVR obtained a better MAPE result (17.78%) than the model proposed by the first approach (MAPE 26.39%). The SVR also has the best predictive performance at peak travel times, better capturing the weather variation. The performance of the SVR model can be improved by incorporating other features, such as weather and vehicle conditions.
Mendes-Moreira et al. ( 20 ) used the heterogeneous ensemble approach with dynamic selection to predict bus travel times three days in advance. Data were collected in STCP’s AVL system in Portugal. The collaborative learning process typically has three steps: generation, pruning, and integration. In the generation step, the algorithms projection pursuit regression (PPR), SVR, and RF with different parameter sets were used to generate the models. In the pruning stage, the forward search was used to reduce the number of models in the set. In the integration step, the methods forward selection with replacement, dynamic weighing, and dynamic weighting with selection combined previous predictions. Finally, the model with the best performance was selected. In all experiments using the integration functions dynamic weighting and dynamic weighting with selection, the results were better than the best single model in the set. Furthermore, the results showed that this approach could mitigate some of the instability observed in some base models when dealing with seasonal data.
Panovski et al. ( 42 ) presented a new paradigm based on a traffic density matrix to predict bus arrival times at various bus stops. ANNs and LR were used in this study. A real scenario was simulated using the simulation of urban mobility (SUMO; an open source traffic simulation package, which is available at: http://sumo.sourceforge.net) to collect synthetic inductive loop detector data. For each stopping point, the density value is given by the number of vehicles present at an instant of time within a specified radius. Thus, a density matrix is denoted by size N×T, where N is the number of breakpoints and T is the number of measured time instances. For each density matrix for each bus, the prediction output will be a vector with the arrival times of the bus stop points. Because of congestion, the LR model deviated significantly from the actual arrival time. In general, the ANN model obtained the best results compared to the LR model.
Heghedus et al. ( 40 ) compared two ML frameworks, PyTorch and TensorFlow, to implement two neural networks to predict the arrival time of buses at bus stops. The authors used a database of buses’ trips to the city of Stavanger (Norway). Multilayer perceptron (MLP) and a DNN were implemented using PyTorch and TensorFlow. The four models used the same dataset, the same learning structure, and the same number of iterations. In general, the mean absolute error (MAE) and RMSE of all models decreased as the number of iterations increased, and TensorFlow showed a longer training time than PyTorch. Finally, the authors presented a comparative table between the two frameworks and pointed out that, currently, the choice of implementation is highly based on user preferences.
Yamaguchi et al. (
6
) compared different methods to predict bus delay time between consecutive bus stops. The authors also investigated the influence of outlier detection methods and the size of the dataset used to train and test the models. Finally, they evaluated the inclusion of travel time before training the models. The Nishitetsu Bus Company provided data in Fukuoka (Japan). The experiments employed five ML algorithms: the LR, RF, SVR, MLP, and gradient boosting decision tree (GBDT). In general, the GBDT model performed better at almost all times. The outlier 2
Julio et al. ( 45 ) compared different ML algorithms to predict the future speed of buses in a given segment using data collected from GPS devices installed in the bus fleet in Santiago (Chile). The authors compared two other methods: the first used only the average of historical data for the same period and zone (BM1) and the second used the average of data extracted in real-time (BM2). From the GPS data, the bus trajectory was drawn in a time and space diagram based on the shock wave expansion theory, where the average speed was calculated in each diagram. ANNs, SVR, and the Bayesian network (BN) were employed in this study. The results obtained by the ML algorithms outperformed the naive models BM1 and BM2. In general, the results obtained by the ANN algorithm achieved the best results. The authors validated the hypothesis that real-time data improves prediction by up to 35% compared to the RMSE. New experiments can be carried out by adding a new combination of variables and information from bus companies that share the same route.
Yuan et al. ( 39 ) presented a framework for extracting heterogeneous features based on the recurrent neural network (RNN) model and also employed a mechanism to obtain a deep understanding of the spatio-temporal characteristics related to the travel time of buses. To predict travel time dynamics, a DNN was implemented. In the modeling, the authors used data from taxis’ GPS devices and data extracted from the AVL system of buses that circulate in two metropolises in southern China. This study introduced 14 spatial and temporal features, such as dwell times and bus speeds at different historical stages. The proposed approach was more efficient than the traditional ML model.
Noor et al. ( 37 ) used the ANN and SVR algorithms for travel time prediction applied in a case study with university buses. The authors used data extracted from GPS devices from September to December 2019. The map matching process was used to prepare the data and the RF method was used to select the five most important attributes. The results show that the ANN reduced travel time during peak and off-peak hours.
Panovski and Zaharia ( 41 ) presented a real-time prediction method of arrival time at bus stop points on an itinerary. Because of the difficulty in obtaining data (governmental restrictions and legislation), artificial data from loop detectors were created with the SUMO simulator. In the simulated scenario, loop detectors at bus stop points detect and count how many vehicles pass in a given period. In each measurement, the traffic is represented with the help of the traffic density matrix. The authors explored the ordinary least squares (OLS), SVR, and feedforward fully connected neural network (FNN) algorithms in building the prediction models. The neural network had the best performance.
Ye et al. ( 44 ) developed a model for bus arrival prediction based on the Spark framework. In these studies, data from buses operating in Chiang Mai were collected for about 78 days. The concept of a buffer zone was employed to obtain the arrival and departure times at each station. The authors used several attributes extracted from the GPS to construct other related attributes needed with travel time prediction. The model was evaluated using multiple measurements, such as time series cross-validation. The authors used the moving average with explanatory variable (ARIMAX) and SVR to build the models. The experiment showed that the SVR model was 25% superior to the ARIMAX model.
Taparia and Brady ( 43 ) proposed predictors to predict total travel time and arrival times using historical data from AVL systems, bus routes, and bus stop information. The authors focused on developing models capable of estimating reliable travel and arrival times using minimum attributes for situations where attributes are not accessible. The LR, ANN, and long short term memory network (LSTM) models were used for total travel time prediction. Benchmarking showed that the LSTM and ANN performed better than the others. Historical averaging, LR, and the GBDT were employed to predict arrival times at stopping points. The GBDT presented the best results in this scenario.
Kakarla et al. ( 36 ) investigated the efficiency of ML methods for bus rapid transit system (BRTS) travel time prediction. The BRTS operates in an exclusive lane, reducing the impact of congestion. In this scenario, recorded GPS data may be available at non-uniform intervals. It can make it challenging to predict travel time. RF, light gradient boosting (LGB), and GBDT were the algorithms used to build the models. The results showed that the GBDT performed better than the other algorithms.
Passenger Destination Forecast
Jung and Sohn ( 22 ) proposed a DL model to predict the destination of bus passengers using data collected by Seoul’s automated fare collection system. The authors assumed that a destination location with a higher intensity of socioeconomic activities would be more likely to be chosen as a destination. The authors reduced 28 types of the use of government-cataloged building areas into four classes (residential, commercial, cultural, and office) to be used as inputs to the model. The backpropagation algorithm was adopted for training the model. The number of nodes in the input layer was equal to the number of attributes, and the number of nodes in the output layer was identical to the maximum number of candidate destinations ( 10 ). By relaxing the criteria to match the second-best candidate target with the observed target, the accuracy was increased to 87.5%.
Kim et al. ( 23 ) focused on estimating the travel purpose of transit passengers on smart card data using ML models. In addition, the proposed model can explain the decision-making process and uses the RF coupled with interpretable ML methods (e.g., resource importance and resource interactions). This study considered spatio-temporal and geographic characteristics for constructing the model, which achieved an overall accuracy of 83% in its estimation of the validation data. On the other hand, the interpretation method showed that temporal characteristics are the dominant factors in estimating travel purposes.
Faroqi and Mesbah ( 21 ) presented a clustering method to infer the trip destination attribute in smart card datasets. This inference is performed based on the temporal attributes present in these data. Firstly, passenger clusters are discovered using the agglomerative hierarchical clustering (AHC) method. Then, these clusters are used to infer the travel destination by allocating each passenger to the closest clusters. The evaluation results showed an improvement in destination inference compared to the results found in the literature.
Electric Energy Demand Forecast
Nageshrao et al. ( 28 ) presented a strategy to optimize the operating costs of electric buses. To use this strategy, it is necessary to know the real energy demand of electric buses. For this, an ANN algorithm was used to build a model capable of predicting the energy consumption of electric buses for the next day (within an error limit of 10%). The ANN was trained based on data indicative of electricity consumption. The optimized strategy was compared with a non-optimized approach of fully recharging the battery at available opportunities. The developed strategy minimizes energy loading costs compared to the non-optimized approach.
Wang et al. ( 29 ) investigated modeling electricity demand prediction on buses using different ML algorithms. Data from the GPS and battery management sensors (BMSs) on buses in different cities in China were collected. The RF outperformed the other ML methods. However, some systematic bias was observed by the authors. Temporal factors such as time of day and day of the week and the seasonal effect were considerably affecting energy consumption (e.g., the battery lasts longer at night and on weekends, the battery lasts less in warmer months).
Abdelaty et al. ( 27 ) developed data-driven models for predicting electric buses’ energy consumption using ML algorithms and statistical analysis. A full-factorial experiment was used to define possible scenarios for electric bus operations, collecting real-world data from 14 bus routes. A fractional-factorial experiment was generated to validate the models. The authors compared the performance of seven ML algorithms: LR, the radial basis function neural network (RBFNN), the decision tree (DT), the GBDT, the support vector machine (SVM), the MLP, and RBFNN. In the experiments, the authors also identified the variables most significantly related to battery consumption (e.g., the initial state of charge, average speed, and stopping density). The MLP and SVM models were considered the most accurate models.
Detection of Bus Bunching
Moreira-Matias et al. ( 2 ) developed a framework to detect and correct the phenomenon of bus agglomeration using data collected from the STCP AVL system. Under ideal conditions, the time interval between two buses running on the same route between two consecutive trips should be constant. According to the authors, it is possible to infer the headways’ future values based on the travel time predictions between two consecutive stopping points. In the offline learning step, the RF algorithm was used to predict the LTT. In the online learning stage, an ANN algorithm was used to update these predictions. Then, a probabilistic method for detecting bus agglomeration events was proposed. When the defined detection limit is reached, one of the corrective actions is selected. RF performance varied from route to route, with high MAE values for some routes. Overall, online learning reduced the average error by more than 90%, converging, and significantly improved results. The framework reduced bus cluster events by 67.59% from 83% of detected events.
Degeler et al. ( 31 ) proposed an unsupervised method to identify the phenomenon of bunching swings. This modeling used data with static information about the network, AVL, and AFC system. The correlation between the bunching rate and the passenger load was identified in the experiments. The clustering process was performed using the k-means algorithm, and three situations were identified: normal, delayed, or bunched. Varying the number of clusters (k) allows one to adjust the characteristics and severity of the extracted bunching patterns.
Description of Works that Addressed Less Recurring Solutions in the Literature
This section describes the works that addressed the less recurrent solutions listed in Table 4. Avenali et al. ( 16 ) developed two ANN models capable of predicting the unit cost of the public bus transportation service. These models can be helpful tools for local authorities to validate reserve prices in bidding procedures. Forty-five managers of Italian transportation companies completed a questionnaire to collect data that consisted of disaggregated information on cost (energy, material, and capital) and technical and environmental characteristics (average fleet age). These characteristics contribute to explaining the variability of unit costs. The first model predicts the unit cost of personnel (drivers) and the other costs. The second model focused on forecasting unit costs with the bus fleet and the rest of the costs. The authors identified that the first model provided a higher estimate of total unit cost than the second model, probably because the latter overestimated personnel costs.
Rajput et al. ( 30 ) proposed a method for automatic detection of bus stops for Indian cities (e.g., Ahmedabad) where buses do not have fixed schedules and stop where they meet passengers along the route. The proposed method has two main steps: (1) a sequence of stops in a trip is calculated; and (2) frequent stops present in most trips are found and declared as bus stop points. For this, the DBSCAN algorithm was used to detect the stops on a trip. Later, the location of the stop was calculated by taking the centroid (latitude, longitude) of the grouped data points. This procedure was repeated for all segments of a trip. In the experiment performed, the method detected up to 75% of the stopping points using an arbitrary set of trips performed along the route.
A process of generating scripts for inspection actions by control agents to combat tariff evasion was proposed by Delfau et al. ( 32 ). To do this, they used fraud statistics information provided by the TICE public transportation provider in Paris together with public data on bus timetables and station locations. The route generation process has four stages: In the first stage, the exponential-weight for exploration and exploitation (Exp3) algorithm was used to select some stations to be visited; in the second step, a graph is generated to evaluate the travel time from one station to another; in the third step, the list of stations generated in the first step is ordered and, in the fourth step, this list of stations is readjusted according to the bus schedules and some restrictions (e.g., the scale of the control agents). The first results were optimistic, as the roadmap covered half of the transportation network.
Heydary et al. ( 47 ) presented an automatic method capable of identifying whether a person is using a bus or car from smartphone data. In several cases, the method also identified the bus circulation route. An activity-aware application programming interface (API) was used to filter only active vehicle instances. After a motion is detected, GPS data begins to be recorded. The method uses the RF algorithm to classify the streams containing accelerometer and gyroscope data into instances with two defined classes: car or bus. The precision obtained was 0.93, and the f-score was 0.96.
Salvador et al. ( 48 ) presented two data-driven approaches to automating the mapping of the trajectory of passengers’ journeys in a transportation network (network matching). The first approach used a heuristic algorithm, and the second used two types of DNN. The problem was modeled as a supervised sequence classification task, where each sequence was composed of geographic coordinates, time, the combination of the line, and the direction of travel from the label. A generator produced synthetic passenger travel data to circumvent the difficulty of obtaining a considerable amount of data to train the ANN algorithms. The validation step used real data collected from passengers’ smartphones. The DNN obtained a superior performance when compared to the heuristic model.
Kadiyala and Kumar ( 49 ) provided a step-by-step guide for building a hybrid model to predict the level of carbon monoxide contamination inside buses. This approach integrated the use of vector time series (VTS) and RBFNNs. The model was called RBFNNVTS and is capable of monitoring the level of CO contamination inside the bus. The models were validated using a comprehensive set of quality modeling, operational performance measures, and graphical representations made on different systems. The presented approach outperformed traditional statistical modeling using VTS.
Luo et al. ( 33 ) proposed a method to predict whether the driver’s driving behavior is safe or unsafe, contributing to ensuring safety in public transport. Furthermore, the authors provided a new method for extracting attributes because of the absence of attributes available in the databases used to model this solution. In this work, a boosting method was proposed for predicting driving behavior. Two scales (70% and 90%) were used to avoid overfitting. Separation of the dataset for training the models and public databases containing real data were used in the experiments. The experiments showed that the proposed method, together with the attributes employed, surpassed the individual performance of the ML methods.
Wang et al. ( 17 ) analyzed the factors that lead to failure in the conclusion of service contracts (e.g., transport) between public and private entities. They proposed a ML model capable of predicting a contract’s final status (success or failure). Factors considered to assess the final status of the contract are related to the object of the contract, institutional (e.g., corruption control), legal (e.g., the rule of law), and macroeconomic (e.g., consumer price index). These factors vary according to the type of service contracted. The synthetic minority oversampling technique (SMOTE) was applied to address class imbalances. The models were constructed using the LR, SVM, and RF algorithms. The model generated with the RF and class balancing for the transport sector had the best performance.
Affonso et al. ( 34 ) presented a method of detecting theft in public transportation to improve passenger safety. The proposed method is a classifier based on convolutional neural networks (CNNs) that receives images captured by cameras present on buses as input. Then, the method classifies the received image into two classes: abnormal or normal. The oversampling technique was used to solve the problem of imbalance between classes. Despite dealing with low-quality images, the proposed method obtained satisfactory results.
Using basic operational data, Zhou et al. ( 35 ) developed a model capable of analyzing the causes of operational bottlenecks in bus transportation. This model produces a ranking with the factors (e.g., roadway delays, intersection delays) that influence these bottlenecks’ occurrence. The RF algorithm was used in the construction of this model. The experiments proved that the method could find the operational bottlenecks of bus routes and their intrinsic causes.
Iovino et al. ( 46 ) presented a ML approach to predict bus routes and stopping points to build traffic graphs. For this, the authors used GPS data and the LSTM algorithm to train a model capable of deducing missing information and exporting adequate general transit feed specification (GTFS) transit feeds. The approach was validated using data from the bus system of the city of L’Aquila (Italy).
Types of Data Used for Constructing the Machine Learning Models
This section presents an overview of the sources and types of data used in constructing solutions for public transportation by bus and answers RQ3. The Table 5 shows the data sources used in the most recurring solutions and Table 6 shows the data sources used in the less recurring solutions. In seven studies, the data sources are not specified, and only the data types are described. Heghedus et al. ( 40 ) used bus trips data, Jin et al. ( 19 ) used historical data on the flow of passengers on buses, Nageshrao et al. ( 28 ) used historical data on electricity usage and weather data, Delfau et al. ( 32 ) used fraud statistics data and planned bus travel time as bus terminal location data, Luo et al. ( 33 ) employed databases containing vehicle state information—such as positions, speeds, and direction—and vehicle-to-vehicle communication information. Abdelaty et al. ( 27 ) used a database containing technical information about the bus (e.g., mass, drag coefficient), operational travel data (e.g., average speed, rate of acceleration), topological data of the road, and the battery (e.g., battery capacity, initial battery status), and Zhou et al. ( 35 ) also used weather and driver behavior data obtained from unknown sources. The sources and types of data used in the solutions are described below.
Sources of Data Used in Building Most Recurring Solutions
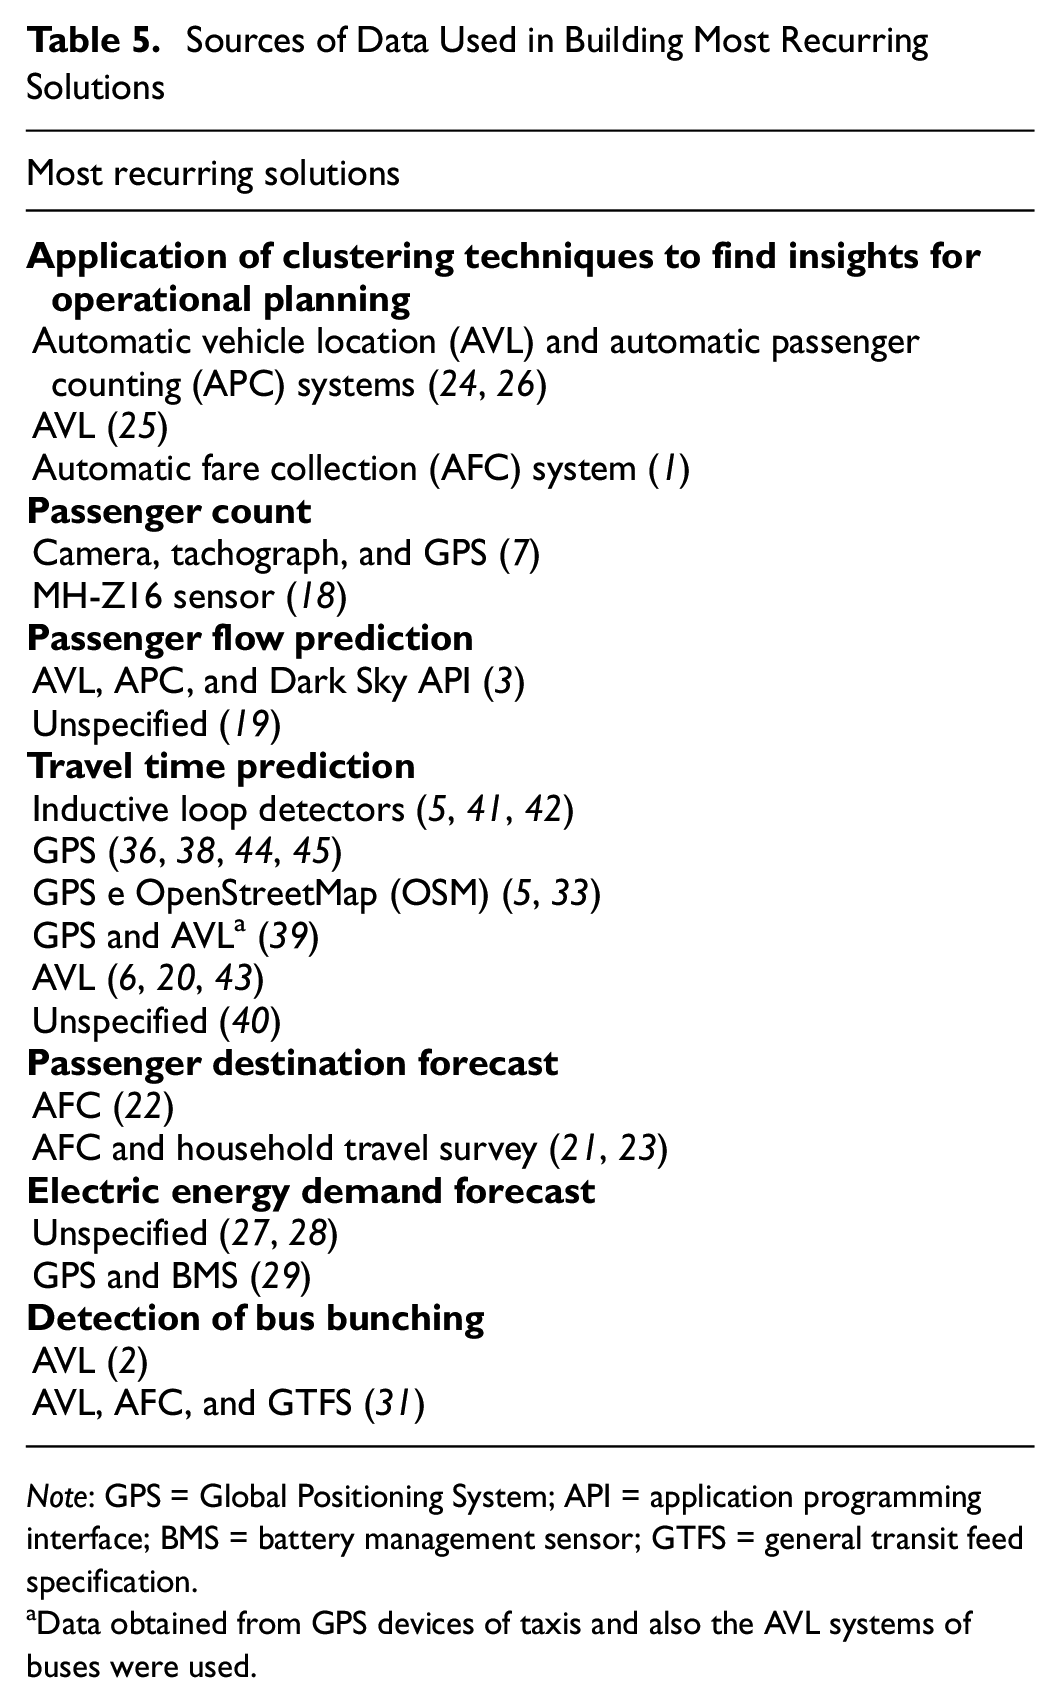
Note: GPS = Global Positioning System; API = application programming interface; BMS = battery management sensor; GTFS = general transit feed specification.
Data obtained from GPS devices of taxis and also the AVL systems of buses were used.
Data Sources Used in Building Less Recurring Solutions
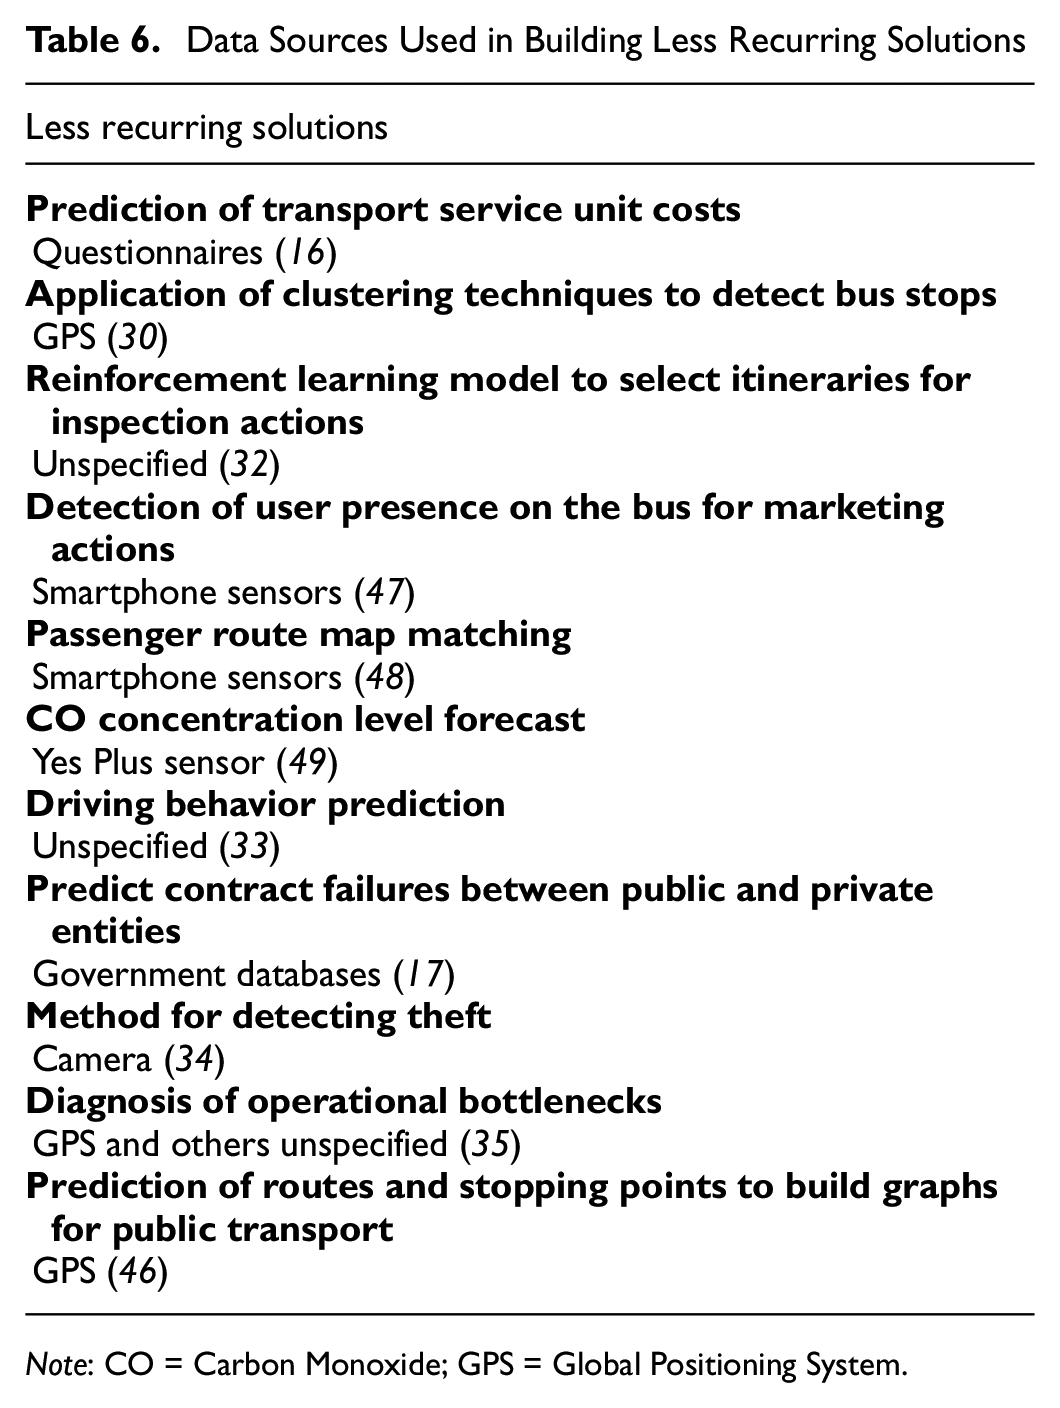
Note: CO = Carbon Monoxide; GPS = Global Positioning System.
The GPS, automated data collection systems (ADCSs), digital tachographs, cameras, BMSs, and air sensors (MH-Z16 and Yes Plus sensors) are devices that may be available in the bus fleet. Transportation companies use the GPS to track vehicles during their operations. The GPS uses satellite signals to determine vehicle location coordinates (latitude, longitude). However, satellite signals can be blocked by tall buildings, tunnels, and viaducts ( 58 ). ADCSs include AVL, APC, and AFC systems. These systems are increasingly present in public transportation because of the operational data they provide to transportation companies ( 59 ). AVL is a tracking system capable of recording location information for each vehicle in real-time and transmitting it to a control center. The GPS, terrestrial radio, and dead reckoning are some location technologies that can be used in AVL. It is possible to combine these location technologies, such as the use of the GPS with terrestrial radio, the latter being used when GPS signals are not available ( 8 , 58 ).
APC aims to count the number of passengers boarding and arriving at each stop along a route. These systems are used in conjunction with AVL to provide databases for planning services and operations ( 3 , 59 ). Already, AFC is adopted to manage payments in public transportation ( 1 ). The core element of this system is smart cards with integrated microchips, capable of storing and processing data when users interact with the system. Smart cards collect data from monetary transactions (when the user adds credits) and travel transactions (when boarding and disembarking). The data is usually composed of spatial (e.g., location of stopovers) and temporal (e.g., start time of each trip) information that can be used to define urban mobility patterns ( 60 ).
The digital tachograph automatically records vehicle performance characteristics on a memory card or sends it directly to the cloud ( 61 , 62 ). This device provides the vehicle speed, distance traveled, engine revolutions per minute, fuel consumption, fuel consumption rate, and other data. In addition, it is possible to check whether the driver’s behavior is as expected (e.g., legal speed). The camera can be installed on buses to allow the recording of images for monitoring drivers and passengers. The BMS is a system capable of managing the rechargeable battery of electric buses by displaying information about the battery status (e.g., voltage, current, temperature, state of charge) ( 63 ).
The Yes Plus and MH-Z16 sensors can be used to measure the concentration levels of carbon monoxide and carbon dioxide inside buses through adapters connected to them ( 18 ). Inductive loop detectors are devices in the transportation network (e.g., roads and traffic lights). Average speed, volume, and occupancy are the data types that these devices can serve ( 64 ). Because of the difficulty in capturing real data from inductive loop detectors, some works used SUMO to simulate a scenario and capture data from these devices ( 5 ).
In addition to the devices mentioned above, other data sources were used to collect the data. Heydary et al. ( 47 ) developed an application to capture measurements from smartphone sensors (e.g., accelerometer, gyroscope) of registered users during travel. The collection of these data was performed with the consent of the participants. Avenali et al. ( 16 ) used a questionnaire to collect data on costs (e.g., the average salary for drivers) and the technical and environmental characteristics of the service (e.g., the fleet’s average age). Kim et al. ( 23 ) also used household travel survey data containing spatio-temporal features, travel contexts, and spatial information from the origin–destination. Wang et al. ( 17 ) used government and public databases (World Bank’s Private Participation in infrastructure, worldwide governance indicators database, and development indicators databases) to collect data on specific factors related to transport projects and institutional, legal, and macroeconomic factors.
OpenStreetMap (OSM; available at https://openstreetmap.org) is a collaborative mapping project developed by a community of volunteer mappers who maintain an up-to-date database of geographic features (e.g., routes and nodes). Samaras et al. ( 3 ) collected the meteorological data (e.g., temperature and weather) through an API provided by Dark Sky (available at http://www.forecast.io). Jung and Sohn ( 22 ) used data characterizing the area around bus stops into four types (i.e., residential, commercial, cultural, and office). Finally, the GTFS is a data standard used by transportation companies to publish their traffic data (e.g., routes, stopping points, itinerary) in a format that other software systems can process.
Algorithms Used for Constructing the Machine Learning Models
This section presents the ML algorithms used in constructing solutions for public transportation by bus and answers RQ4. Table 7 shows the ML algorithms used to build the most recurrent solutions subdivided into supervised and unsupervised learning. Most of these solutions used supervised and unsupervised learning concentrated solutions that applied clustering techniques to find insights for operational planning. Passenger destination forecast and detection of bus bunching solutions presented different modeling proposals in the literature using both supervised and unsupervised learning. Other solutions (e.g., passenger flow prediction, travel time prediction) used classic regression solutions.
Algorithms Used in Building the Most Recurring Solutions
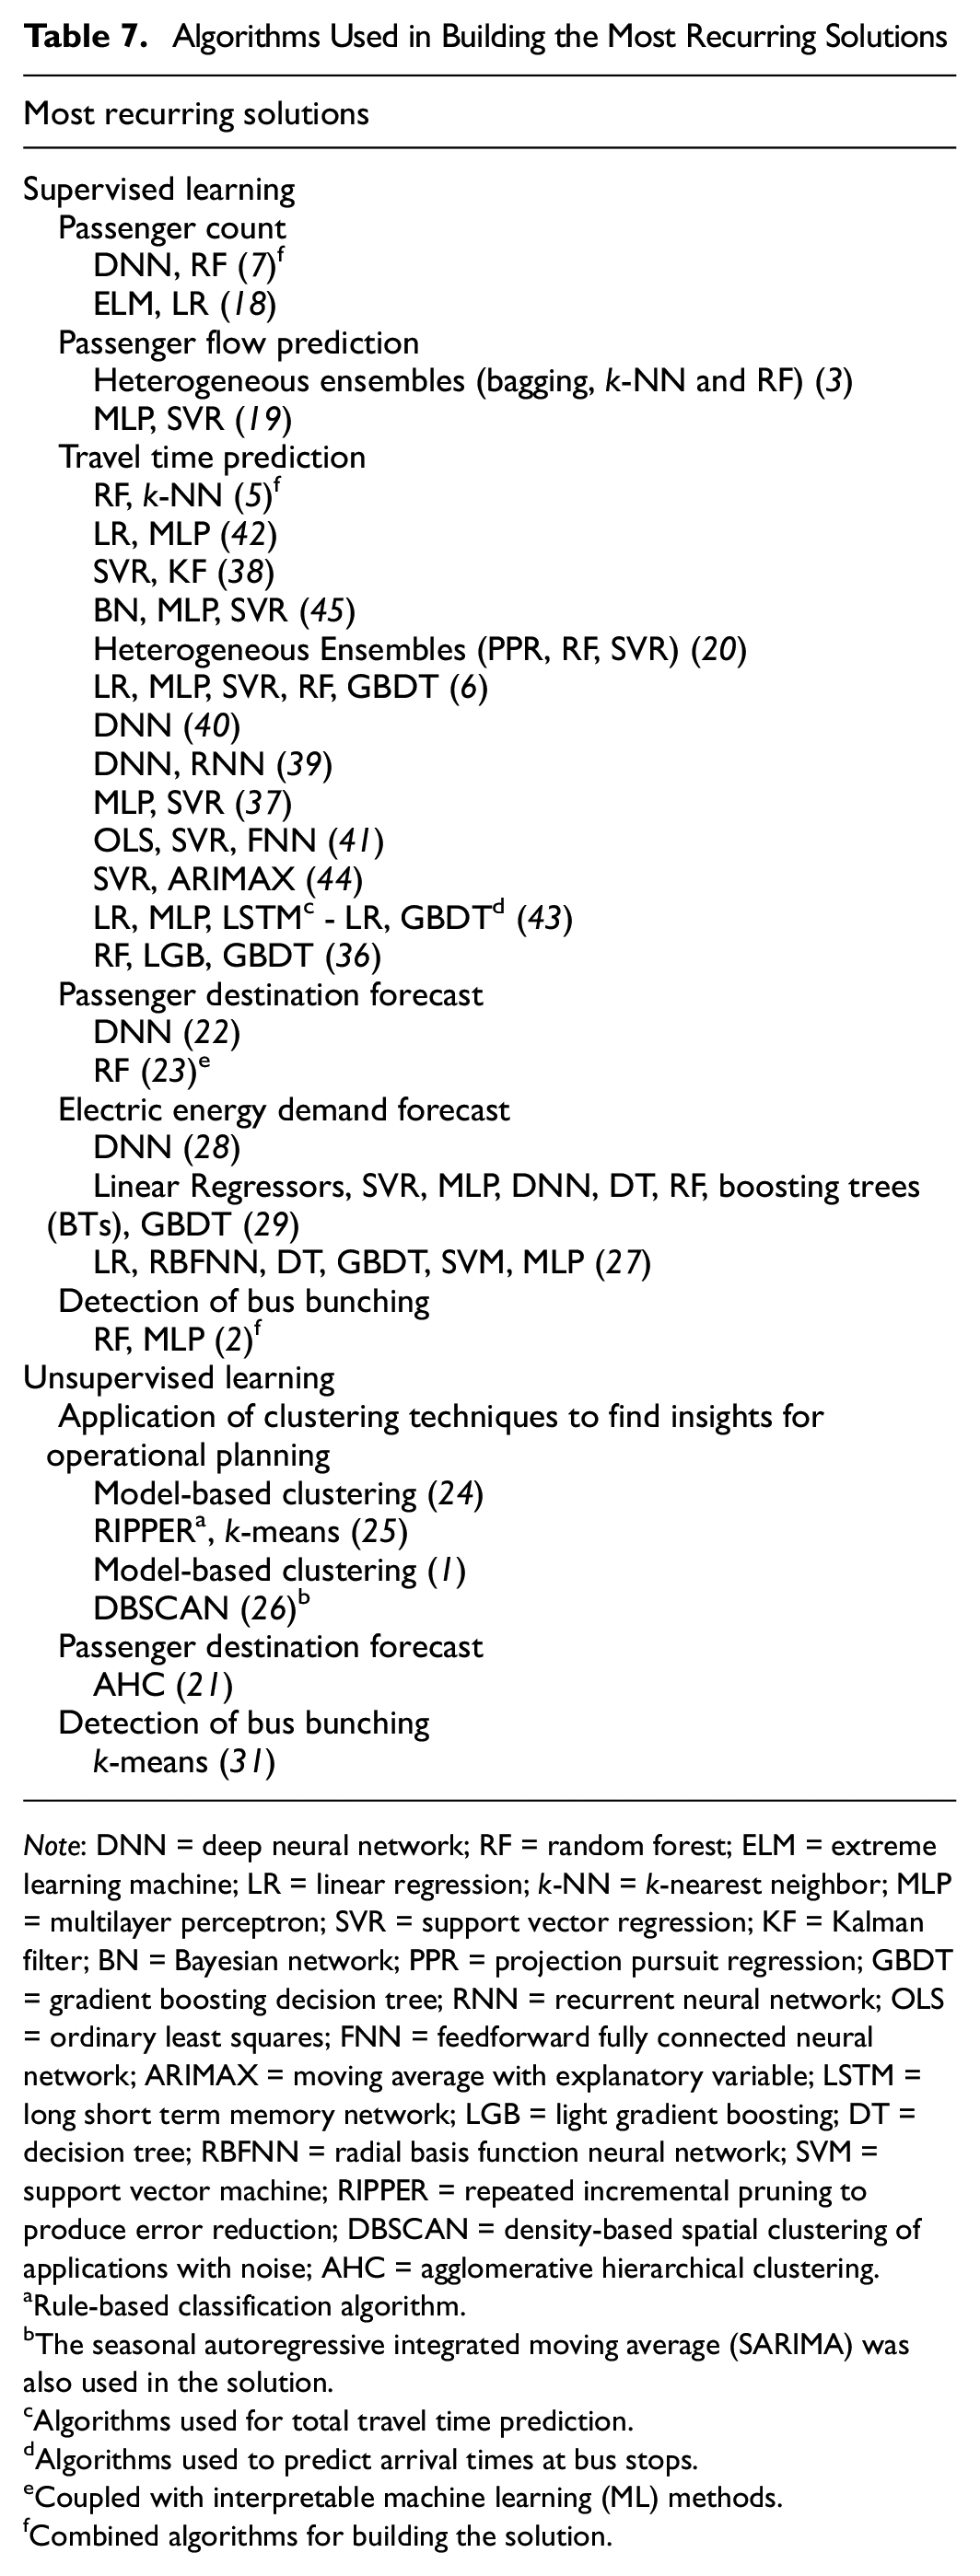
Note: DNN = deep neural network; RF = random forest; ELM = extreme learning machine; LR = linear regression; k-NN = k-nearest neighbor; MLP = multilayer perceptron; SVR = support vector regression; KF = Kalman filter; BN = Bayesian network; PPR = projection pursuit regression; GBDT = gradient boosting decision tree; RNN = recurrent neural network; OLS = ordinary least squares; FNN = feedforward fully connected neural network; ARIMAX = moving average with explanatory variable; LSTM = long short term memory network; LGB = light gradient boosting; DT = decision tree; RBFNN = radial basis function neural network; SVM = support vector machine; RIPPER = repeated incremental pruning to produce error reduction; DBSCAN = density-based spatial clustering of applications with noise; AHC = agglomerative hierarchical clustering.
Rule-based classification algorithm.
The seasonal autoregressive integrated moving average (SARIMA) was also used in the solution.
Algorithms used for total travel time prediction.
Algorithms used to predict arrival times at bus stops.
Coupled with interpretable machine learning (ML) methods.
Combined algorithms for building the solution.
With respect to supervised learning (Table 7), algorithms from different types of neural networks (MLP, ELM, DNN, RNN, LSTM, FNN, RBFNN), ensemble learning methods (RF, GBDT, bagging, LGB, boosting trees), and SVR were used most in constructing solutions. RIPPER was the only rule induction algorithm used to create a set of conditional rules from data extracted from an AVL system. In travel time prediction, we observe that the MLP, GBDT, and SVR algorithms were the most used. Only Taparia and Brady ( 43 ) explored the use of different algorithms for the prediction of total travel time and the prediction time between stopping points.
We observed that the SVM, MLP, DT, GBDT, and DNN algorithms were the most used in electric energy demand forecast. The other solutions did not have repetitions of the algorithms used. With respect to unsupervised learning (Table 7), model-based clustering is most used in the solution of the application of clustering techniques to find insights for operational planning. These models also use a notion of similarity between observations as the heuristic grouping algorithms (e.g., k-means) ( 65 ). However, model-based clustering offers more flexibility (any statistical distribution or model can be used for the components). Also, the observations in the same cluster share the characteristic that they are generated from the same cluster distribution ( 66 ). In the bus transportation domain, model-based clustering showed promising results in clustering data extracted from APC and AFC systems.
Table 8 shows the ML algorithms used to build the less recurrent solutions. Algorithms are divided into supervised learning, unsupervised learning, and reinforcement learning. Few solutions employ unsupervised and reinforcement learning techniques. In supervised learning (Table 8), we observed more significant use of different neural networks (MLP, DNN, RBFNN, CNN, LSTM) in constructing different solutions. Considering the group of more and less recurrent solutions, the MLP, RF, and SVR were the most used algorithms in constructing solutions for the bus transportation domain.
Algorithms Used in the Construction of Less Recurring Solutions
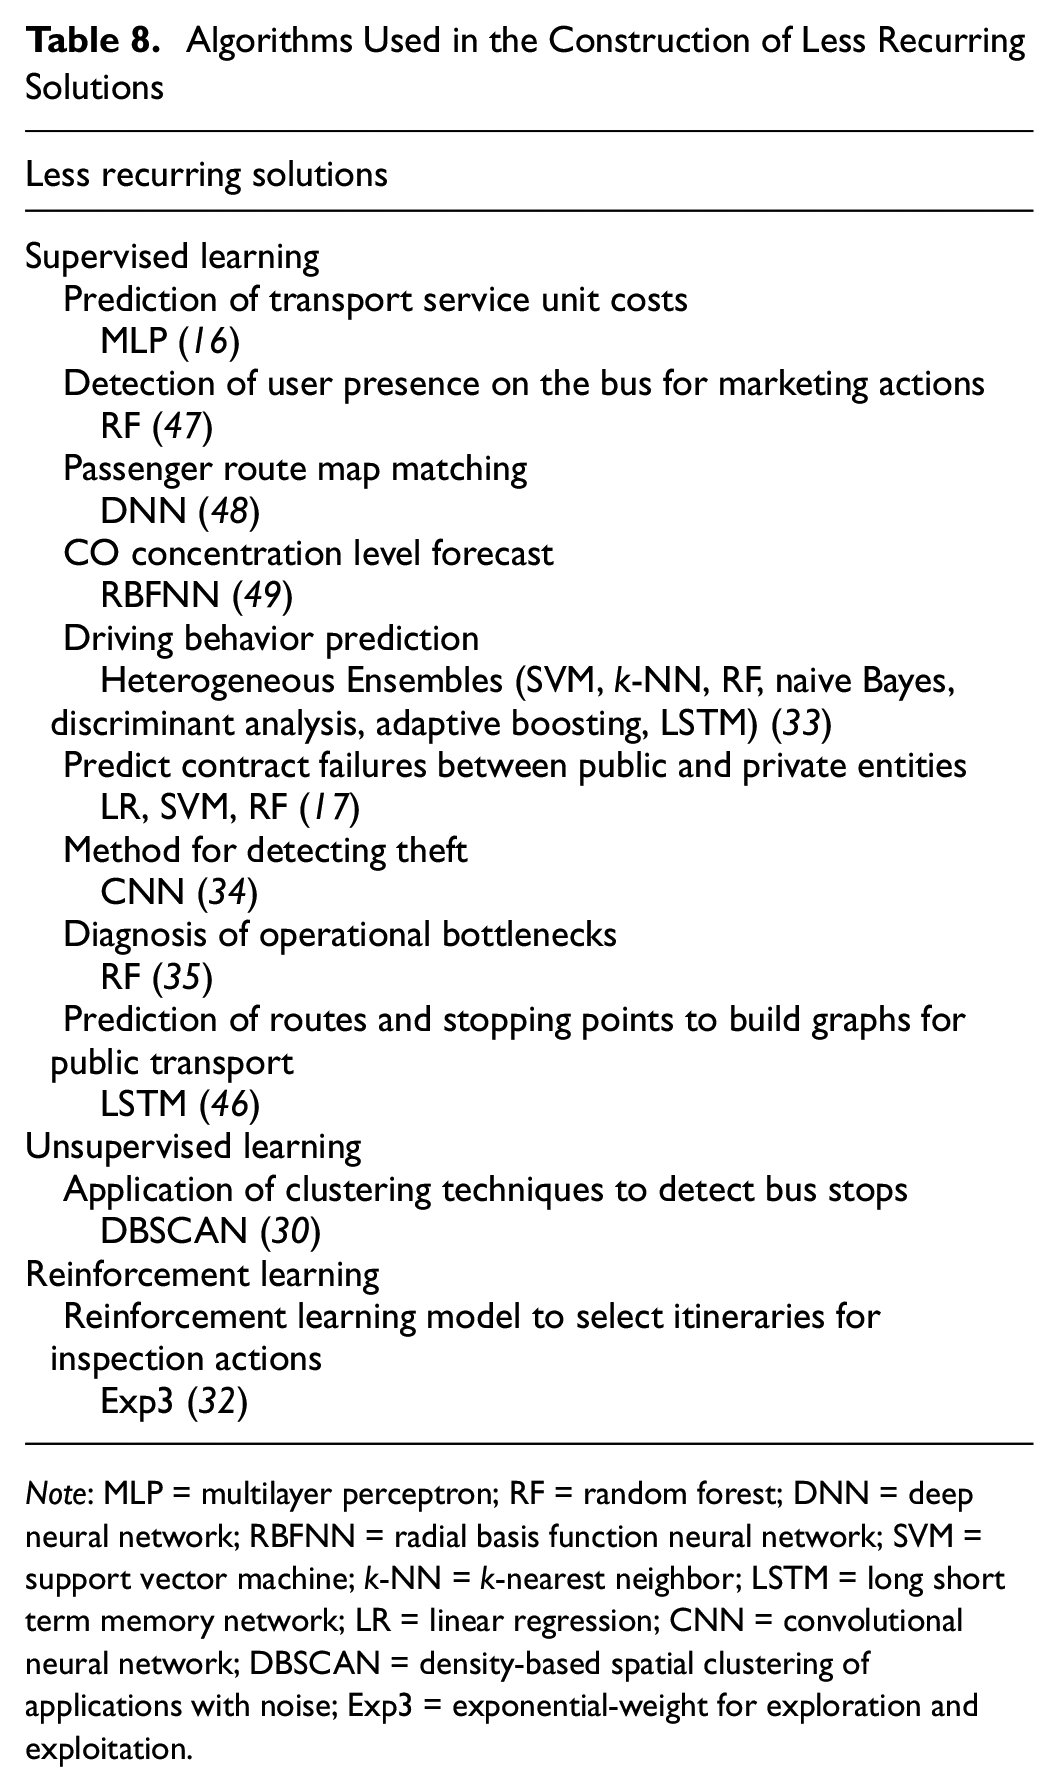
Note: MLP = multilayer perceptron; RF = random forest; DNN = deep neural network; RBFNN = radial basis function neural network; SVM = support vector machine; k-NN = k-nearest neighbor; LSTM = long short term memory network; LR = linear regression; CNN = convolutional neural network; DBSCAN = density-based spatial clustering of applications with noise; Exp3 = exponential-weight for exploration and exploitation.
Discussion
In this section, we present an overview of the modeling of ML-based solutions for bus transportation. We also point out the problems of public transportation that can be further explored in the literature. Finally, we briefly discuss some opportunities and challenges in building the most and least recurrent solutions (Table 4). We noticed that the proposed solutions focused on solving only two problems of bus transportation: lack of information to support the operational planning of transportation companies and the absence of information about travel time for passengers. The solutions proposed to support operational planning focused on supporting the definition of travel time schedules (e.g., frequency, travel time). The travel time forecast was the focus of the solutions to provide information to passengers. Despite the relevance of these solutions, other public transportation problems need more solutions.
In general, the catalog of solutions found in the literature is very restricted and does not address several problems of the bus transportation service. In building procedures, solutions that contribute to the technical evaluation of transportation companies participating in a bidding procedure, the detection of cartel formation, or suspicious bid fraud can be the focus of new research. With respect to operational planning, we did not find solutions to support other planning tasks (design of routes, vehicle scheduling, and crew assignment). Therefore, solutions focused on these tasks can help solve problems such as the definition of temporary routes to attend the occurrence of events (e.g., festivals), the coverage of the transportation service in a region (especially in neighborhoods with only one route option), the bus fleet maintenance, and the definition of stopping points.
In operational control, several solutions can be proposed, such as solutions for passenger safety (e.g., sexual harassment), solutions aimed at detecting non-compliance with stops at fixed points, and driver misconduct in approaching passengers. In the passenger demand theme, solutions that improve the accessibility of users in public transportation and encourage them to choose the bus as their daily means of transport can be explored.
With respect to the data used in the solutions, we observed that geolocation is used in constructing several solutions (e.g., passenger count to find insights for operational planning, passenger flow prediction, and detection of bus bunching) and that this type of data can be considered strategic for the construction of solutions. In general, we noticed that the data produced by devices on buses, from the most common ones such as tachographs and cameras to the most expensive devices (e.g., AFC, APC), are being used to construct solutions. However, the availability of these data can make it challenging to promote research in the area. Generally, the collected data is stored by transportation companies that may not offer direct means (e.g., API, open data portals) for collecting the data produced by the devices. For example, the data from inductive loop detectors used in the works found in the literature were simulated, probably because of the difficulty in obtaining accurate data.
Data collection can also be complicated as it involves capturing passengers’ smartphones. Often, users’ location and other more sensitive information can be captured by applications. For this, passengers must agree to the installation of apps and the privacy policy, which can be a problem for solutions that depend on collecting these data. In this scenario, other data types can be investigated, or alternatives can be proposed to replace user data.
Concerning personal data, specifically in travel time prediction, we only observed that temporal attributes (e.g., departure time, day of the week) were employed in constructing the forecast models. However, travel time can be affected by several factors (e.g., weather, accidents, events, works, and the number of lanes), and attributes related to these factors can contribute to the construction of more accurate models. Thus, constructing these models can explore other data types, and capturing and integrating them is a challenge.
Another point we observed is that most of the effort is concentrated on preparing data for the construction of solutions aimed at transportation by bus. For example, more complex techniques (e.g., map matching) can be used to construct the target attribute if it is unavailable in the collected database. Currently, there is no tool to support data scientists in preparing data collected from transportation network devices. If one were available, it could speed up the process of modeling solutions.
With respect to the ML algorithms used in constructing the most recurrent solutions, we observed that the GBDT, SVR, and neural network algorithms (MLP, RNN, FNN) generally obtained the best performance in travel time prediction solutions. The RF, MLP, and SVM algorithms presented good results in the electric energy demand forecast. In the other solutions, it was impossible to establish an overview of the performance of the algorithms, since some solutions combined the use of ML algorithms in the construction of the solutions (e.g., Nakashima et al. [7]) or did not perform a comparative performance analysis (e.g., Nageshrao et al. [28]).
Finally, we noticed that the number of proposed solutions in this SLR was mainly concentrated in 2020 and 2021. About 30% of the articles reviewed in this SLR were published in 2021. This shows that researchers are currently interested in solving problems related to transportation by bus. In addition, we have identified solutions aimed at solving problems related to electric buses aligned with the growing climate concern and the fleet increase of this type of bus.
Opportunities and Challenges in Building Solutions
In applying clustering techniques to find insights for operational planning, we identified that the proposed solutions by Khiari et al. ( 24 ) and Mendes-Moreira et al. ( 25 ) do not need an expert (e.g., data miner, data scientist) to interpret the insights provided by these solutions. In an automated way, these solutions provide insights that can help transportation companies adapt their operational plans. The solution proposed by Mohamed et al. ( 1 ) depends on an expert. In this sense, we believe automated solutions can be more easily implemented in cities as they do not require an expert in the area and, therefore, should be the focus of the research developed.
With respect to the number of bus lines used in conducting experiments, Khiari et al. ( 24 ) and Mendes-Moreira et al. ( 25 ) used data from some bus lines. Mohamed et al. ( 1 ) performed their experiments with data from much larger bus lines (70 lines). To further evaluate the use of these solutions, new experiments can be carried out using a greater diversity of bus lines. In addition, none of the works focused on evaluating insights for seasonal schedules (e.g., Christmas, New Year).
Considering the solution passenger count, proposed by Nakashima et al. ( 7 ), the challenge lies in occlusions and passengers positioned on the borderline, causing a significant margin of error in the number of passengers estimated by image processing. In this solution, a method using the RF algorithm was used to correct errors caused by occlusions and it achieved good results. In Li et al. ( 18 ), the main challenge is how the ventilation system can affect the performance of CO2 sensors. In this case, the proposed solution can be considered preliminary, and the ventilation system effect needs further exploration.
The passenger flow prediction varies because of several internal and external factors. For example, passenger demand may vary depending on the day of the week, the type of day (e.g., holiday/working day, school day), departure time, and weather conditions. To try to predict this variability, Samaras et al. ( 3 ) evaluated different feature sets, and Jin et al. ( 19 ) proposed the SIM. Both obtained promising results, However, further experiments can be conducted to explore further the inclusion of factors that affect passenger flow prediction.
Most travel time prediction works have focused their experiments on forecasting the time on stretches susceptible to congestion or some bus routes. However, only Yamaguchi et al. ( 6 ) addressed time forecasting using many bus routes (approximately 80 routes). In this scenario, the predictor is more complex as it needs to predict travel time correctly on routes with different characteristics. Then, the predictor may not perform well, and other models can be explored (e.g., a new set of features and algorithms) for groups of routes with similar characteristics. For example, weather prediction on routes that pass through major city roads can benefit from information about the occurrence of traffic jams and accidents.
Other strategies were also adopted to improve the performance of bus routes with the high variability of travel time in the routes. Bahuleyan and Vanajakshi ( 5 ) achieved better results by separately predicting travel time in the areas of road intersections than on the complete dataset. In Mendes-Moreira et al. ( 20 ), a heterogeneous ensembles approach can mitigate some instability observed by algorithms when dealing with seasonal data. More complex approaches (e.g., LSTM and deep CNN) can consider non-linear phenomena (e.g., traffic jams) and provide closer predictions of travel time ( 41 , 42 ). However, the prediction of travel time in these scenarios is still considered a challenge and can be explored by further work.
In travel time prediction, further research could be conducted to verify which algorithms might better predict total travel time and the weather between stopping points. Only the work proposed by Taparia and Brady ( 43 ) proposed this investigation. In passenger destination forecasts, Jung and Sohn ( 22 ) verified that the DL model did not obtain satisfactory matching accuracy and pointed out that using more reliable data on socioeconomic activities around the candidate destination can considerably increase predictor performance.
In the transportation service unit cost forecast model proposed by Avenali et al. ( 16 ), the commercial speed, the average age of the rolling stock, and the degree of renewal of the fleet were identified as factors that most affect the overall unit cost of the service. However, the experiments used data collected from Italian transportation companies; therefore, these factors cannot be generalized to other locations. This model must be implemented in other scenarios to investigate whether these factors are also significant in other transportation networks.
In the electric energy demand forecast, Nageshrao et al. ( 28 ) pointed out that real data on bus charging needs to be used for model validation and indicated that, in the future, other information such as passenger profile, time of the day, and driver behavior could be included in model training. Wang et al. ( 29 ) indicate that using more detailed meteorological information (e.g., wind speed) could improve the model’s performance. Finally, Abdelaty et al. ( 27 ) pointed out that more experiments should be carried out with different configurations of electric buses.
In the driving behavior prediction ( 33 ), we identified that the class imbalance may have affected the model’s performance. Therefore, new experiments could be performed using techniques to deal with class imbalance. In the detecting theft method, Affonso et al. ( 34 ) pointed out that the videos’ temporal information captured from the bus cameras can be exploited to improve the model’s performance. In this solution, we identified the challenge of reducing false positives to increase model performance.
In predicting contract failures between public and private entities, Wang et al. ( 17 ) pointed out that employee neural networks could be tested to improve accuracy. In the diagnosis of operational bottlenecks, an additional solution could be proposed to indicate solutions or corrective actions to address the unidentified causes. In predicting routes and stopping points to build graphs for public transportation, Iovino et al. ( 46 ) indicated that efforts could be made to refine the results.
In applying clustering techniques to detect stops, Rajput et al. ( 30 ) focused on finding stopping points in countries like India, where the bus can stop anywhere it encounters passengers. In countries with fixed stopping points, this solution can be applied to identify irregular stops along the bus route. In the framework for detecting and correcting bus agglomerations proposed by Moreira-Matias et al. ( 2 ), parameter configuration optimally is opened. In addition, other algorithms can be evaluated to improve the offline predictor present in this framework and the feature engineering processes can be further explored.
In the reinforcement learning model to select itineraries for inspection actions, the bus schedule collected by the tracking systems can help in the definition, in real-time, of inspection itineraries ( 32 ). In detecting the user’s presence on buses, Heydary et al. ( 47 ) indicated that incorporating information about public transportation routes and timetables can improve the proposed solution. In the passenger route map matching solution, Salvador et al. ( 48 ) pointed out that the incorporation of historical records of real-time information during the training process as an opportunity to improve the solution. Finally, the CO concentration level forecast can be complex because of several factors, such as ventilation settings and weather conditions. Kadiyala and Kumar ( 49 ) indicate the need to validate the proposed model with other databases.
Conclusion
This SLR addressed the problems of public bus transportation and the ML-based solutions proposed in the literature to address them. The problems were grouped into four central themes: bidding procedures, operational planning, operational control, and passenger demand. Problems related to operational planning and passenger demand had the most concentration of work. Despite the variety of solutions proposed in the literature, there are other problems of public transportation by bus that have not yet been addressed in the literature (e.g., detecting non-compliance with stops at fixed points, driver misconduct), evidencing that this domain needs solutions to improve several aspects of the service offered.
The categorization of solutions in these four themes makes it possible to identify which solutions contribute to improving the service provided at a specific stage of the process. This outline of solutions will help transportation professionals choose the most appropriate solution to act correctly (as recommended by the PDCA cycle) at each stage. In addition, these professionals can identify which problems are still open and strategically direct efforts to develop them.
The development of solutions for bus transportation relies on a diversity of data types collected from devices available on the transportation network. These devices are increasingly present in the bus fleet (e.g., AVL, APC, GPS) and the transportation network (e.g., inductive loop detectors, cameras) of cities, driving the construction of solutions. However, some works still reported difficulties obtaining real data to construct solutions. For example, Bahuleyan and Vanajakshi ( 5 ) and Panovski et al. ( 42 ) used artificial data from inductive loop detectors in their experiments because of the difficulty in obtaining it.
Building public transportation solutions requires extensive data preparation and often integrates other data sources. For example, in constructing a travel time predictor, using more complex approaches (e.g., map matching) may be necessary for constructing the target attribute if it is not available in the collected database. In this solution, other types of data can be integrated (e.g., weather conditions, congestion). This data preparation consumes much of the time data scientists spend, especially those new to modeling these solutions. We observed that there are no specific tools for preparing data collected from devices in the transportation network. Their development can support data scientists and speed up the construction of solutions.
Footnotes
Author Contributions
The authors confirm contribution to the paper as follows: study conception and design: Tielle Alexandre, Flávia Bernardini, José Viterbo, and Carlos Eduardo Pantoja; data collection: T. Alexandre; analysis and interpretation of results: Tielle Alexandre, Flávia Bernardini, José Viterbo, and Carlos Eduardo Pantoja; draft manuscript preparation: T. Alexandre. All authors reviewed the results and approved the final version of the manuscript.
Declaration of Conflicting Interests
The author(s) declared no potential conflicts of interest with respect to the research, authorship, and/or publication of this article.
Funding
The author(s) received no financial support for the research, authorship, and/or publication of this article.
Data Accessibility Statement
Data sharing is not applicable to this article as no datasets were generated or analyzed during the current study.