
Abstract
The condition of a country’s roadway infrastructure significantly affects its economic development. Highway agencies that manage pavements often communicate their road network condition by using single or multiple composite condition indices. Each agency relies on its condition index to make maintenance decisions and perform budget allocation. Generally, these condition indices follow a similar level of the rating scale (100 to 0, where 100 denotes perfect condition). However, because of different numbers of distress inputs with different units, different severity levels, and different deduct points and mathematical formulas, condition indices are often incomparable. Consequently, research focused on comparing different distress indices using a highway agency’s pavement distress data is lacking. The objective of this study is to provide a comparative analysis of different condition indices using Michigan Department of Transportation’s (MDOT) flexible distress data, as part of an effort to develop a new index for Michigan. In this process, 2,081 flexible pavement sections were identified from MDOT’s Pavement Management System database, and five different condition indices were evaluated and compared against MDOT’s Distress Index. Comparison results were presented through scatter plots and statistical analysis results. MDOT’s maintenance records were also used to compare the ranges of magnitudes of various indices computed at the time when various types of maintenance activities took place. Finally, this study resulted in recommendations for selecting a new condition index and calibration needs of deduct points and equations.
Keywords
A country’s economic development is significantly influenced by both the extent and condition of its roadway network. Therefore, significant resources are invested building road infrastructure and maintaining good serviceable roads through maintenance and rehabilitation (M&R) activities. Over time, road conditions deteriorate, and agencies track those conditions by measuring pavement distresses and functional data related to smoothness and skid resistance by periodic road survey ( 1 ). Often agencies that manage pavements communicate their network condition by using single or multiple composite condition indices. These condition indices are central to pavement management as agencies rely on them for treatment selection decisions, budget allocation, and other activities that are central to proper pavement management ( 2 – 6 ).
A pavement condition index represents a pavement’s structural condition, functional condition, or both, at a given point in time. One purpose of a condition index is to quantify the performance of a road network subjected to repeated vehicle loading and environmental changes. A pavement condition index is generally calculated for different types of distresses, severity levels (i.e., low, medium, and high), and extent ( 7 , 8 ). The first step in the calculation is generally to represent a pavement section with no defects, so the best possible score (e.g., 100) is assigned. Then deduct points are assigned based on measured distresses at different severity levels. Finally, total deduct points are combined with the assigned best score to obtain a composite condition index of a pavement section.
Like many other state Departments of Transportation (DOTs) in the United States ( 9 – 23 ), Michigan DOT (MDOT) has its own condition index, called Distress Index (DI) that was first developed in the late 1980s. The DI is calculated by assigning increasing-value numeric “points” to the quantity and severity of various surface distresses such as cracks, potholes, and so forth. These distresses are surveyed based on the videos of the pavements, where vendors are required to visually classify each distress into numerous categories of different Principal Distress (PD) codes for various types of pavements. Then, different principal distresses are subcategorized with Associated Distresses (ADs), representing the severity levels of individual distresses. The PD and AD matrices in MDOT’s distress identification manual are quite detailed, and this level of detail is inconsistent with the practice followed nationwide. Several complications arose because of the unique nature of the Michigan practices, such as the limited availability of vendors to perform the condition data gathering and rating. Consequently, MDOT decided to suspend the collection of distresses in the current level of detail required. Therefore, DI can no longer be computed for the network. Realizing these differences and challenges in distress data collection, MDOT is currently working to reassess and redevelop its DI to follow more closely to national standards (e.g., ASTM D6433 [ 24 ], AASHTO R 85-18 [ 25 ], NCHRP Project 1-57A [ 26 ], etc.). Therefore, in this study, the DI was compared against other condition indices used in different states with the same rating scale (i.e., 0 to 100, where 0 means perfect condition with zero defects). MDOT’s pavement management system (PMS) database was used as the source of data inputs. Moreover, MDOT’s past road maintenance works were analyzed based on considered condition indices. The goal of this study is to demonstrate a framework to develop a condition index that can be followed by other agencies that are evaluating their condition indices.
Objective
The objective of this study is to detail the approach used to conduct a comparative analysis of different condition indices using Michigan DOT’s pavement distress data. This study is anticipated to provide an initial framework and guidance for agencies to use when developing a composite pavement condition index.
Literature Review on Condition Indices
The concept of pavement condition evaluation evolved at the time of the AASHO Road Test. A panel of raters was used to drive on roads and rate them based on their ride comfort. Those ratings were then compared with distresses present on the pavement, and the ultimate rating procedure was named Present Serviceability Rating (PSR). This process was subjective and based on relating rider comfort to measured physical defects and distresses. The result of calculating the PSR from measured pavement parameters resulted in an index called Pavement Serviceability Index (PSI) ( 27 ). The general mathematical formula of the PSI is presented in Equation 1:
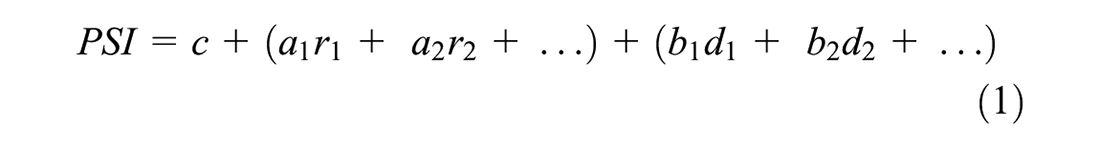
where r1, r2, … represent profile roughness function, d1, d2, … represent surface defects, and c, a1, a2, d1, d2 = regression coefficients.
Another popular composite metric is the Pavement Condition Index (PCI) developed by the U.S. Army Corps of Engineers ( 7 ). Later, PCI was standardized by the American Society for Testing and Materials (ASTM) standard for quantifying the condition of roads and parking lots ( 24 ). The PCI is an index calculated using many types and severities of distresses present on the pavement surface. PCI ranges from 0 to 100, where 100 is the perfect score.
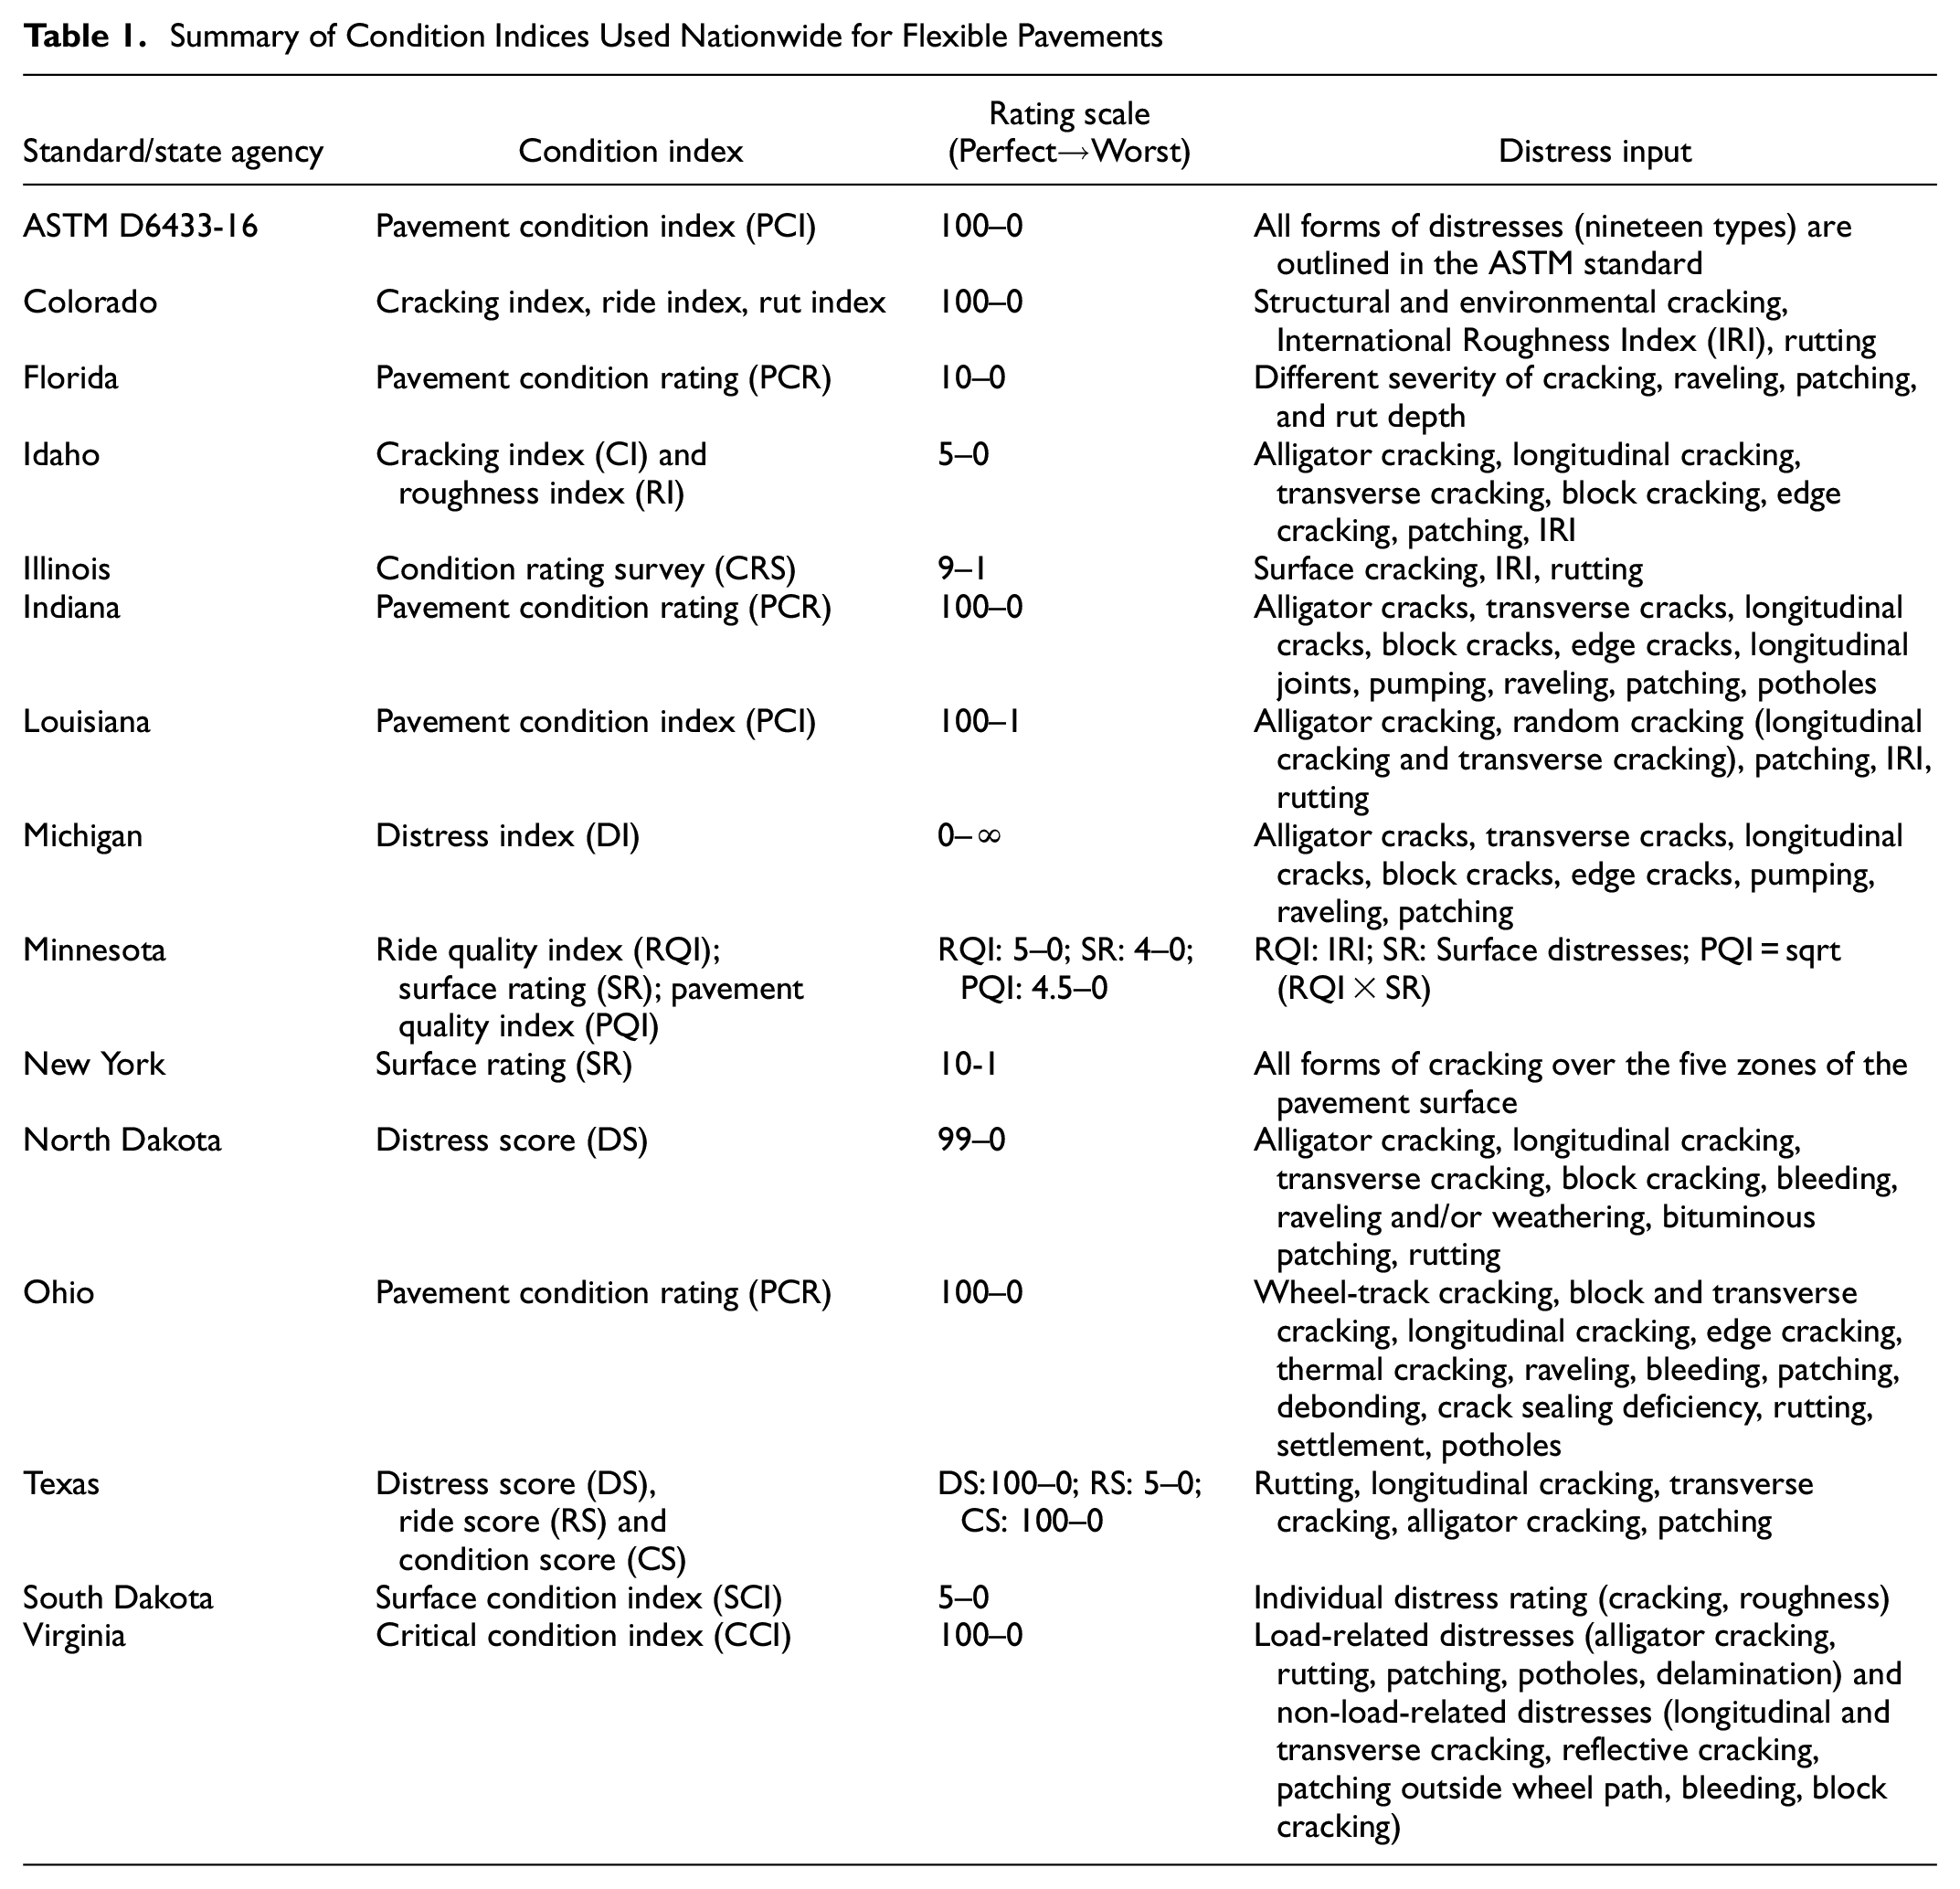
Later, based on the original PCI concept, many state agencies in the United States formed their own condition indices with different acronyms, similar or slightly different rating scales, and different distress inputs with deduct points. Table 1 represents a list of different pavement condition indices used by various state DOTs ( 9 – 22 ). Also, the corresponding rating scale and distress inputs are highlighted in the table. It is to be noted that different state agencies may share similar acronyms. For example, Florida DOT and Indiana DOT both named their condition index as Pavement Condition Rating (PCR) but the rating scale and distress inputs are different, as shown in Table 1. Although it might be tempting to compare pavement condition of the same rating scale from two different agencies, the same numeric value may not represent similar pavement conditions.
Summary of Condition Indices Used Nationwide for Flexible Pavements
Michigan DOT Distress Data
Historically, MDOT has collected many distresses on their pavement surface. Since 1992, MDOT has been maintaining its PMS database where all of the measured distress data are stored. At present, for asphalt pavement, MDOT collects fifteen different distresses or PDs present alongside the transverse and longitudinal direction of traffic movement. The severity and extent of individual distresses are presented by some AD codes. An example associated distress matrix table of flexible pavement transverse crack (TC) (PD 103) is shown in Table 2 ( 28 ). The severity of a TC is estimated by transverse length (total accumulated length along crack alignment where associated distress observed), and maximum width (at any single location along crack alignment) of the ADs that occur within 2 ft of the TC. The conversion of AD levels into the typical severity levels used by other state DOTs (i.e., low, medium, and high) and computing their condition indices is not straightforward. Several assumptions need to be made based on AD matrices to define a PD with different severity levels. More details on how these assumptions were made are presented later in the paper (e.g., Table 3).
Michigan Department of Transportation Associated Distress Matrix Table for Hot Mix Asphalt Transverse Cracking
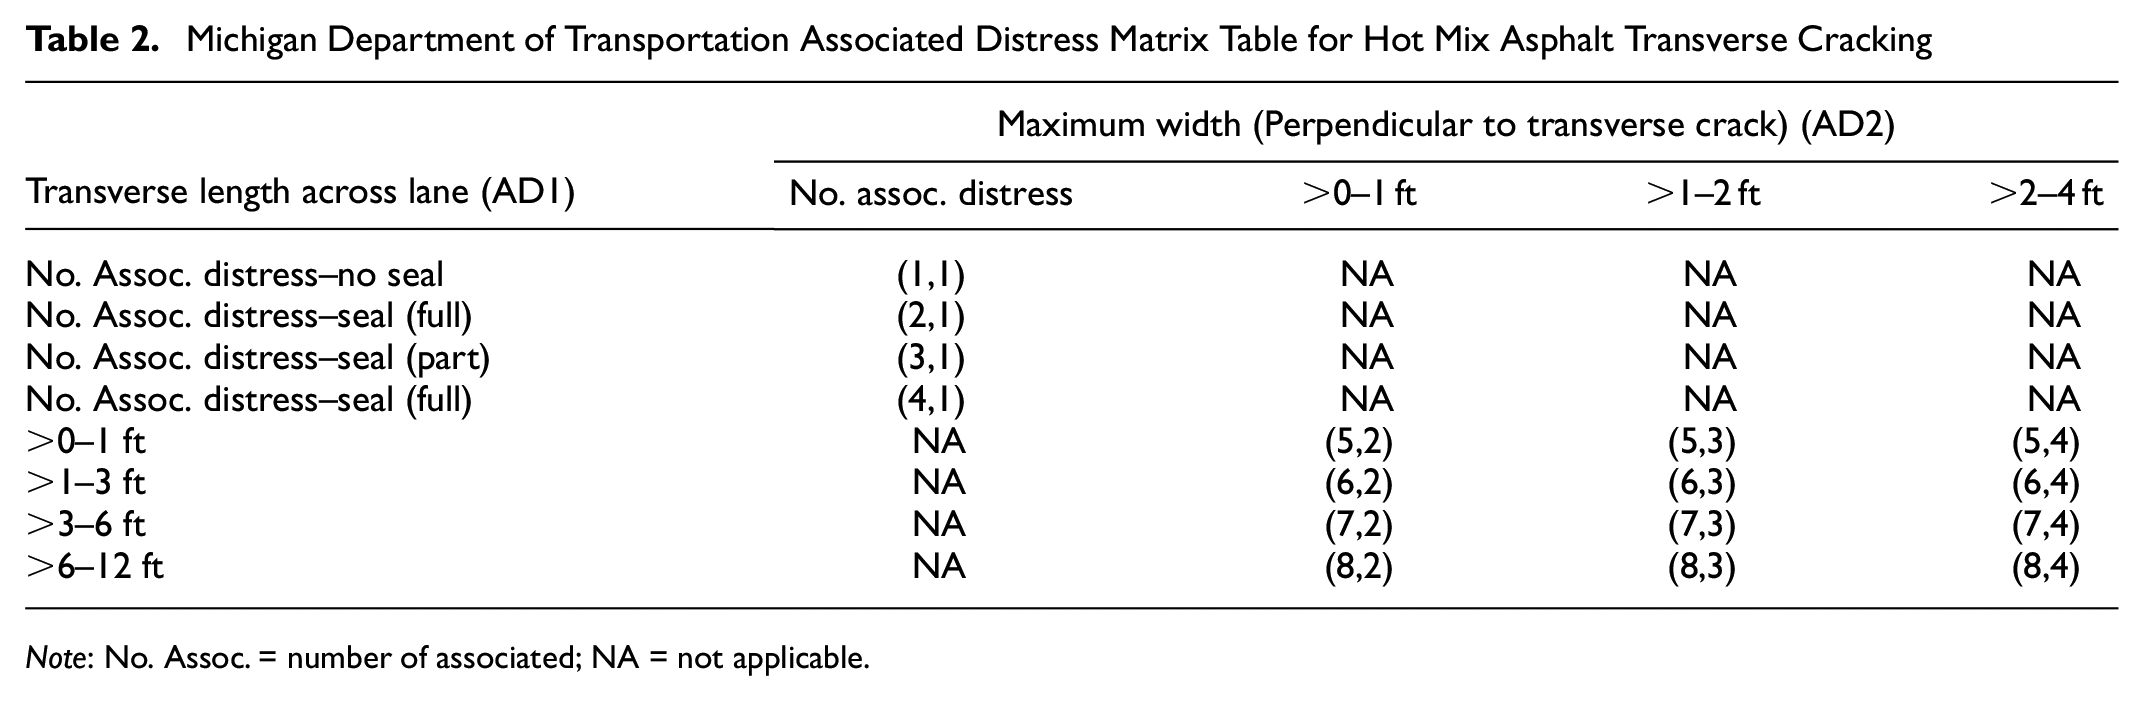
Note: No. Assoc. = number of associated; NA = not applicable.
Assumed Michigan Department of Transportation (MDOT) Severity Levels for LDR and NDR Distress Components
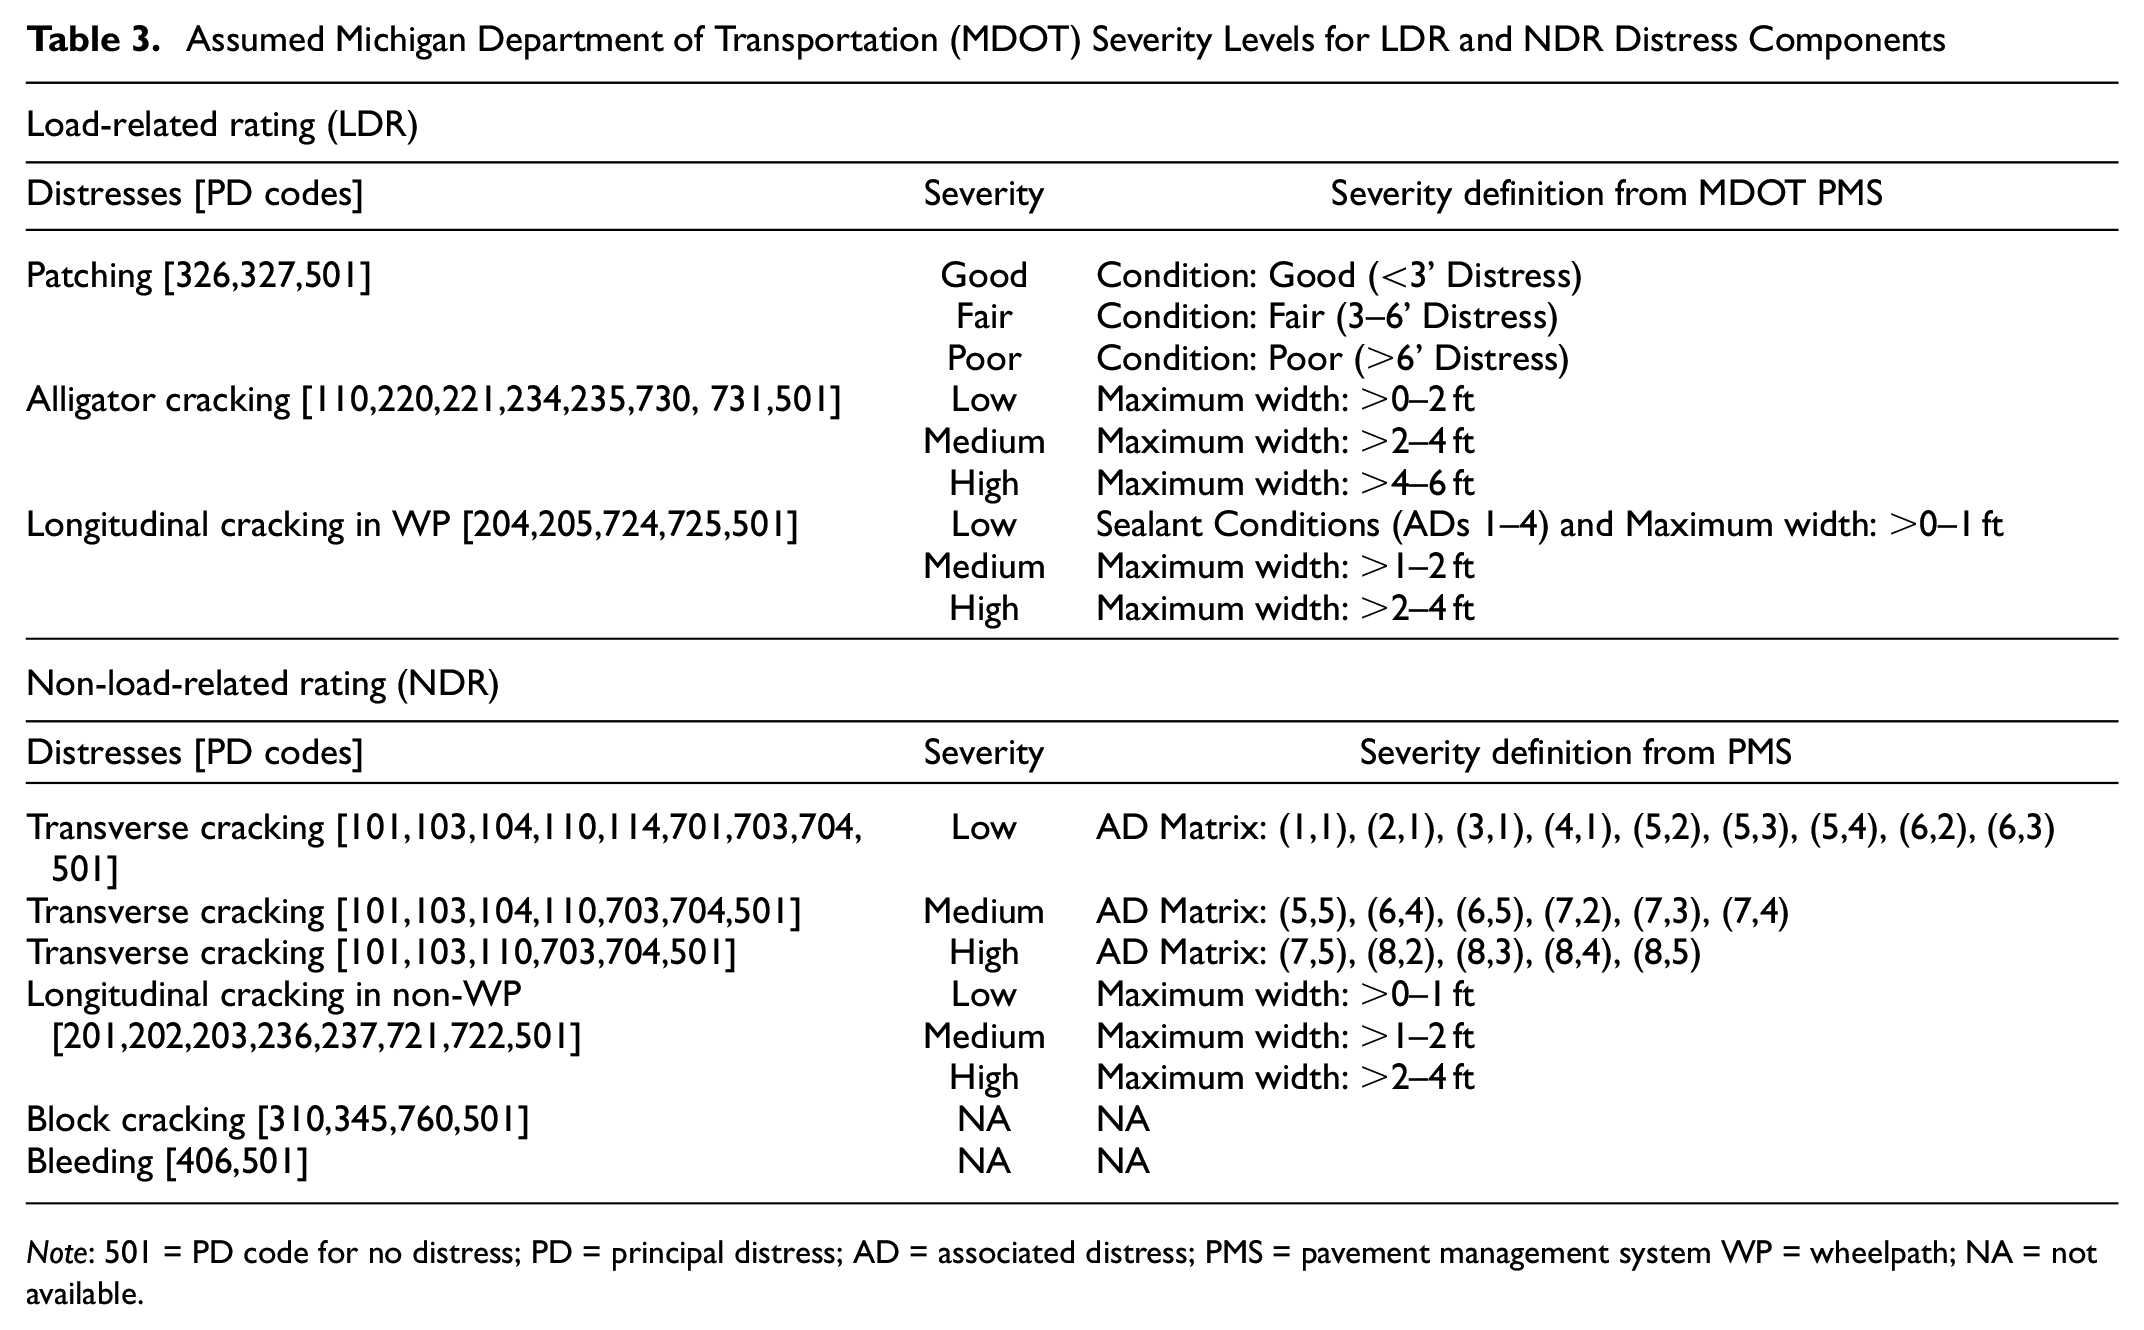
Note: 501 = PD code for no distress; PD = principal distress; AD = associated distress; PMS = pavement management system WP = wheelpath; NA = not available.
In this study, a total of 2,081 flexible pavement sections were selected, which are currently available in the MDOT’s PMS database for different surface types. Raw data for different distresses have been reported in the MDOT’s PMS database as either length or count. These data are converted to desired units for computation of distress indices.
Selected Pavement Condition Indices
A sample of pavement condition indices were selected and evaluated from the list provided in Table 1; the sample was based on comparing the required distress inputs and the distresses available from the MDOT database. Based on the available data, Virginia DOT’s Critical Condition Index (CCI), Minnesota DOT’s Surface Rating (SR), North Dakota’s Distress Score (DS), Louisiana Department of Transportation and Development (DOTD’s) PCI, and Oregon DOT’s Overall Condition Index (OCI) were evaluated the selected sections. These condition indices were selected based on the available calculation steps, a similar type of distresses included in the condition index, and to cover different climatic regions nationwide to reflect how MDOT-collected PMS data can be compatible with those condition indices. Figure 1 shows these selected five condition indices highlighted as blue-shaded colors on the U.S. geographical map. Also, corresponding rating scales of all these five condition indices are shown in Figure 1, where the upper limit represents the perfect score. It can be observed that distress indices from each of these states have different scales unlike MDOT’s DI, which goes from zero (0) to no upper bound. For comparison purposes only, to match with MDOT’s DI scale, all distress indices were linearly scaled on a scale of zero (0) to 100, where zero represents the perfect score. Moreover, for DI scores, only up to a value of 100 have been considered. This decision was made by observing MDOT’s historical DI data, as a very small portion of MDOT’s data exceeded a DI value of 100. It is important to note that all the pavement condition indices here were evaluated with the same 2,081 pavement sections for same years of distress data so that the comparison would be consistent.
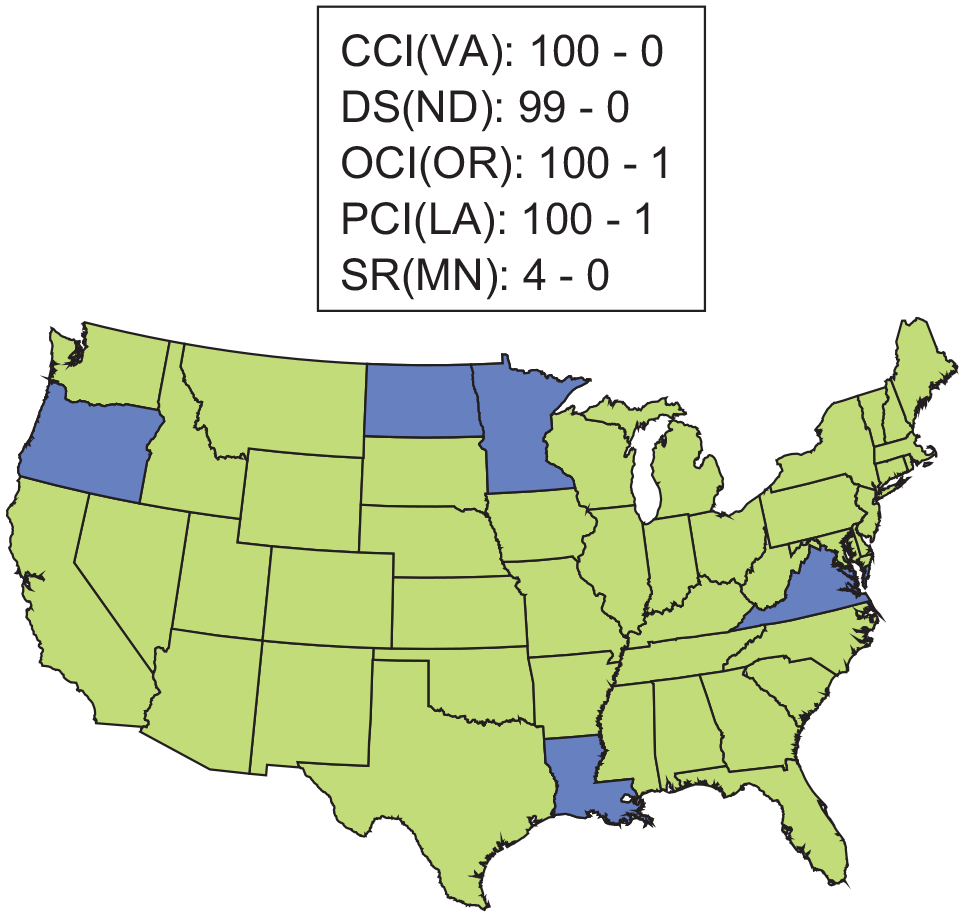
Geographical location of the selected pavement condition indices in the U.S.A. map.
Method
In the below subsections, calculation procedures for the MDOT’s DI, Virginia DOT’s CCI, Minnesota DOT’s SR, North Dakota’s DS, Louisiana DOTD’s PCI and Oregon DOT’s OCI for flexible pavement are described. It is important to note that as MDOT’s DI does not consider rutting, and International Roughness Index (IRI), and thus these sensor data inputs were ignored even if the original calculation of a condition index requires them.
MDOT’s Distress Index (DI)
MDOT’s DI is calculated as the total accumulated distress points for a given road pavement section. In DI calculation, distress points do not act as deduct values, and therefore the DI does not have an upper bound. However, a threshold value of 50 represents a pavement is in poor condition and major rehabilitation or reconstruction is warranted for that section ( 29 ). Similarly, DI ranges from 0 to 25 denotes good condition and 26 to 49 denotes a fair condition pavement. As mentioned previously, the MDOT PMS database stores individual distresses that are represented by PD codes, and associated distress matrices are used to define severity of each distress. Based on the associated distress combination, as shown in Table 2, distress points were assigned for each cell of an associate distress table. Equations 2 to 4 are used to calculate MDOT’s DI.

where DI = Distress Index of entire pavement segment,
DI1 = Distress Index from transverse PDs,
DI2 = Distress Index from longitudinal PDs.

where Ni = Number of transverse PD occurrences,
Di = Point per PD occurrence per basic segment length,
B = Basic pavement segment length (0.1 mi),
L = Total length of subject pavement section, mile.

where Xi = Length of subject of PD, mile,
Pi = Point per % of L for subject PD,
L = Total length of subject pavement section.
Virginia DOT’s Critical Condition Index (CCI)
Virginia DOT’s CCI is a composite index comprising Load-Related Rating (LDR) and Non-Load-Related Rating (NDR) ( 30 ). LDR includes alligator cracking, patching, potholes, delamination, and rutting, whereas block cracking, patching and longitudinal cracking out of wheel path, transverse cracking, reflection cracking, and bleeding are components of NDR. It is important to note that in the MDOT PMS database, potholes, delamination, and reflection cracking data are not available for flexible pavements. It is also important to note that in the Virginia DOT reference guide, longitudinal cracking under the wheel path is not mentioned separately whereas this distress exists with a unique PD code in the MDOT PMS database. In CCI calculation, longitudinal cracking was considered part of alligator cracking.
Several distresses in the Virginia DOT reference guide are classified into three severity levels (i.e., low, medium, and high). Although MDOT PMS database does not explicitly mention similar severity levels, based on distress type, severities are expressed by either transverse length, maximum width, or both, of the associated distresses. For different transverse lengths and/or maximum width ranges, associated distresses of principal distress are grouped into a matrix. Therefore, to make the MDOT surveyed distresses compatible with the Virginia DOT condition index calculation, some assumptions related to severity levels were made from the associated distress matrix reported in the MDOT Distress Survey Manual ( 28 ). Table 3 shows the assumed severities from the MDOT PMS database for LDR and NDR distress components, respectively. In Table 3, each pavement distress is presented by corresponding PD codes shown in square brackets. It is to be noted in the past MDOT added/replaced several PD codes in its different versions of survey manual documents. Therefore, to extract data for all available years, all possible PD codes related to a distress type are tabulated in Table 3.
Several MATLAB codes were written to extract PMS data commensurate to the Virginia DOT approach to calculate LDR, NDR, and CCI for selected asphalt pavement sections. Some other assumptions were made in the required unit conversion; for example, block cracking is not reported in the MDOT PMS database with associate distresses rather, it is reported only in length. To satisfy the calculation unit of square foot, the transverse width of block cracking was assumed as 12 ft. Alligator cracking, longitudinal cracking in the wheel path, and patching were converted into square feet units by multiplying their length with the average maximum width, as shown in Table 3.
Total deduct points for all tabulated distress components were calculated through corresponding deduct equations ( 30 ). After calculating all deduct points, LDR and NDR were calculated by subtracting individual total deduct points from the perfect score of 100. Finally, for a given year and pavement section, CCI was calculated as the minimum value of both LDR and NDR and similarly calculated for all other years and pavement sections. It is to be noted that CCI ranges from 0 to 100 (i.e., from worst to perfect condition). To align with the same scale of DI (assumed DI’s higher range to be 100), CCI was inverted by subtracting it from 100.
Minnesota DOT’s Surface Rating (SR)
Minnesota DOT’s SR captures visible surface distress conditions. Table 4 lists the surface distresses considered in the SR calculation with associated deduct points at different severity levels ( 15 ). Table 4 also shows the assumptions related to the severity levels of surface distresses. Several MATLAB codes were used to extract PMS data in the required unit, that is, percentages. Transverse cracking at three severities was converted to percentage using the following Equation 5 ( 15 ):
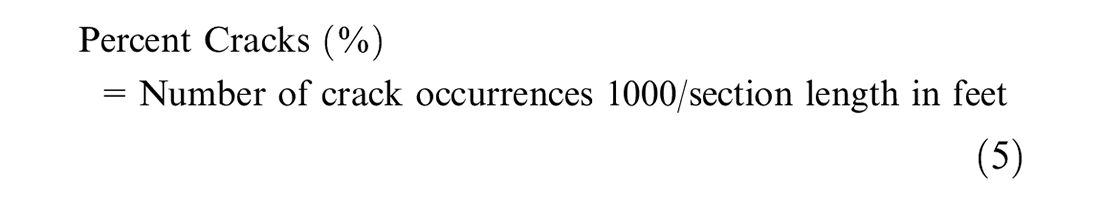
All other distresses were converted to a percentage by simply dividing the length of the distress by the surveyed section length ( 15 ). Once all the distresses were in percentage, individual weighted distresses were calculated by multiplying the percent of each distress with the appropriate weighting factors shown in Table 4. Then, the sum of all individual weighting distress was calculated to get the total weighted distress (TWD). In the last step using Equation 6 (adopted from the Minnesota DOT’s distress identification manual [ 15 ]), SR for a given year and road section was calculated:

It is to be noted that the SR scale ranges from 0 to 4 (i.e., from worst to perfect condition). To make the SR scale similar to the MDOT’s DI scale the following conversion was made:

Assumed Michigan Department of Transportation Severity for Surface Rating (SR) Distress Components
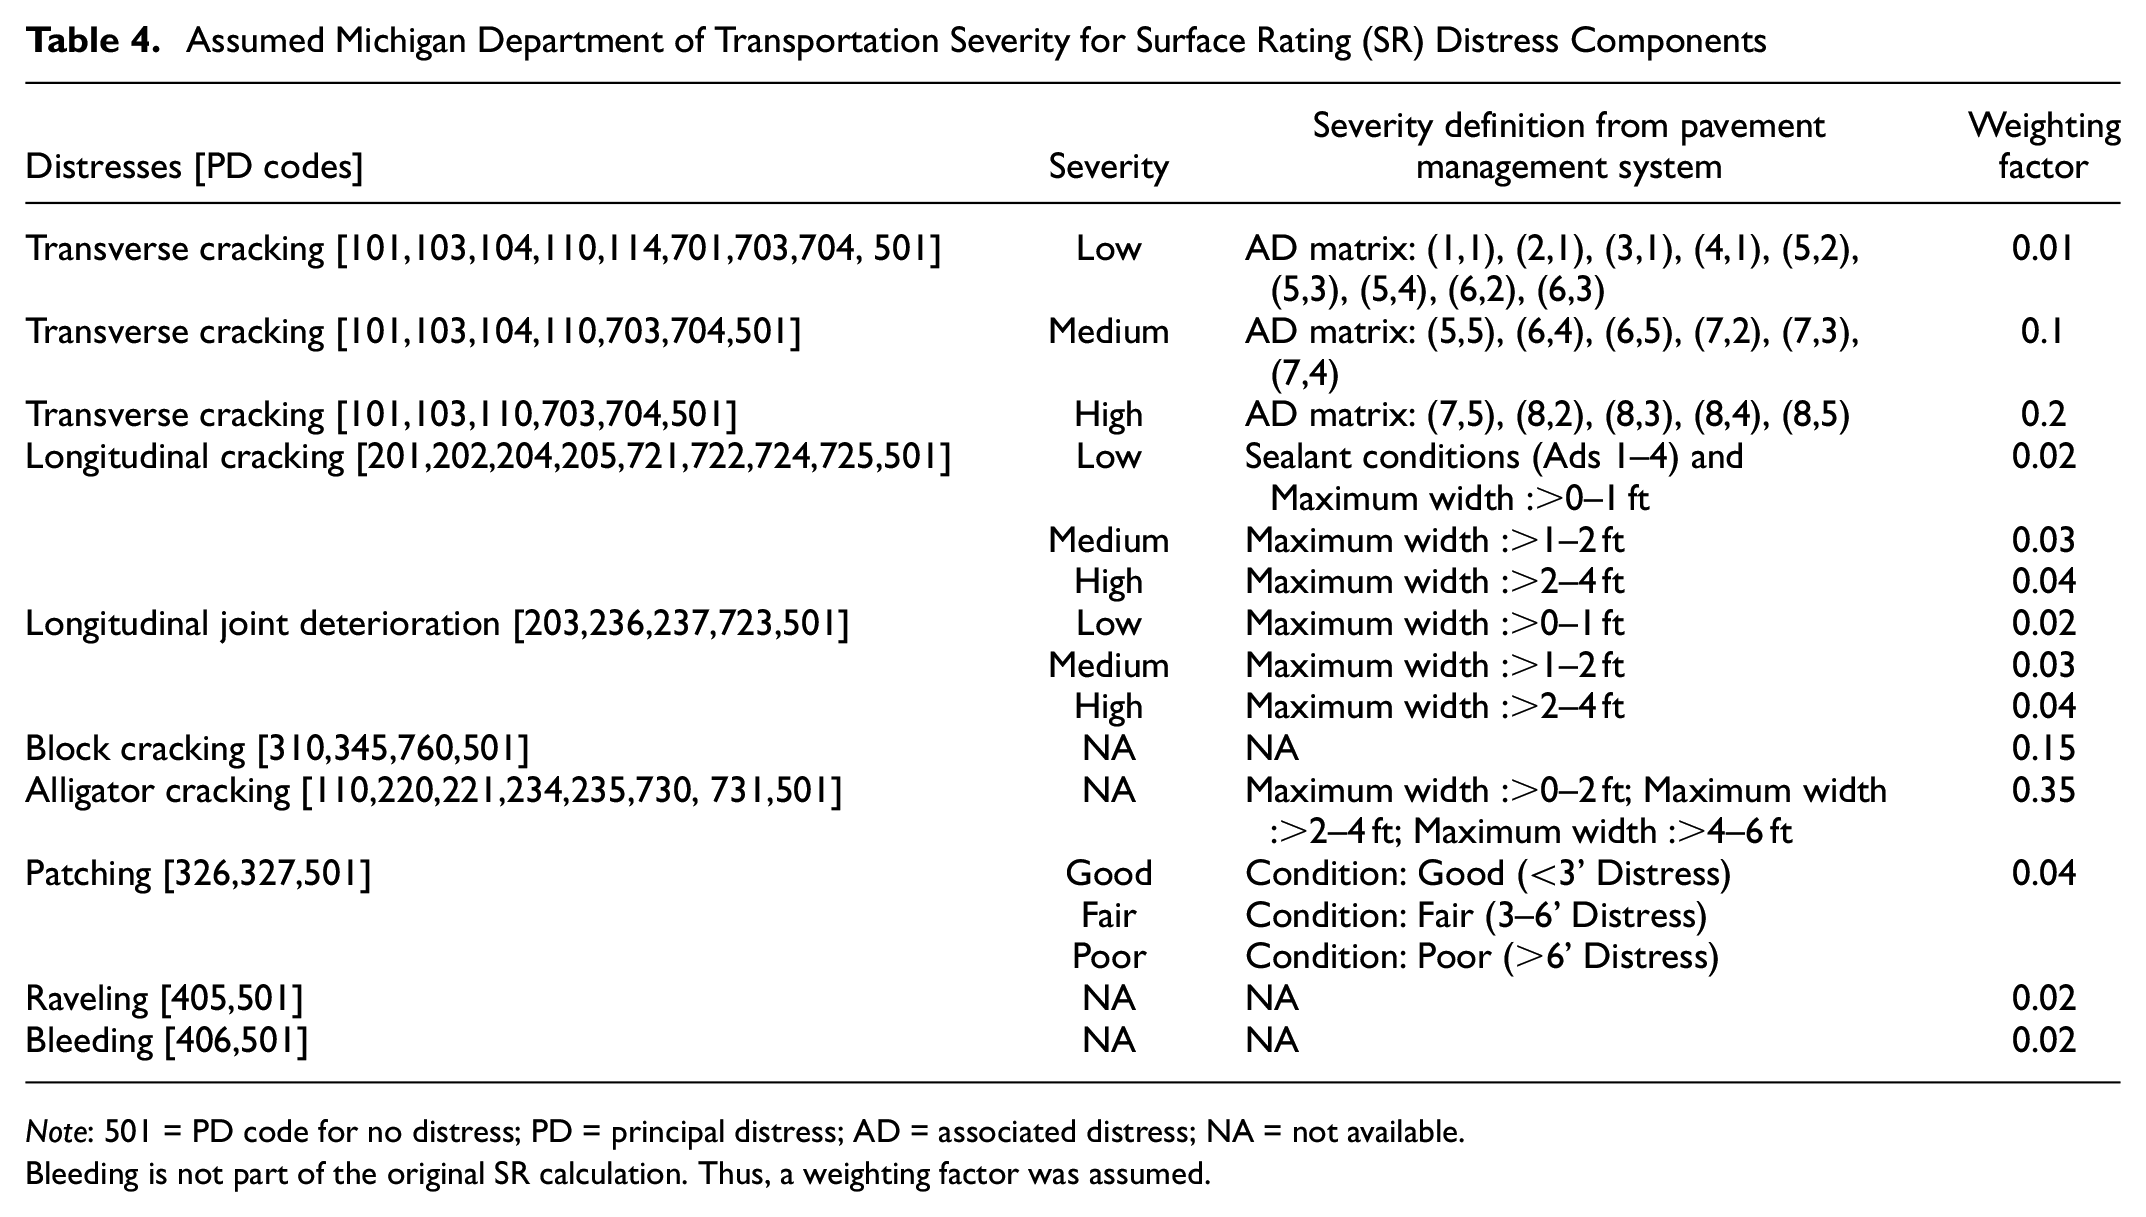
Note: 501 = PD code for no distress; PD = principal distress; AD = associated distress; NA = not available.
Bleeding is not part of the original SR calculation. Thus, a weighting factor was assumed.
North Dakota DOT’s Distress Score (DS)
The North Dakota DOT DS ranges from 0 to 99, where 99 refers to the perfect score possible and 0 means the worst condition of a pavement section. Table 1 shows distress inputs considered for DS. Specific deduct points are assigned based on the extent and severity of each distress ( 16 ).
With the exception of patching, MDOT’s survey manual classifies distress severities differently than those severity definitions outlined in North Dakota DOT’s reference document ( 16 ). As no further information is available, the same assumptions mentioned for CCI severity levels (see Table 3) were considered to calculate the DS. It is to be noted that in the MDOT PMS database, no associated distress is involved with block cracking, bleeding, and raveling. Therefore, not all three severities could be assumed; rather, only medium severity of these distresses was considered while choosing the deduct points. Once total deduct points for all distresses were calculated, it was subtracted from the perfect score of 99 to get a DS (Equation 8). Then for comparing DS with DI, a simple conversion was followed (Equation 9).


Louisiana DOTD’s Pavement Condition Index (PCI)
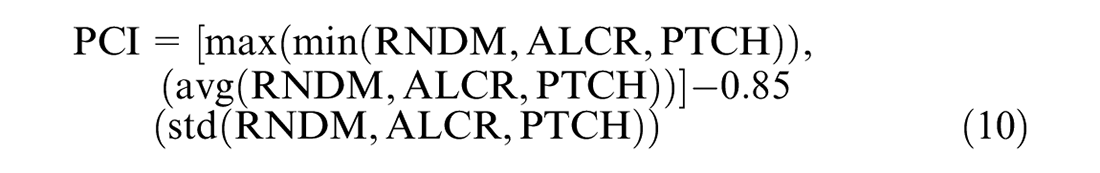
Louisiana DOTD uses PCI to assess its pavement condition. The PCI is a composite index that considers several indices into a single PCI for each pavement type. For flexible pavement, alligator cracking index (ALCR), random cracking index (RNDM) (longitudinal and transverse cracking), patching index (PTCH), rutting index (RUT), and roughness index (RUFF) are the inputs to calculate PCI ( 14 ). PCI ranges from 1 to 100, where 100 is the perfect score.
Like VDOT’s CCI, the same assumption related to the severity levels (see Table 3) of surface distresses were assumed. As mentioned above, PCI is calculated from individual distress indices, and those individual distress indices were calculated based on severity and extent. In the Louisiana DOTD reference document ( 14 ), deduct points are also provided for different ranges of distress extent with different severity levels. The sum of all deduct points at different severity levels was deducted from 100 to get the individual condition index. In the final step, PCI for flexible pavement was calculated using Equation 10:
To align with the same scale of DI, PCI was flipped by taking 100 minus the PCI.
Oregon DOT’s Overall Condition Index (OCI)
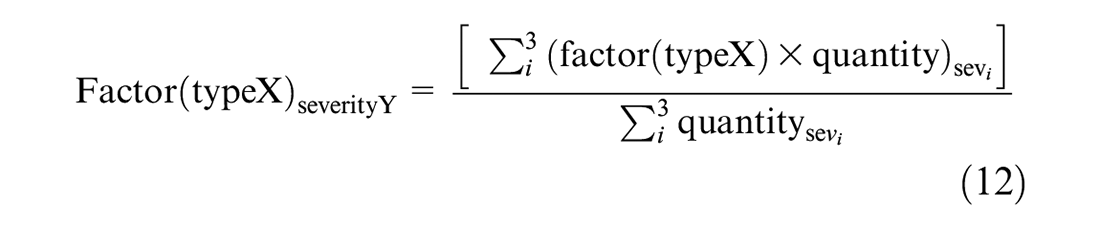
Oregon DOT uses a composite index, the OCI, to rate their pavement condition. The OCI ranges from 0 to 100, 100 being the best condition. Six condition indices are calculated for each 0.1-mi segment along the highway: a rut index, a raveling index, a patching index, a fatigue index, a no load (environmental) index, and an overall index ( 31 ). The overall index is used to categorize the condition of the pavement section as good, fair, poor, and so forth. It is to be noted that in the fatigue index calculation both longitudinal cracking in wheel path and alligator cracking were considered. Transverse cracking and longitudinal cracking in the non-wheel path were included as part of the no load (environmental) index. Like VDOT’s CCI, the same assumption related to the severity levels (see Table 3) of surface distresses were assumed and MATLAB codes were used to extract PMS data according to the required units. Then, an index factor ranging from 0 to 1 for each distress type and each severity level (i.e., low, medium, and high) was calculated using Equation 11. The next step was to calculate the weighted average of the above calculated index factor for different severity levels using Equation 12.
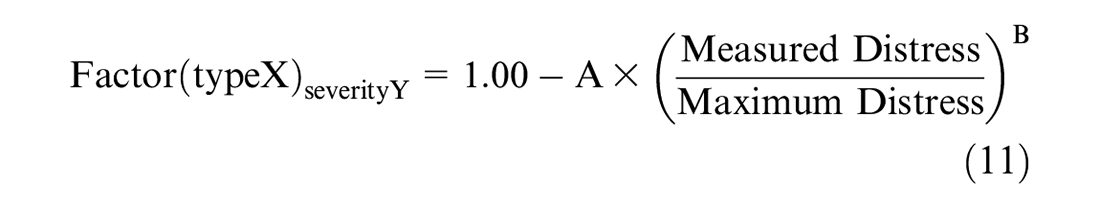
where A and B are coefficients. Along with A and B coefficients, “Maximum Distress” in a 0.1-mi segment for each distress are tabulated in Oregon DOT’s reference guide ( 31 ).
Each of these weighted average/composite factors was then multiplied by 100 to obtain individual distress indices. At the last step, the OCI is determined as the minimum value of the rut index and the non-rut index (raveling index, patching index, fatigue index, and no load [environmental] index). However, as mentioned before, rutting index was not calculated here. To make the OCI scale similar to the MDOT’s DI scale the OCI was deducted from 100.
Comparison of Different Indices
This section presents comparisons between individual condition indices and historical DI to assess the compatibility of Michigan pavement distress data. To observe how individual condition indices relate to historical DI values, time series plots for all 2,081 flexible pavement sections were plotted individually. For brevity, only a sample of example time series plots of five distress indices and DI for flexible sections are shown in Figure 2. As observed for both these sections, Minnesota’s SR and Louisiana’s PCI showed good agreement with the DI trend. Virginia’s CCI generally showed the lowest magnitude in flexible pavement time series plots. In the CCI calculation, it is to be noted that LDR and NDR are calculated based on deduct equations and those equations might be suitable only for Virginia DOT’s pavement distresses and severity definitions. Further adjustment would be needed to those deduct equations to be applied for any other state’s local conditions. Moreover, the minimum of either LDR or NDR indices was calculated as CCI. Instead of adding them together, this approach could be another cause of having low magnitude of CCI with the MDOT database. On the other hand, Oregon’s OCI provided the worst fit among other condition indices. A similar trend for OCI can be observed in the study conducted by Gharaibeh et al. ( 32 ) where the authors compared OCI with the Texas DOT’s Distress Score (DS) and Ohio DOT’s Pavement Condition Rating (PCR).
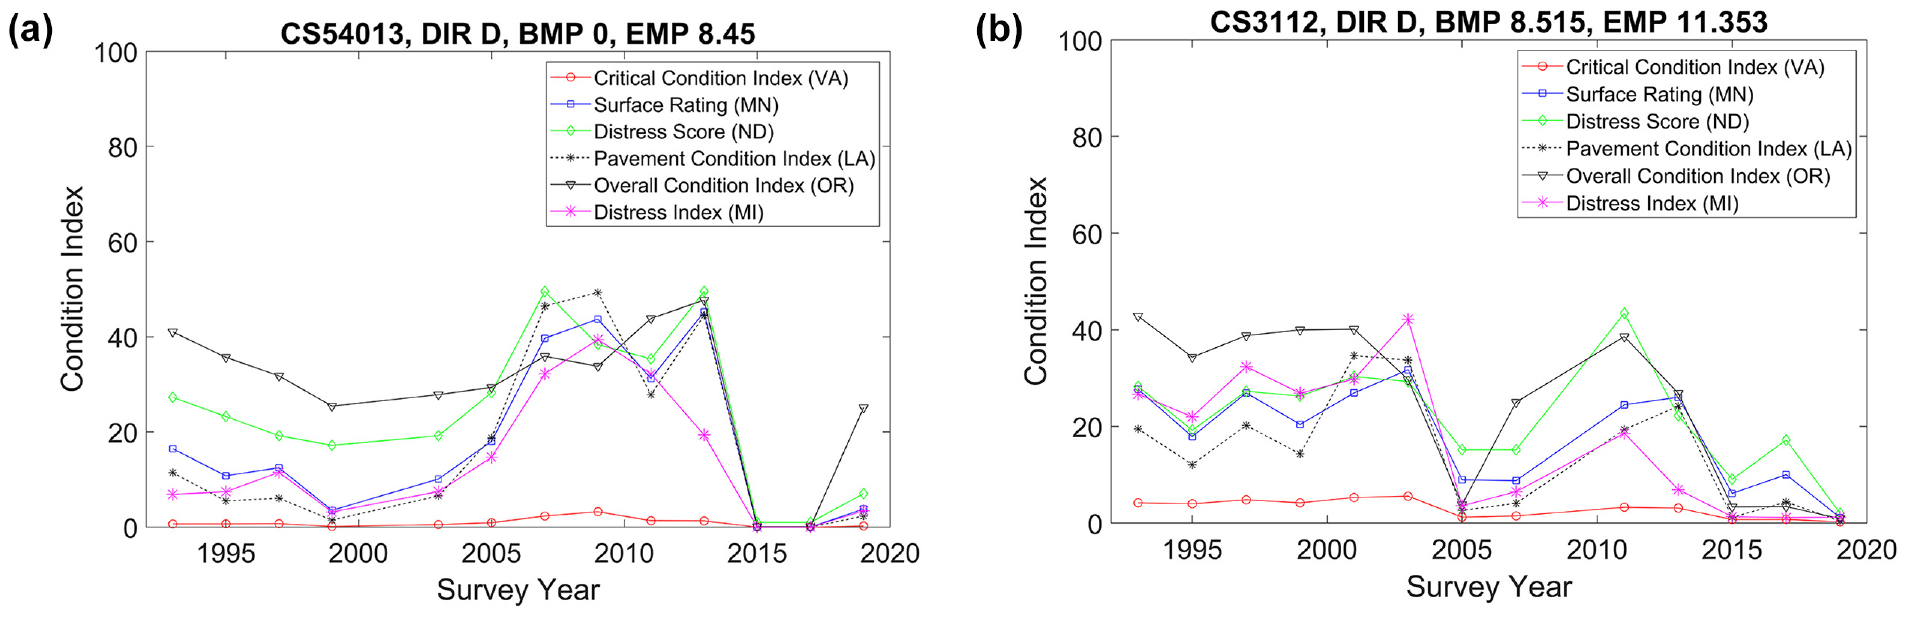
Time series plots of all condition indices including distress index for flexible sections: (a) CS54103, (b) CS3112.
To better understand the overall comparison between DI and individual condition indices, separate plots of historical DI against individual condition indices were also plotted for all selected flexible pavement sections. Figures 3 to 7 present overall comparisons between DI and individual condition indices. It can be observed that compared with the other four indices, Minnesota’s SR matches very well with DI as most of the data points are clustered around the line of equality. The next most promising one is the PCI from Louisiana; the least convincing is Oregon’s OCI. These overall comparison results also support abovementioned comments on time series plots of different condition indices. The average condition score for all studied sections is 14.5 for DI, 13.2 for SR, 3.1 for CCI, 10.7 for PCI, 19.3 for DS, and 35.2 for OCI.
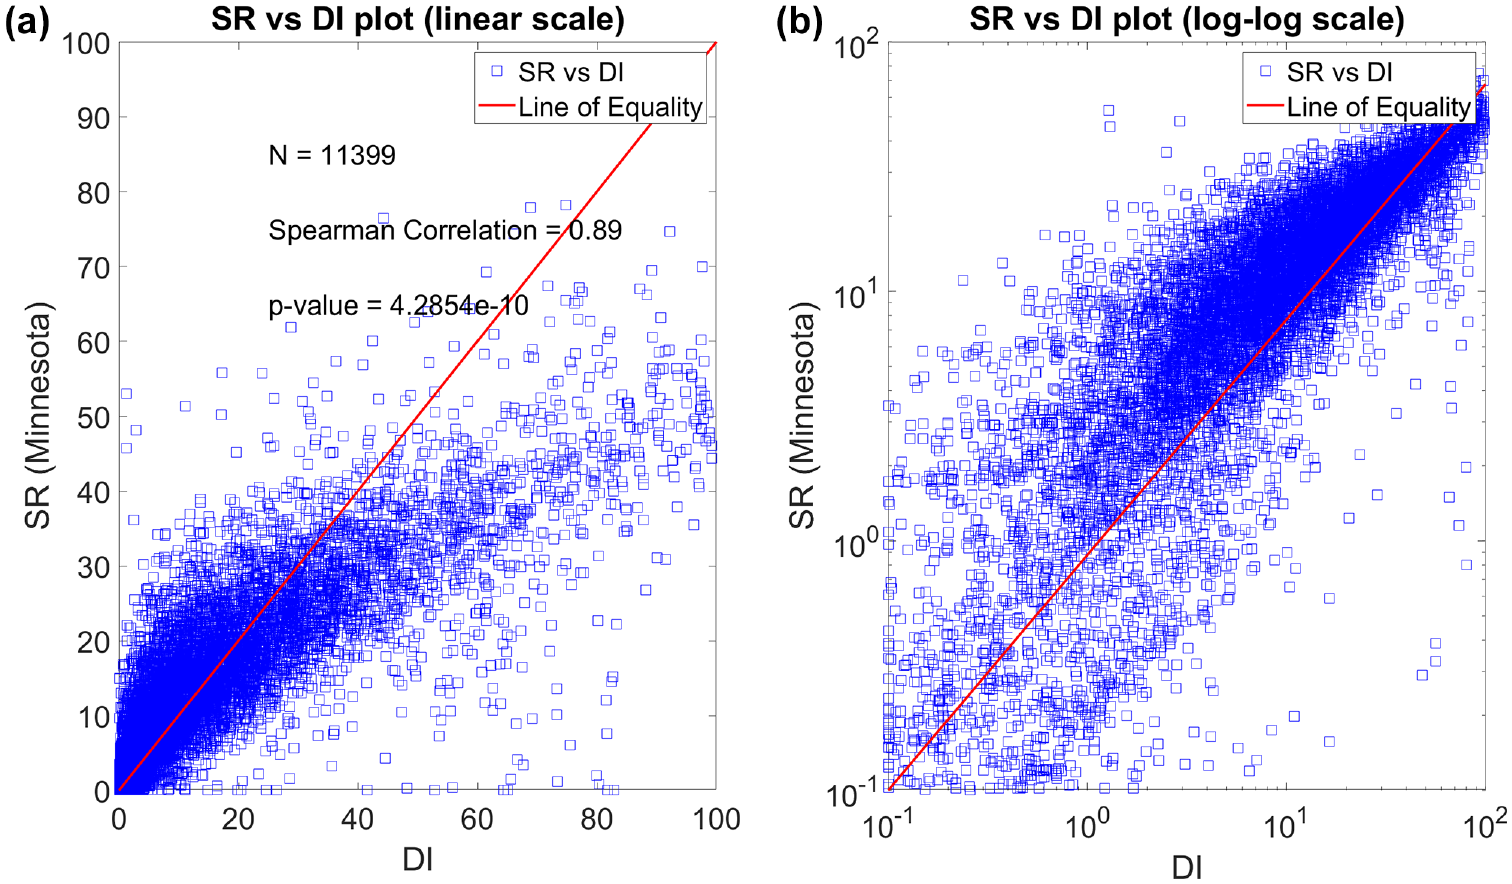
Overall comparison between Surface Rating (SR) versus Distress Index (DI) for flexible sections: (a) linear-linear scale, (b) log-log scale.
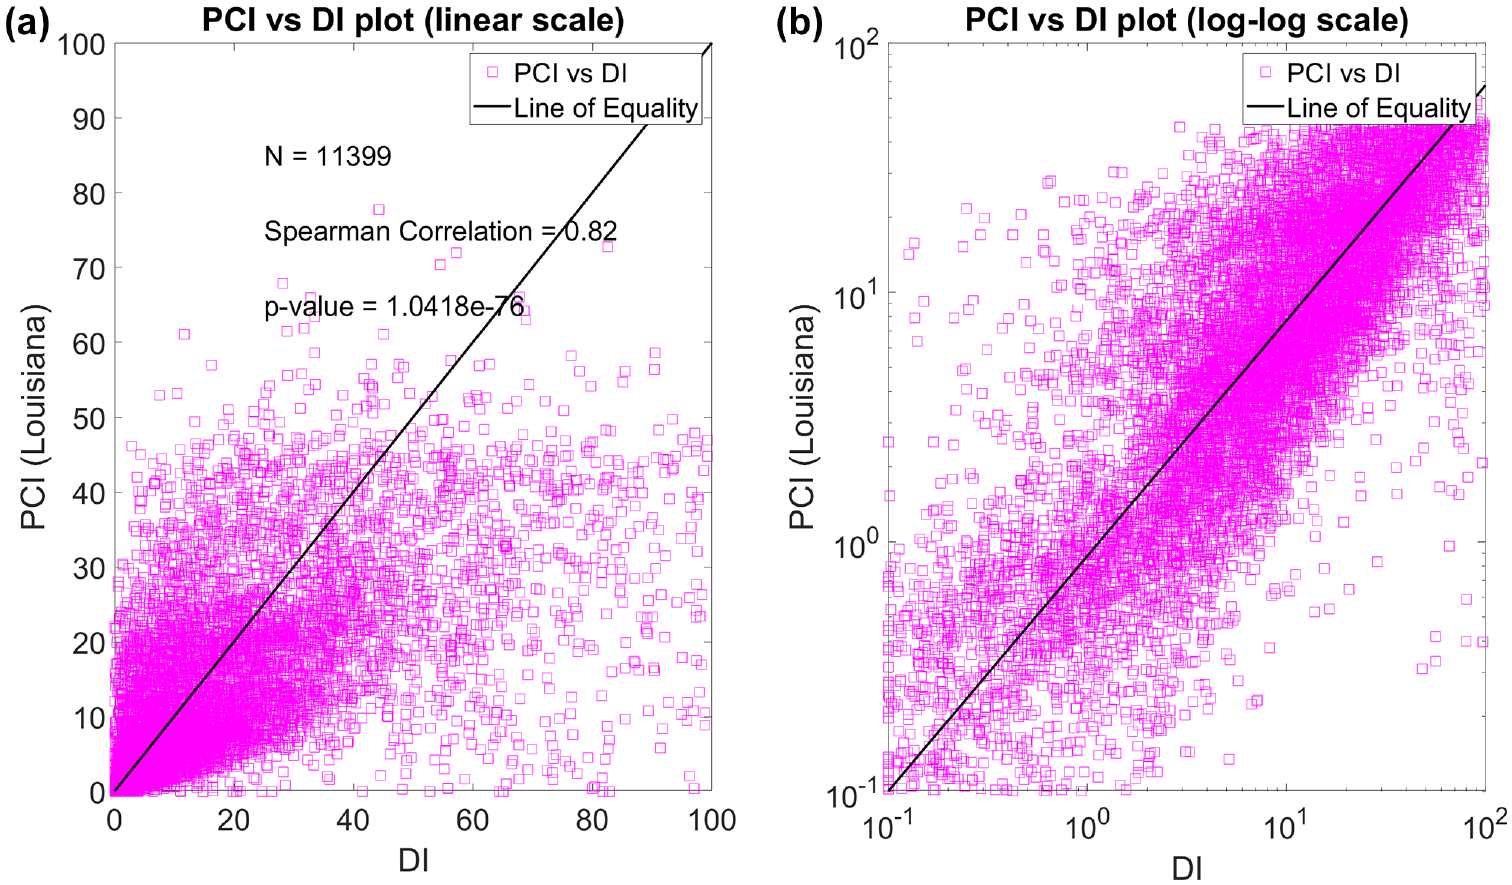
Overall comparison between Pavement Condition Index (PCI) versus Distress Index (DI) for flexible sections: (a) linear-linear scale, (b) log-log scale.
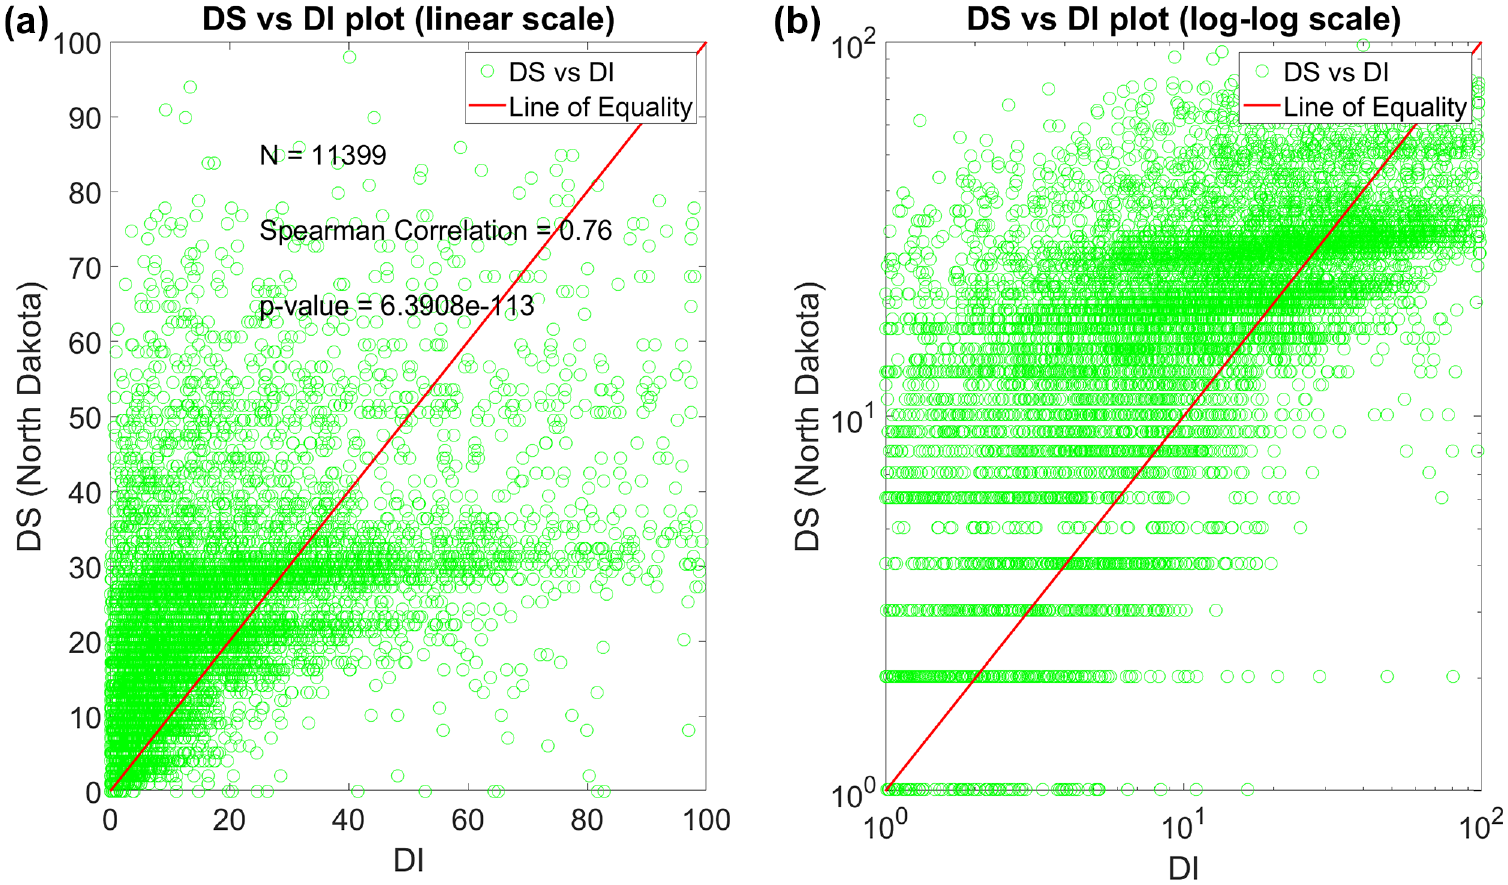
Overall comparison between Distress Index (DI) versus Distress Score (DS) for flexible sections: (a) linear-linear scale, (b) log-log scale.
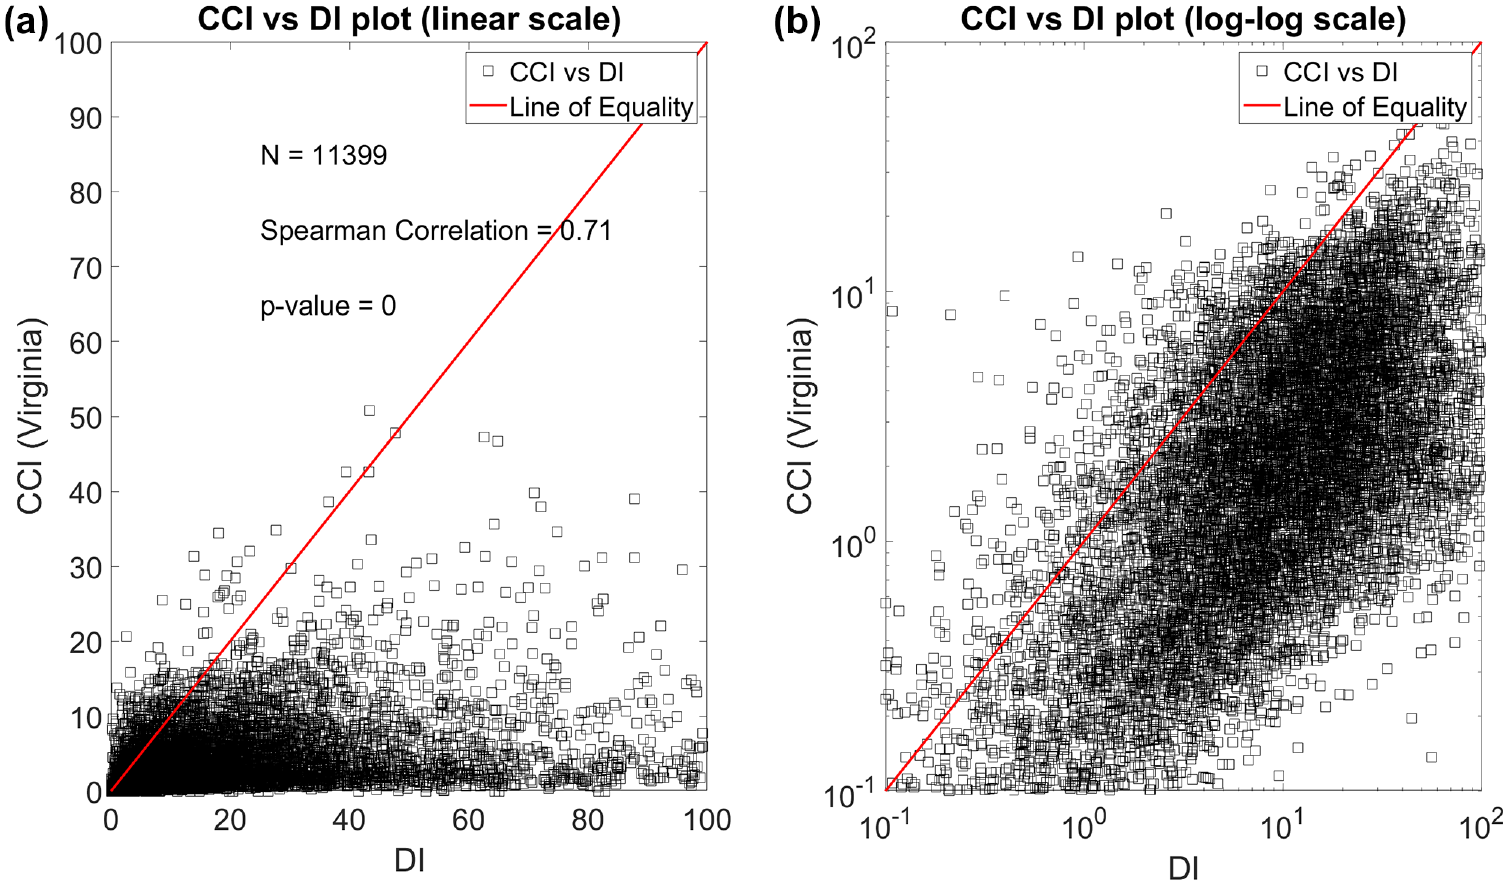
Overall comparison between Critical Condition Index (CCI) versus Distress Index (DI) for flexible sections: (a) linear-linear scale, (b) log-log scale.
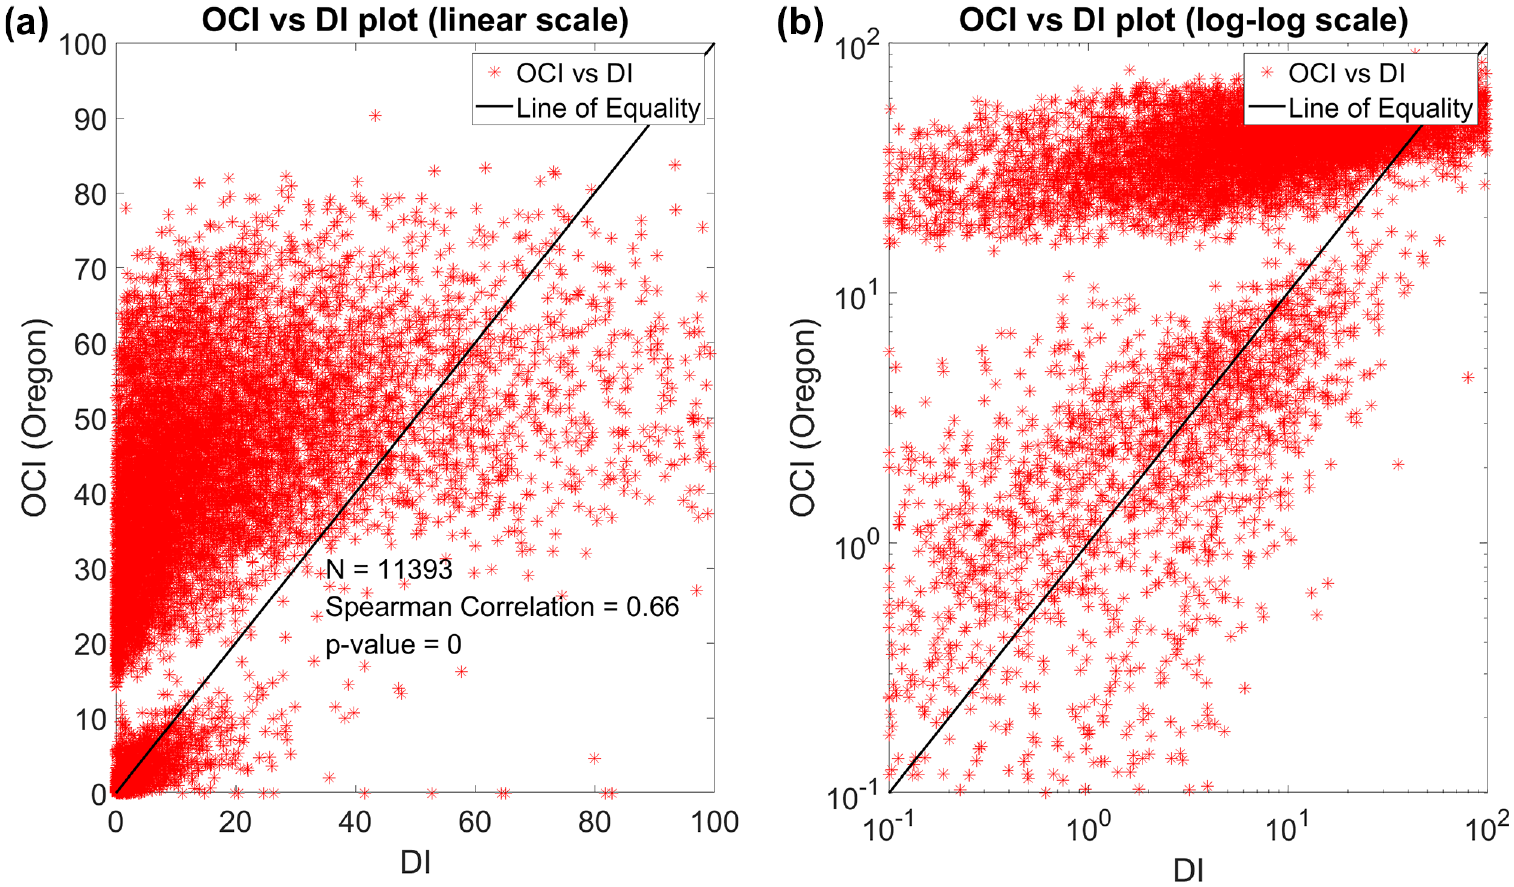
Overall comparison between Overall Condition Index (OCI) versus Distress Index (DI) for flexible sections: (a) linear-linear scale, (b) log-log scale.
To better quantify the comparisons, Spearman correlation was determined for each of the comparison sets. Results supported the above observation that among the attempted condition indices, Minnesota’s SR correlated very well with the historical DI values with a Spearman correlation value of 0.89. Spearman correlation values for the other indices are as follows: Louisiana’s PCI: 0.82; North Dakota’s DS: 0.76; Virginia’s CCI: 0.71; and Oregon’s OCI: 0.66. Also, a paired t-test was run for all of these comparison sets at
Past Maintenance Decisions Versus the Condition Indices
In the MDOT’s Project Scoping Manual, chapter 5 ( 33 ), DI-based fix guidelines are outlined. Table 5 shows the fix guidelines for flexible pavements. To evaluate how MDOT’s actual maintenance records aligned with these suggested DI numbers, box plots of historical DI values were generated for past M&R activities. The DI value of a particular maintenance record was taken such that it represented condition gathered between 1 and 2 years before maintenance. From the MDOT maintenance records, a total of eleven different fix types for flexible pavements were identified and Table 5 shows the number of records available for each of these fix types. Figure 8a shows the boxplots for MDOT’s DI values, where the left side of the figure represents light fixes, and the right side of the figure represents major fix types. The size of a box shows the range of data points in that particular category and the red asterisks outside the boxes represent the outliers. An ideal index should have narrow boxes with minimum outliers such that each box exhibits a different range of values. A general trend can be seen in Figure 8a for DI boxplots where the median value increases from left to right, except for reconstruction. It is also understandable that not only the DI value triggered these fix types to be applied. There might be other factors in the MDOT decision-making process (e.g., traffic count, site location, pavement’s functional condition, budget constraints, quality construction, etc. [34, 35]). Still, it can be observed that measured DI could reflect on the recommended fix types. In Figures 8b to 10, similar box plots are shown for the other five condition indices. Among these figures, Minnesota’s SR appears to show the most promising trend as the variability within a single boxplot was reduced yet shows a good increasing trend as DI box plot. The OCI gave a higher magnitude even for the low category of fix types. However, Virginia’s CCI represented very low magnitude and it could not perform well in differentiating different fix types.
Michigan Department of Transportation (MDOT) Fix Types for Flexible Pavement with Available Number of Records
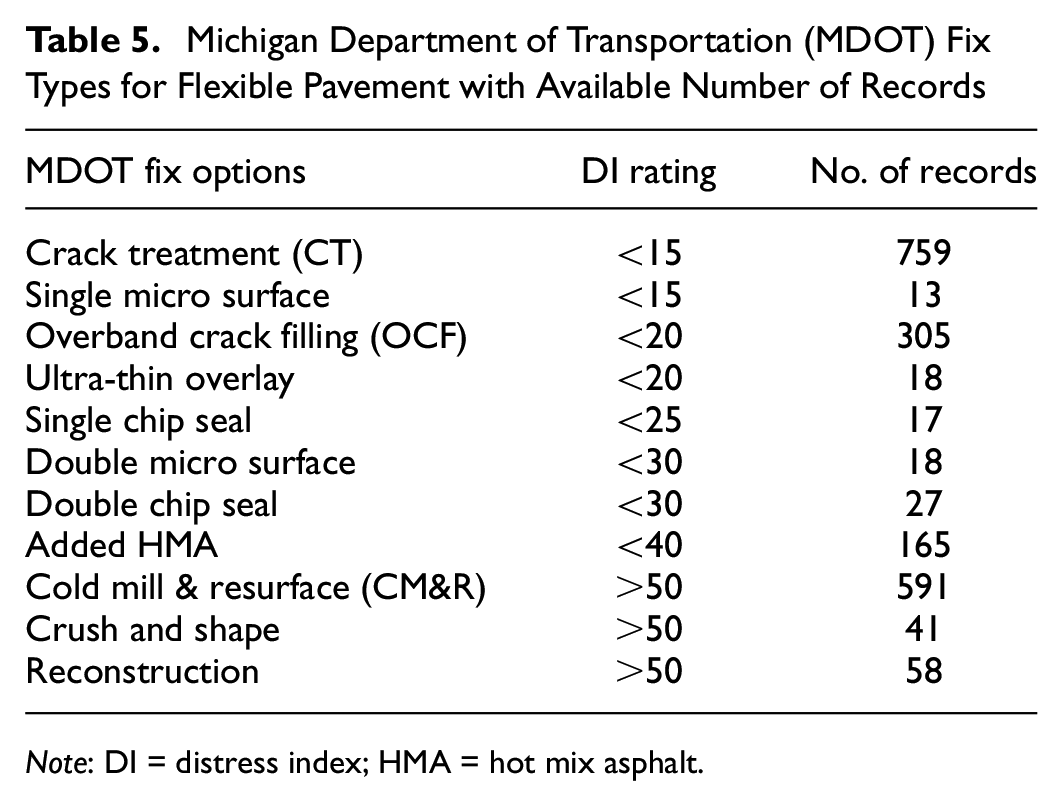
Note: DI = distress index; HMA = hot mix asphalt.
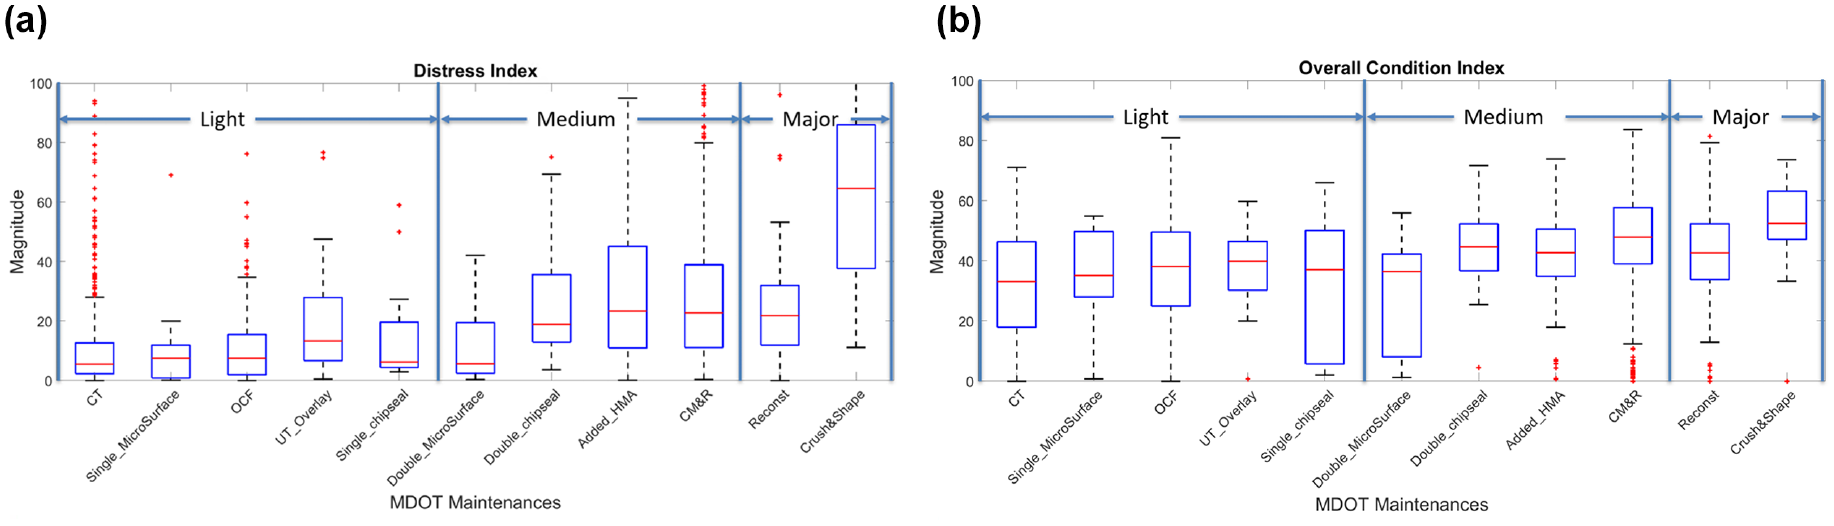
Box plots showing Michigan Department of Transportation (MDOT) maintenance records and corresponding: (a) distress index (Michigan), and (b) overall condition index (Oregon) for flexible sections.
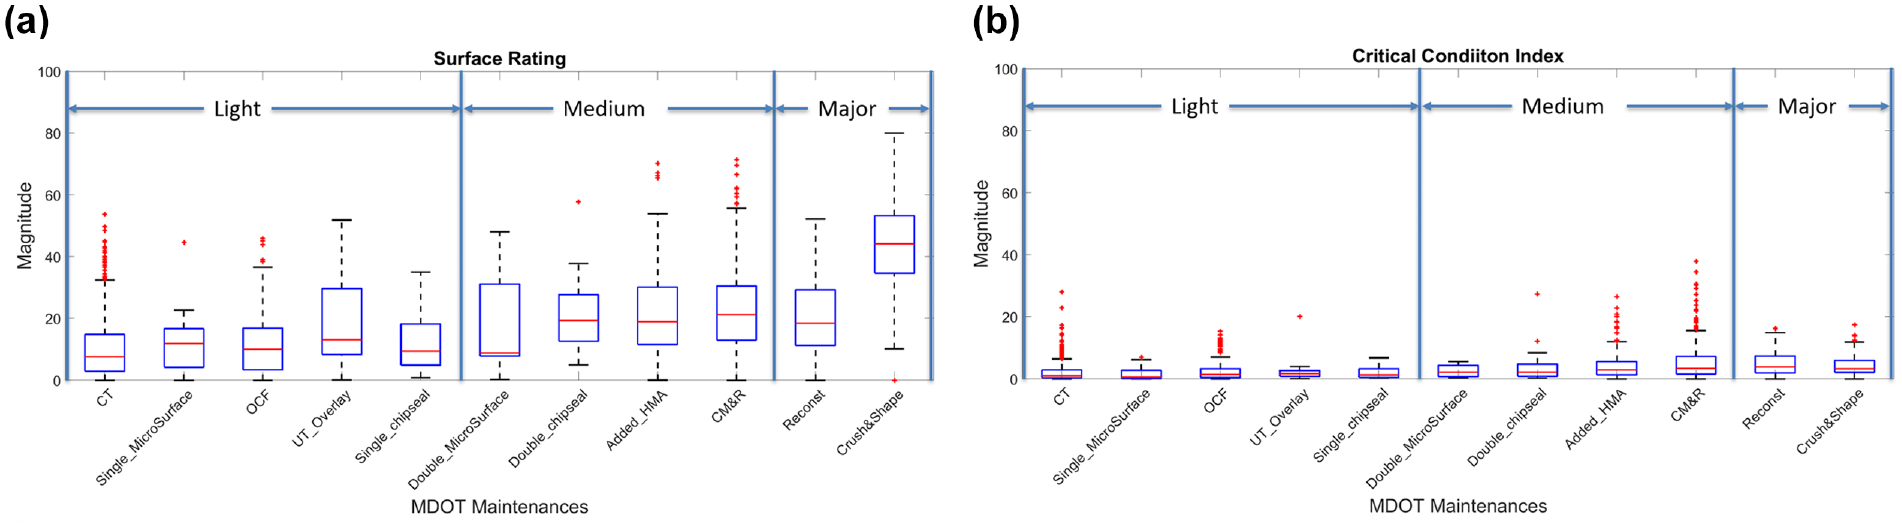
Box plots showing Michigan Department of Transportation (MDOT) maintenance records and corresponding: (a) surface rating (Minnesota), and (b) critical condition index (Virginia) for flexible sections.
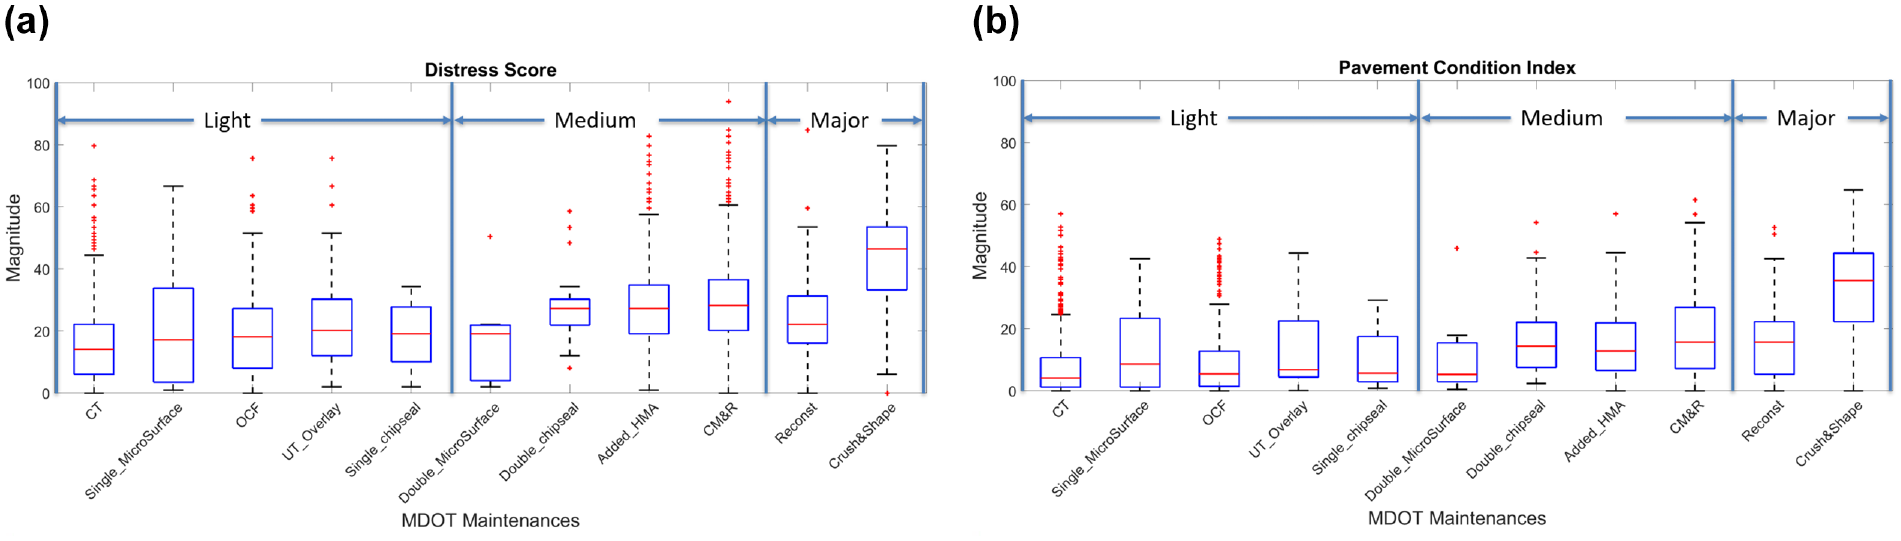
Box plots showing Michigan Department of Transportation (MDOT) maintenance records and corresponding (a) distress score (North Dakota), and (b) pavement condition index (Louisiana) for flexible sections.
This box plot analysis provided a realistic picture of past maintenance activities. Any subdivision office under a highway agency if interested to review its past decision-making process, can investigate similar box plot trends. Factors affecting different past maintenance decisions can be ranked for future reference. This analysis may be further expanded to investigate the fix life of each treatment, and percent improvement in pavement condition can be analyzed to determine the total service life of pavement sections. Moreover, adequate knowledge of past maintenance activities of any state agency’s road network would give confidence in forecasting pavement performance. Therefore, proper reporting of any sort of pavement maintenances is highly emphasized; if possible, the actual reasoning for that treatment can be reported as well.
Conclusions and Recommendations
Condition index is a simple indicator for quantifying pavement conditions subjected to different traffic loading, environmental conditions, and material characteristics. An accurate road infrastructure assessment is vital as it helps state legislations to plan maintenance prioritization and budget allocation effectively. As MDOT is revising its current condition index, in this study, an attempt to compare five condition indices with MDOT’s DI was made using MDOT’s PMS database. From the visual inspection of time series plots of individual pavement sections and overall comparison plots for each condition index against DI, it was observed that Minnesota DOT’s SR and Louisiana DOT’s PCI matched relatively well. This observation was supported by a Spearman correlation of 0.89 and 0.82 for SR versus DI and PCI versus DI, respectively. However, paired t-test results indicate significant differences between the means of all attempted condition indices and DI. These differences are attributed to a different number of distress inputs with different units, different severity levels, different deduct points, and mathematical formulas.
To have better insight into these comparisons, MDOT’s past road maintenance records were analyzed through box plots for each condition index. It was found that MDOT’s DI could differentiate well between light and moderate maintenance level from major maintenances, and historical DI values reasonably followed proposed thresholds to apply different fix types on Michigan roads. It is recognized that several other factors might be considered with maintenance decisions (e.g., annual average daily traffic, site location, pavement’s functional condition, budget constraints), but the overall comparison is valuable. Similarly, Minnesota’s SR box plot could differentiate different fix types well, and variability is reduced within a single box plot. On the contrary, Oregon’s OCI was worst in representing MDOT’s past maintenance because of high magnitudes and high variability in individual box plots.
In conclusion, Minnesota’s SR looks promising when compared with DI data, and the recommendations was made for MDOT to use a similar mathematical formula like SR to develop their future condition index. The advantage of having a condition index like SR for Michigan roads would be similar distress inputs, and ease of implementation with simpler mathematical formulas. Of course, a proper adjustment in weight factors is needed so that it can differentiate MDOT’s past maintenance activities better and statistically acceptably. It is recommended to consider rutting and IRI in MDOT’s future condition index development. Also, it is suggested to change MDOT’s rating on the scale of 100 to 0, where 100 is the perfect condition, so it will be aligned with most of the other state DOTs practices.
For general recommendation, if a transportation agency wants to revise its routine condition index, a starting point could be to compare different condition indices against their own routine condition index. However, care must be taken when identifying distress inputs with required units and correct assumptions related to severity levels. Also, the data collection method should be similar when comparing these indices between agencies. Nevertheless, if there is a comparison discrepancy, the state agency can always optimize deduct points or deduct equations. Accurately representing past maintenance records can be a good criterion for any condition index. While varying weight factors, one of the objectives can be to maximize the differences between light and major rehabilitation activities and minimize variability of datapoints within a boxplot. Finally, revising or developing a condition index should be done so that it does not bring drastic business change to a state office. Proper communication should be made to regional offices and have their thoughts on the finalized distress lists, weight factors, and rating scale.
Footnotes
Acknowledgements
The authors would like to thank the Michigan Department of Transportation (MDOT) for the financial support of this study. Valuable comments of the MDOT project manager Michael Eacker are especially greatly appreciated.
Author Contributions
The authors confirm their contribution to the paper as follows: study conception and design: M.E. Kutay, M. Hasnat, S.W. Haider, B. Cetin, J. Bryce; data collection: M.E. Kutay, S.W. Haider, M. Hasnat, R. R. Singh; analysis and interpretation of results: M. Hasnat, J. Bryce, R. R. Singh; draft manuscript preparation: M. Hasnat, M.E. Kutay. All authors reviewed the results and approved the final version of the manuscript
Declaration of Conflicting Interests
The author(s) declared no potential conflicts of interest with respect to the research, authorship, and/or publication of this article.
Funding
The author(s) disclosed receipt of the following financial support for the research, authorship, and/or publication of this article: Michigan Department of Transportation (MDOT) (Contract No. 2021-0288).