
Abstract
Implementing proper methods and techniques for construction stormwater management brings numerous benefits in protecting the environment, maintaining social justice, and enhancing sustainability within the construction industry. Flocculants improve construction stormwater management on active job sites by enhancing the function of temporary sediment control practices by facilitating the capture of fine-sized soil particles that are otherwise difficult to settle. The performance of flocculants is dependent on specific soil properties, dosage, and application techniques. Proper product selection and identification of adequate dosage rates is an arduous task for practitioners given the soil variability across job sites and a lack of implementation guidance. This study investigated the performance of various commercially available flocculant products on 15 soil samples collected from construction sites across Alabama through bench-scale testing methods. Experiments focused on providing guidance on product selection and identifying optimum dosage rates through soil assessment, match tests, and dosage experiment phases. The performance of polyacrylamide, sodium montmorillonite, chitosan, agricultural gypsum, and alum-based products was investigated across all soil samples for product selection. Dosage of selected products was evaluated by ranging manufacturers’ dosage recommendations from 0% to 200% to evaluate settling performance across a range of dosing conditions. Results indicated that increasing recommended dosage rates negatively affected the turbidity reduction performance of tested products. In general, dosages lower than 40% manufacturer recommended rates showed a statistically significant improvement in turbidity reduction at a 95% confidence level. The study provides insight for practitioners and future research agendas on the proper usage of flocculants in the construction industry.
Keywords
The dynamic nature of earth-moving activities makes sediment the most concerning of stormwater-generated pollutants originating from construction sites. Sediment-laden stormwater runoff has the potential to pollute downstream water bodies, diminishing water quality and potentially causing detrimental impacts on aquatic ecosystems. The U.S. Environmental Protection Agency (USEPA) identifies sediment as one of the most persistent pollutants that threaten the waters of the U.S. ( 1 , 2 ). Suspension of fine-sized sediment particles results in light attenuation related to increased turbidity, which could interrupt photosynthesis in wetlands and reduces oxygen available for aquatic species ( 3 ). Moreover, the settlement of suspended solids can form a layer on aquatic nesting areas and damage the reproduction of the aquatic ecosystem ( 4 ).
Construction stormwater–related pollution impacts are recognized globally. U.S. federal and state regulations require the implementation of erosion and sediment control measures on job sites to minimize erosion and resulting off-site sediment discharge. The National Pollutant Discharge Elimination System (NPDES) Program Phase II requires construction operators to receive coverage through the Construction General Permit (CGP) for construction sites disturbing 1.0 acre (0.4 ha) or greater ( 5 ). CGP permittees are held responsible for implementing adequate erosion and sediment control measures on job sites through detailed, site-specific, Stormwater Pollution Prevention Plans (SWPPPs) ( 6 ). NPDES permits are issued by 46 states in the U.S. under the full or partial authorization of USEPA and the content of CGPs varies based on the permitting agency of each state ( 7 ). Some state agencies enforce numeric limits in addition to non-numeric limit requirements for water quality standards. For instance, the Alabama Department of Environmental Management (ADEM) and North Carolina Department of Environmental Quality (NCDEQ) prohibit construction stormwater discharges that result in increases by more than 50 Nephelometric Turbidity Units (NTU) above background levels in the receiving water body ( 8 , 9 ). Testing on erosion and sediment control practices has shown effective capture of large-sized soil particles, however, traditional practices are inefficient in substantially reducing turbidity ( 10 – 15 ). Therefore, practitioners and permit holders put emphasis on reducing the turbidity of effluent before off-site discharge to ensure compliance with regulations and to avoid stop-work orders.
Effective capture of fine-sized suspended sediment before off-site discharge can be achieved through the use of flocculants coupled with temporary sediment control practices ( 16 ). The turbidity reduction effectiveness of flocculants has been investigated in several research studies with results indicating up to 97% turbidity reduction in treated stormwater runoff ( 17 – 20 ). However, performance is highly dependent on the chemical composition, soil characteristics, and dosage rates. Many flocculant manufacturers require soil match testing to properly pair a flocculant with a site’s soil. Moreover, implementing correct dosage rates substantially affects the effectiveness of flocculants for reducing turbidity and reducing sediment discharge to receiving waters.
In a recent state-of-the-practice survey, it was found that 20 State Highway Agencies (SHAs) allow the use of flocculants on construction sites ( 21 ). Only two SHAs have their own dosage guidance: Washington State and North Carolina. Product selection and identification of adequate dosage rates are challenging for practitioners to determine given the soil variability across job sites and the lack of existing industry knowledge with products. Therefore, 10 of SHAs, which allow the use of flocculants, indicated that their state agency primarily relies on manufacturer guidance for dosage selection. Relying on manufacturer guidance may potentially lead to bias and inefficiencies as a result of product preferences. There is a need to develop product and dosage selection guidance that is applicable to the suite of flocculant products construction operators may consider.
This study investigates the performance of various commercially available flocculant products on different soil samples collected from construction sites across Alabama through bench-scale testing methods. Experiments focused on providing guidance on product selection and identifying optimum dosage rates through soil assessment, match test, and dosage experiment phases. The performance of polyacrylamide, sodium montmorillonite, chitosan, agricultural gypsum, and alum-based products was investigated on 15 soil samples for soil-specific product selection. Dosage of selected products was evaluated by ranging manufacturers’ dosage recommendations from 0% to 200% to evaluate a wide spectrum of dosage conditions.
Background
The capture of suspended solids has been a significant component of water treatment procedures in many different sectors in the face of increased demand for reducing severe water pollution caused by industrial applications ( 22 ). Flocculants provide a cost-effective and convenient solution for solid-liquid separation by facilitating the rapid settling of suspended solid particles ( 23 ). These chemical agents increase the effective particle size in solid suspension by attracting and bonding fine-sized suspended particles to form flocs ( 24 ). An assortment of flocculants are commercially available and marketed for construction stormwater management applications ( 23 ). Sediment capture performance relies heavily on product selection; however, several emerging products are marketed as not being soil-specific. Inorganic flocculants including aluminum sulfate, calcium sulfate, and polyaluminum chloride (PAC) provide an economical approach for facilitating flocculation and promoting simultaneous charge reduction on the particle surface ( 25 ). While they can be highly effective, these flocculants are pH sensitive and require large dosage rates for effective flocculation ( 25 , 26 ). On the other hand, organic flocculants including synthetic (i.e., polyacrylamide [PAM]) and bio/natural (i.e., chitosan, starch, and cellulose) polymers are effective in lower dosage rates and provide decreased sludge volume ( 27 ). With proper product and dosage rate selection, flocculants promote separating solid particles from liquid media and contribute to increasing settling velocity and decreasing detention time ( 28 – 30 ).
Flocculants have been used for several decades across many water treatment applications including wastewater, mineral processing, and municipal sewage sludge purification ( 31 ). The effectiveness of flocculants in removing suspended sediment is well documented ( 24 – 26 ). Dosage in these applications is primarily applied using active treatment methods. Active treatment in construction stormwater treatment is a flocculant injection process that introduces the chemical agent to a captured stormwater volume by using mechanical pumps ( 32 ). The use of flocculants in construction stormwater gained traction when the USEPA proposed numeric effluent limitations of 13 NTU (later revised to 280 NTU) in 2009 ( 33 ). Numeric effluent limitations were later redacted in legal challenges citing lack of existing effective erosion and sediment control practices available to practitioners. Today, practitioners using flocculants for construction stormwater primarily rely on passive dosage techniques. Passive dosing methods facilitate flocculant introduction through dissolution and overflow ( 32 ). Typically, passive treatment methods in construction stormwater treatment are implemented through integrating flocculant products with temporary sediment control practices including sediment basin, ditch check, inlet protection, slope drains, and sediment retention barrier applications ( 18 , 20 , 34 , 35 ). Figure 1 illustrates commonly implemented passive treatment examples for construction stormwater treatment. Figure 1a shows a passive treatment system that uses a flocculant block in a corrugated pipe to treat stormwater runoff before a sediment control practice on an active jobsite. Passive dosing is also commonly adopted for treating channelized flow on construction sites by incorporating flocculant products with ditch checks as presented in Figure 1b. Figure 1c illustrates a semi-passive treatment method with poly aluminum chloride (PAC), which doses sediment basins based on rainfall intensity ( 36 ). Figure 1d provides an example of a passive dosing method that places a PAM block in a storm drain by using a tray system to keep the product hydrated for effective treatment.
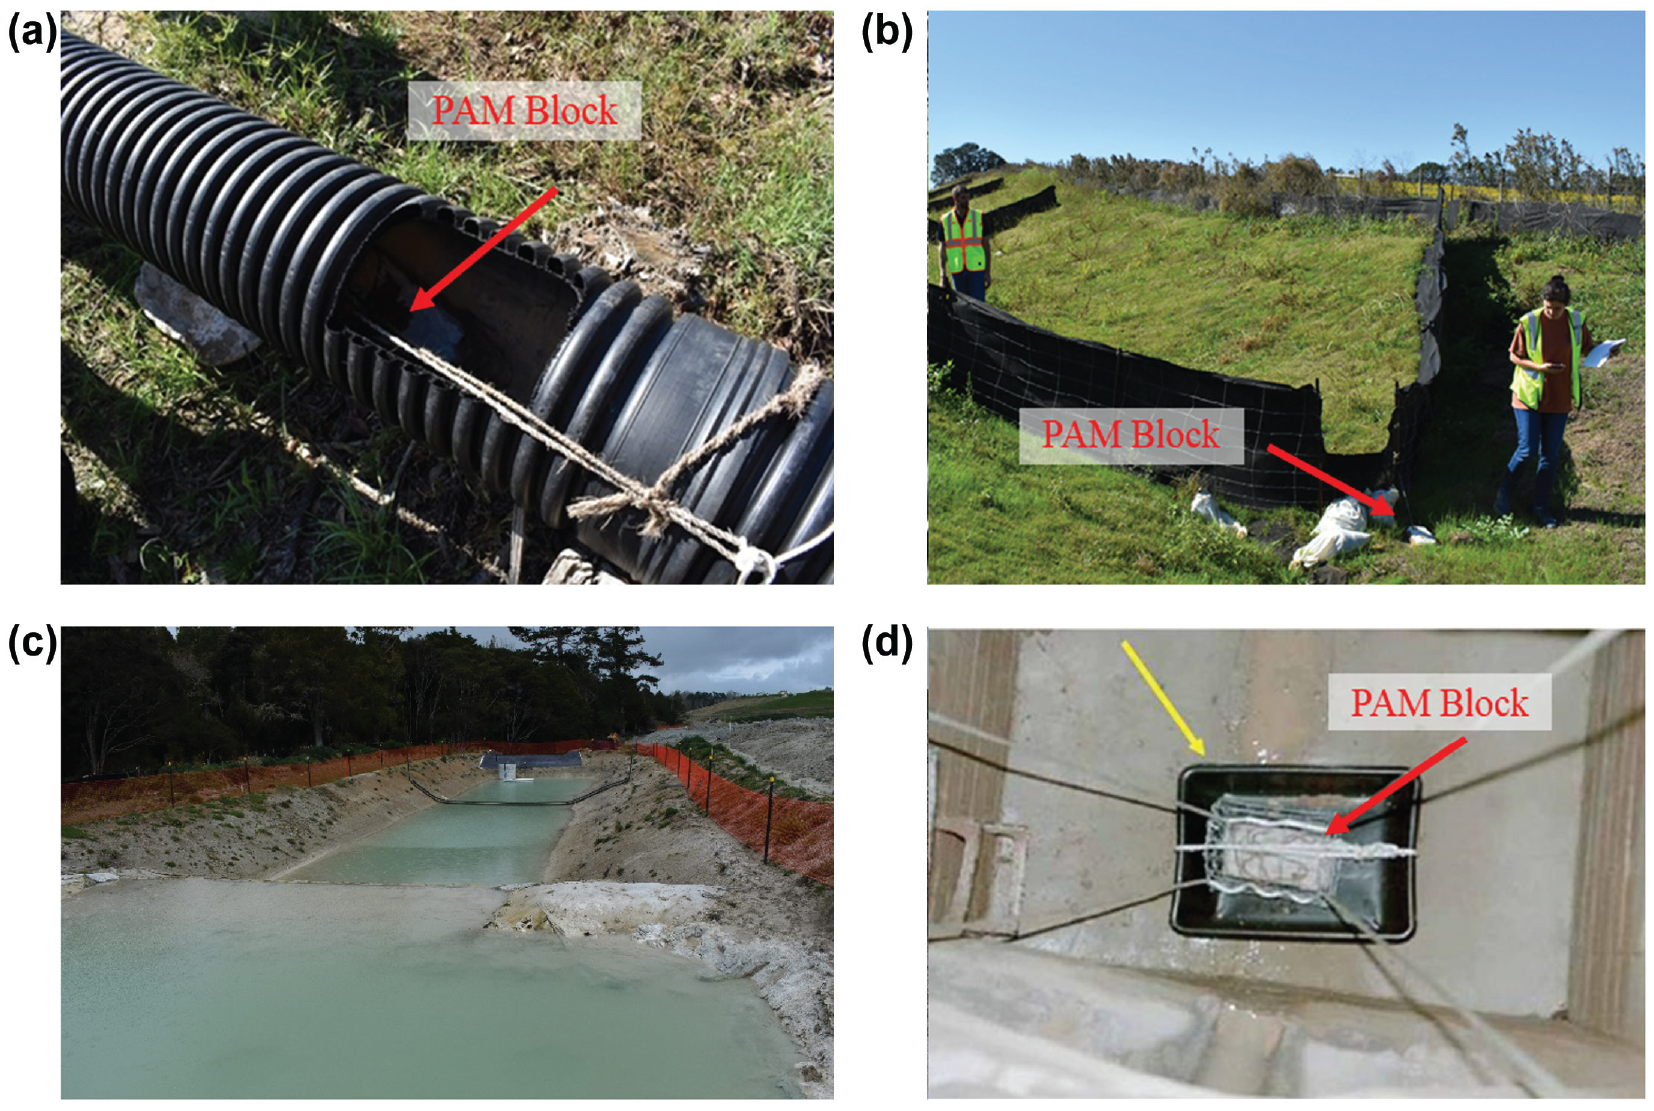
Passive treatment examples: (a) corrugated pipe; (b) ditch check; (c) sediment basin; and (d) storm drain.
An existing knowledge gap for dosage and application rates creates hesitation among practitioners in using flocculants on active construction sites. Researchers have been investigating the use of flocculants in construction stormwater treatment for filling the existing gap in knowledge through laboratory and field testing. For instance, the use of flocculants in sediment basin applications was investigated in several studies and showed substantial turbidity reduction in construction stormwater runoff (17–19, 37 , 38 ). Wood et al. ( 39 ) evaluated the feasibility of stormwater treatment by conventional and lamellar settling with and without flocculant injection and obtained up to 83% TSS removal with flocculant usage. Kang and McLaughlin ( 20 ) focused on incorporating flocculants with geotextile dewatering bags for treating construction stormwater runoff before off-site discharge and observed up to 97% turbidity reduction. Liu and Perez ( 40 ) investigated the flocculation effectiveness using electrocoagulation as an alternative to chemical dosage and achieved 98% capture effectiveness. These studies showed how flocculation may enhance turbidity reduction in construction stormwater runoff when applied with proper product selection, dosage, and application.
Most flocculant products are soil-dependent, and their performance changes based on the soil mineralogy and other physical and chemical characteristics of the soil ( 41 ). However, soil mineralogy and soil characteristics vary greatly across a region. For instance, there are a total of 460 different soil series in Alabama within seven primary soil areas: Limestone Valleys and Uplands, Appalachian Plateau, Piedmont Plateau, Coastal Plain, Blackland Prairie, Major Flood Plains and Terraces, and Coastal Marshes and Beaches (42). Soil variability occurs across the state and exists within active construction sites. Many different named soil series can be observed within site boundaries throughout each construction phase. Moreover, excavation and embankment activities may also increase soil variability on sites and replace the naturally existing topsoil ( 43 ).
Optimum dosage requirements of flocculants vary for each product and can be identified through bench-scale evaluation of products in a controlled laboratory environment. Increased product variability and changing soil characteristics throughout job sites create challenges in identifying adequate dosage concentrations. Typically, practitioners prefer to rely on manufacturer guidance to identify dosage rates and managing product selection procedures ( 21 ). However, the need for developing guidance for dosage has emerged with increasing environmental concerns and awareness of the negative impacts of overdoses such as pollution in downstream waterbodies and possible fish kills. Manning et al. ( 44 ) evaluated methods for identifying PAM concentrations in construction stormwater runoff through large-scale testing on an ASTM D6459 rainfall simulator for monitoring residual concentrations. Kazaz et al. ( 16 ) developed a field-applicable method for detecting residual concentrations of flocculants for construction stormwater applications by observing the settling velocity behavior of various products on a testing soil. Results of the study aimed to minimize overdoses on active job sites by providing guidance on residual monitoring through a field-applicable method ( 16 ). Mirsky presented a jar testing study on four different chemical coagulants and ranged their dosages from 0 mg/L to 100 mg/L for performance evaluation ( 45 ). A research study funded by the Minnesota Department of Transportation (DOT) also conducted a bench-scale dosage study on various flocculant products and evaluated dosage rates in two phases. The first phase of the study focused on manufacturer dosage guidance and the second phase evaluated different dosage ranges ( 46 ).
Existing research primarily focused on evaluating the turbidity reduction impact of flocculants through laboratory and field testing. Dosage requirements were investigated by only a few studies. The development of dosage and product selection frameworks for flocculant usage in construction stormwater treatment is, therefore, a significant task in enhancing the effectiveness of flocculants in suspended sediment removal and avoiding overdoses. This research aims to provide a comprehensive guidance on flocculant usage for construction stormwater treatment by evaluating optimum dosage rates and developing product selection procedures.
Methodology
This study evaluated product selection and optimum dosage of flocculants through bench-scale testing procedures, which characterized the behavior of various flocculant products across different Alabama soils and provided a basis for the development of future large-scale testing procedures. In total, 14 different flocculant products were evaluated for performance, optimum dosage, and residual concentration detection. The bench-scale experiments consisted of three main testing methodologies: soil assessment, match test, and dosage experiments.
Soil Assessment
The soil-dependent nature of most flocculants requires soil assessment before the selection of flocculant products for construction stormwater treatment. Physical soil characteristics and mineralogy play a substantial role in product selection. As a starting point for the soil assessment phase in this research, a desktop study was conducted to identify soil sampling locations on five active construction sites, spread across each of Alabama DOT’s regions. Soil sampling sites were located in Shelby (East Central region), Etowah (North region), Montgomery (Southeast region), Mobile (Southwest region), and Bibb (West Central region) counties. Within this desktop study, the U.S. Dept. of Agriculture Web Soil Survey (WSS) and Geographic Information Systems (GIS) tools were used to identify target soil samples that needed to be collected during soil sampling site visits. Target soils were identified in WSS based on dominant benchmark soil series observed within the site boundaries.
The information on the soil series existing in sampling locations was listed based on map unit name, acres in the area of intent, parent material name, surface texture, pH, soil chemistry information, soil erodibility factor, the Unified Soil Classification System (USCS), and American Association of State Highway and Transportation Officials (AASHTO) soil classification. The results of the desktop study were used to identify correlations with the field soil assessments later in this study. In total, 15 soil samples, which were sampled from different locations were included in the soil assessment. Twelve of these soils came from five construction sites, one for each Alabama DOT region, for the desktop study. Sampling locations were identified on-site based on the pre-determined sampling location coordinates through the WSS study. In addition to the soil assessment of targeted soil samples, three additional soil samples from collected known sources were included in the study to extend evaluated soils within the texture triangle. The first additional soil sample was sampled from the Cecil map unit and classified. The second sample was collected from a construction site in the Montgomery, AL area, which is located within the boundaries of Blackland Prairie. Finally, a soil sample from the Gwinnett soil sample was collected from an area located south of Auburn, AL, which consisted of mixed crystalline materials of Piedmont.
Soil assessment studies continued with standard soil characterization tests following ASTM procedures, which included wet sieve, dry sieve ( 47 ), hydrometer ( 48 ), and Atterberg limits ( 49 ) tests to characterize collected soil samples. Each soil analysis step was repeated three times for ensuring the accuracy of the results obtained in laboratory soil testing procedures. Results were evaluated to identify particle size distribution and classifying collected soil samples based on the USCS, AASHTO, and U.S. Department of Agriculture (USDA) soil classification systems. In addition to soil classification, the cationic exchange capacity (CEC) of soils was another factor considered for correlating the performance of flocculants on different soils. CEC is a measure of cations that can be held on soil particle surfaces in milliequivalent per hundred grams (meq/100 g). Soil samples were tested for CEC at the Auburn University Soil Testing Center and the results were evaluated for correlating the performance of the flocculants on soils with CEC. Typically, high organic matter and clay content in soils result in higher CEC values. Thus, the CEC of the soil shows variability within the soil profile shown in Figure 2. For instance, the A horizon has the highest CEC within the soil profile shows low CEC given low organic matter and clay content. B horizon with high clay content can also have high CEC values. Soil samples in this research were collected from 12 in. (30.5 cm) below the surface in the B horizon, which represents the subsoil layer that accumulates clay transported from O and A horizons.
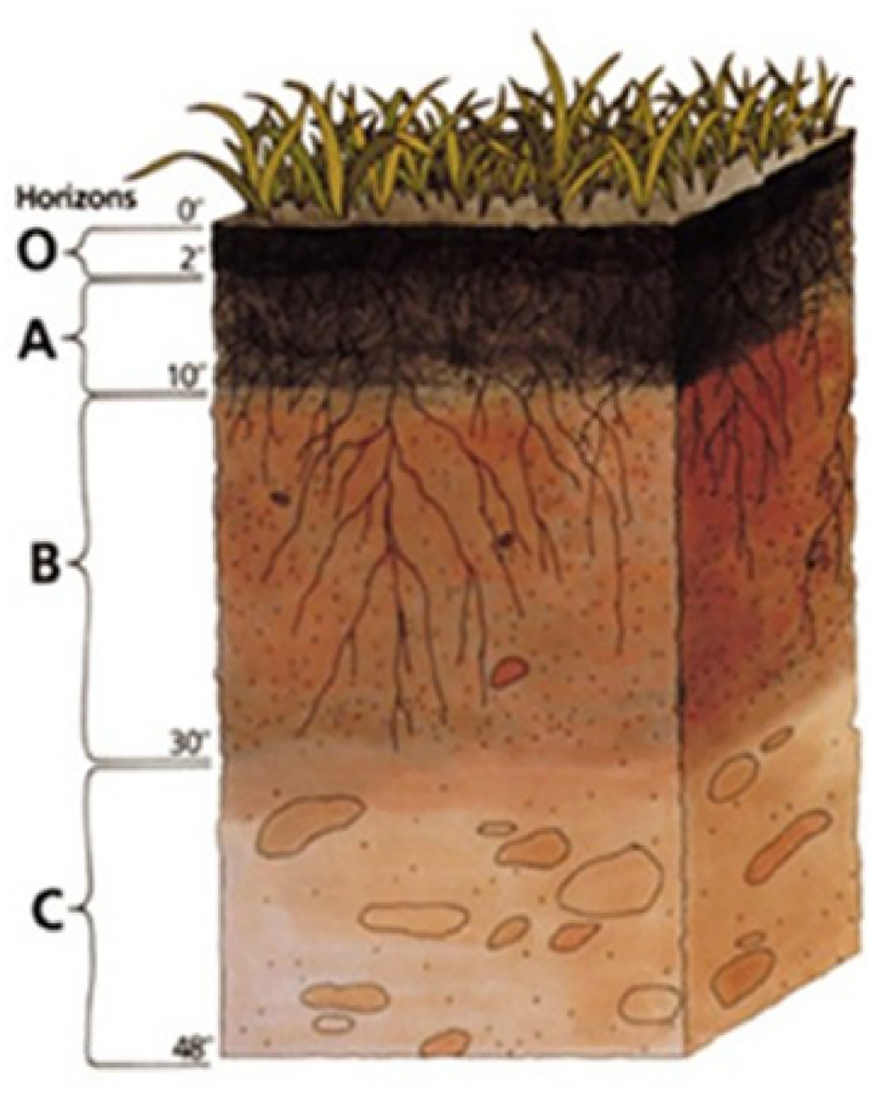
Soil profile ( 50 ).
Match Test
Match test experiments focused on performance evaluation of each flocculant product on testing soils and selecting the most effective products for each soil sample. The match test methodology followed ASTM standard jar testing procedures and tested the performance of 14 different flocculant products on 15 testing soil samples ( 51 ).
In this research, the same testing products listed in Kazaz et al.’s detection of residual concentration study were used to form a product selection and dosage evaluation framework ( 16 ). Kazaz et al. ( 16 ) observed the settling velocity of 14 different flocculant products with known concentrations by introducing these products to a testing soil. They correlated settling velocity observations with known flocculant concentrations to provide standardized residual concentration plots. These products also provided insight into this study for the evaluation of product selection and dosage requirements. Product selection initially included polyacrylamide, bentonite, and sodium montmorillonite-based flocculant products. However, additional flocculant types such as alum, agricultural gypsum, chitosan, and a coagulant agent were included in this research for providing comprehensive guidance on the use of flocculants. Table 1 displays information on the selected products for the bench-scale evaluation phase of this research. Stock solutions were prepared for most of the granular products by using manufacturer dosage recommendations. Dosage recommendations were obtained from manufacturers via e-mail for treating 33.8 oz (1,000 mL) turbid samples reaching approximately 1,500 NTU. However, some products (A, N, F, G, and H in Table 1) did not form a homogenous stock solution with the recommended concentration value. These products were, therefore, used in granular form for the bench-scale experiments.
Summary of Evaluated Flocculant Products ( 16 )
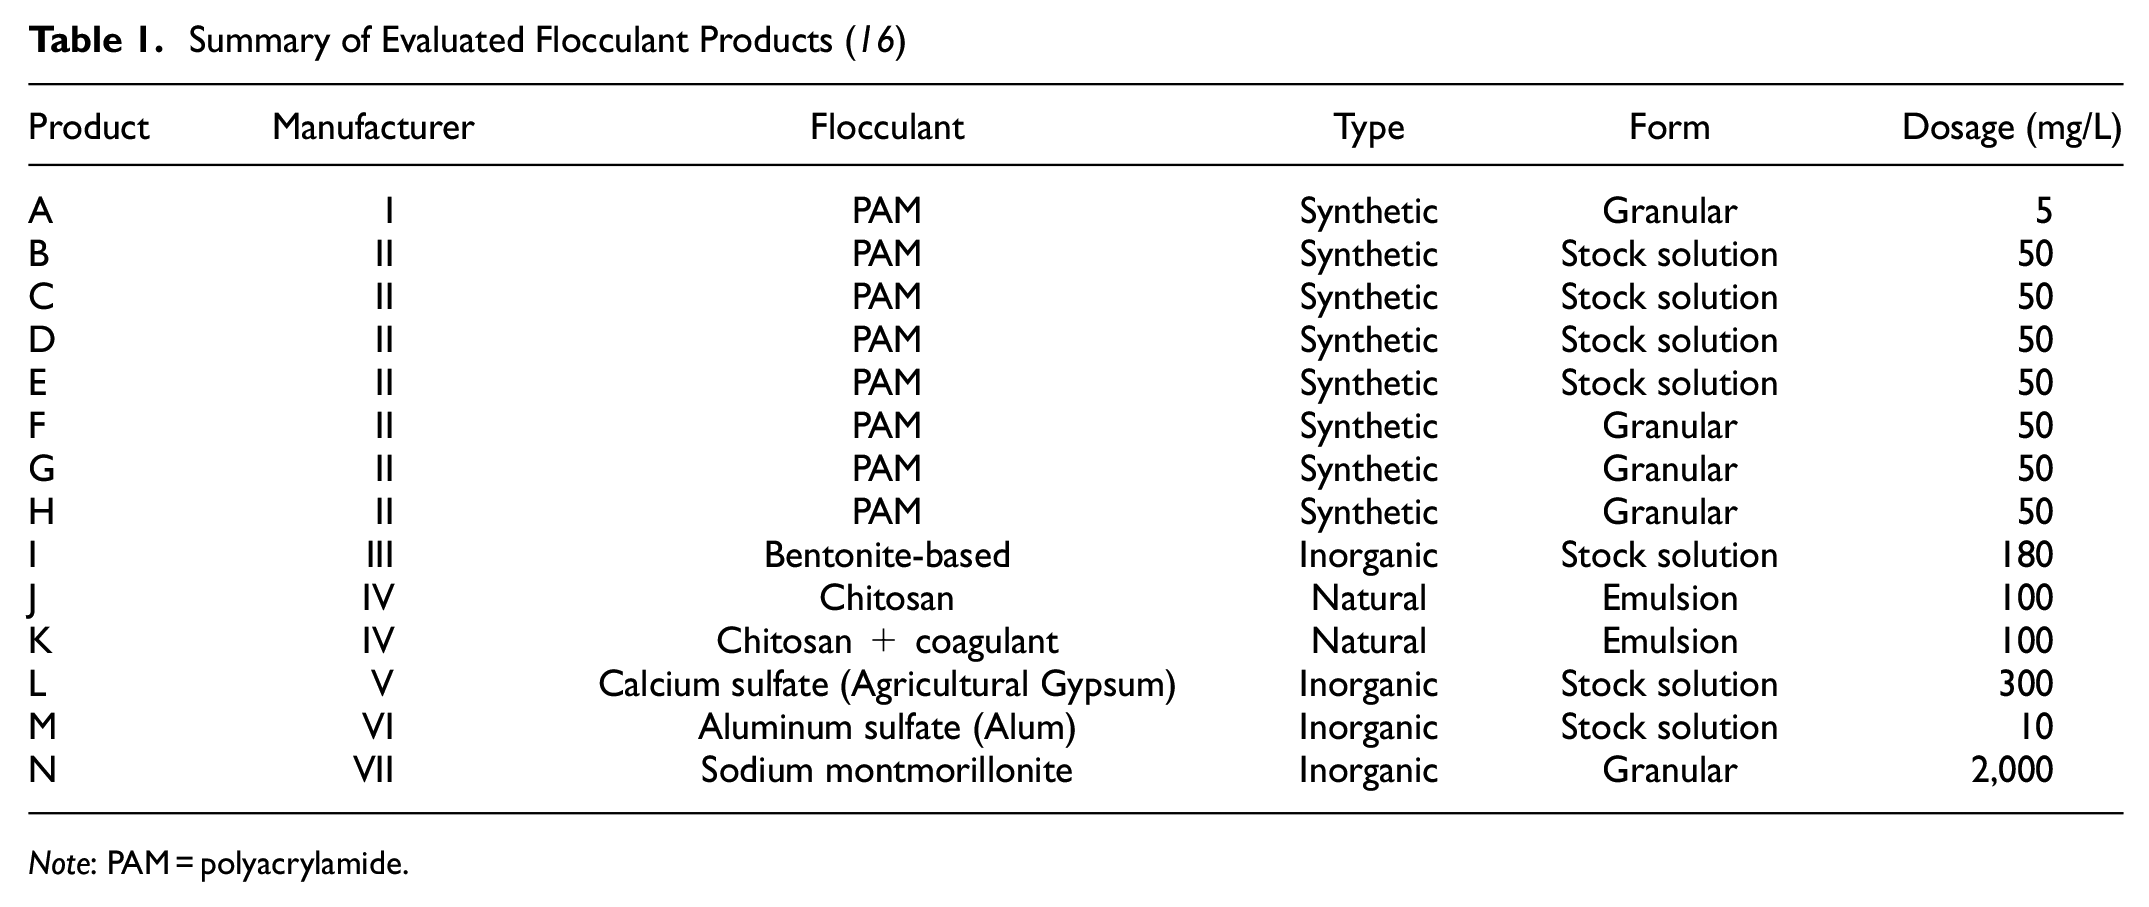
Note: PAM = polyacrylamide.
Manufacturer dosage recommendation values ranged from 5 to 2,000 mg/L as listed in Table 1, which showed the difference in dosage recommendations of each product. PAM products had lower recommended dosage rates compared with other flocculant types. Many of the PAM dosage recommendations would be considered as maximum dosage rates that can be used without harming the aquatic life. The dosage rate for aluminum sulfate (product M) was obtained from literature as 10 mg/L based on a study that investigated alum treatment in stormwater ( 52 ). Sodium Montmorillonite (product N) had the highest recommended dosage concentration among all evaluated products. It was noted that manufacturers provided higher dosage rates for inorganic and bio/natural flocculants compared with synthetic flocculant products.
Match test experiments were performed by using A&F Machine Products Co. 88-2152 Jar Mixer© with six stirring stations. Sample turbid water was prepared by mixing an amount of the fine soil passing through No. 200 sieve with 33.8 oz (1,000 mL) tap water to reach 1,500 +/− 300 NTU per jar. Soil samples were sieved through a No. 200 sieve to obtain fine-sized soil particles since flocculants are effective on the fine portion of the soil. Tap water was used in turbid samples to mimick field conditions where construction stormwater runoff might have contained organic matter. An injection rack was designed and built by following the ASTM D2035-19 jar testing standard procedures for instantaneous injection of flocculant products into the beakers during the use of the mixing machine ( 51 ).
Each flocculant product was introduced into the sample turbid water with the use of an injection rack and testing samples were flash mixed for a minute at 120 rpm by using the mixing machine. The flash mix step activated each introduced chemical agent through rapid hydration. Following the flash mix step, slow mixing procedures were applied by reducing the mixing speed of the machine to approximately 60 rpm for 20 min. This step enabled floc formation by creating a bridging mechanism between suspended soil particles. Finally, the machine was stopped, the mixing paddles were taken out of the beakers, and settling was observed for 15 min.
Match test experiments evaluated each product on each testing soil to identify the best-performing chemical agents. In total, 168 samples were evaluated, and observations included color, floc formation, floc size, and settling velocity. The performance of products was compared with each other and to the control condition, which did not contain any flocculant. A point system was developed for analyzing the match test results by assigning points to each observation category. Products were ranked based on the point system shown in Figure 3 and the top three best-performing products for each soil were selected based on the highest scores. The final score for each product was calculated based on the scores obtained in each category defined in the point system. The highest score was assigned to products if a clear appearance, rapid floc formation, large floc size, and high settling rate were observed after match test experiments. The selected products were further investigated for optimum dosage guidance in the dosage experiments.
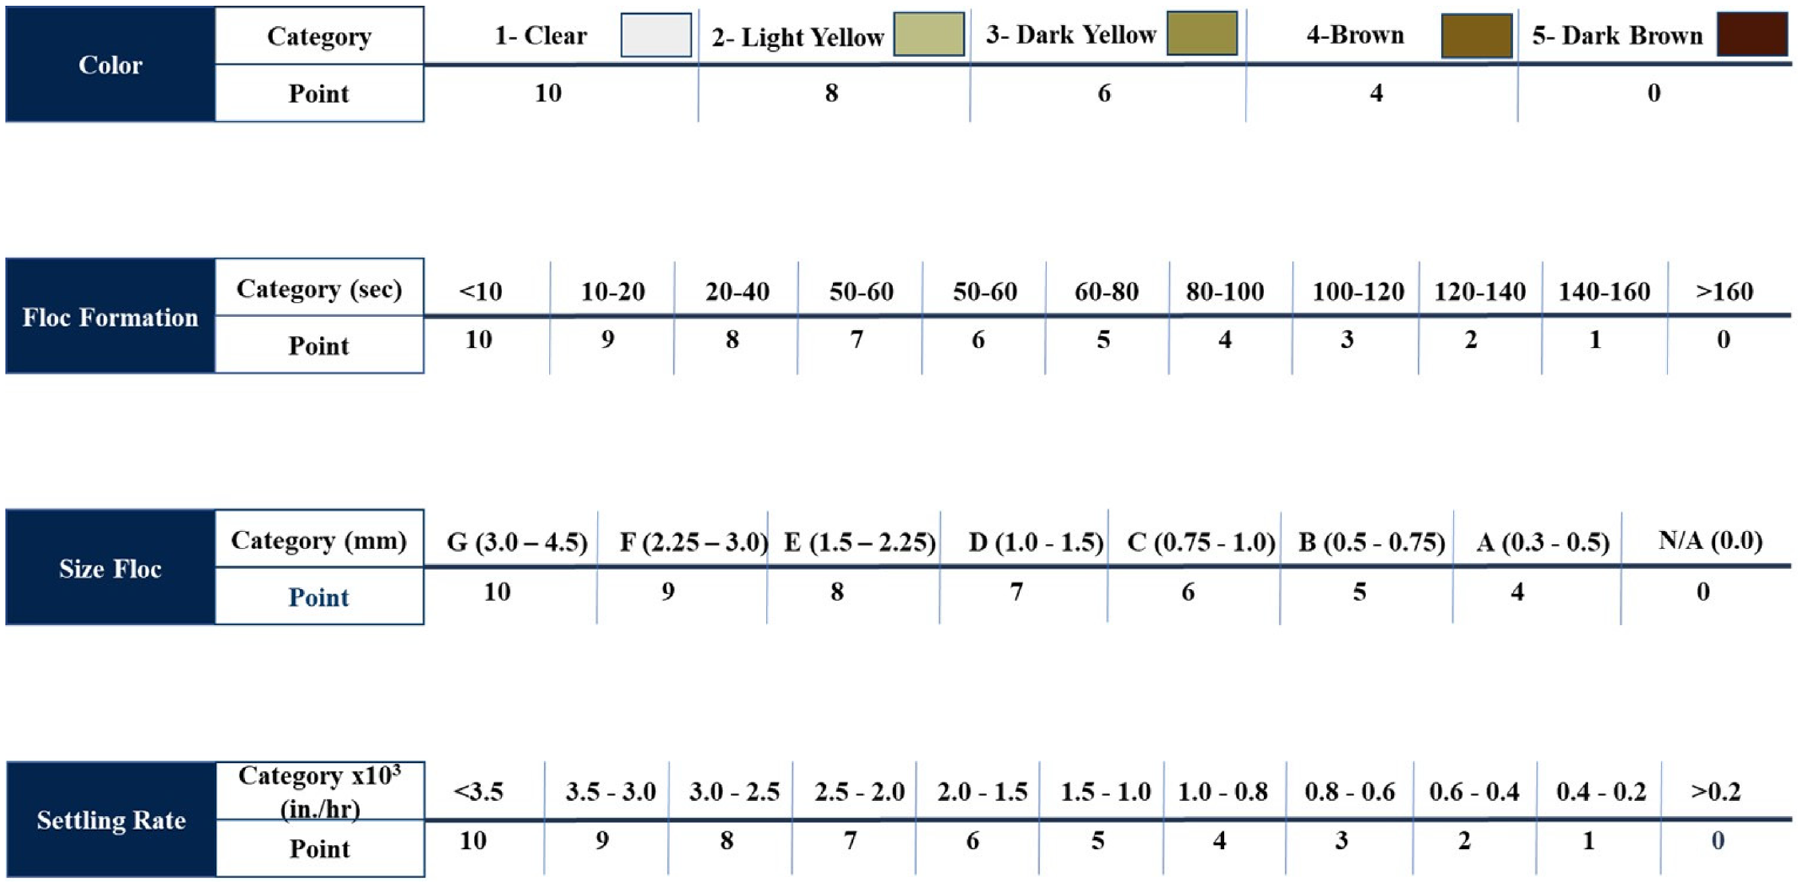
Match test point system.
Dosage Experiments
Match test experiment results were used to identify optimum dosage rates on the best-performing products through dosage experiments. Dosage experiments also followed ASTM jar testing standard procedures as explained in the match test methodology ( 51 ). The experiments evaluated 15 soils for optimum dosage with the top three best-performing products per soil. Each experiment was repeated three times, which resulted in 135 tests in total, and observations included turbidity, pH, color, and temperature measurements.
Sample water for dosage experiments was prepared with the same methodology used in match test procedures, which aimed to have samples with 1,500 +/− 300 NTU. Initial turbidity and pH readings were taken from turbid water samples before each experiment. The dosage of each product in testing beakers ranged between 0% to 200% of the manufacturers’ recommendations. Figure 4 illustrates the dosage ranges used in the dosage test procedures during the slow mixing phase.
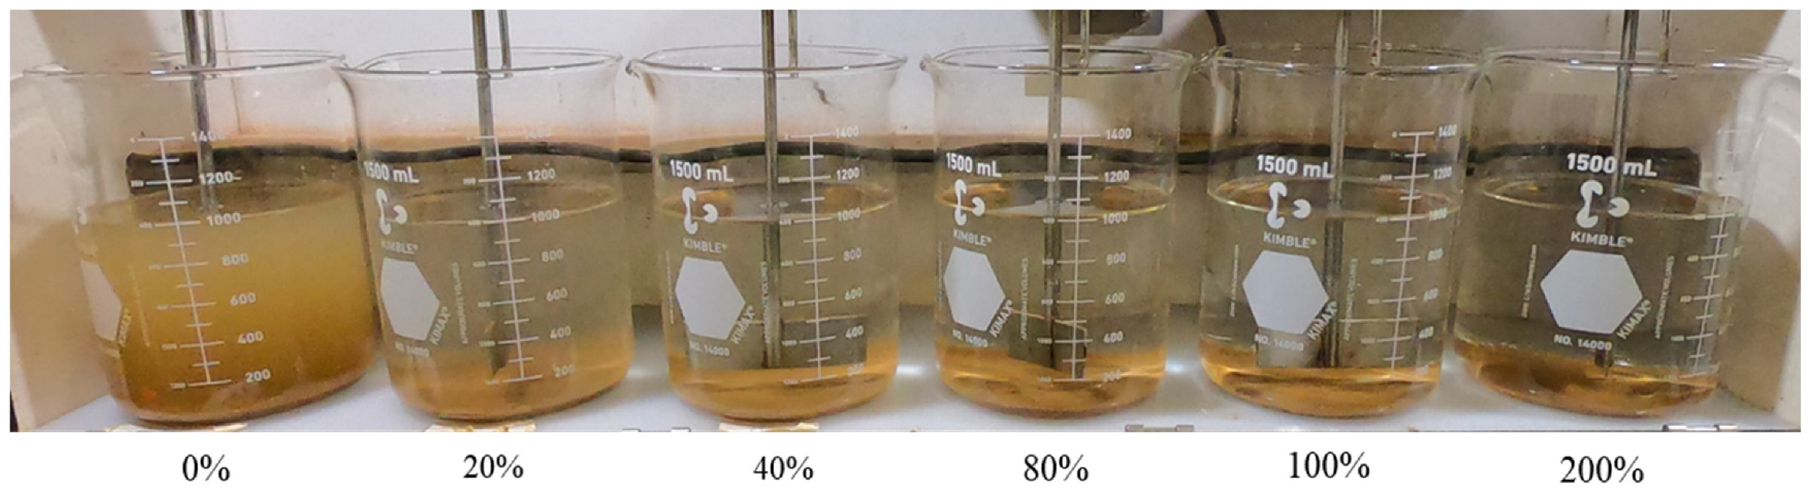
Dosage range.
The control beaker (0%) did not contain any flocculant product. Manufacturer dosage recommendation was represented as 100% and was increased to 200% in each experiment to observe over-dosing conditions. After the completion of the settling procedure, supernatant samples were collected from each beaker by using a pipette with 10 mL pipette fittings and tested for final turbidity and pH values. Turbidity of the samples was measured by using Hach 2100Q Portable Turbidimeter and pH measurements were taken by using Hach Pocket Pro Ph Tester ( 53 , 54 ). Pipette fittings were replaced for each sample to avoid cross-contamination. The data analysis included calculating turbidity reduction, change in pH, quantifying color change, and floc size.
Results and Discussion
The optimum dosage and product selection framework presented in this study provides substantial guidance for improving flocculant implementation on active construction sites and protecting downstream waterbodies from overdoses. The results of this research showed that flocculant products should be selected based on soil characteristics and match test procedures. In addition, the findings of this study illustrated a methodology for identifying optimum dosage concentrations based on the performance of matched products with specific soil samples.
Soil Assessment Findings
Results of the soil assessment provided insight into the bench-scale evaluation of this research for product selection and optimum dosage guidance based on soil characteristics. The assessment presented a WSS-based desktop study and compared laboratory soil testing results to investigate the need for soil testing procedures to classify soils for flocculant product selection. According to the WSS study results, 12 soil series were identified as target soils on sampling sites. For the southwest region sampling site in Mobile County, three soil series were selected for soil sampling: Wadley loamy fine sand (Map unit name: WaB); Malbis fine sandy loam (Map unit name: MaD); and Benndale fine sandy loam (Map unit name: BeB). The Wadley series originated from sandy and loamy marine deposits, the Malbis series are fine-loamy marine deposits, and the Benndale series are coarse-loamy fluviomarine deposits derived from sedimentary rock. For the north region sampling site in Etowah, three soil series were targeted: Chewacla Silt Loam (Map unit name: 9); Dewey Silt Loam (Map unit name: 18); and Minvale cherty loam (Map unit name: 43). The Chewacla series are loamy alluvium derived from sedimentary rock, the Dewey series originated from clayey residuum weathered from limestone, and the Minvale series are loamy colluvium derived from cherty limestone. In the east-central region, two soil series were selected for soil sampling in Shelby county: Townley-Sunlight complex (Map unit name: TsE) and Townley-Urban land complex (Map unit name: TtE), which are clayey residuum weathered from shale. For the west-central region soil sampling site in Bibb county, two soil series were identified as target sampling soils: Mantachie, Kinston, Iuka soils (Map unit name: MIA), and Columbus loam (Map unit name: CmA), which are loamy alluvium and loamy fluviomarine deposits, respectively. Finally, for the southeast region sampling site in Montgomery County, two soil series were targeted for soil sampling: Izagora fine sandy loam (Map unit name: IdB) and Kipling clay loam (Map unit name: KcA). These soil series originated from loamy and clayey fluviomarine deposits and clayey marine deposits derived from chalk, respectively. Target soil samples were selected based on acres within the area of intent and accessibility of the locations on job sites. Each sample was tested in the laboratory for soil classification by following ASTM D7928, D4318, and D3977 standard testing procedures as mentioned in the methodology section ( 47 – 49 ). Laboratory testing results were compared with soil classification results obtained through the WSS study findings. Table 2 shows the comparison of WSS soil classification results with the laboratory soil testing findings.
Soil Assessment Comparison Results
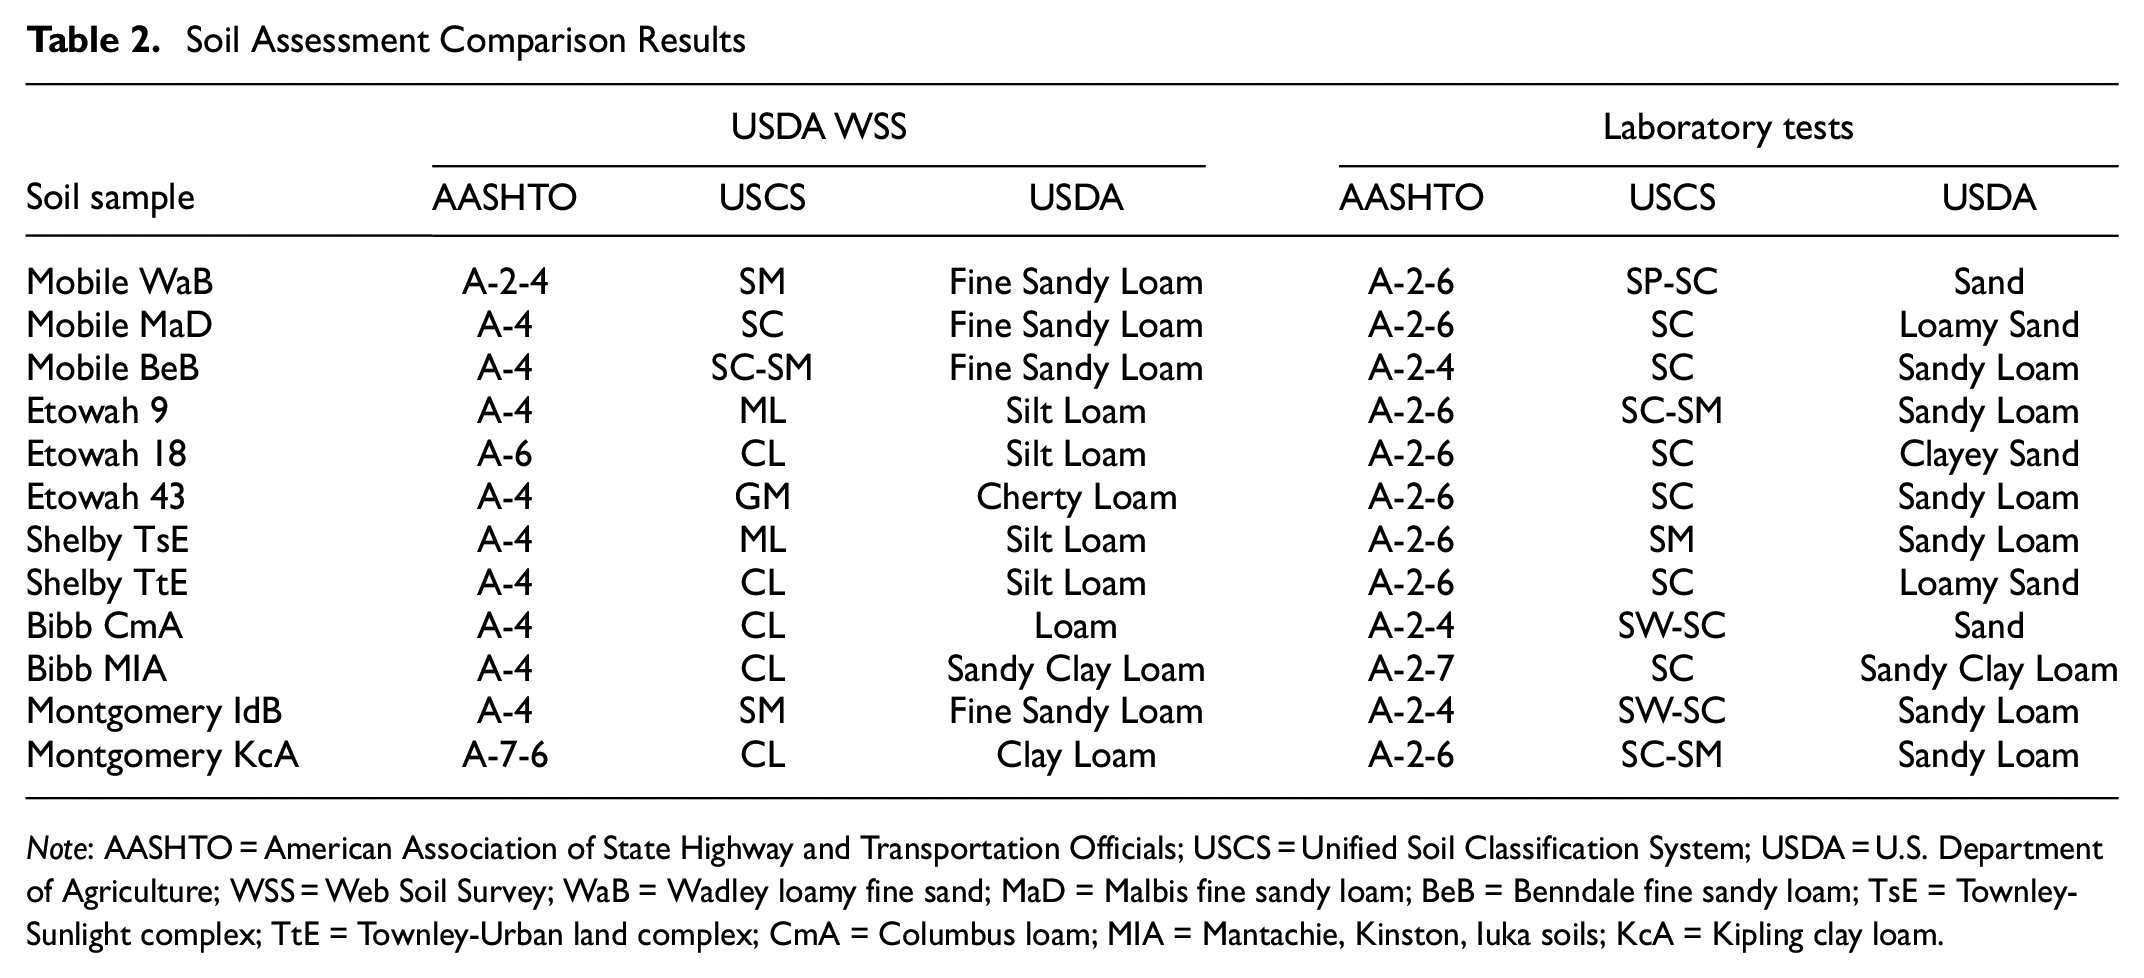
Note: AASHTO = American Association of State Highway and Transportation Officials; USCS = Unified Soil Classification System; USDA = U.S. Department of Agriculture; WSS = Web Soil Survey; WaB = Wadley loamy fine sand; MaD = Malbis fine sandy loam; BeB = Benndale fine sandy loam; TsE = Townley-Sunlight complex; TtE = Townley-Urban land complex; CmA = Columbus loam; MIA = Mantachie, Kinston, Iuka soils; KcA = Kipling clay loam.
The comparison of laboratory testing results with WSS outputs showed poor correlation. There were some soil samples showing similarities in USCS and USDA classification systems such as Mobile MaD and Bibb MIA. However, an exact match between the WSS study and lab testing did not exist on any soil samples. This result indicated that, even though WSS is a useful tool to identify existing soils on construction sites, additional laboratory soil testing is necessary given the non-homogeneity of soils. Flocculant selection based on soil type can be accomplished with the combination of desktop study and soil testing. However, completely relying on WSS desktop study results may misguide product selection.
Soil assessment results indicated that most of the classified soil samples were falling into the bottom left corner of the USDA texture triangle, which represents sand, loamy sand, and sandy loam as shown in Figure 5.
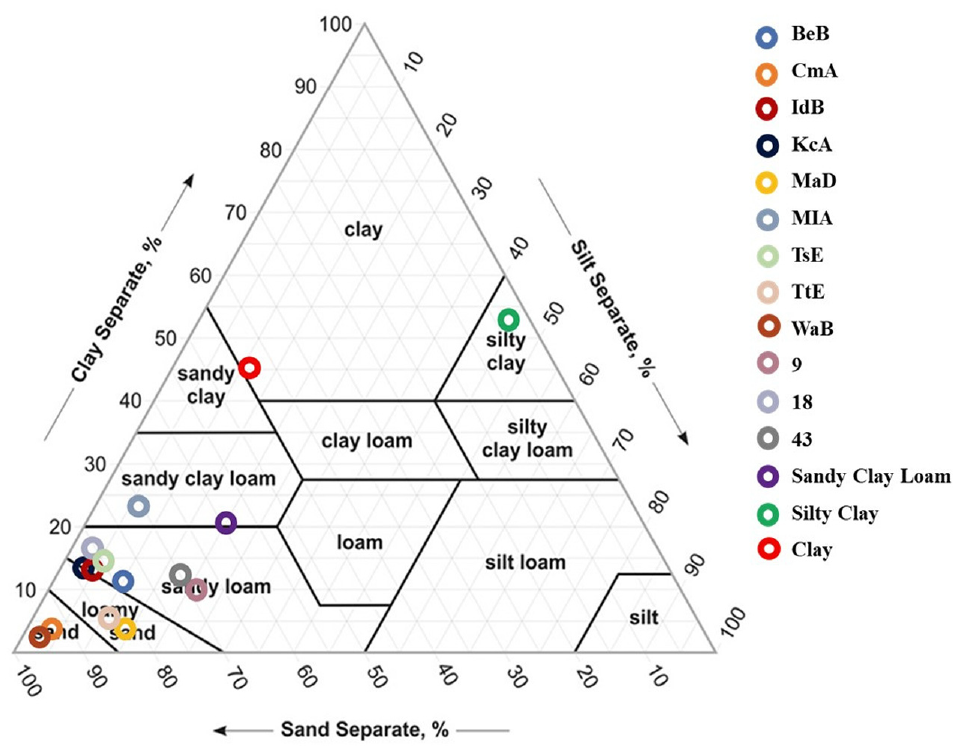
USDA soil classification results.
The primary goal of the soil assessment task was to collect a range of soils for bench-scale evaluation. Therefore, three additional soils were included in the study, and samples were gathered from known sources within the state. These known sourced soils were classified as sandy clay loam, silty clay, and clay on the USDA texture triangle as symbolized with purple, dark green, and red in Figure 5. The addition of known sourced soil samples for the bench-scale experiments provided an opportunity to evaluate a wider range of soil samples on the texture triangle. Regardless of texture analysis, all soil samples were sieved through a No. 200 sieve to evaluate the silt and clay fractions of each soil sample in the bench-scale experiments.
Identifying the CEC of tested soils provides additional information for evaluating the behavior of flocculants on each soil sample. The raw CEC measurement results were obtained based on the experiments conducted by the Auburn University Soil Testing Laboratory. Raw CEC values were normalized by dividing the values by the clay content of the soil properties since the dosage experiments were evaluating flocculation on clay-size soil particles. Based on the results, Shelby TsE, Bibb CmA, and Mobile WaB had the highest CEC value reported at 427.4, 169.7, and 110.7 meq/100 g, respectively. Soils with higher CEC values show a higher capacity to get attracted by cationic charges since their particle surface is more prone to retain cationic charges compared with soils with low CEC. This indicated that cationic flocculants may be activated easily and provide effective flocculation on these soils. CEC results were correlated with the match test results in this research to validate flocculant selection based on soil characteristics.
Match Test Findings
Match test experiments provided a comprehensive data set with regard to flocculant performance on various soil samples. Based on the point system developed for this test method, products were ranked based on the highest score. The three flocculant products with the highest score were selected for each tested soil and these products were further investigated in the dosage study. Match test procedures reduced time and resources in dosage test procedures by eliminating the products with mediocre performance.
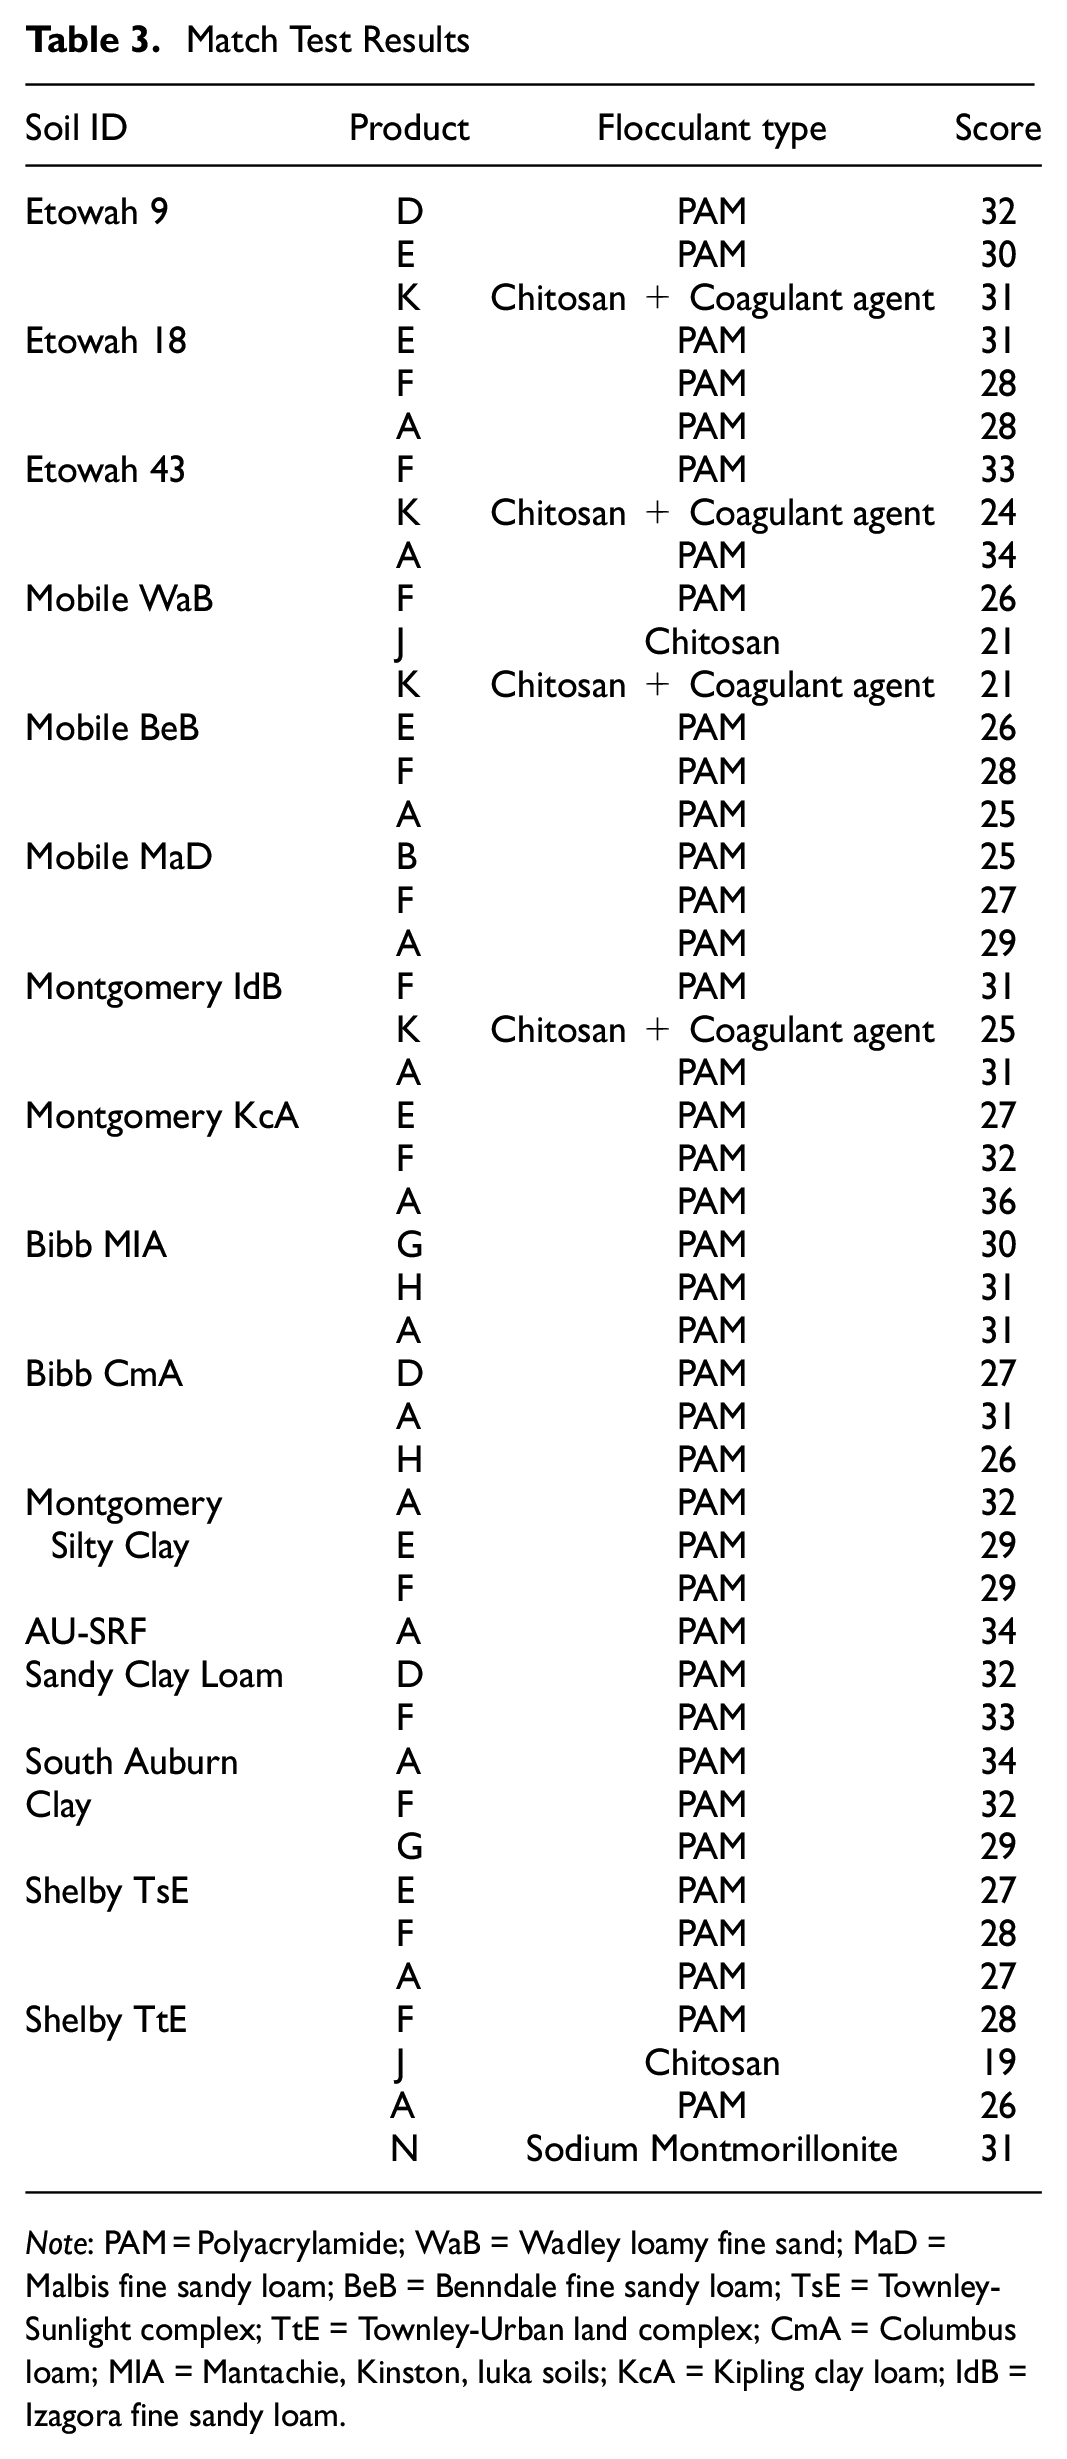
Table 3 shows the top three ranking products for each soil together with product scores. The results indicated that PAM-based products ranked in the top three for all tested soils. Following PAM products, chitosan showed promising results on multiple soil samples when introduced into turbid water samples with a coagulant agent. Chitosan was also effective without the coagulant agent on two tested soil samples: Mobile WaB and Shelby TtE. These soil samples showed high CEC values based on the soil assessment results. As a cationic charge-activated natural flocculant, chitosan effectively facilitated flocculation on these soil samples given their high capacity to retain cations.
Match Test Results
Note: PAM = Polyacrylamide; WaB = Wadley loamy fine sand; MaD = Malbis fine sandy loam; BeB = Benndale fine sandy loam; TsE = Townley-Sunlight complex; TtE = Townley-Urban land complex; CmA = Columbus loam; MIA = Mantachie, Kinston, Iuka soils; KcA = Kipling clay loam; IdB = Izagora fine sandy loam.
Among the products evaluated, product A ranked among the top three matching products for 87% of the tested soils, while product F showed promising results on 80% of the soils. Product N was also effective on most of the soils.
Dosage Experiment Findings
The use of flocculants in construction stormwater management provides substantial turbidity reduction in the stormwater runoff. However, there is a need for proper dosage guidance for ensuring pollution prevention and the safety of aquatic organisms. Dosage experiments in this research evaluated optimum dosage rates for the products selected as a result of match test experiments. The manufacturers’ dosage recommendation ranged from 0% to 200% through six beakers in the mixing machine for evaluating the impacts of underdose and overdose conditions. Results were analyzed based on turbidity reduction, pH, temperature, and color change.
Figure 6 illustrates an example of the dosage test data analysis plot by displaying percent turbidity reduction, pH, and color change results for Shelby TsE soil with the introduction of products A, E, and F polyacrylamide-based flocculants. In Figure 6a, percent turbidity reduction data are plotted versus dosage range based on percent manufacturer dosage recommendation. Results indicated that all top three ranked products during the match test phase showed high turbidity reduction rates, which stayed above 97% in all evaluated dosage ranges. The settling of the control sample showed an average value of 66% turbidity reduction after the 15-min settling period. It can be observed that the use of these products provides approximately a 30% additional decrease in turbidity on average across all evaluated soil samples. Figure 6b displays results for change in pH after the completion of dosage experiments. There was no substantial difference observed for pH change on any tested product for Shelby TsE. However, it should be noted that product E showed approximately 0.4 change in pH in case of the overdose condition. This behavior was also observed on other tested soils such as Montgomery KcA, Mobile BeB, Etowah 9, and Etowah 18. Figure 6c shows the change in color in the turbid water samples after the settling period in the dosage experiment procedures. Δ Color on the presented plot indicates the difference between the initial color and final color of the samples with the highest value representing a clear appearance. Turbid water samples that were prepared with the use of Shelby TsE soil showed the highest change in color with the introduction of product F. This product changed the sample color from brown to clear. Products A and E also showed promising performance for providing clear color. However, the clarity of the supernatants was not as clear as product F samples. Temperature was another factor that was included in the data analysis. Researchers did not record any substantial change in the temperature during dosage experiments after the flocculant introduction.
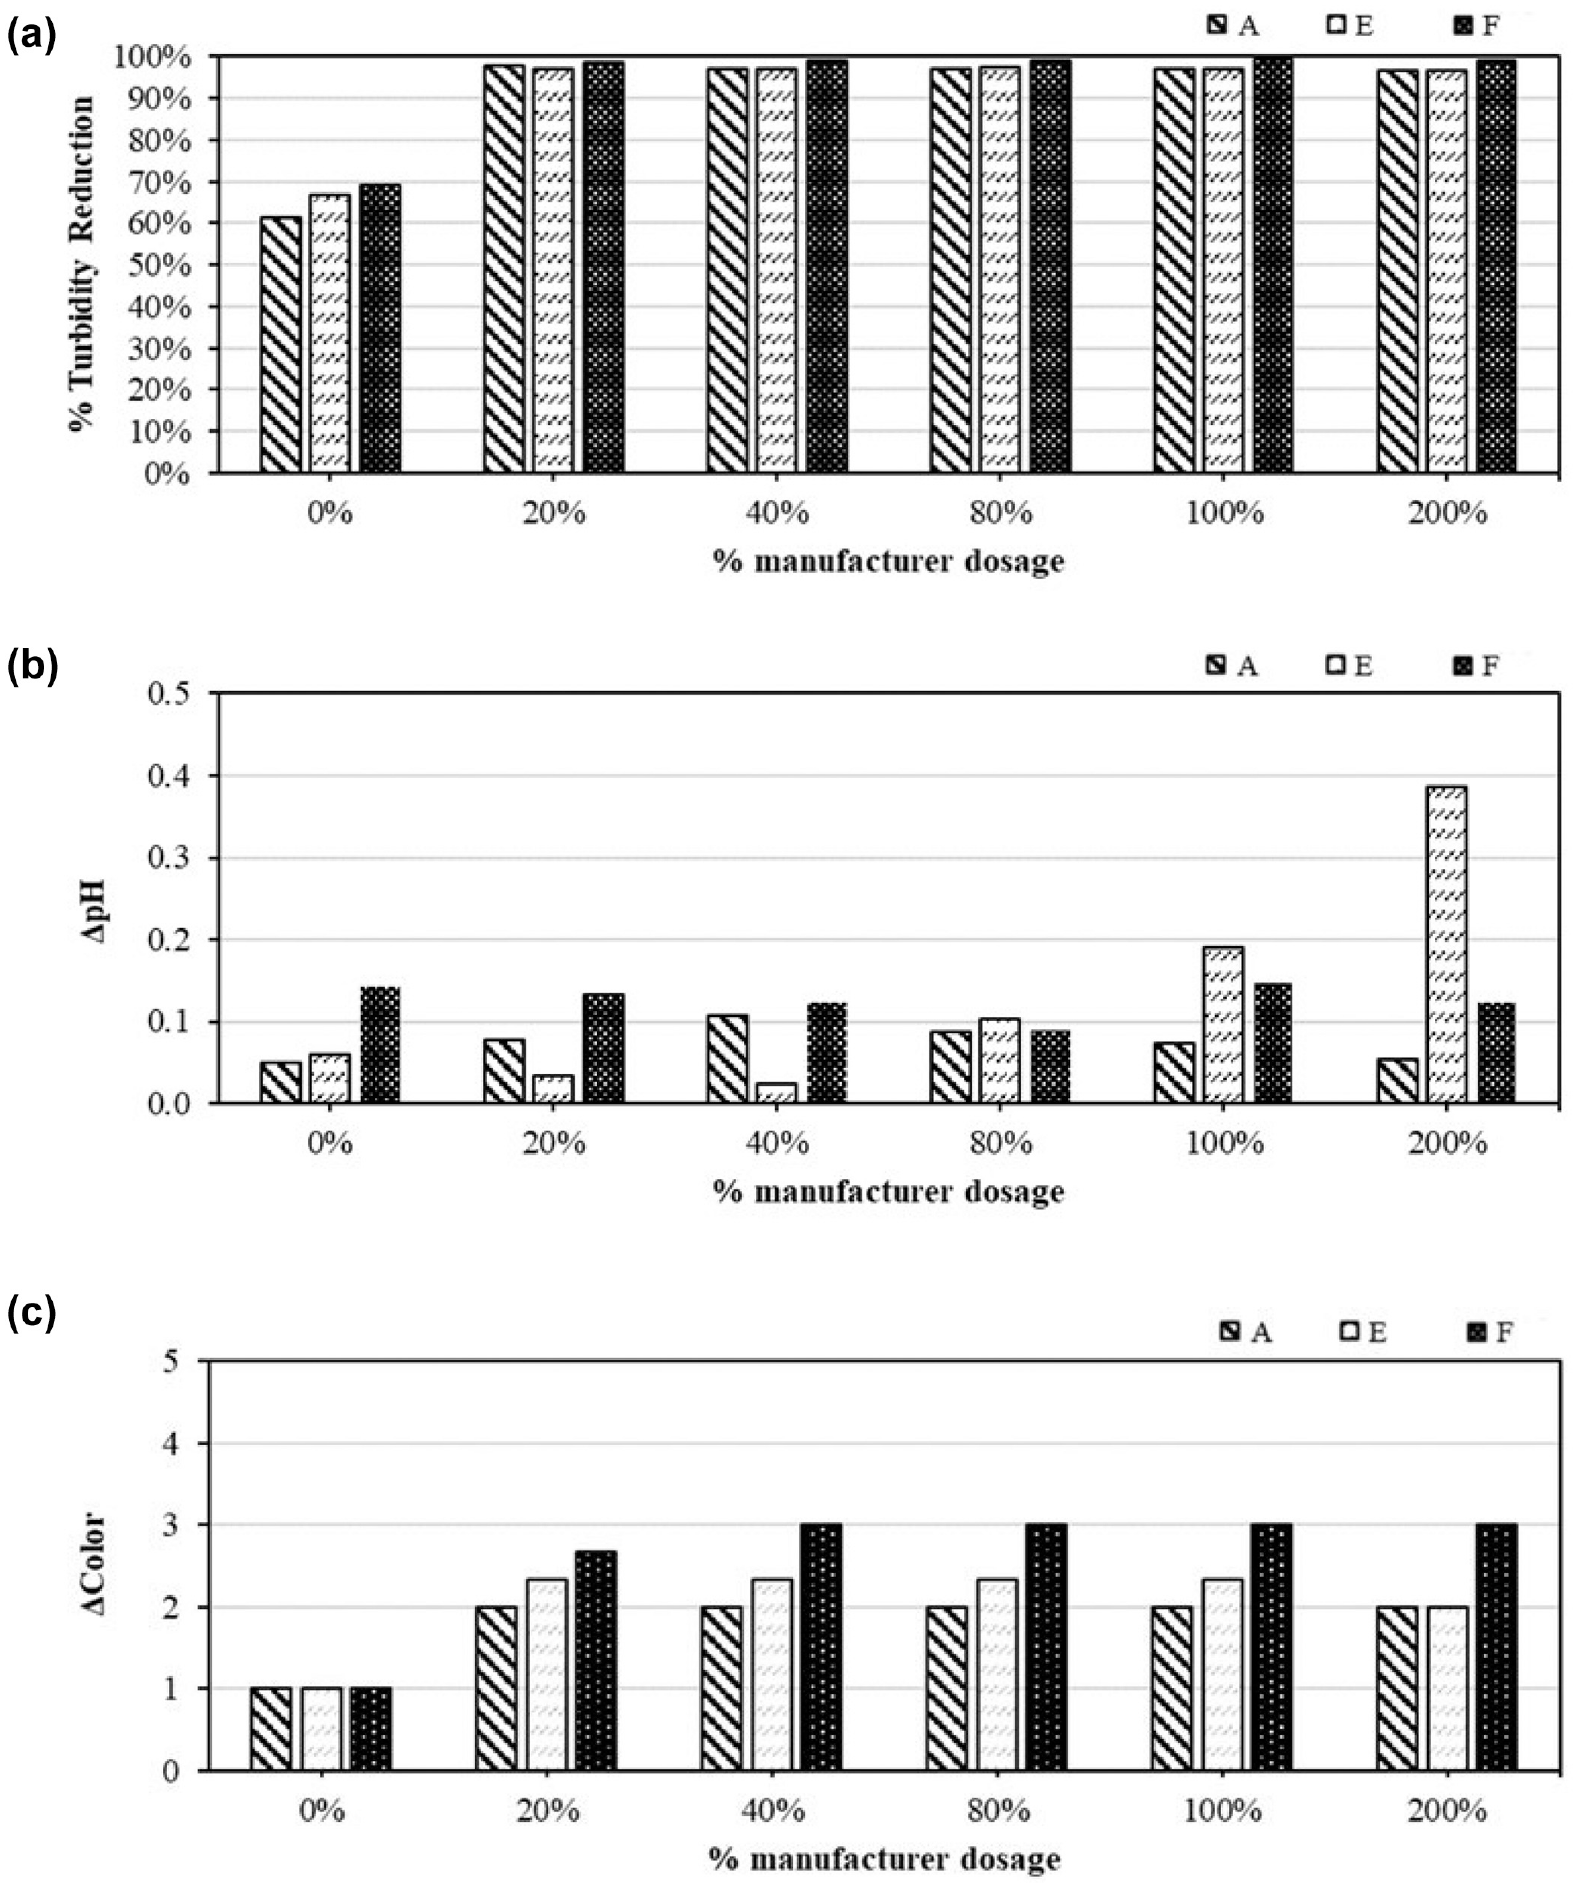
Dosage test data analysis plots for Shelby County, Townley-Sunlight complex (TsE): (a) turbidity reduction (%), (b) change in pH, and (c) change in color.
Dosage study results provided the opportunity to identify the significance of the pH measurements for flocculant dosage evaluation. For instance, the sodium montmorillonite-based product (Product N) was removed from the study after testing with Shelby TtE because of concerning changes in pH on multiple different soil samples during match test and dosage test experiments. The pH of tap water that was used in the experiment ranged between 6.7 and 7.6. The pH measurement results after the introduction of product N showed a substantial drop in pH by almost 4.0 as shown in Figure 7. In controlled systems, reducing pH might assist settling by attracting negatively charged fine soil particles. However, in passive systems, this may pose a concern to discharge water as the optimal pH range for aquatic organisms is between 6.5 to 8.5 ( 55 ).
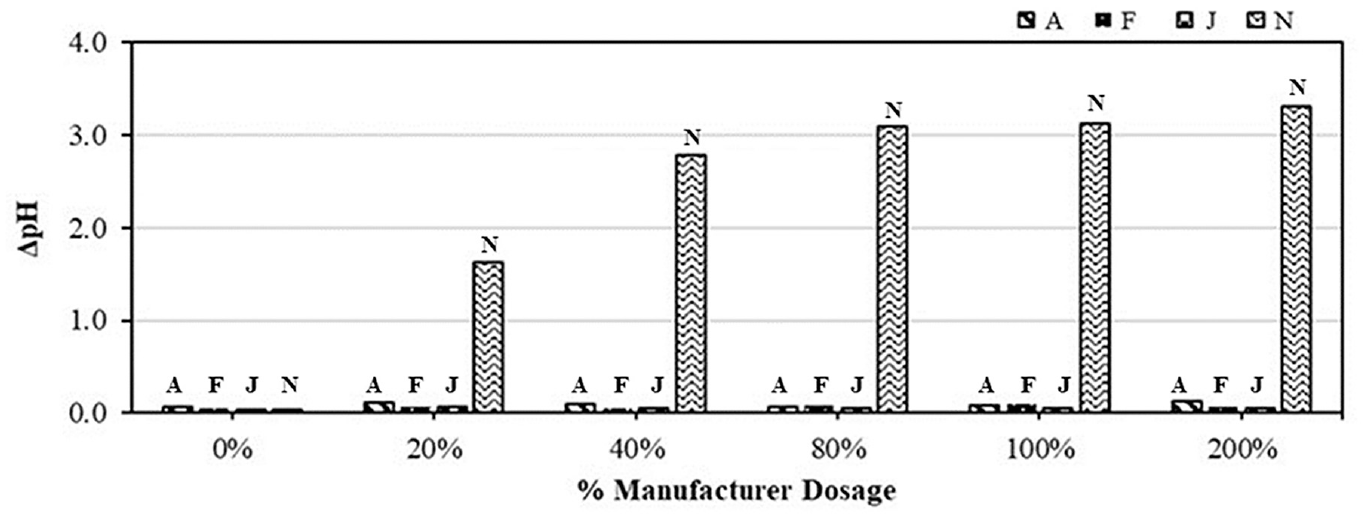
Change in pH on Shelby County: Townley-Urban land complex (TtE).
Findings of dosage experiments indicated that lower flocculant concentrations show similar performance compared with the recommended dosage rates obtained from manufacturers. This observed similarity was statistically analyzed with analysis of variance (ANOVA) by comparing turbidity reduction of flocculant doses used in the experiments excluding soils from South Auburn and AU-SRF. The control condition was left out of the ANOVA analysis since it did not contain any flocculant concentration. In total, 42 ANOVA analyses were conducted on average turbidity reduction values obtained by averaging triplicated dosage experiment results. Table 4 presents the summary of the ANOVA analysis and shows the similarity between turbidity reduction performance of lowered dosages with p-values larger than 0.05. Results indicated statistically significant similarities between dosage rates at the 95% confidence level, except for the dosage experiment conducted on product D and Bibb CmA soil. ANOVA analysis on this specific dosage experiment showed a statistically significant difference between dosage rates, which required further analysis with a paired t-test to identify differences between dosage rates. Results indicated that using 20% of the manufacturer’s dosage rate showed a significant difference compared with 40% of the recommended dosage with a p-value of 0.02 as a result of the high standard deviation (92.46 and 91.79, respectively) between averaged triplicated dosage experiment data for the paired set. This result indicated that lowering the dosage rate down to 20% and 40% of the manufacturer’s dosage recommendation may have less reliable results for this specific product and soil combination. Based on these findings, it is important to note that even though generally 20% of the recommended dosage rate showed significant turbidity reduction on various tested soil and product combinations, the results may vary depending on the reaction between soil and products.
Summary of Analysis of Variance Analysis
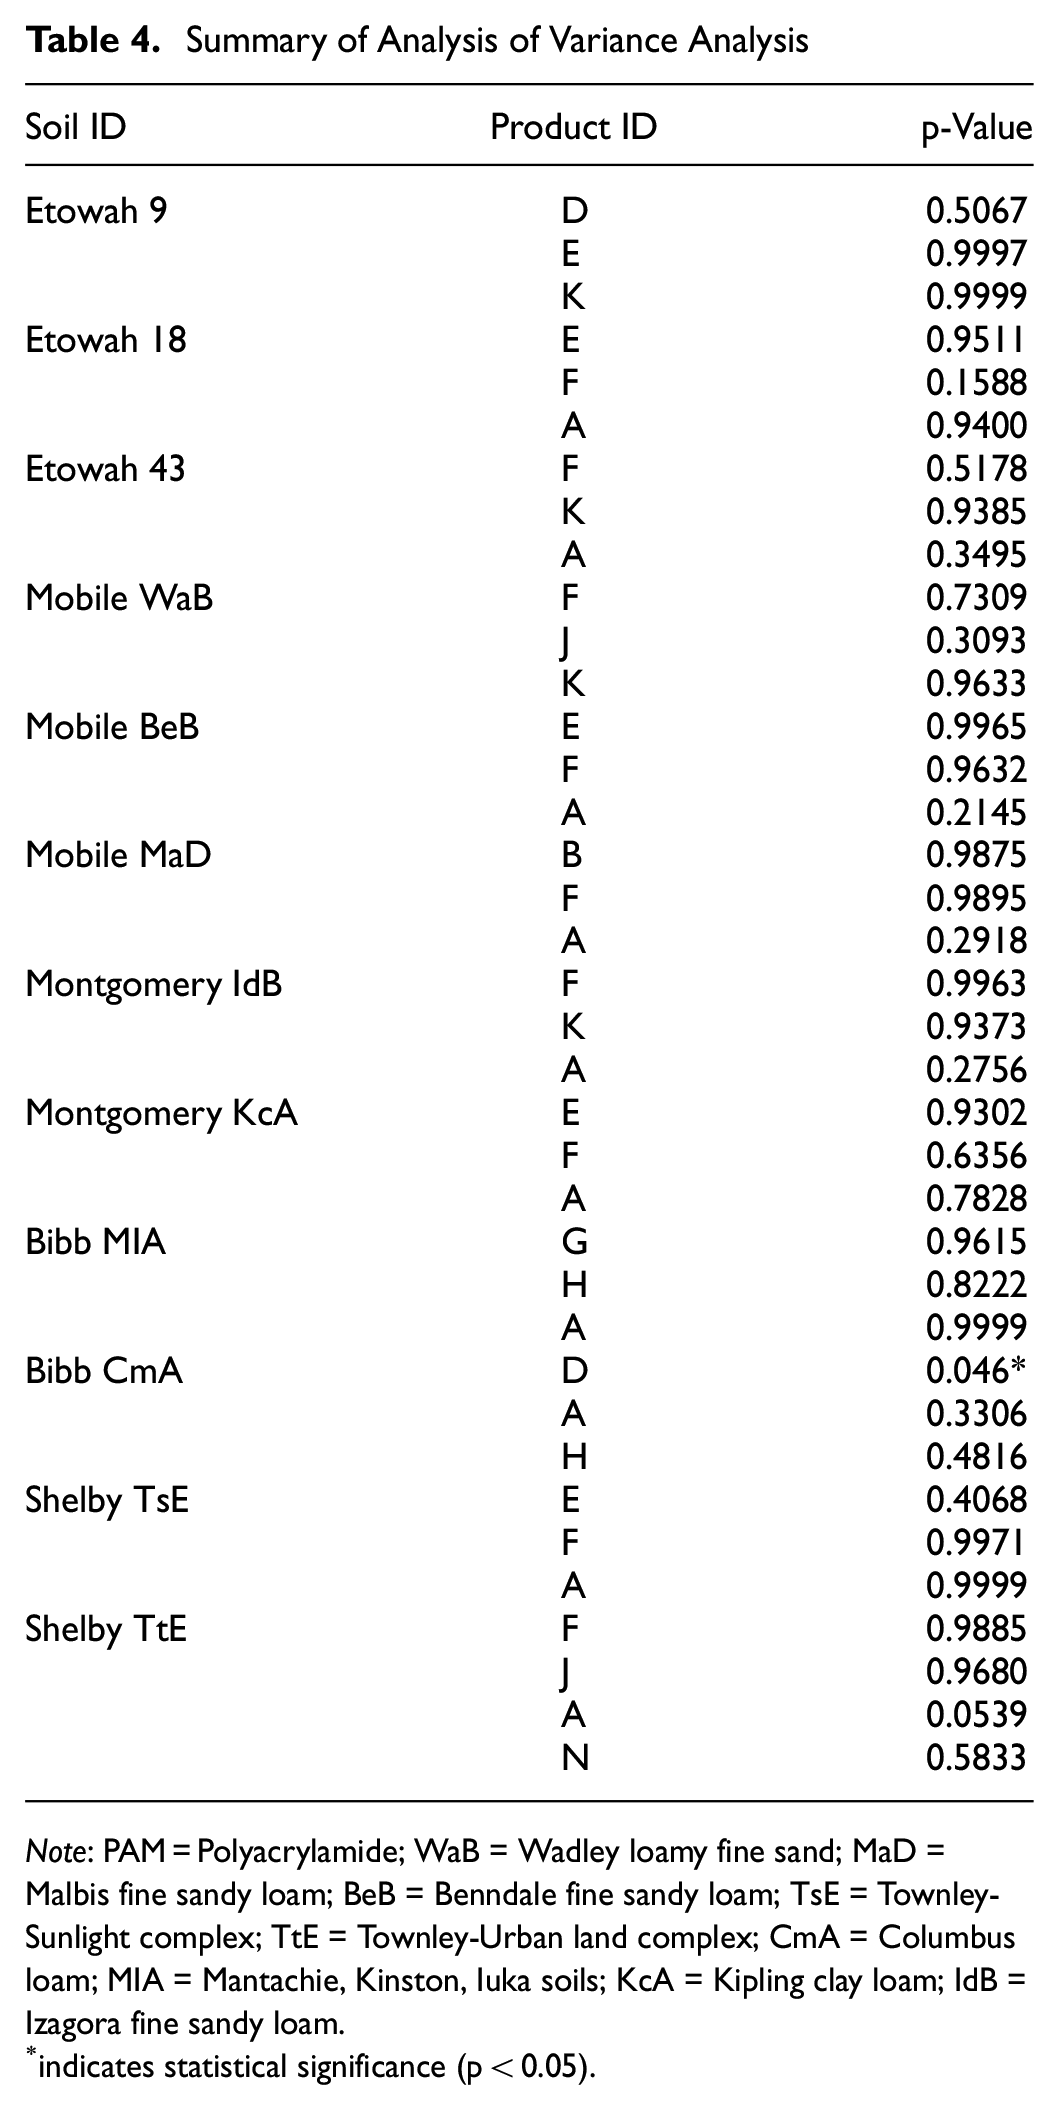
Note: PAM = Polyacrylamide; WaB = Wadley loamy fine sand; MaD = Malbis fine sandy loam; BeB = Benndale fine sandy loam; TsE = Townley-Sunlight complex; TtE = Townley-Urban land complex; CmA = Columbus loam; MIA = Mantachie, Kinston, Iuka soils; KcA = Kipling clay loam; IdB = Izagora fine sandy loam.
indicates statistical significance (p < 0.05).
Dosage experiments showed promising results for the determination of optimum flocculant dosage rates in a laboratory setting. Testing different flocculant products across various soil samples provided substantial information to help fill the gap in knowledge for optimum dosage guidance. These results provided a basis for guiding practitioners on product selection and dosage rate identification requirements of flocculants.
Conclusions
This study has shown the need for applying bench-scale experiments to identify proper dosage and product selection requirements given the soil-dependent nature of most flocculant products. The study developed optimum flocculant dosage guidance in laboratory settings by conducting bench-scale experiments. The study included an assessment of soil samples, development of match test procedures for performance evaluation, and dosage experiments for identifying optimum dosage rates.
Findings obtained in the soil assessment phase of the study revealed the need for identifying soil properties in the pre-product selection stage and emphasized the significance of understanding the role of soil chemistry on flocculant performance. The study evaluated 15 different soil samples collected across Alabama for particle size distribution and CEC to identify soil characteristics that have a role in the flocculation mechanism. Results indicated that identifying texture characteristics of soils is not sufficient alone for product selection since only the fine portion of the soils is being treated with flocculant. Therefore, evaluation of soil chemistry together with clay mineralogy would enhance the product selection procedure. In addition, expanding the evaluated soil samples would build a library for matched soil and flocculant combinations for future correlation of soil characteristics to ideal flocculant products. Soil assessment results also marked the importance of CEC on flocculant selection. Soils with a high ratio of CEC to the percentage of clay content tended to perform well with flocculants activated by cationic charges, which were products J and K.
Following match test experiments, the study evaluated the best-performing products on each soil for dosage requirements. Dosage recommendations obtained from manufacturers were evaluated between the range of 0% to 200% of the suggested concentration values to observe underdose and overdose conditions. Dosage experiment results and statistical analysis on the turbidity reduction indicated that the underdose conditions showed similar performance compared with the recommended concentration value at a 95% confidence level. Results of the dosage study showed that an overdose condition leads to increased turbidity by increasing the viscosity of the sample, which interrupts the settling of formed flocs. The study also highlighted the significance of monitoring pH while identifying the dosage requirements of products. After the completion of the dosage experiments, it was determined that product manufacturer II had miscommunicated dosage recommendations for several PAM products (products B, C, D, E, F, G, H). A dosage recommendation of 50 mg/L was used where it should have actually been 5 mg/L. This miscommunication did not invalidate the testing results since dosage experiments were designed to range the recommended dosage concentrations between lower and higher dosage rates. Furthermore, the performance of underdosed samples corroborated the use of lower flocculant concentrations. Manufacturers tend to over-prescribe dosages without exceeding toxicology limits because of possible wrong implementation and under-dosage in field applications. Additionally, most manufacturers do not use standardized jar testing across a range of dosages while providing dosage recommendations. Therefore, it is important to note that relying completely on manufacturer guidance, which is an approach commonly used by state agencies, might potentially cause application issues on construction sites. Using an independent evaluation method for product and dosage selection and large-scale testing to provide refinement on the dosage guidance are recommended based on the findings of this research. This further validates the need for future research on flocculant guidance for construction applications.
The results of this research effort provided a strong basis for optimum dosage guidance and integration of field-applicable dosage control mechanisms through residual testing. The study should allow practitioners to improve dosage controls on active job sites using flocculants for construction stormwater treatment. Future research efforts should emanate from this research by allowing opportunities to evaluate more soils with different types of flocculant products and expand knowledge on soil-dependent dosage requirements. Match test and dosage experiments are critical for proper product selection and dosage. Further research is needed to determine dosage delivery mechanisms on construction sites.
Footnotes
Author Contributions
The authors confirm contribution to the paper as follows: study conception and design: M.A. Perez, W.N. Donald, and B. Kazaz; data collection: B. Kazaz; analysis and interpretation of results: B. Kazaz and M.A. Perez; draft manuscript preparation: B. Kazaz, M.A. Perez, W.N. Donald, X. Fang, and J.N. Shaw. All authors reviewed the results and approved the final version of the manuscript.
Declaration of Conflicting Interests
The author(s) declared no potential conflicts of interest with respect to the research, authorship, and/or publication of this article.
Funding
The author(s) disclosed receipt of the following financial support for the research, authorship, and/or publication of this article: This work was supported by the Alabama Department of Transportation, grant number 931-017.
Data Accessibility Statement
Some or all data, models, or codes that support the findings of this study are available from the corresponding author on reasonable request. The following data sets are available: raw measurements collected during experimentation and photographs documenting experiments.