
Abstract
Auxiliary lanes (ALs) provide significant operational benefits by spreading merging or weaving movements over a long distance or by providing an extra lane of capacity through a freeway bottleneck or signalized intersection. However, if ALs are not long enough, they may produce merge bottlenecks and queue spillbacks onto the main lanes of the freeway or arterial, creating operational and safety concerns. While there is literature or guidance for ALs on freeways, there is minimal design guidance for ALs on frontage roads. This study systematically examines various design elements of ALs on frontage roads and the design parameters that influence these design elements by leveraging microsimulation. The key purpose of this study is to develop recommendations for the length of ALs in six common frontage road design configurations based on the selected nine design parameters. More than 3,000 simulation runs were performed to develop and compare guidance with the existing design manuals. The results reveal new insights that would complement existing design guidance.
An auxiliary lane (AL) is a lane built alongside a roadway’s primary lanes for a limited distance to provide additional roadway capacity and to help facilitate safe traffic movements, including acceleration, deceleration, weaving, merging, diverging, entering, exiting, and turning. Common examples of ALs include acceleration and deceleration lanes, climbing lanes, and right- and left-turn lanes. ALs can have significant operational benefits by spreading merging or weaving movements over a long distance or providing an extra capacity lane through a freeway bottleneck or signalized intersection. They can also produce important safety benefits by reducing speed differentials at merge points, separating slow-moving trucks from general traffic, and separating the lane change, deceleration, and storage components of turns from through lanes. However, if ALs are not long enough, they may produce merge bottlenecks and queue spillbacks onto the main lanes of the freeway or arterial, creating operational and safety concerns. Therefore, roadway designers should have guidance on the appropriate length of various types of AL and how the desired length might vary with other design parameters such as speed or volume.
Continuous frontage roads with slip ramps to and from the freeway mainlanes are a signature of Texas freeway design, but similar configurations can be found in other states including Arizona and New York as well as in other countries such as Mexico and Brazil. Frontage roads have characteristics of both freeways and arterials and may have ALs at and between ramp terminals, for turn lanes at intersections, and for acceleration out of right turns and turnarounds. Some ALs serve more than one purpose, for example, those that run from an offramp terminal to a downstream signalized intersection, serving as both deceleration and merge area for offramp traffic and turn lane at the signalized intersection.
Some types of AL have been well studied in the literature. On freeways, ALs for acceleration, deceleration, weaving, and climbing have been covered in previous research and integrated into design references such as the AASHTO Green Book ( 1 ) and state design manuals. Similarly, ALs for turns and acceleration have been studied in previous research and incorporated into design references. ALs on freeway frontage roads, on the other hand, have received relatively little attention in the literature. This paper will attempt to fill that gap by addressing three key issues in frontage road AL design that have either not been covered or at best only partially addressed in previous research:
The length of ALs that provide merging distance for offramp traffic or that serve as a weaving lane between an offramp and downstream onramp in an X-ramp configuration.
The distance between an offramp terminal and downstream intersection.
Queue length issues involving right-turn, left-turn, and U-turn lanes.
An X-ramp configuration reverses the direction of ramps compared with a conventional diamond interchange, so that the onramp is immediately upstream of the signalized intersection and the offramp is immediately downstream. See Figure 1b for an illustration.
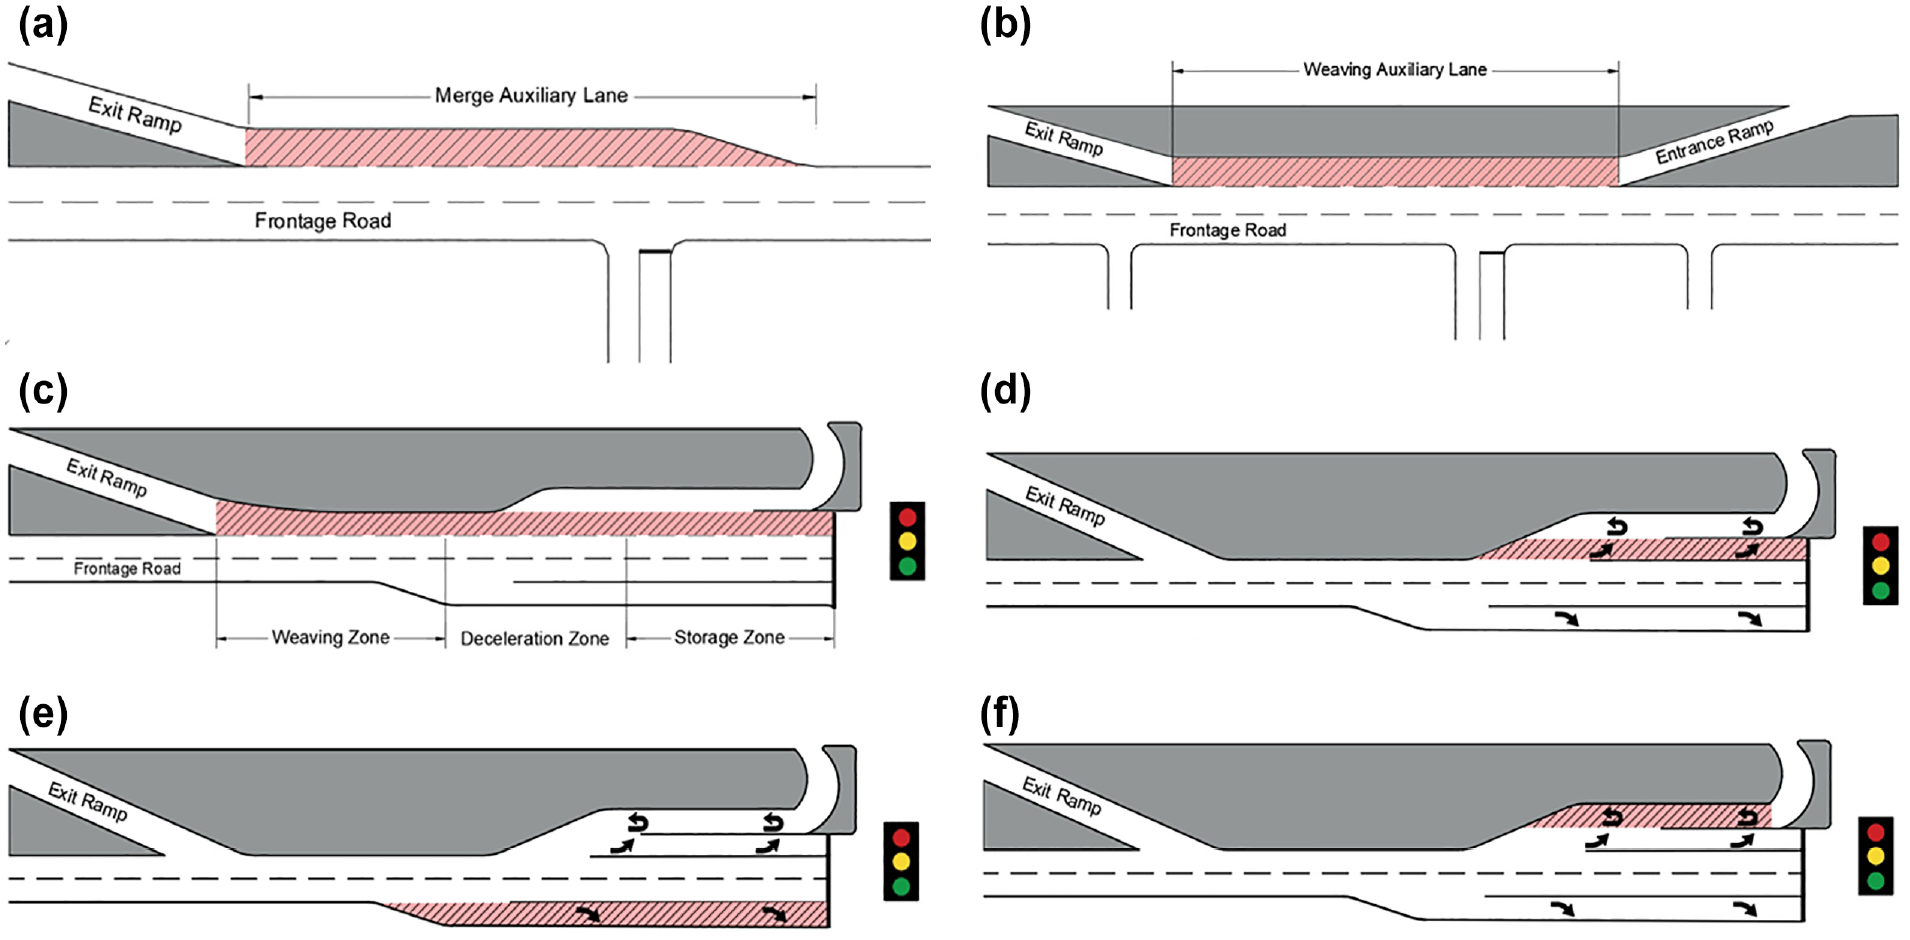
Six design elements of auxiliary lanes (ALs) on frontage ramps: (a) AL merge length; (b) X-ramp spacing; (c) design elements between an exit ramp and downstream intersection; (d) left-turn deceleration lane; (e) right-turn deceleration lane; and (f) U-turn deceleration lane.
The first issue has been studied in the context of freeways, but freeway guidance does not apply to frontage roads because of differences in traffic flow characteristics, notably because of interactions with driveways and side streets. The second issue is unique to frontage roads and not well covered in existing literature. The third issue is a known problem on frontage roads and arterials but not well covered by existing design guidance. This paper systematically examines these issues in microsimulation, including how other design parameters affect them and develops recommendations for the length of an AL in six common frontage road design configurations and nine design parameters that may influence the design configurations.
Literature Review
Als in freeway and arterial contexts have received significant attention in the literature. Research on these applications has been translated into design guidance in the AASHTO Green Book ( 1 ) and state design manuals ( 2 – 4 ). Relatively few papers have evaluated Als on frontage roads. The following paragraphs will summarize previous works on the topics listed in the introduction: Als for ramp-related merging and weaving, offramp-to-intersection spacing, and queue length issues affecting turn lanes at intersections. Als are often used where offramps join a frontage road, sometimes providing a merge area that ends in a lane drop or in X-ramp designs continuing to the downstream entrance ramp and serving both weaving maneuvers. These design configurations are illustrated in Figure 1, a and b , respectively. Design manuals, such as the Highway Capacity Manual (HCM) ( 5 ) and the Green Book ( 1 ), define a merge influence area and provide guidance for AL length on freeways but do not mention merge distances on frontage roads.
Frontage road Als in X-ramp weaving sections were studied in the 1990s by Fitzpatrick et al. ( 6 , 7 ) and Fredericksen and Ogden ( 8 ). The former study recommended minimum and desirable weaving lengths of 200 m (656 ft) and 300 m (984 ft), respectively. The latter recommended that weaving sections be at least 600 ft long and preferably 900–1,200 ft, with at least two through lanes on the frontage road and no intersections or driveways. At the national level, the HCM has a procedure for analyzing freeway weaving sections at different speeds and the Green Book has guidance for weaving length on freeways and collector-distributors but neither explicitly addresses frontage roads. While guidance for merge areas and weaving lengths on freeways could be used to design frontage road Als, frontage roads have some notable differences. These include: (i) frontage road merge areas being deceleration lanes instead of acceleration lanes; (ii) many exiting vehicles desiring to make multiple lane changes; and (iii) frontage road flow being more turbulent owing to many driveways and intersections. Moreover, vehicles on frontage roads may also need to make multiple lane changes to be in the correct lane for exiting or entering downstream roads. Although studies have considered frontage road weaving lanes, a thorough analysis of the influence of various design parameters, such as volume, vehicle composition, and speed, is missing from the literature.
In a diamond interchange, the offramp-to-intersection spacing is an important variable and an AL may be added at the offramp terminal, becoming a turn lane at the intersection. Figure 1c illustrates this design configuration without an AL. Fitzpatrick et al. developed minimum and desirable offramp-to-intersection spacings for two-lane frontage roads with an AL ( 6 , 7 ). This study is referenced in the Texas design manual ( 4 ). The Arizona design manual recommends a minimum offramp-to-intersection spacing of 550 ft, with the actual distance varying based on weaving and storage requirements ( 9 ). Although these references are specific to frontage roads and partially address the issue, the weaving, deceleration, and storage needs are not fully understood, particularly for urban frontage roads where drivers may need to make multiple lane changes to be in the correct lane for their desired turn at the intersection.
Turn lane warrants and lengths at both signalized and unsignalized arterial intersections have been studied in many previous works ( 10 – 15 ), and good summaries of existing guidelines exist in the TRB Access Management Manual ( 16 ) and NCHRP Report 279 ( 17 ). Although guidelines for arterials may be a good starting point for frontage road design, frontage roads may have significantly more weaving upstream of the intersection, particularly in a diamond interchange configuration like the one shown in Figure 1c. High U-turn volumes and turnaround lanes, common in Texas urban areas, are another notable difference compared with a typical arterial. When right-, left-, or U-turn lanes are not long enough, queues can spill back, blocking an adjacent lane or preventing vehicles from accessing their desired turn lane. The Green Book does not consider these types of indirect effect from queues in an adjacent lane. This research proposes leveraging microsimulation to examine these types of queuing issues, filling a gap in existing design guidance for state departments of transportation (DOTs) and literature.
The six design elements of interest from the literature review and discussions with subject matter experts (SMEs) at the Texas DOT are as follows: (i) AL merge length (Figure 1a); (ii) X-ramp spacing (Figure 1b); (iii) distance between the exit ramp and downstream intersection (Figure 1c); (iv) left-turn deceleration lane length (Figure 1d); (v) right-turn deceleration lane length (Figure 1e); and (vi) U-turn/turnaround deceleration lane (Figure 1f). These design elements are considered for one-way frontage roads only. Two-way frontage roads also exist in Texas but typically do not have ALs.
Methodology
This section is divided into two subsections: the first describes the model calibration process, and the second describes the experimental design and scenarios considered.
Model Calibration
For any traffic microsimulation study, the calibration procedure is always a crucial step—it is the procedure where the analyst adjusts the model parameters to represent driver behavior realistically and observed traffic under specific travel conditions. Calibration is critical because models are proxy tools for real-world operations and cannot capture all the variables that affect real-world traffic conditions. Therefore, each simulation model must be adapted to local conditions and analysts must demonstrate that models adequately represent observed traffic flow phenomena. The base model development and calibration methodology followed in this research paper is partially based on the 2019 Federal Highway Administration (FHWA) guidelines for microsimulation ( 18 ).
Model calibration and validation require analysts to compare simulated data with field-observed traffic data. This can be time-consuming and can only be complete when the model representation of field conditions reaches acceptable levels. FHWA microsimulation guidelines ( 18 ) provide three steps for the calibration process:
Identify representative days.
Prepare variation envelopes.
Calibrate model variants within acceptability criteria.
In the first step, the analysts identify one representative day for each travel condition. In the second step, the analyst prepares the simulation inputs to model each representative day or condition. The third step is to adjust the software parameter within a model to achieve key performance measures derived from simulation outputs within an acceptable range.
According to FHWA guidelines ( 18 ) an effective calibration requires at least two key calibration parameters. The guidelines suggest that at least one measure should be related to travel time or speed profiles along one or more key corridors in the case study. The other calibration measures that are critical to the study should be evaluated in the analysis. The following is the list of the calibration measures that were selected and used (as needed) for studying frontage road ALs:
Traffic volume (model versus observed) (vehicles per hour [vph])
Speed (mph) or travel time (seconds)
Queue length (ft)
The primary goal of calibration is to demonstrate that the microsimulation model’s stochastically varying driver and driving environment parameters produce measures (selected for calibration) that fall within an acceptable range of the observed/field data. FHWA guidelines ( 18 ) have a time-variant variation envelope for simulation parameters based on the standard deviation and an acceptable range of variation around both the time-variant averages and the observed representative day value. In part, stochastic variation in the model is achieved using different random number seeds across multiple simulation model runs for each modeled scenario (unique combination of traffic volume, roadway geometry, control parameters, and calibration settings). The random seeds also reflect variations and path-dependence in real traffic, where congestion varies from day to day even with relatively similar traffic volumes.
One of the recommended criteria from the guidelines is that 95% of simulated outputs fall within the two-sigma band (the Z-statistic, in this case, is 1.96) as:

where
With acceptability criteria established, researchers created initial model variants that represent field conditions for selected frontage road AL sites. Following the FHWA guidelines ( 18 ), the analysts conducted individual runs of each model variant and adjusted the model variant input parameters until performance measures based on simulation outputs were acceptably consistent with observed data. According to the guide, acceptably consistent is defined as meeting all four separate acceptability criteria defined in the guidebook. Although the FHWA guidelines ( 18 ) recommend meeting all the criteria, it takes tremendous resources and time to meet all of them. Therefore, the analysts attempted to meet the basic criteria (Criterion 1: Control for Time-Variant Outliers), given available resources for the calibration effort. Simulation expert judgment was used to assess the efficiency of further calibration effort if the results demonstrate diminishing returns.
Performance Measures
The research team used both system-level and focused performance measures to monitor performance under the myriad combinations of model parameters and identify conditions under which specific design features provide benefits. The system-level performance measures are total system travel time and delay (in-vehicle hours), total system delay (in-vehicle hours), the average speed for vehicles in the entire system (mph), average delay time per vehicle in the entire system (in seconds), the average number of stops of each vehicle in the system. The individual-level (for frontage road and ramps) performance measures to be used in this study are: (i) the number of vehicles performing the given movement; (ii) delay time (in seconds) that it takes to complete the movement; (iii) stop delay (in seconds) during the movement through the interchange; (iv) number of stops during the movement; (v) average and maximum queue length (in feet) of the given movement; and (vi) maximum queue length (in feet) of the given movement and weaving length and lane balance.
Experimental Design
Design Elements and Levels
The research team reviewed existing frontage road designs to identify representative design element levels (i.e., the length of an AL in a particular design configuration). Depending on the design element, the sample size ranged from 34 to 150 sites. Initial design element levels were based on percentiles, with the 15th percentile representing the low value, the 50th percentile the medium value, and the 85th percentile the high value. The final levels were adjusted to produce round numbers and a consistent increment between low, medium, and high. Table 1 lists the various design elements and selected design element levels.
Design Element Levels (ft)
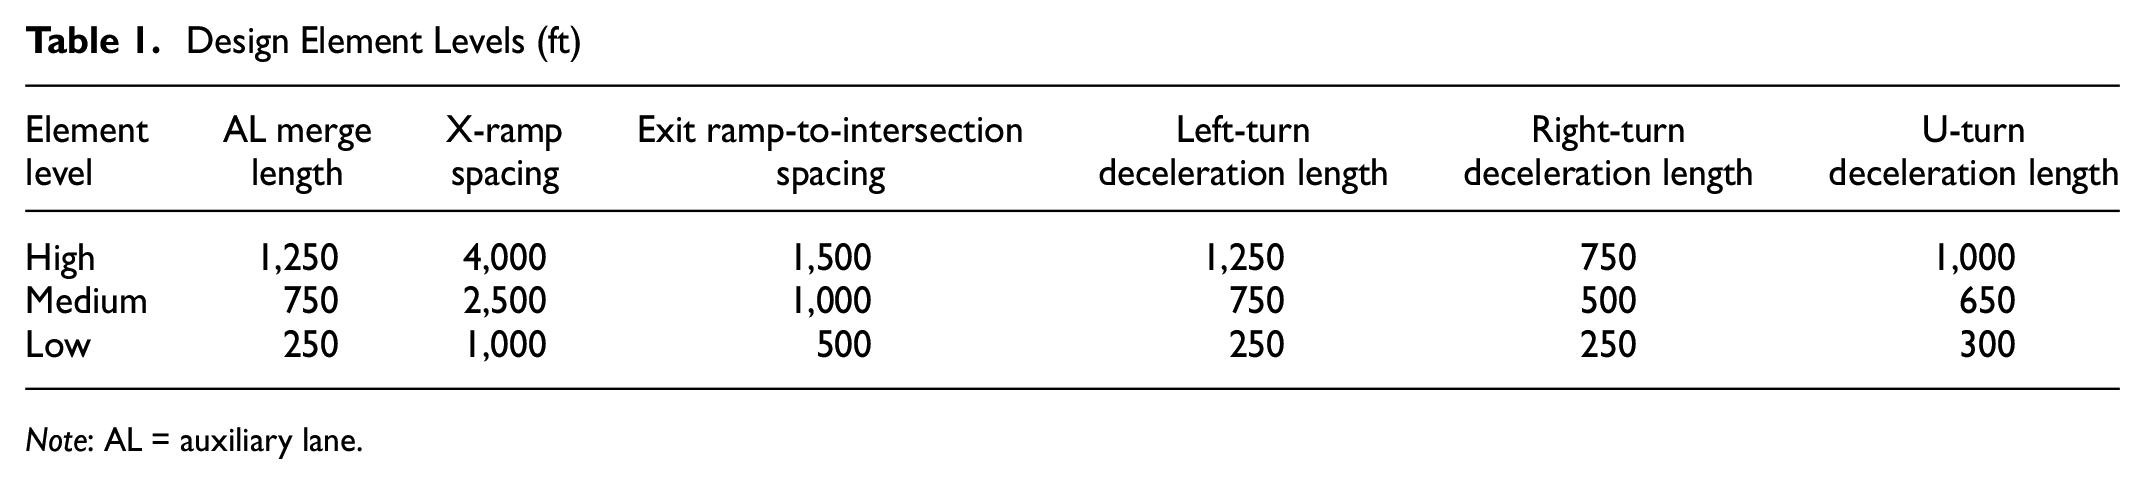
Note: AL = auxiliary lane.
Design Parameters and Levels
Nine design parameters that may influence AL design were identified based on: (a) literature review findings; (b) input from SMEs at Texas DOT; and (c) input from the authors’ experience on past projects. The design parameter levels were selected from the state’s roadway inventory data using percentile based analysis as performed for the design element levels. The design parameters and levels are shown in Table 2. The observed frontage road speed was selected instead of posted speed as it is a better measure of driver behavior and field dynamics in a simulation than the posted speed given the lack of adherence to the posted speed.
Various Design Parameters and Their Levels for Experimental Design
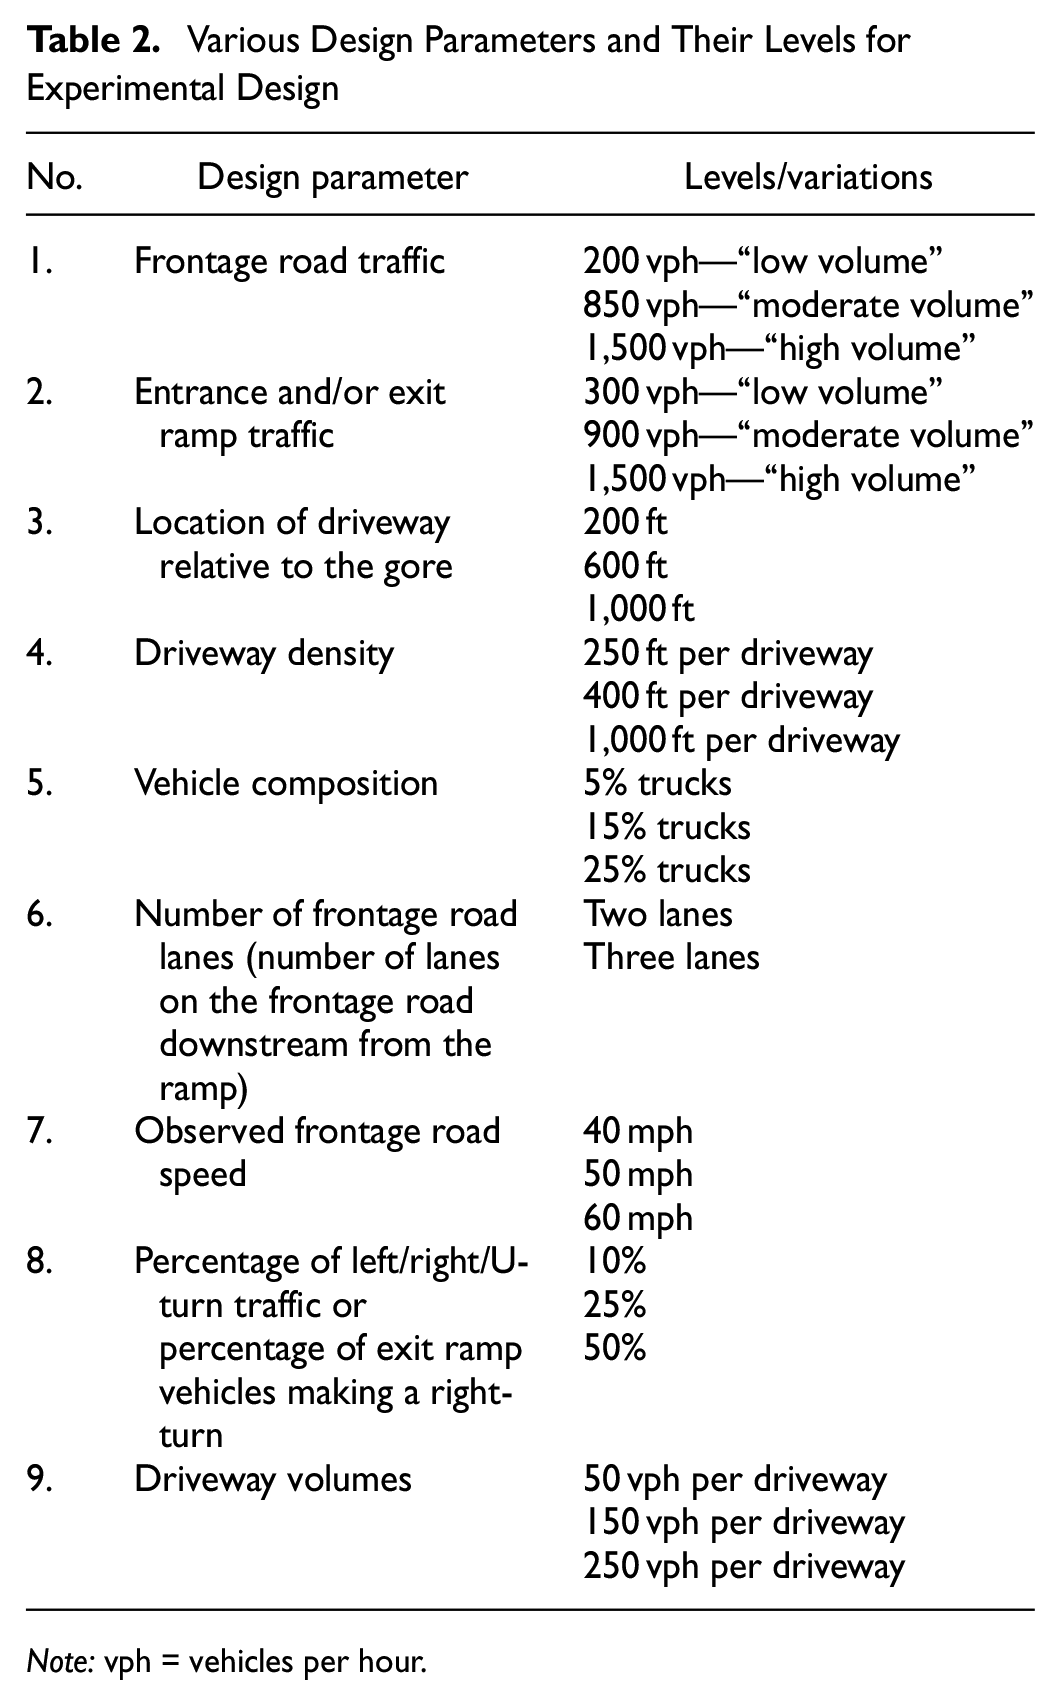
Note: vph = vehicles per hour.
Simulation Model Development
Simulation models were developed in PTV VISSIM version 2021 and calibrated to field data obtained from six representative study sites as listed in Table 3.
Selected Field Sites with Auxiliary Lanes (ALs) on Frontage Roads
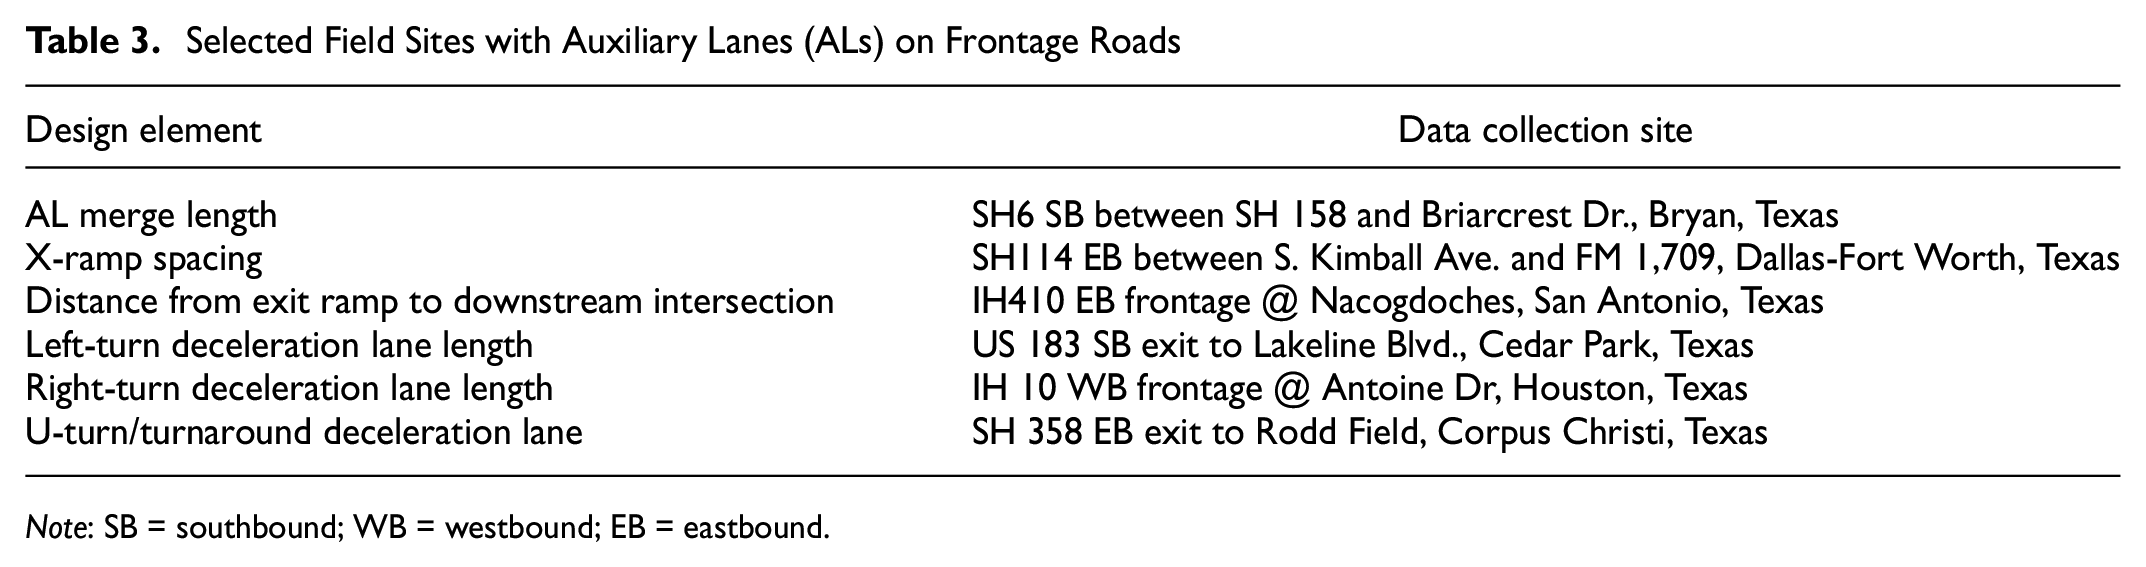
Note: SB = southbound; WB = westbound; EB = eastbound.
The data collected and used in developing the models at these sites included the following:
Traffic volumes (15-min periods) for both frontage roads and ramps (obtained using tube counts and videos)
Speeds (obtained using data from tubes and analyzing videos)
Turning movement counts (obtained from recorded videos and counts)
Lane changes (obtained from videos)
Geometric data (obtained from google earth)
Traffic composition (including truck types) (obtained from traffic counts)
Traffic signal timings (obtained from city/local authorities and optimized using Synchro software for performing sensitivity analysis with varying traffic volumes)
Scenario Development
Analyzing all combinations of design parameters and elements would be informative but resource demanding. Therefore, a procedure was developed to identify and focus on each design element’s most impactful design parameters. An overview of the simulation process is given below. Note that every simulation described is the average of five replications, each with a unique random seed.
Base model calibration: Each site went up to 18 iterations before all calibration targets were reached. This is to develop a well calibrated model of real-world study corridors and segments to model and analyze.
Design parameter selection: Each design parameter level listed in Table 2 was simulated individually for 26 simulations to identify the top three design parameters that affect a particular design element. The procedure outlined in Figure 2 was used to identify the three most impactful parameters to advance to the next step.
Design element evaluation: A full factorial sensitivity analysis was performed for all design element levels (see Table 1) and all levels of the selected top three design parameters. Up to
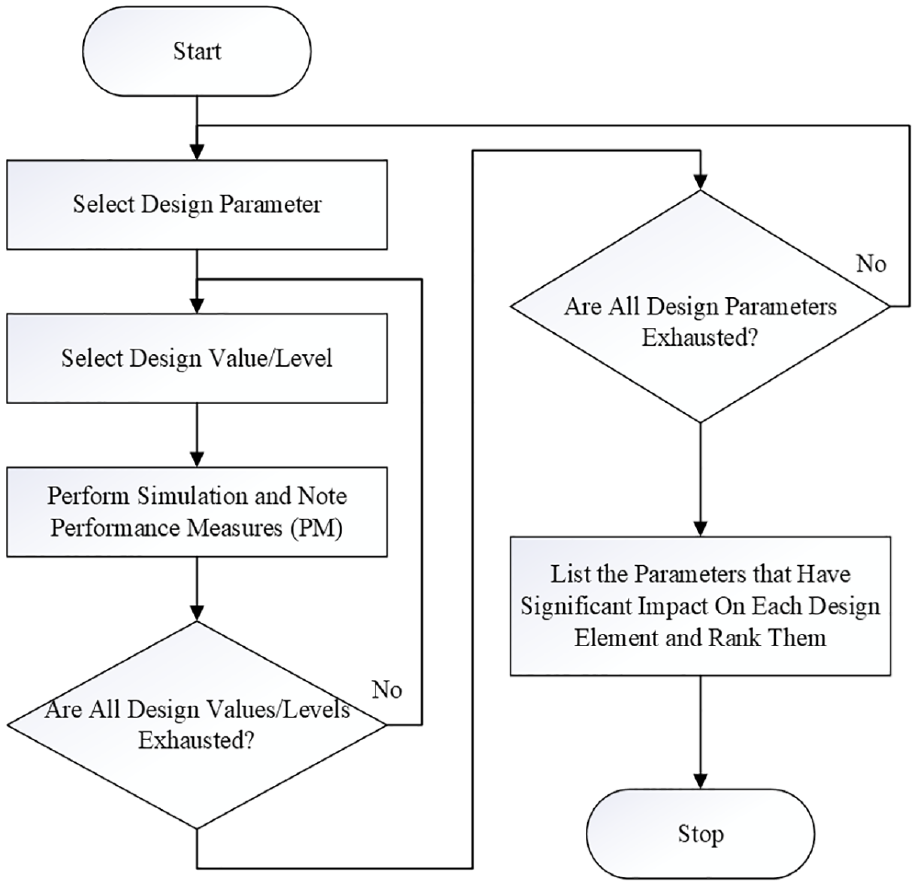
Selecting design parameters for experimental design.
In this experiment design two variations are considered. First, we need to study the impact of design parameters (in Table 2) on the design element (AL length), followed by studying the traffic operation impact of variation of the design elements by itself while controlling for influencing design parameters.
For simplicity, we provide an example of a real-world site with an AL length of 600 ft. As depicted in the flowchart process (Figure 2), first the three most influential design parameters for a design element were selected. This initially involves keeping the design element level, the same as in the base case (AL length of 600 ft) but varying all the nine design parameters at three levels (see Table 2). For instance, after performing the simulation analysis, the frontage road traffic, ramp traffic, and driveway density were the top three design parameters that affected the AL merge length.
Next, the sensitivity analysis needs to be performed on a given design element by varying the levels of design element and the top three design parameters. The variation is in the design element AL lane length that would be shortened to 250 ft in the “low” design element scenarios and extended to 750 or 1,250 ft in the “medium” and “high” scenarios. A more detailed sensitivity analysis needs to be conducted to study the impact of design element variations. This detailed analysis was separately performed for each design parameter level of the three most significant design parameters: frontage road traffic (three levels), ramp traffic (three levels), and driveway density (three levels).
Three AL merge lengths were identified (250 ft, 750 ft, 1,250 ft) and there were three levels for each of the three design parameters—in other words, the full factorial analysis required 81 (
Total Number of Simulation Models and Runs for Developing Guidelines
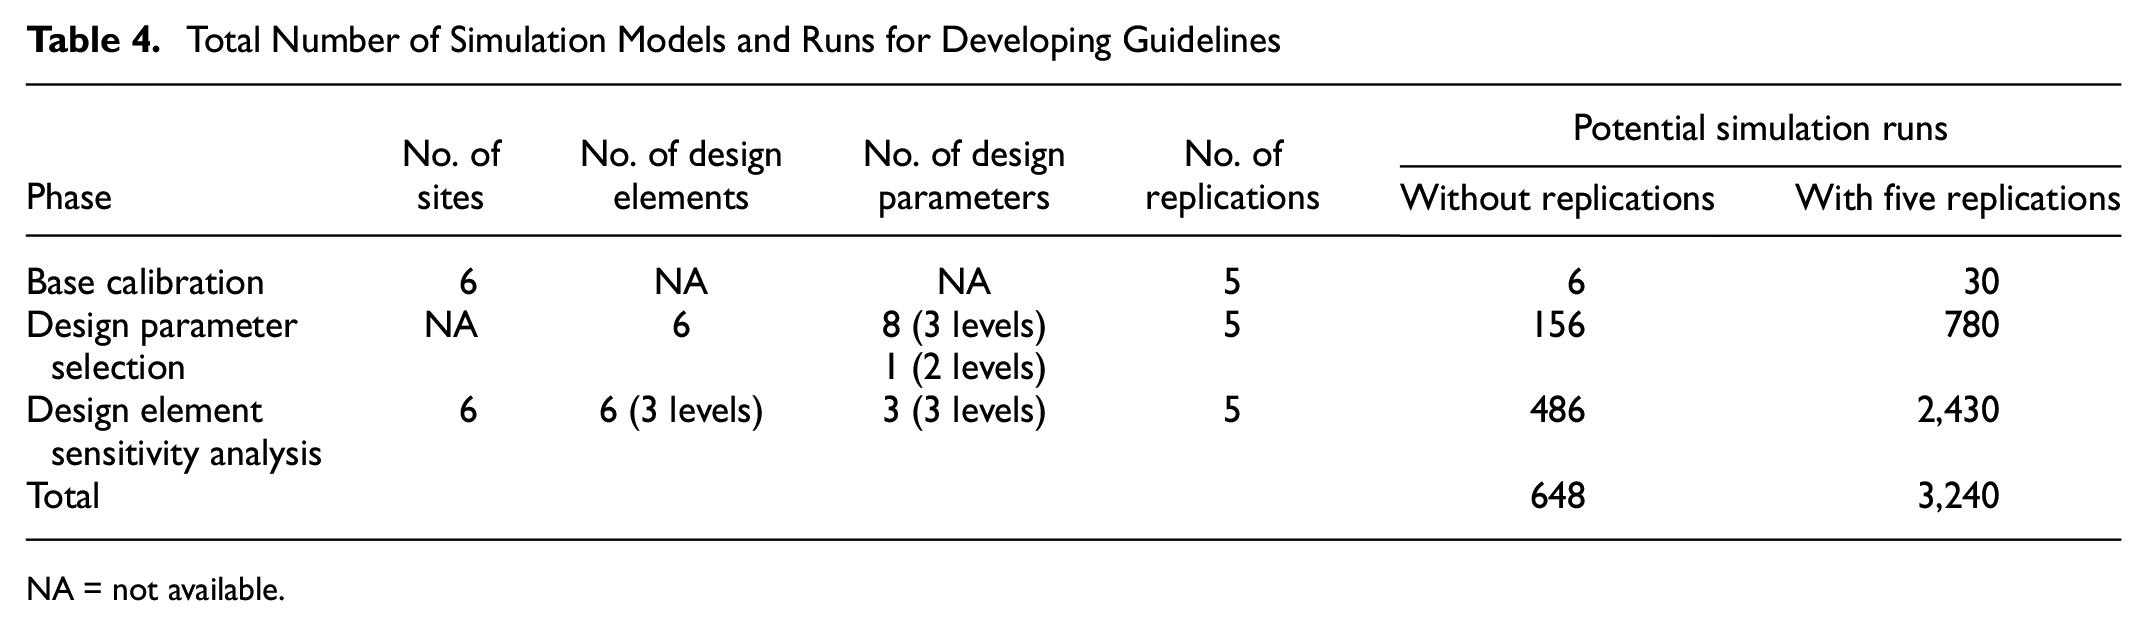
NA = not available.
Analysis
This section contains results from the intermediate steps of model calibration and design parameter selection.
Calibration
Figure 3 shows the calibration targets for the exit ramp-to-intersection spacing element. Figure 3a shows that the simulation results for volume fall within the two-sigma band of the field data. For instance, the average field traffic volume for EB frontage road is 445 vph, and the average of simulated traffic volume is 481 vph, which is between the two-sigma bands of 375 vph and 515 vph. Similarly, Figure 3b shows that the calibration of two more performance measures—average queue (in the number of vehicles) and the time to make two lane changes from lane 3 to lane 1 of the frontage road (in seconds)—fall within the recommended two-sigma band.
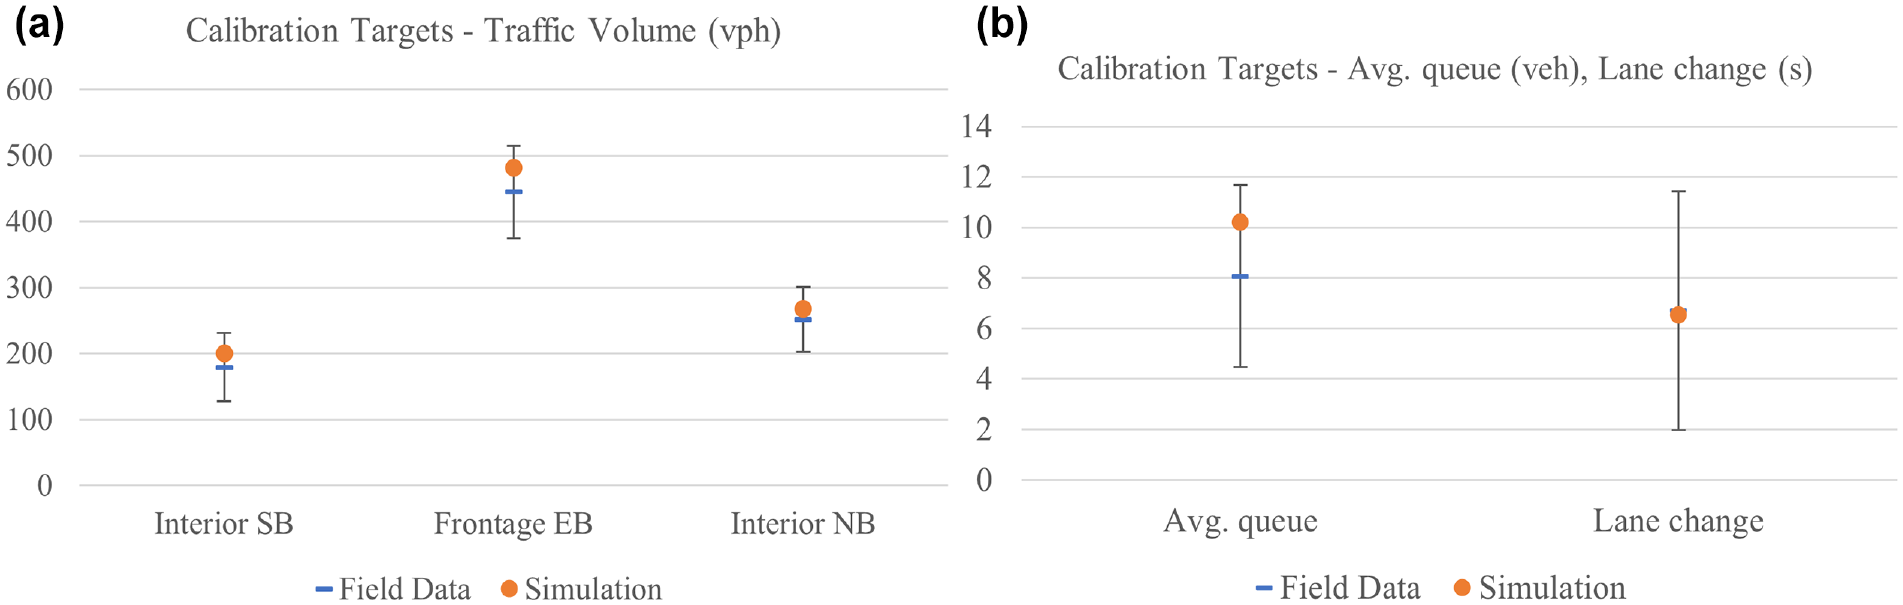
Calibration target and results at a study site: (a) volume calibration within 2 sigma band; and (b) average queue and lane change within 2 sigma band.
Design Parameter Selection
The design parameter selection process started from the calibrated base model. Each design parameter level was evaluated in a different scenario to isolate its impact, resulting in up to 26 alternative scenarios for each study site. In some study sites, a design parameter level matched the base model, in which case it was not simulated again.
After performing all the simulations and obtaining various performance measures (see Figure 2), the next step was to select the top three impactful design parameters. However, the performance measures obtained from the simulations were different either in magnitude or units, making it difficult to rank the performance of various design parameters. The research team developed a method to normalize performance measures using two steps; the first step was to divide the performance measures by the base case value, and the second was to develop an equal-weighted index of all selected performance measures for that site.
The equal-weighted index was created for all the design parameters, and the results were compared as shown in Figure 4. The next step was to select the top three design parameters that had the highest impact on the composite performance index. In most cases, it was easy to distinguish the top three design parameters; as in Figure 4, this design element’s top three design parameters were frontage road volume, truck composition, and the number of lanes. However, if there was a tie between two design parameters, engineering judgment was used to decide the most impactful and easily implementable design parameter among these design parameters.
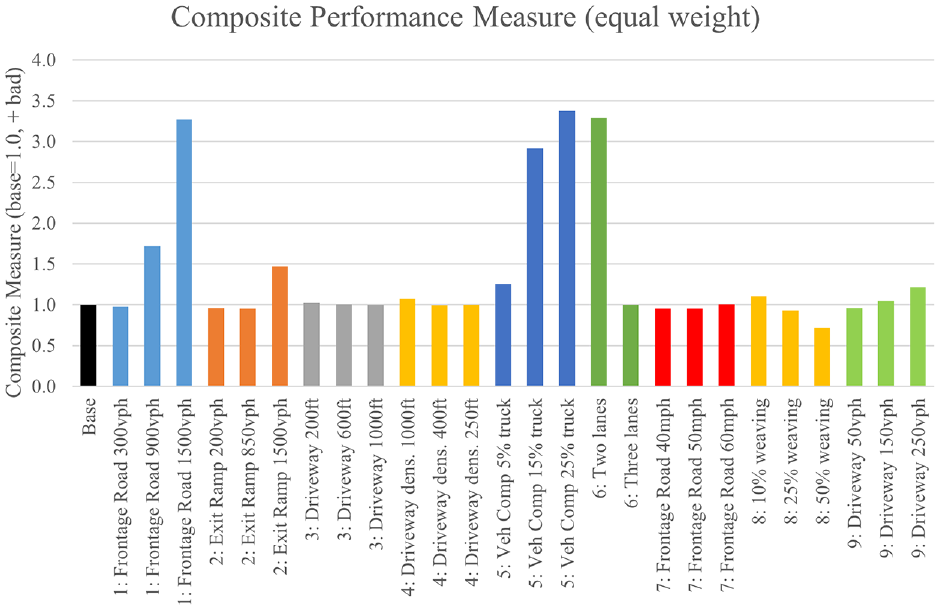
Comparison of composite measure to select the top three design parameters.
Table 5 shows the selected top three design parameters for each design element. After selecting the top three design parameters, the next step was to perform the sensitivity analysis on the chosen design elements by various combinations of these design parameters and their levels.
Top Three Design Parameters Influencing Each Design Element
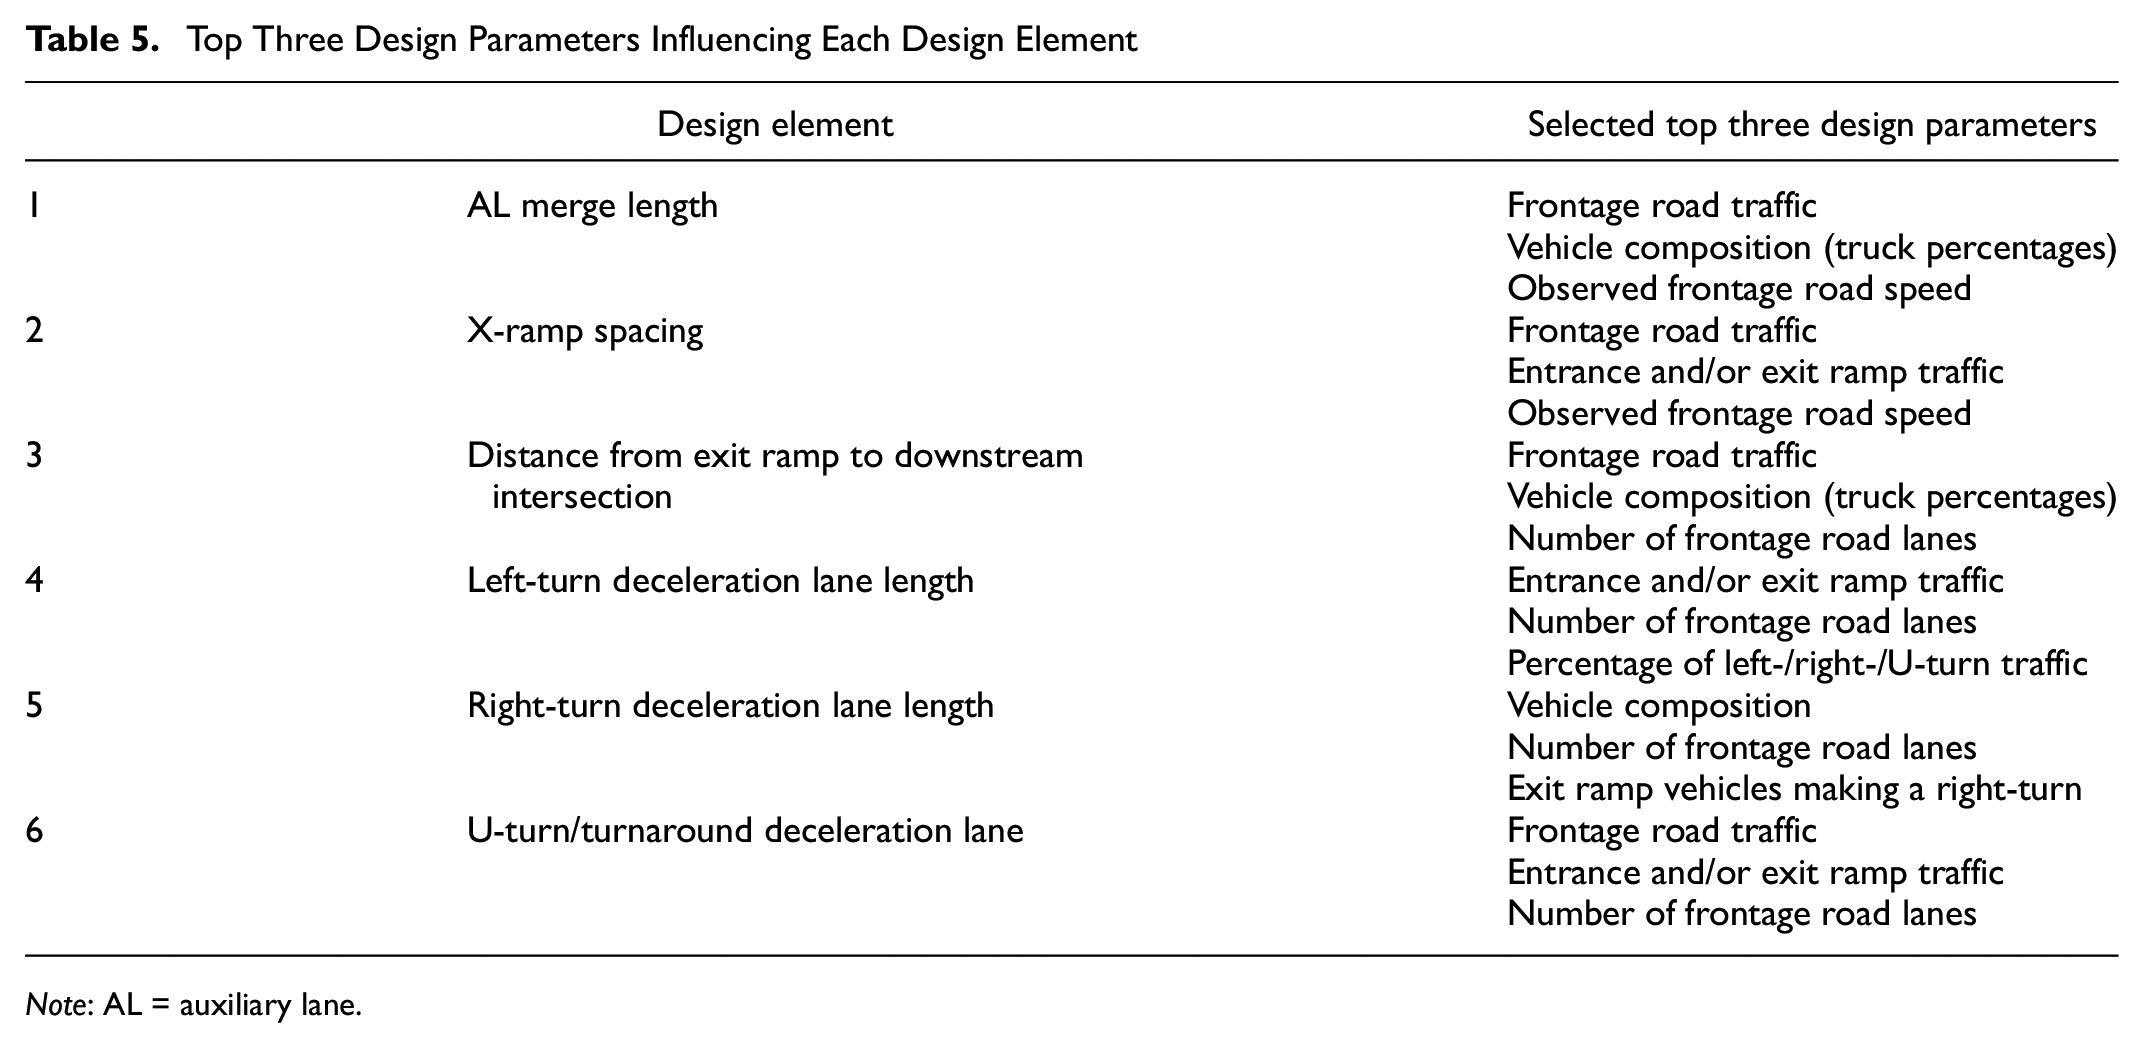
Note: AL = auxiliary lane.
Results
This section presents the results from the final stage of the analysis, design element evaluation. Many scenario combinations were obtained between various design elements and design parameters (and their levels) when the full matrix of analyzed scenario characteristics was considered for each design element. Since each design element has, on average, three levels and three different design parameters were analyzed at three levels, exhaustive exploration of modeling results would require producing graphs in four dimensions. As the purpose of the complete simulation analysis exercise was to generate design guidance, researchers adopted a simplifying approach to present the results for each design element. For two design elements (AL merge length and X-ramp spacing), results are organized by the frontage road operating speed and presenting the findings for the speed outputs which most meaningfully demonstrate the relationship between performance and the design parameters selected for each design element.
The results were simplified for the remaining four AL design elements by identifying a combination of the applicable design parameter levels typically associated with urban, suburban, and rural operating conditions. Given space limitations, all the tables and graphs for these four elements could not be included. However, a brief discussion is provided about the results and findings.
AL Merge Length
The HCM provides direct guidance for analyzing and gauging performance for uninterrupted flow along collector-distributor facilities such as frontage roads. AL merge length analysis involved 81 combinations of experimental variables, including the three levels of influential design parameters and three levels of AL merge length (250, 750, and 1250 ft). A traffic density of 36 passenger cars per mile per lane (pcpmpl) indicates conditions approaching congestion, while 40 pcpmpl indicates congestion or demands which exceed capacity ( 5 ).
The merge analysis results in Figure 5 reveal a consistent trend with the HCM as decreased performance (larger speed differentials) are observed when the traffic density in the merge section approaches and exceeds 36 pcpmpl. Densities are observed to increase with traffic volume and truck percentage, while speeds are observed to decrease as either volume or truck percentage increases. The shortest merge length (250 ft) is highly sensitive to variations in volume and truck percentage, and this length for an exit ramp-to-frontage road merge would only be appropriate for very low-volume rural areas where little to no long-term growth is expected.
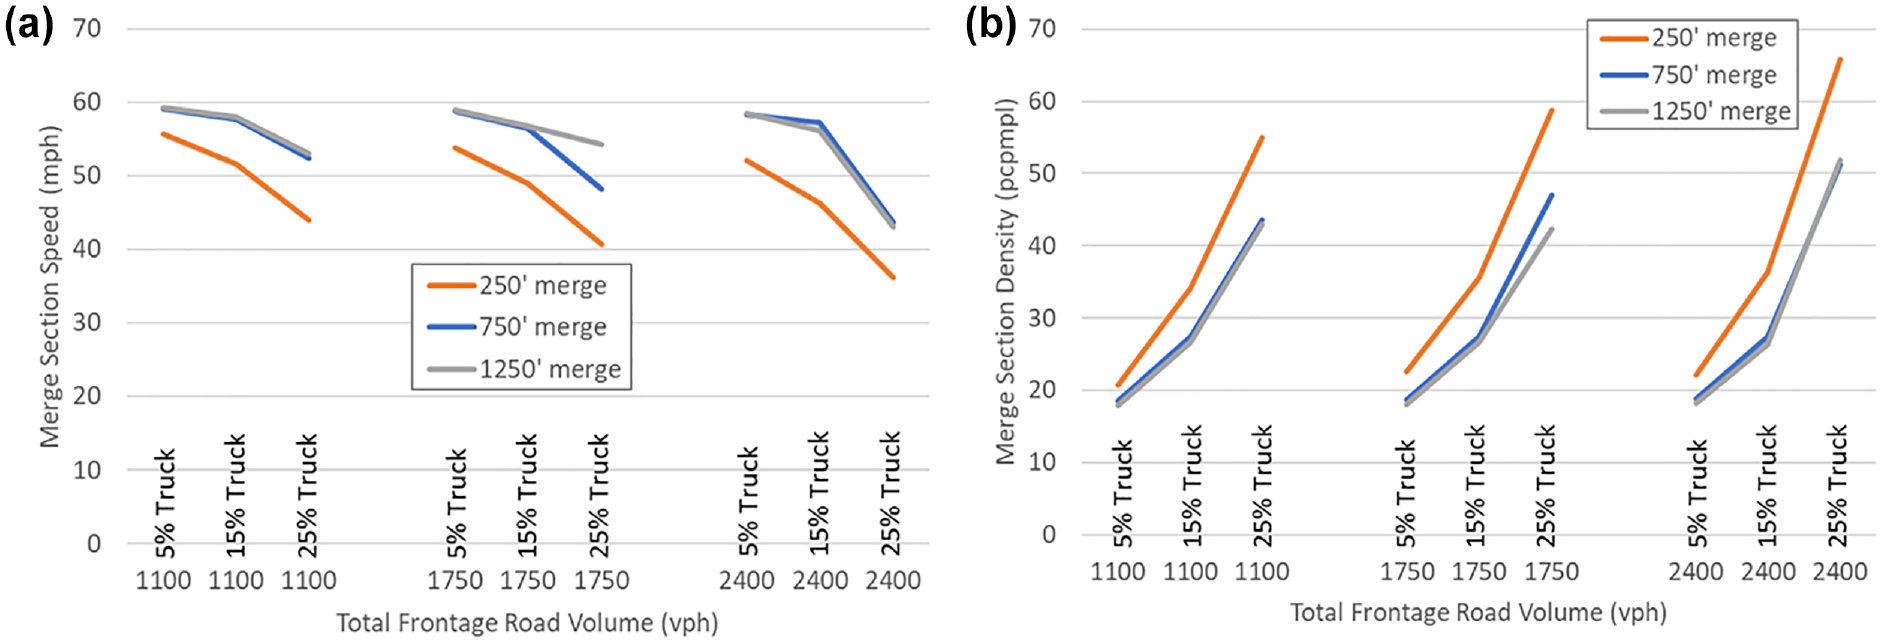
Frontage road speed and density for merge length analysis: (a) merge section speed; and (b) merge section density.
Findings
The study findings indicate that the minimum length of a frontage road merging ALs should be 550 ft, not including the taper. Merge lengths in the 750-ft range are adequate for most urban and suburban conditions, including conditions where frontage volumes exceed 1,000 vehicles per hour per lane, but a longer length will provide more flexibility when either total frontage road volume or the percentage of trucks is very high.
Relationship Between Design Parameters and Traffic Operations
Linear regressions were performed to estimate the influence of each design parameter on traffic density and average speed. Table 6 shows the estimation results for traffic density, while Table 7 shows the results for average speed. AL merge length, frontage road volume, and posted speed are found to influence average density, with the expected signs significantly. Similarly, AL merge length, frontage road volume, high truck percentage, and posted speed is found to have a significant influence on speed.
Linear Regression of Average Density to AL Merge Length and Design Parameters
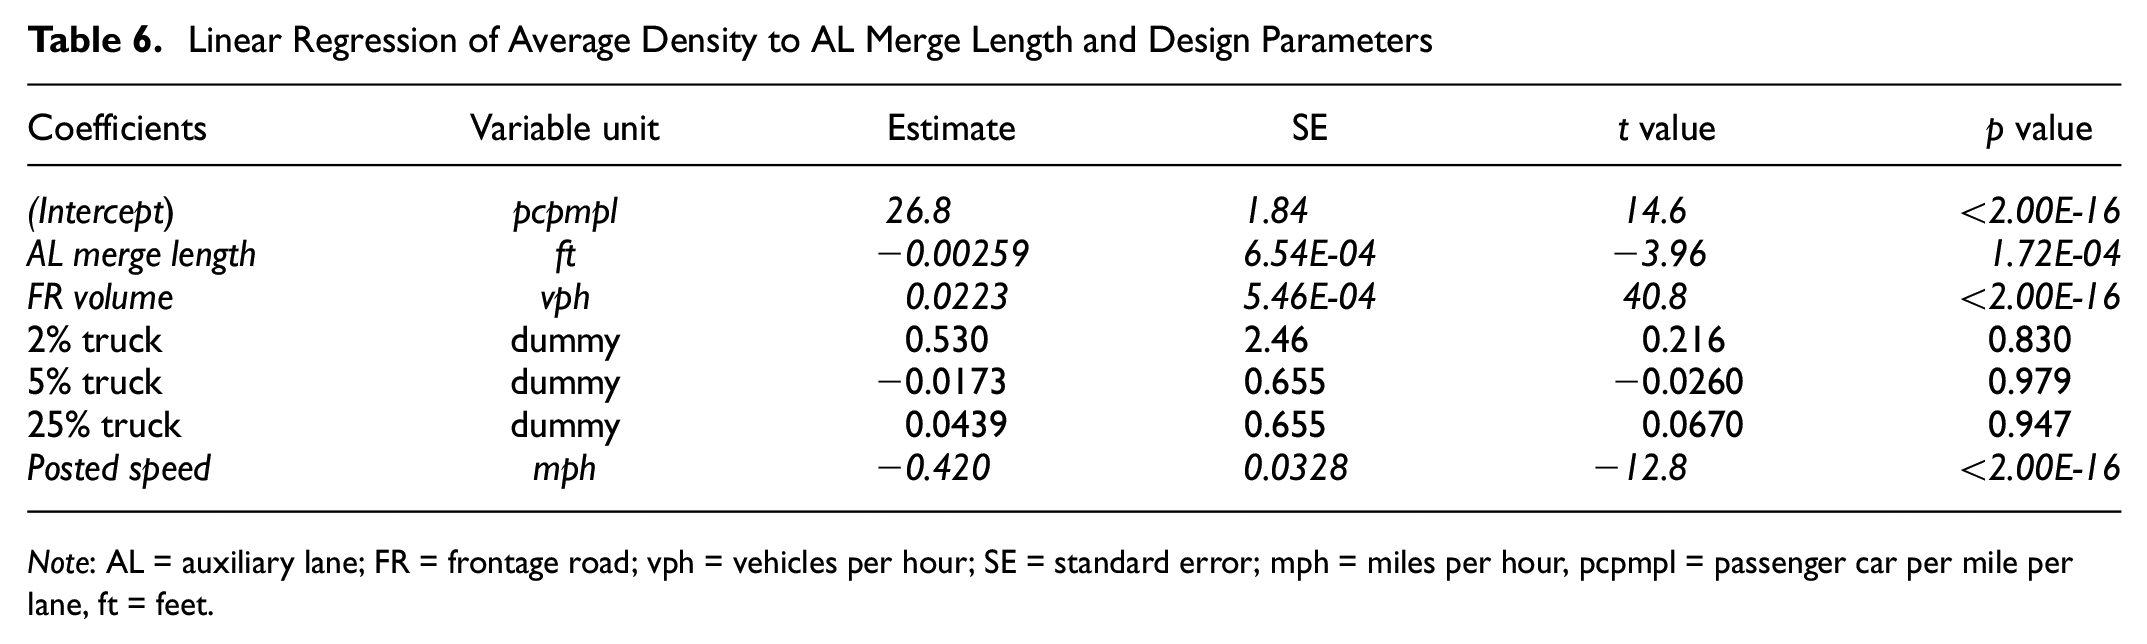
Note: AL = auxiliary lane; FR = frontage road; vph = vehicles per hour; SE = standard error; mph = miles per hour, pcpmpl = passenger car per mile per lane, ft = feet.
Linear Regression of Average Speed to AL Merge Length and Design Parameters
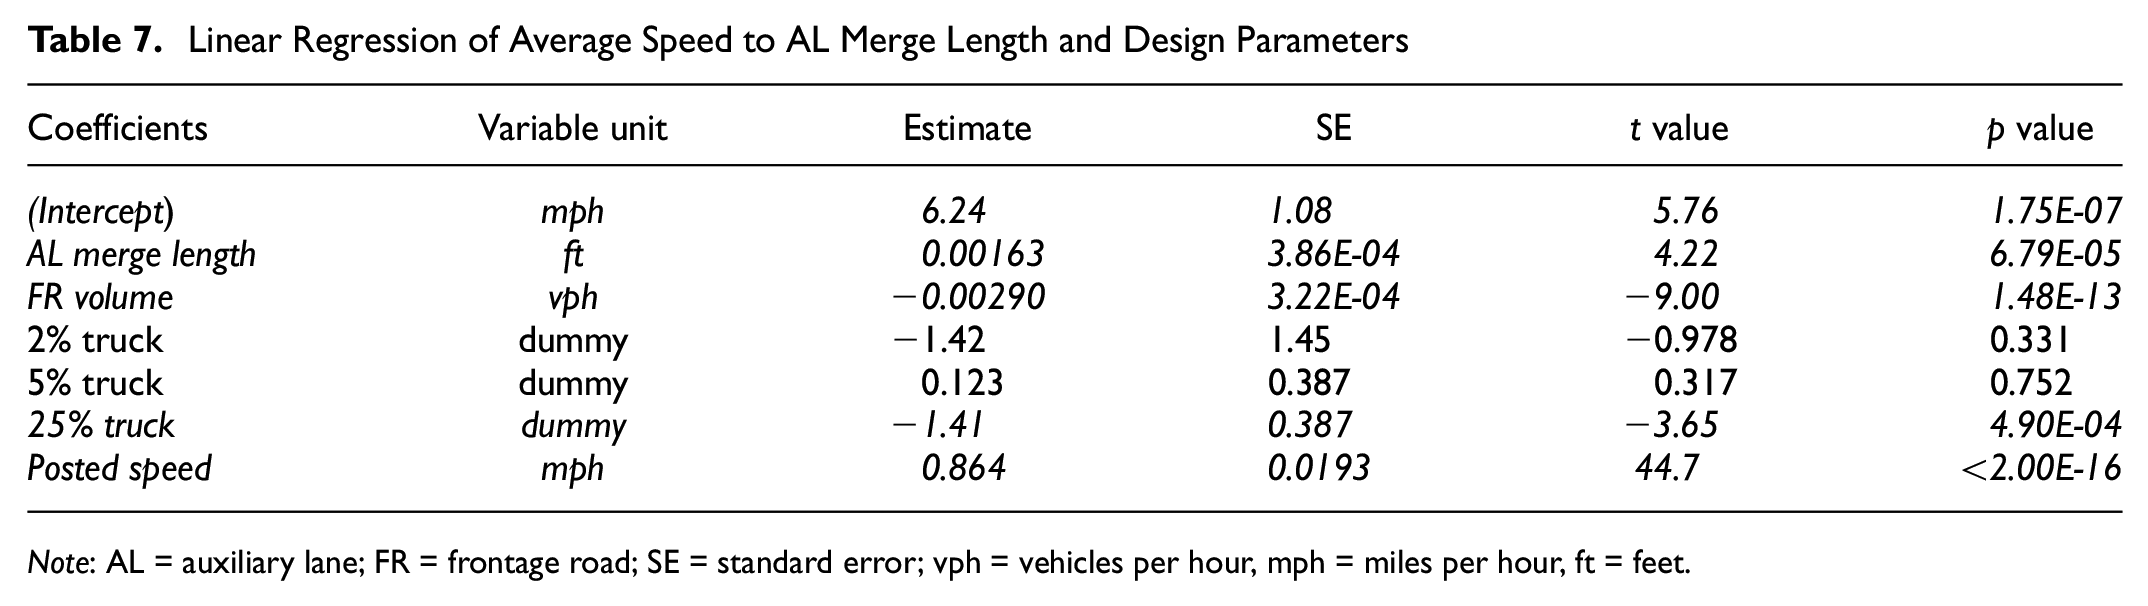
Note: AL = auxiliary lane; FR = frontage road; SE = standard error; vph = vehicles per hour, mph = miles per hour, ft = feet.
X-Ramp Spacing
Since the study segment of frontage road effectively acts as an uninterrupted flow facility, analysts measured traffic flow performance with speed and density. In analyzing the frontage road weaving section in an X-ramp design between an upstream freeway exit ramp and a downstream freeway entrance ramp, researchers applied variations on frontage road volume, ramp volume, and frontage road speed to a base model. Applying three levels of the top three design parameters for each of three X-ramp weaving distances (1,000, 2500, and 4000 ft) produced 81 modeled and analyzed parameters.
Model speed and density results for the observed speed of 60 mph on the frontage road are presented in Figure 6. Results are grouped in sets of three, organized by frontage road volume. The speed and density are presented with total frontage road volume (frontage road volume plus ramp volume) on the X-axis and either speed or density on the Y-axis. As previously noted, a density of approximately 36 pcpmpl indicates conditions for collector-distributor roads (like frontage roads) approaching congestion, while 40 pcpmpl indicate congestion or demand which exceeds capacity ( 5 ). The density results indicate that these values are met for the short, 1000-ft weaving section at frontage demand levels as low as 1,750 vph. However, the 4000-ft weaving section did not exceed capacity at any of the analyzed frontage road volume levels (up to 3,000 vph). The speed results also show these same trends, which suggest that X-ramp weaving lengths of less than 2,500 ft would only be appropriate for low-volume corridors where little or no long-term growth is anticipated. In growth areas such as suburban and urban areas, the results suggest a minimum X-ramp weaving length of no less than 3,000 ft and a 4000-ft total weaving length.
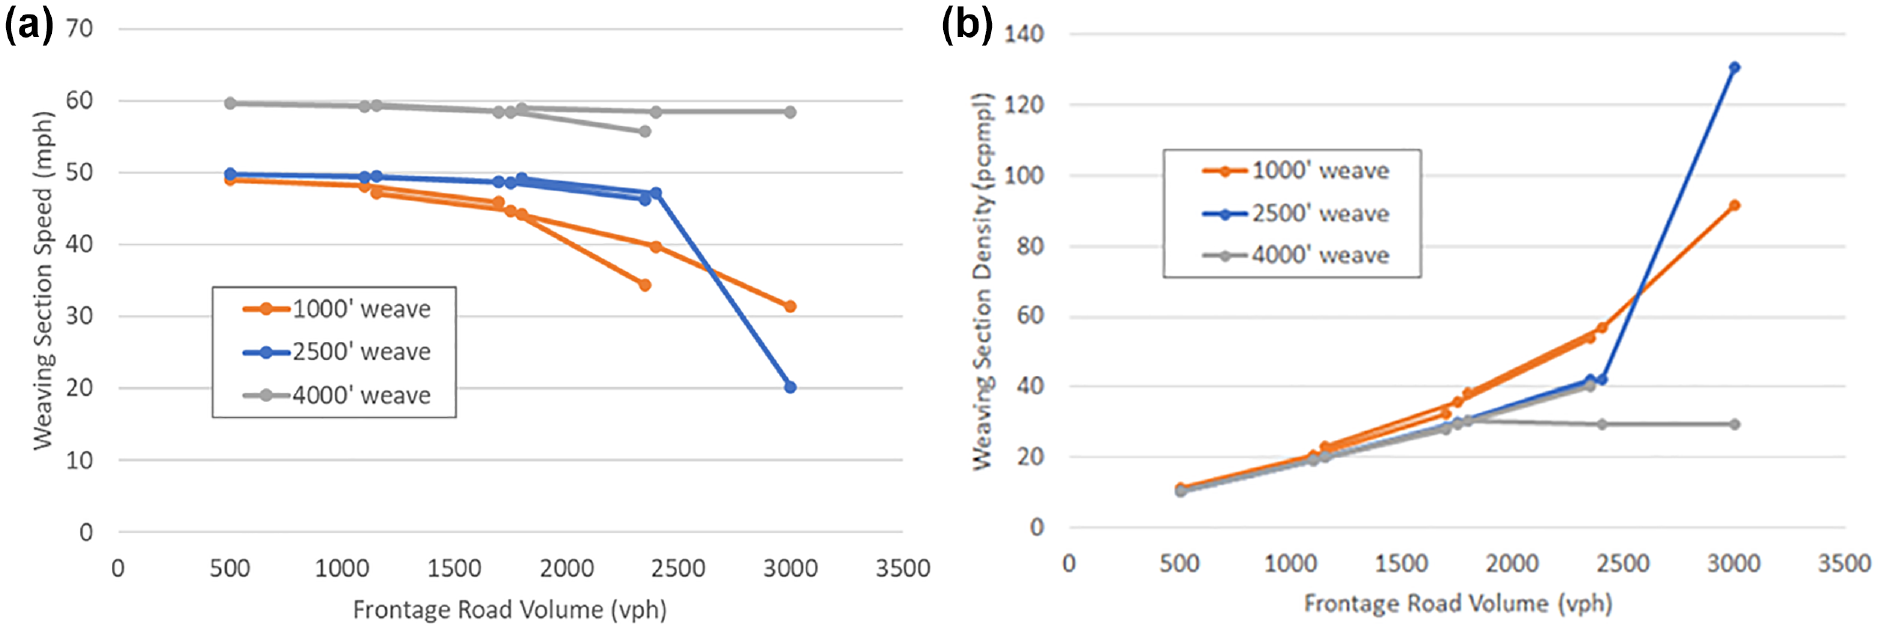
Frontage weaving section speed and density for X-ramp spacing analysis: (a) weaving section speed; and (b) weaving section density.
Findings
The analysis suggests that the current frontage road minimum weaving section length of 1,000 ft established by the Green Book is applicable only in rural and less-developed urban areas without significant current or future frontage road development. In urban and urbanized areas with growth, the frontage road minimum weaving section length should be 1,500 ft, with a preferred length of 2,000 ft. Longer weaving lengths are supported by the operations analysis but are likely impractical from a design perspective; they could only be accommodated at very wide interchange spacings (greater than 2 mi).
Relationship Between Design Parameters and Traffic Operations
A linear regression was performed to estimate the influence of X-ramp spacing and design parameters on average density. The estimation results in Table 8 show that X-ramp spacing, frontage road volume, and posted speed are found to impact average density significantly. All coefficients have the expected signs.
Linear Regression of Average Density to X-Ramp Spacing and Design Parameters
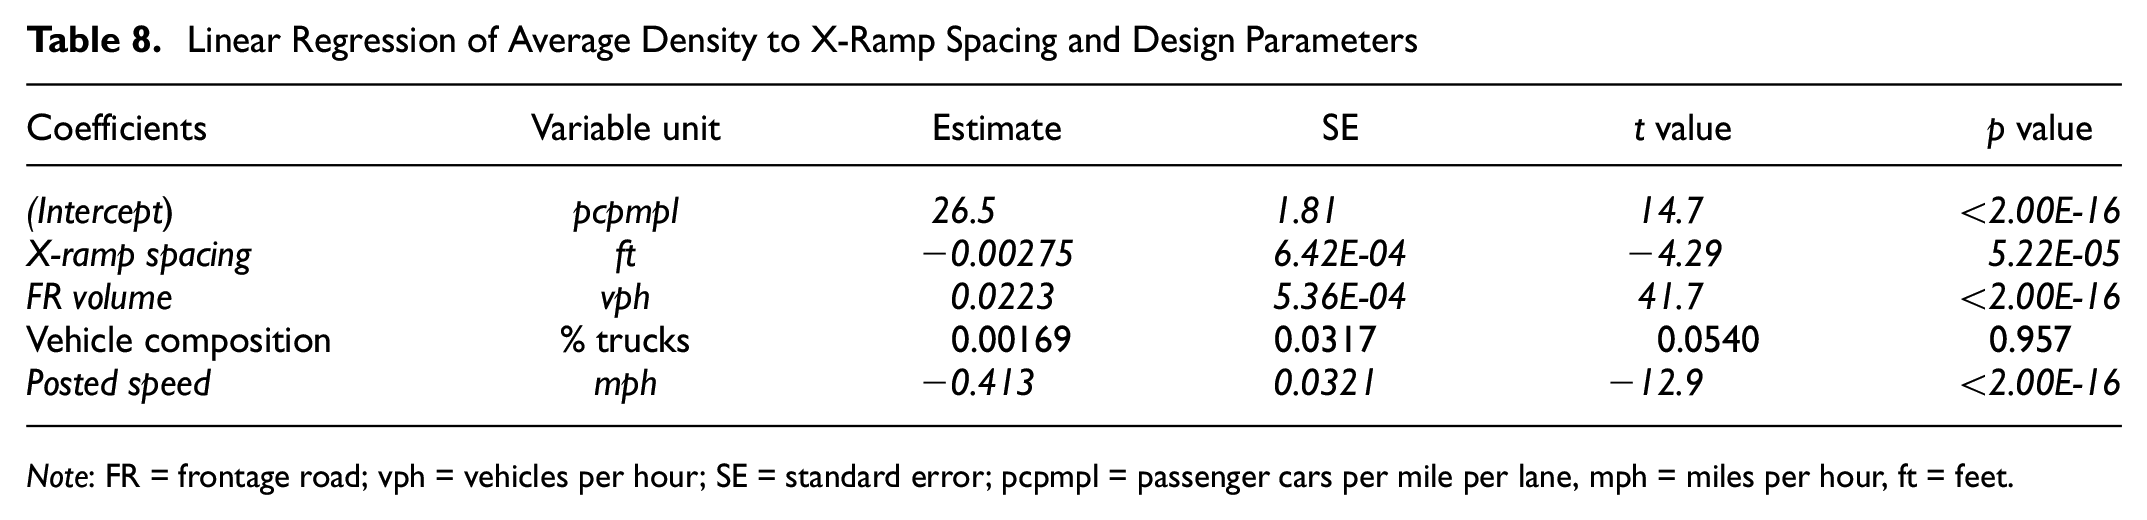
Note: FR = frontage road; vph = vehicles per hour; SE = standard error; pcpmpl = passenger cars per mile per lane, mph = miles per hour, ft = feet.
Distance from Exit Ramp to Downstream Intersection
In investigating the optimal weaving distance between an exit ramp and a downstream signalized interchange, researchers used the calibrated simulation model with the top three design parameter variations (see Table 5). The performance measures used in the evaluation included the frontage road queue length at the signalized interchange (timings optimized to each volume/geometry combination), the travel time for frontage road vehicles to weave into the left lane (for that percentage of frontage traffic turning left at the interchange), and the travel time for exit ramp vehicles to successfully navigate the frontage road traffic stream to reach the right-turn bay.
Queue length analysis shows the necessary queue storage space along the frontage road to accommodate a design queue for the urban, suburban, and rural design cases. 15% truck composition results in queue length of 648–794 ft in urban areas, 353–390 ft in suburban areas, and 123–127 ft in rural areas. The 5% and 25% truck composition results also provide a sense of the extent that queue length can vary for different traffic stream compositions under varying ramp-to-interchange spacing conditions. A truck composition of 5% leads to 200–218 ft in urban, 229–239 ft in suburban, and 115–122 ft in rural areas, while the 25% trucks leads to 869–936 ft in urban, 590–650 ft in suburban, and 187–202 ft in rural areas.
Analysis of weaving and merging for frontage road vehicles to reach and begin executing their left-turn maneuver shows the impact of design parameter levels on system performance. Urban operations demonstrate the highest travel times to accommodate left-turning vehicles (from the frontage road-ramp junction to the interchange stop bar), and congestion is mitigated at lower truck percentages as the interchange spacing increases from 1,000 to 1,500 ft (see Figure 7).
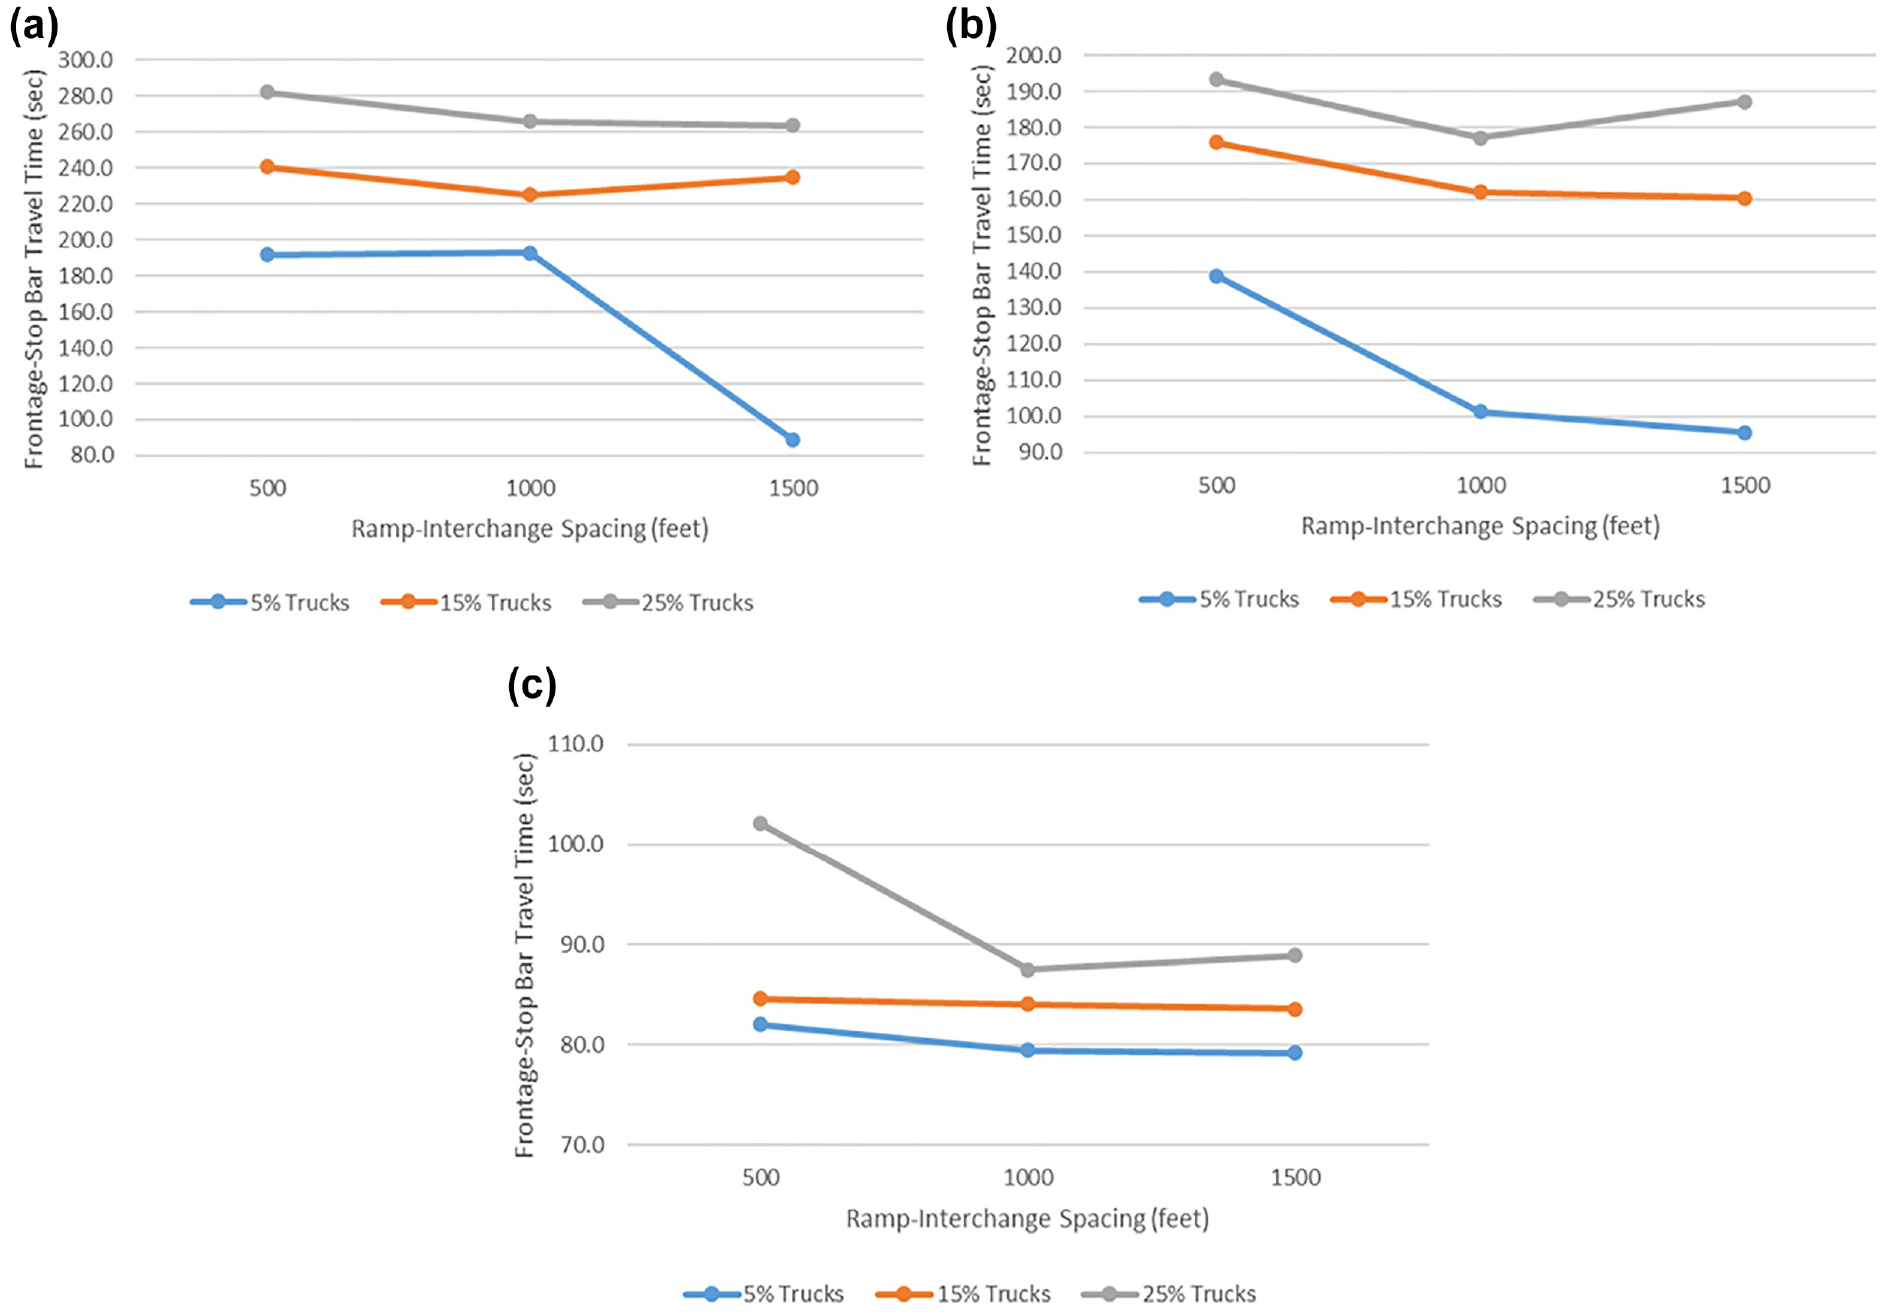
Frontage to left-turn travel time for ramp-to-interchange weaving analysis: (a) urban frontage-left turn transition; (b) suburban frontage-left turn transition; and (c) rural frontage-left turn transition.
For suburban design conditions, travel times are mitigated at 5% trucks when a weaving length of at least 1,000 ft is provided. For the design case of 15% trucks, a minimum weaving length of between 1,500 and 2000 ft is identified by the modeling results. In the lowest demand level for rural conditions, weaving maneuvers for 15% truck composition can be accommodated with just 500 ft between the ramp and interchange.
However, with updated Texas DOT Roadway Design Manual (RDM) ( 4 ) left-turn bay lengths of at least 605 ft (505 ft deceleration length plus 100 ft minimum storage length) for 55 mph roadways typical of rural frontage roads, the actual design length for accommodating frontage road weaving followed by access to the turn lane would need to be at least 1,105 ft (605 ft for the left-turn lane plus the 500 ft necessary for weaving suggested by results, see Figure 7).
The more demanding weaving maneuver for most diamond interchange ramp configurations is the transition from the exit ramp to the right-turn lane of the signalized interchange; all vehicles making this maneuver must execute the greatest number of lane changes through/across the frontage road traffic stream. The urban area results show the conflicting/competing impacts of congestion (which increases travel time) and increased ramp-to-interchange spacing (which decreases travel time). For 5% trucks, 1,500 ft weaving distance between the ramp and interchange was adequate. For 15% trucks the results suggest that weaving length would not offset congestion until 2,000 to 2,500 ft of weave length is provided.
The suburban design case shows the beginning of congestion being offset by weaving distance as the weaving length increases from 1,000 to 1,500 ft. The trend suggests that 2,000 ft of weaving distance would offset congestion concerns and provide adequate weaving length. For the lower-demand rural design condition, 500 ft of weaving length is adequate to accommodate 15 % of trucks.
However, as with the left-turn related weaving analysis, there is the issue of the weaving length essentially occurring before the right-turn bay itself, which would have a length of 535 ft since its length is calculated using the same procedures in the Texas DOT RDM ( 4 ) as those applied for calculating left-turn bay length, but with a minimum storage length of 30 ft instead of 100 ft.
Findings
The minimum recommended spacing between the exit ramp frontage road gore and the downstream intersection is 1,750 ft in urban environments and 925 ft in rural areas. The study confirmed that rural operations improved and stabilized as ramp-to-intersection spacing increased from 500 to 1,000 ft. Also, 1,500 ft of ramp-to-intersection spacing was found to be necessary to minimize urban frontage road travel times/delay.
Left-Turn Deceleration Lane Length
From the design parameter evaluation of frontage road left-turn lengths at signalized diamond interchanges, queue length results show a 25% weaving level represents the recommended design condition, but 10% and 50% weaving results were also studied to provide a sense of the extent queue length can vary for different traffic stream conditions. 25% weaving leads to 1000–1,150 ft of queue in urban areas, 677–800 ft queue in suburban areas, and 120–124 ft in rural areas.
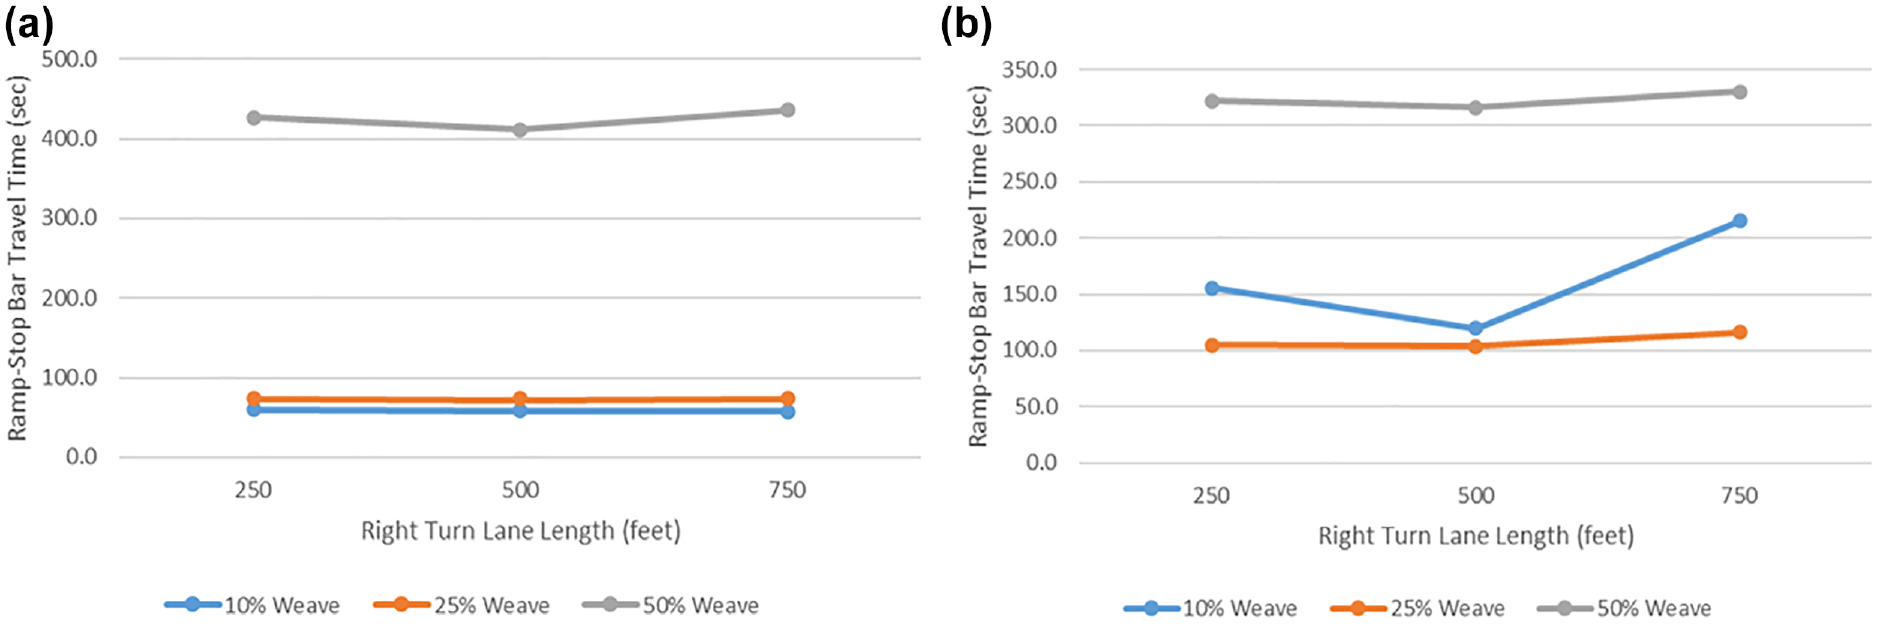
Urban operations demonstrate the highest travel times (from the frontage road-ramp junction to the interchange stop bar) to accommodate left-turning vehicles, and congestion is mitigated at lower weaving percentages as the length of the left-turn lane increases from 250 to 750 ft (see Figure 8). For the 1250-ft left-turn lane, the model showed a combination of two congestion-inducing issues: some through vehicles temporarily used the lane to pass slower traffic and then tried to merge back into the through lane close to the interchange, and for high-demand cases the longer turn lane length provided room to store a longer queue (that required time to dissipate). For the 25% weaving traffic design case guiding the interpretation of the results, a left-turn lane length of 750 ft is suggested.
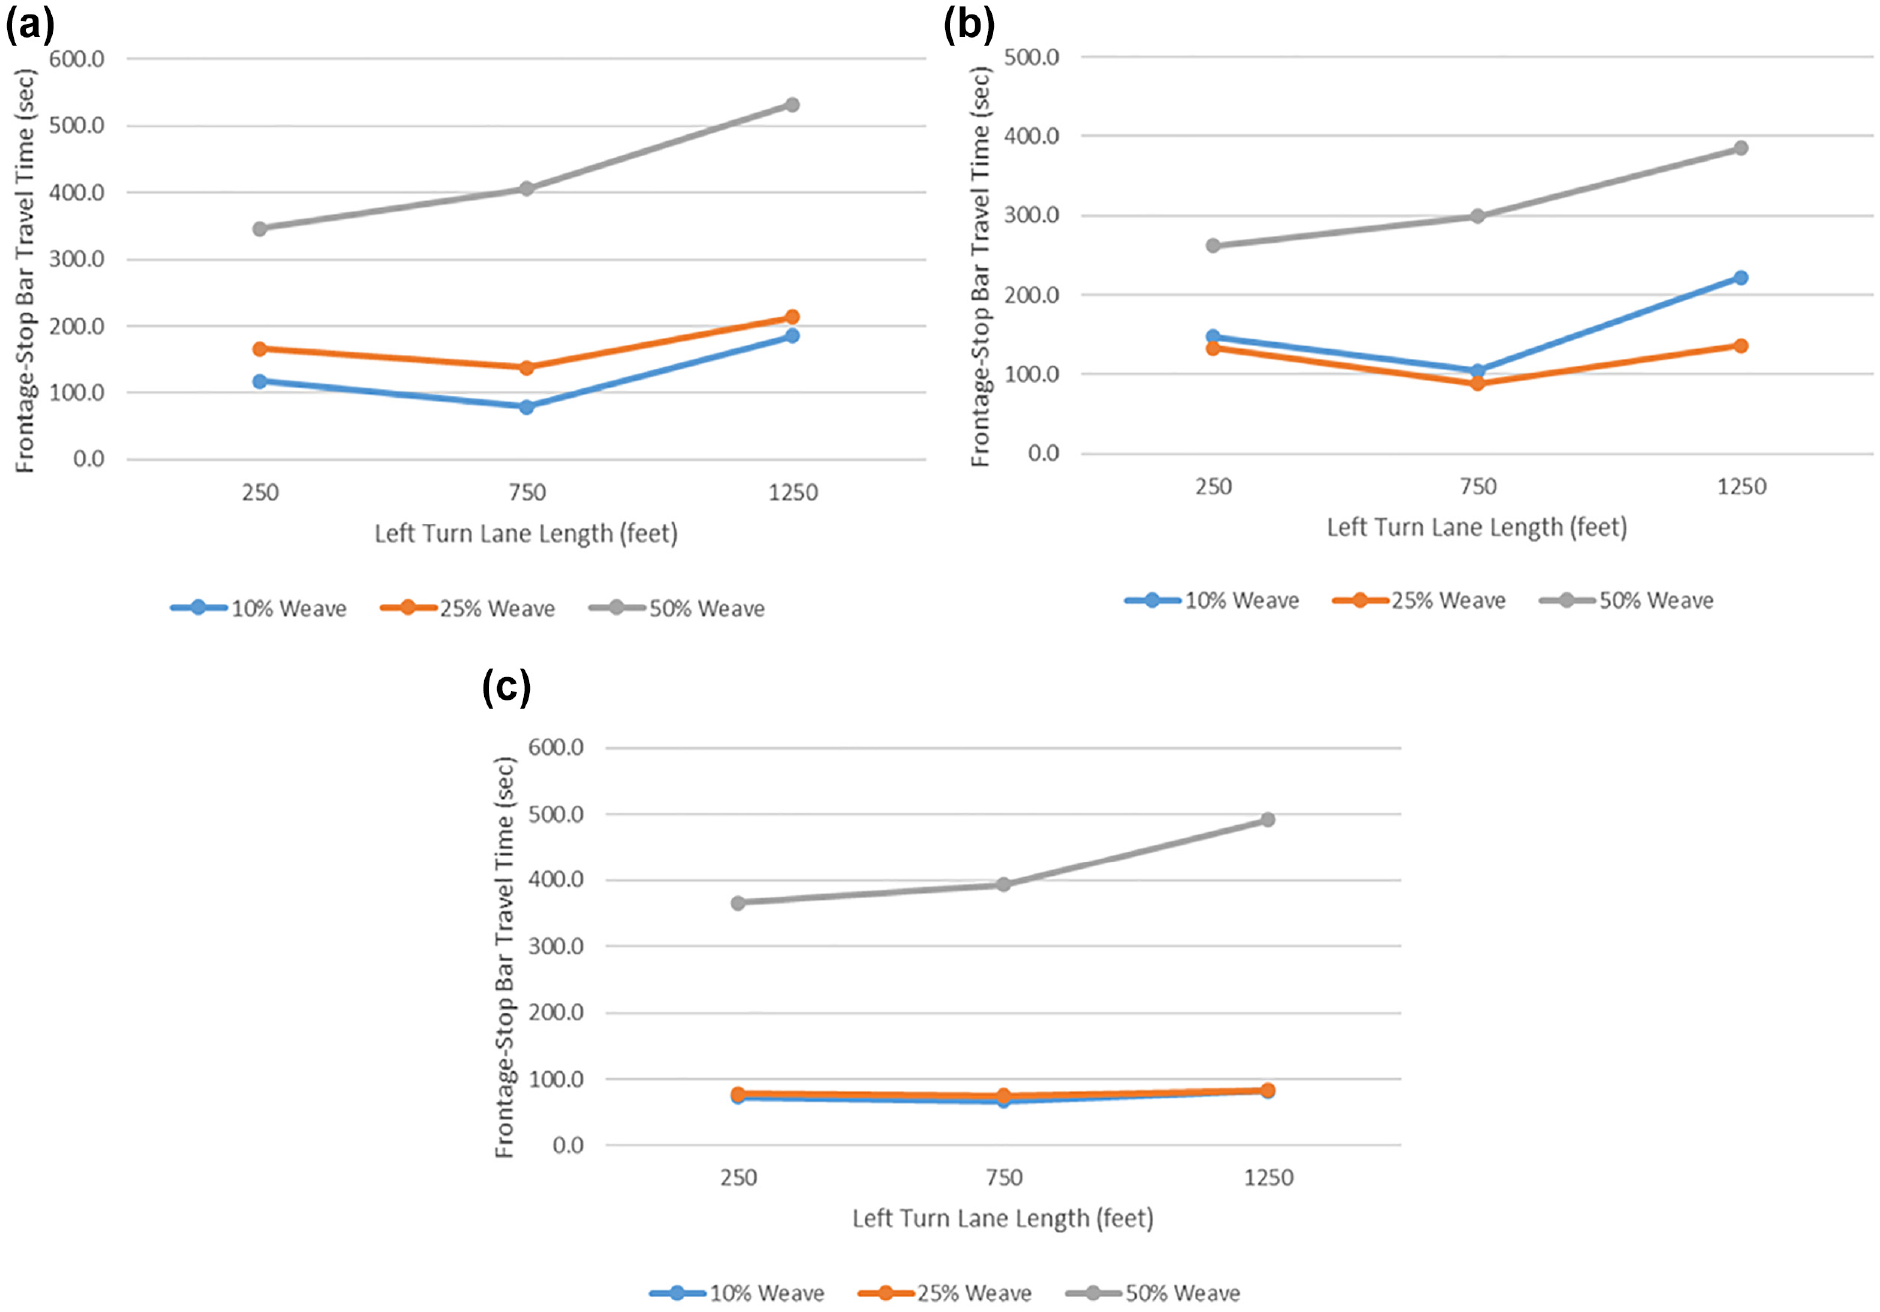
Frontage to left-turn travel time for left-turn lane length analysis: (a) urban frontage–left turn transition; (b) suburban frontage–left turn transition; and (c) rural frontage–left turn transition.
Suburban design condition travel times were affected by the same issues as those observed in the urban design condition models. A 250-ft turn lane was too short to accommodate storage and maneuvering, while a 1250-ft turn lane was improperly used by vehicles or stored a long queue that required long dissipation times (or was difficult to merge into from the adjacent through lane). Left-turn lane length of 750 ft resulted in minimal delay.
For the rural design condition, a 250-ft left-turn lane was adequate for the 25% weaving design case because of a minimal need for queue storage under low-demand conditions. However, note that overall turn lane length must consider deceleration needs and queue storage, and the Texas DOT RDM ( 4 ) indicates a total left-turn bay length of 605 ft is necessary to accommodate the 55 mph frontage roads typically found in rural areas.
Results for this traffic stream diversion maneuver (from the left frontage lane to the left-turn lane) closely resemble the results for the frontage road weave across exit ramp traffic to reach the left-turn lane. For the travel time analysis from the exit ramp to the left-turn lane, issues with weaving are not fundamentally present as the ramp vehicles are already positioned on the left side of the frontage road. Rather, the results reveal the impact of queuing at the interchange and driver behavior between the ramp and interchange on turn lane efficiency and performance. Urban design case results show minimal delay for left-turn lane lengths around 750 ft, with higher delays for 250-ft (inadequate to avoid queuing-induced delays) and 1250-ft (improperly used by vehicles or experiencing long queues in high-demand situations) cases.
For suburban design conditions, travel times and frontage road operation issues were very similar to those in the urban design case and resulted in 750-ft left-turn lengths demonstrating minimal delay. The rural design condition showed that a 250-ft left-turn lane was adequate for the 25% weaving design case because storage needs are minimal (and traffic vehicle conflicts are minimized) when traffic demand is low.
Recall, though, that turn lane length must consider deceleration needs as well as queue storage, and the Texas DOT RDM ( 4 ) indicates a minimum left-turn bay length of 605 ft (505 ft deceleration plus 100 ft minimum storage length) is necessary to accommodate the 55 mph frontage roads typically found in rural areas.
Findings
For urban design the left-turn lane length developed using the Texas DOT RDM should be checked against the 700-ft value from this research; if the RDM-based left-turn length is less than 700 ft, the design length should be extended to at least 700 ft to ensure access to the left-turn lane is not blocked by a queue in the adjacent lane.
Right-Turn Deceleration Lane Length
Like the left-turn lane length analysis, researchers modeled a range of turn lane lengths to assess the impact length had on overall frontage road operations (see Figure 9). It was found that 250 ft is the adequate right-turn length for urban conditions and 500 ft was optimal for suburban and rural conditions. The Texas DOT RDM ( 4 ) indicates minimum total right-turn bay lengths of 535 (505 deceleration plus 30 ft storage; rural criteria) and 235 ft (205 deceleration plus 30 ft storage; urban criteria) are necessary to accommodate the 55 mph (rural) and 45 mph (urban) frontage roads typically found in rural and urban areas, respectively.
Frontage to right-turn travel time for right-turn lane length analysis: (a) urban frontage-right-turn transition; and (b) suburban and rural frontage-right-turn transition.
The travel time performance analysis for vehicles from the exit ramp to the right-turn lane shows urban design needs are accommodated with a right-turn length of just 250 ft, while suburban and rural cases show minimal travel time/delay with a 500-ft right-turn lane length. Placing these values in context, however, note again that the Texas DOT RDM ( 4 ) indicates minimum total right-turn bay lengths of 535 (505 deceleration plus 30 ft storage; rural criteria) and 235 ft (205 deceleration plus 30 ft storage; urban criteria) are required to accommodate the 55 mph (rural) and 45 mph (urban) frontage roads typically found in rural and urban areas, respectively.
Findings
In urban areas the 700-ft long check value should be compared against the Texas DOT RDM-derived right-turn lane length using traditional design procedures. If the urban right-turn lane length is less than 700 ft, extending the lane to at least 700 ft is recommended to lower the chance that access to the right-turn lane will be blocked by a queue in the adjacent lane.
U-Turn/Turnaround Deceleration Lane Length
Analysts modeled 300-, 650-, and 1000-ft long U-turn lanes to examine a range of U-turn lane lengths in the evaluation. For many of the U-turn models, especially those that combined the highest demand level for the frontage road or exit ramp with the moderate or high demand for the other demand, analysts recorded high delays and long queues. The frontage road to U-turn lane travel time results show that the least congested U-turn length under urban conditions was 650 ft. In the case of 1000-ft U-turn lanes, left-turn lane vehicles attempted to use the U-turn lane to circumvent the frontage road queue. However, when these vehicles attempted to merge back into the left-turn lane they blocked the U-turn lane and caused high U-turn travel times (Figure 10).
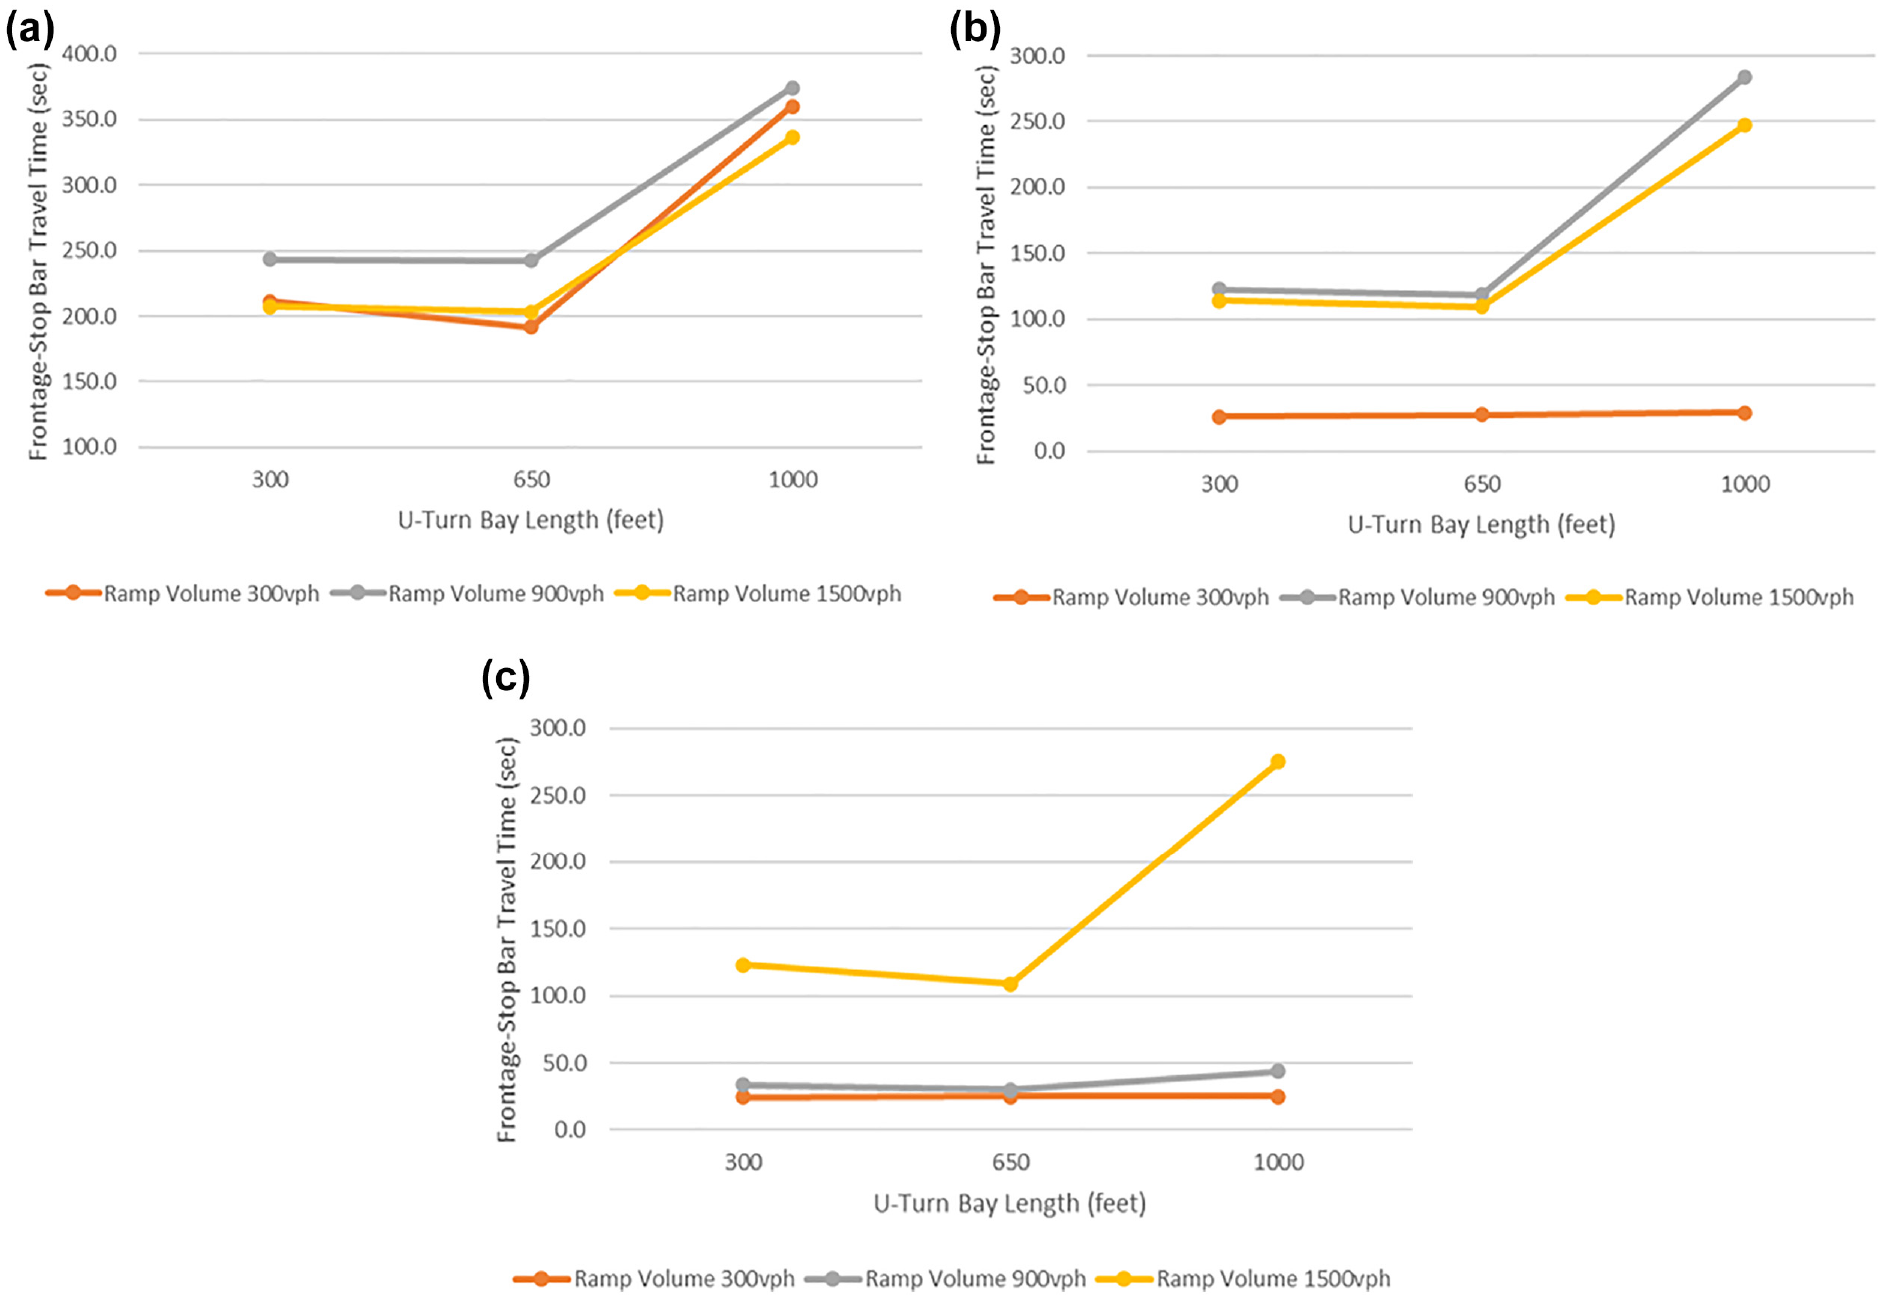
Frontage to U-turn travel time for U-turn lane length analysis: (a) urban frontage-U-turn transition; (b) suburban frontage-U-turn transition; and (c) rural frontage U-turn transition.
For suburban design conditions, travel times were affected by the same issues as those observed in the urban design condition models. A 650-ft U-turn lane results in the lowest average travel time in the model. For rural conditions, model delays were much lower (and generally uncongested) compared with the suburban and urban cases. 650-ft U-turn lane produced slightly lower travel time than the shorter, 300-ft U-turn length scenarios.
The updated Texas DOT RDM ( 4 ) suggests a minimum 525-ft U-turn/turnaround approach bay length with an added 150-ft taper, for a total length of 675 ft. This is consistent with the simulation analysis results and appears to also accommodate the speed reduction (to a 15- to 20-mph curve speed) necessary as the U-turn lane (somewhat sharply) curves to the left to circulate under or over the freeway before reaching the opposite-direction frontage road.
For exit ramp to U-turn lane travel time for all three design cases (urban, suburban, rural), the 650-ft U-turn lane provided the least travel time operations. Though no weaving is necessary for exit ramp vehicles—already on the left side of the frontage road—to reach the U-turn lane, these vehicles do have to diverge from the left frontage lane to enter/cross any left-turn lanes present before transitioning into the U-turn lane. If the U-turn lane is too short, it can be blocked by queued left-turning or through vehicles in the adjacent lane, but if it is too long, it may be used by left-turning vehicles wishing to try and circumvent part of the left-turn queue.
Findings
U-turn lanes in urban areas are recommended to be at least 700 ft long so that access to these lanes is not blocked by a long queue in the adjacent left- or left-plus-through lane at the intersection. Texas DOT RDM U-turn lane/bay length of at least 525 ft is reasonable for rural and suburban frontage roads. The study results suggest that the design guidance could be appended to indicate that the U-turn lane length resulting from the urban traffic analysis be at least 700 ft in length.
Summary of Findings
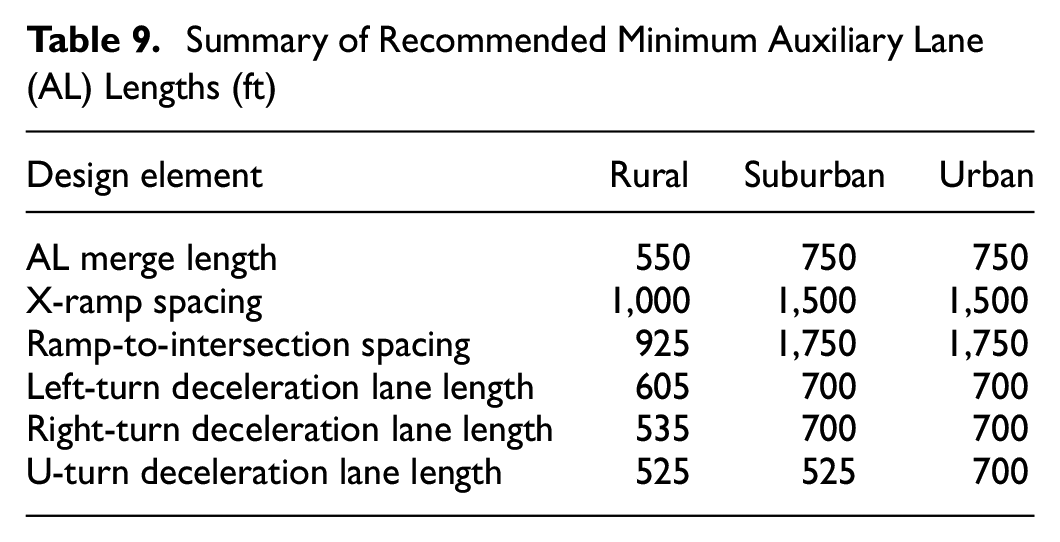
Table 9 summarizes the recommended minimum AL lengths for all six design elements included in this study. Unshaded cells represent minimum values derived from this research effort, while shaded cell contain values from the Texas DOT RDM ( 4 ). An implicit assumption in turn lane length calculations shown is that frontage road design speed is 45 mph in urban and suburban scenarios and 55 mph for rural conditions. These values may need to be adjusted for state specific criteria.
Summary of Recommended Minimum Auxiliary Lane (AL) Lengths (ft)
Conclusions
This research attempted to fill a gap by addressing three key issues in frontage road AL design that have either not been studied or only partially addressed in previous research or literature. The first issue is the optimal length of ALs that provide merging distance for offramp traffic or that serve as a weaving lane between an offramp and downstream onramp in an X-ramp configuration along a frontage road. The second issue is the optimal distance between an offramp terminal and downstream intersection and the third one is the queue length issues involving right-turn, left-turn, and U-turn lanes for ALs on frontage roads. The research systematically examines these issues by simulating the influence of nine design parameters on the selected design elements using microsimulation. The study leverages the findings to develop recommendations for the length of an AL in six common frontage road design configurations. The results complement the existing roadway design manual by providing specific guidelines for ALs on frontage roads in rural, suburban, and urban areas and also compare the existing guidance with the findings of this research.
This research paper deals purely with the operational issue, a part of this project was studying the impacts of design elements on crashes. The findings of that have been published in a final report.
Footnotes
Acknowledgements
The research on which this paper is based was performed under contract with the Texas Department of Transportation, Project 0-7047, Establish Guidelines for Designing Auxiliary Lanes on Frontage Roads. The Texas A&M Transportation Institute led the research.
Author Contributions
The authors confirm their contribution to the paper as follows: study conception and design: Ioannis Tsapakis, Sushant Sharma, Steve Venglar; data collection: Steve Venglar, Paul Anderson; analysis and interpretation of results: Steve Venglar; Paul Anderson; Sushant Sharma; draft manuscript preparation: Paul Anderson; Sushant Sharma. All authors reviewed the results and approved the final version of the manuscript.
Declaration of Conflicting Interests
The author(s) declared no potential conflicts of interest with respect to the research, authorship, and/or publication of this article.
Funding
The author(s) disclosed receipt of the following financial support for the research, authorship, and/or publication of this article: This research was funded by the Texas Department of Transportation Research and Technology Implementation Division, through Research Project 0-7047 Establish Guidelines for Designing Auxiliary Lanes on Frontage Roads.
The content of this research does not necessarily reflect the official views of Texas DOT. Any errors, inaccuracies, or omissions are the responsibility of the authors.