
Abstract
This study used logistic regression to determine whether there is a significant difference in pedestrian–vehicle interaction severity at side street green and exclusive phase pedestrian signals, and to evaluate whether waiting- and crossing times are useful predictors of pedestrian–vehicle conflict. To do this, data related to the physical characteristics of each intersection and to the crossing experience of every pedestrian were gathered at 32 signalized intersections in Connecticut. At each intersection, conflicts between pedestrians and vehicles were classified into four distinct severity levels: undisturbed passage, potential conflict, minor conflict, and serious conflict. After interpreting the results of six different logistic regression refinements, it was determined that waiting time, crossing time, the number of lanes, annual average daily traffic, pedestrian compliance, phasing, and the presence of crosswalks were all useful predictors. Based on the results of this analysis, low wait time and crossing time values were associated with a decrease in the odds of a conflict. It was also determined that exclusive phase signals reduced the odds of a conflict by 85%. Future research should investigate variables associated with different land development patterns and demographic information. Along with this, the crossing experience of individuals who do not comply with pedestrian signals should also be evaluated.
The United States experienced a 54% increase in pedestrian fatalities from 2010 to 2020, while all other traffic-related deaths increased by 13% ( 1 ). In 2020, 6,516 pedestrians died in motor vehicle-related crashes, which represents nearly 17% of the total number of fatalities; on average, one pedestrian was killed every 81 min and injured every 10 min ( 2 ). Because of the drastic increase in deaths, pedestrian safety is of the utmost importance and action should be taken to improve the safety of nonmotorized road users. Similar statistics were cited in studies by Islam et al. ( 3 ) and Zhang et al. ( 4 ), both of which have comparable study designs and motivations to the current study.
Every pedestrian crash begins with an interaction between a vehicle and a person walking. A common place for interactions between pedestrians and automobiles is at signalized intersections, where people often cross the street. This study examined the crossing experience of pedestrians at two different types of signalized intersection, which will be referred to as side street green phase and exclusive phase intersections. With side street green phasing, pedestrians do not have a unique signal phase; instead, they cross at the same time and in the same direction as traffic that has a green light, so that pedestrians and vehicles simultaneously have a green light ( 5 ). This allows pedestrians to cross the road while parallel vehicles are moving, which can help reduce delay, but may lead to conflicts between pedestrians and turning vehicles ( 6 ). For exclusive phasing, pedestrians have their own crossing phase, during which all motor vehicles are stopped. Rather than using red or green ball indicators, exclusive pedestrian signals have “Walk/Don’t Walk” indicators and often exhibit longer delays for both vehicles and pedestrians. As a result, pedestrians may be less likely to comply with the “Don’t Walk” interval, which could lead to more severe interactions ( 4 – 6 ). Since conflicts are both strongly correlated and a surrogate measure for the number of crashes, pedestrian–vehicle interactions can be used to evaluate pedestrian safety ( 3 , 7 ).
The purpose of this research was to determine the factors associated with pedestrian–vehicle conflicts at signalized intersections. To do this, the severity of each interaction, signal phasing, number of pedestrians, crossing distance, crossing time, wait time, and other variables were collected at each of 32 observation intersections located throughout Connecticut. At each intersection, the severity of all interactions between vehicles and pedestrians were identified. Each observation was classified based on whether a conflict occurred, so a binary logistic regression model was used to predict the occurrence of a conflict according to other variables that were also present. Since multiple observations were gathered at each project site, repeated measures needed to be considered to accommodate potential unexplained variance among conflict observations at the same intersection. With this in mind, the major goals of this project were to estimate the probability of a conflict between pedestrians and vehicles for each individual observed crossing a street, determine whether wait time and crossing time were useful prediction measures, and to answer the question, “Is there a significant difference in interaction severity between side street green and exclusive phase signals?”
Related Studies
Several studies have investigated the factors that influence the number and severity level of pedestrian–vehicle crashes. Gårder found that intersection signalization can reduce the probability of pedestrian crashes if the majority of vehicles are not turning ( 8 ). It was also found that exclusive phase intersections can improve pedestrian safety, as long as most people obey the pedestrian signals ( 8 ). Similar results can be seen in a study by Zegeer et al., in which exclusive phase intersections were observed to have a much lower prevalence of pedestrian crashes when compared with unsignalized or side street green locations ( 9 ). Shankar et al. used negative binomial and zero-inflated Poisson models to determine the exposure measures that have a significant impact on pedestrian crash probability ( 10 ). The statistically significant covariates in Shanker et al.’s study were annual average daily traffic (AADT), traffic signal spacing, illumination, and center turn lanes. In a study by Kim et al., Poisson and negative binomial regression models were used to establish the factors that influence a variety of crash types, including pedestrian–vehicle crashes ( 11 ). For all crash types, AADT, the number of driveways, and the existence of turning lanes were found to have a positive association with the total number of crashes. The presence of lighting and median width were both found to have a negative association with the total number of crashes ( 11 ). Stipancic et al. found that raised medians and exclusive left-turn lanes significantly improve pedestrian safety; these two features help separate pedestrians and vehicles, which leads to a smaller number of potential interactions. This study also concluded that the number of commercial entrances near an intersection can increase the number of pedestrian injuries ( 12 ).
Zhang et al. estimated models for the prediction of crash counts and vehicle interaction severity at both concurrent and exclusive pedestrian crossings ( 4 ). In their research, concurrent phasing has the same meaning as side street green phasing. Pedestrians were observed at each intersection and categorized on the type of interaction with vehicles. Using this data, nonlinear mixed models, specifically generalized logit, proportional odds, and partial proportional odds, were used for interaction severity; pedestrians who crossed during the walk phase at an exclusive signal were found to experience lower interaction severity than those crossing at a green light with concurrent phasing. Despite this, pedestrians that crossed during a green light for automobiles when an exclusive pedestrian phase was available experienced higher interaction severity. It was also found that intersections with concurrent phasing have fewer total pedestrian-related crashes, but more high-severity crashes than locations with exclusive phasing ( 4 ).
Research by Islam et al. analyzes pedestrian conflicts and crash counts to determine the exposure measures and roadway characteristics that influence pedestrian safety ( 3 ). Negative binomial models and the ordered proportional odds technique were used to generate models for conflict severity and pedestrian counts. Minor and serious conflicts were found to be useful in predicting the total number of pedestrian-related crashes when combined with crossing distance and building setback variables. Specifically, it was discovered that larger crossing distances and small setbacks were related to a larger number of pedestrian-related crashes ( 3 ). Likewise, Stipancic et al. found that the number of lanes on a street in the vicinity of an intersection was positively associated with the number of pedestrian injuries. This research also found that curb extensions, which decrease the required crossing distance for pedestrians, can reduce potential interactions between pedestrians and vehicles ( 12 ).
The papers described above consider the physical characteristics of the intersections being studied, crash data, and the type of pedestrian–vehicle conflict. However, none of these studies analyze the effects of the time it takes a pedestrian to cross the roadway or the time a person must wait before crossing, which are two variables that could be significant in determining the probability of a conflict occurring. In the current study, binary logistic regression implemented in the RStudio environment was used to incorporate these two variables and signal type along with other potential covariates to estimate the probability of a conflict ( 13 ). The variables that were strongly associated with the odds of a conflict were also identified.
Data Collection
The data were collected as part of a larger study that is investigating the impact on pedestrian safety that is associated with converting intersections from side street green to concurrent phasing. Similar to side street green phasing, intersections with concurrent operation do not have a distinct crossing phase for pedestrians; instead, people cross the road at the same time and in the same direction as traffic that has a green light. The main difference between these two types of pedestrian crossings is the signal head that is present at each crosswalk. For side street green, a red or green light will indicate when a person should cross the street, whereas signal heads displaying “Walk” or “Don’t Walk” lights are present at concurrent phase crossings. Signs alerting drivers to the possibility of pedestrians in the roadway, as well as signs that warn pedestrians of turning vehicles may also be present at concurrent operation intersections.
As a part of the larger study, a list of intersections with side street green pedestrian phasing was obtained from the Connecticut Department of Transportation. Each location in this list was a candidate for conversion to concurrent signal operation. From this list, 10 groups of 3 intersections were selected based on comparable physical characteristics, such as roadway width and the presence of crosswalks and sidewalks. An intersection with exclusive pedestrian phasing and matching physical characteristics was added to each of the 10 groups to help control for differences in the safety outcomes that are the result of the type of signal phasing. After the data had been collected at each intersection, two groups had an insufficient number of pedestrian observations, so were removed from the project. The data from the remaining 32 intersections, which consisted of 24 side street green and 8 exclusive phase locations, were used in this analysis.
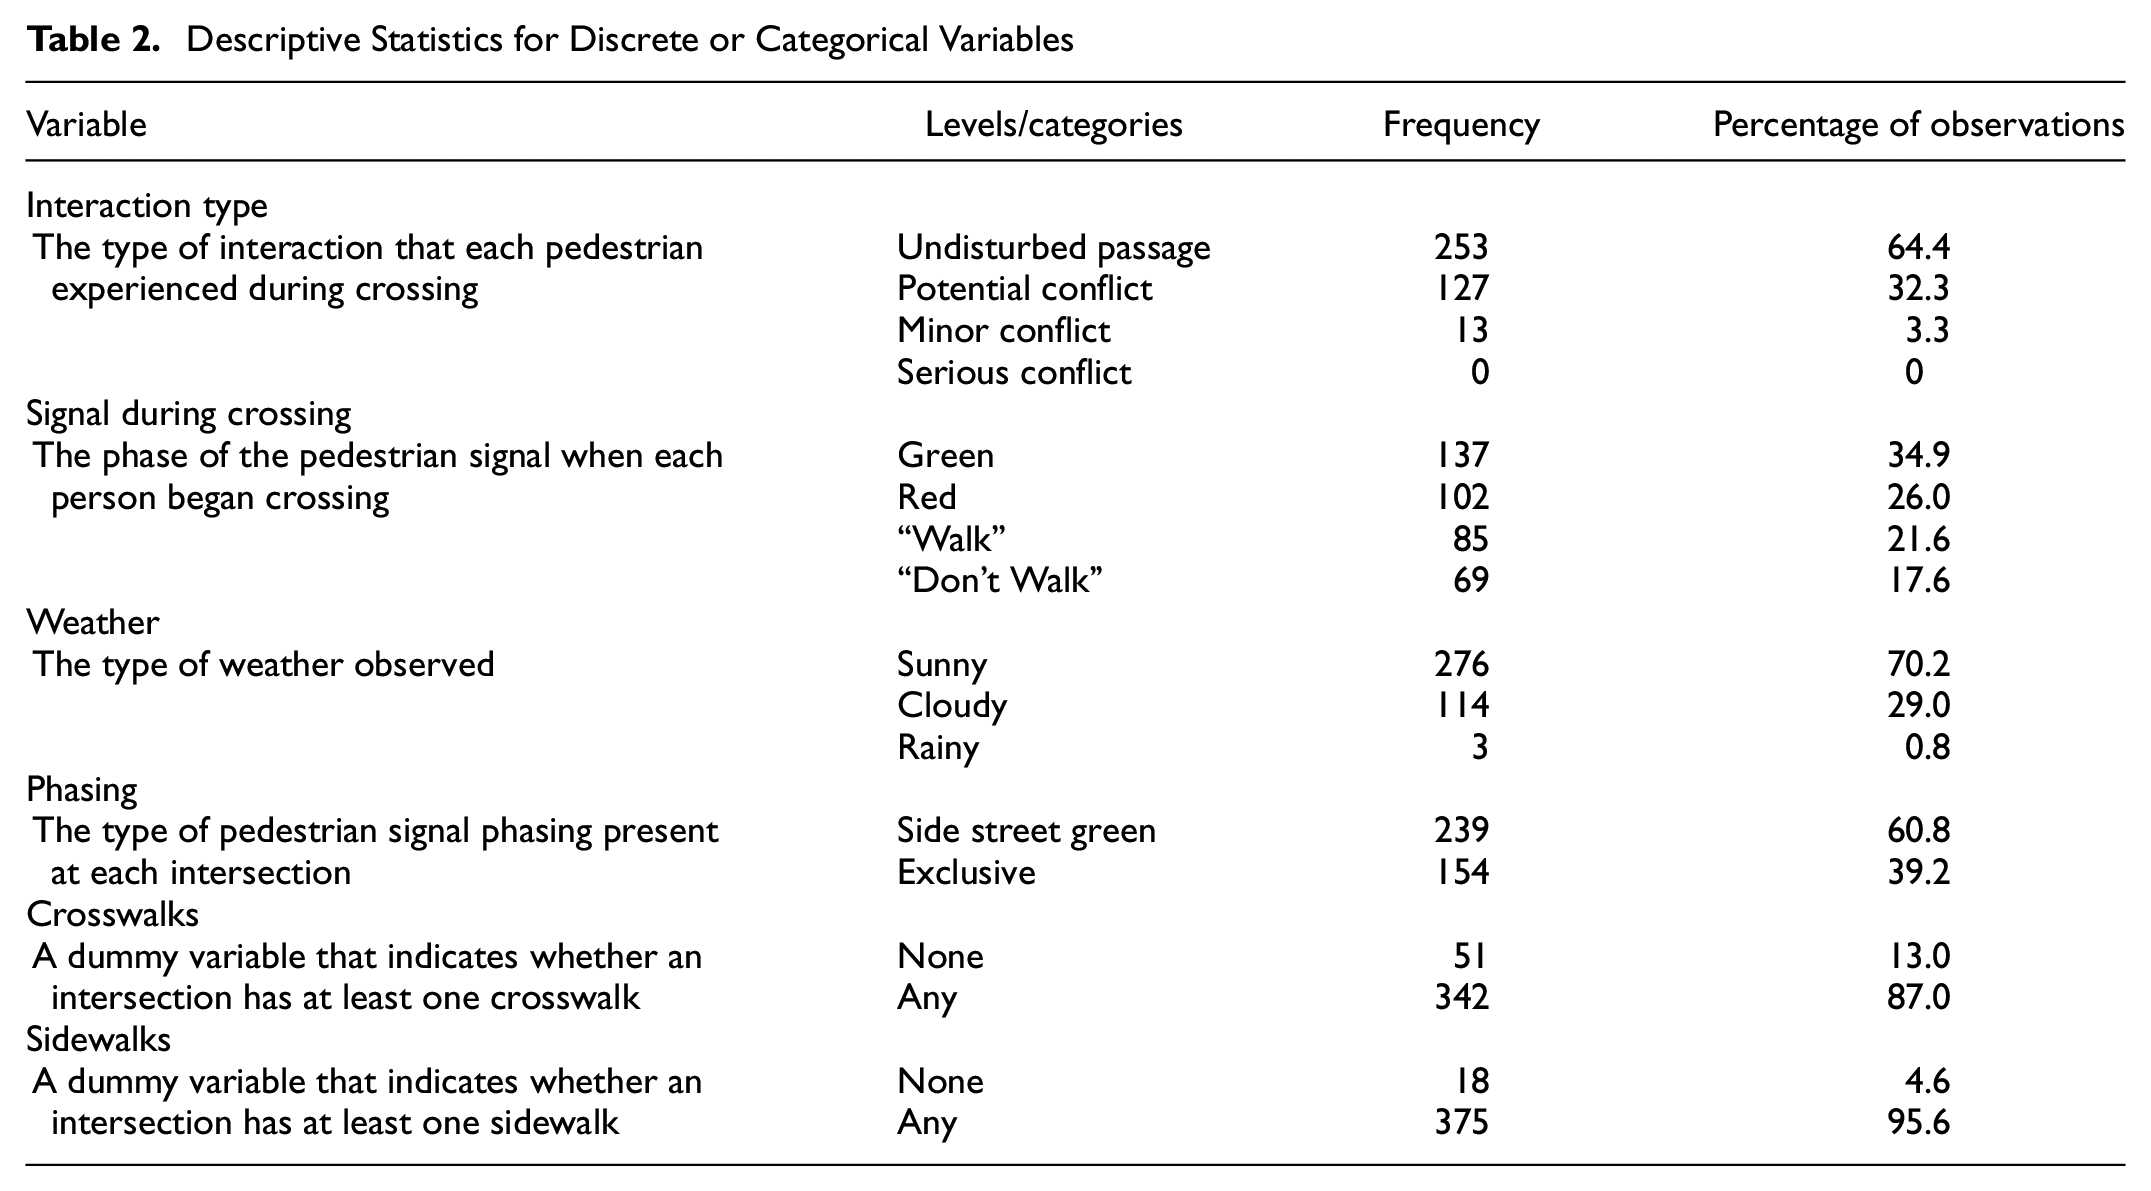
Each project site was observed for 4 to 6 h, at varying times from noon until 8:00 p.m. Data collection began in July of 2021 and ended in November of the same year. During each observation session, the type of interaction, phase of the pedestrian signal, wait time, and crossing time were recorded for each person that crossed the road. Descriptive statistics for continuous variables and discrete variables can be found in Tables 1 and 2. Violin plots of the waiting time and crossing time of each pedestrian at both side street green and exclusive phase crossings can be seen in Figures 1 and 2.
Descriptive Statistics for the Continuous Variables
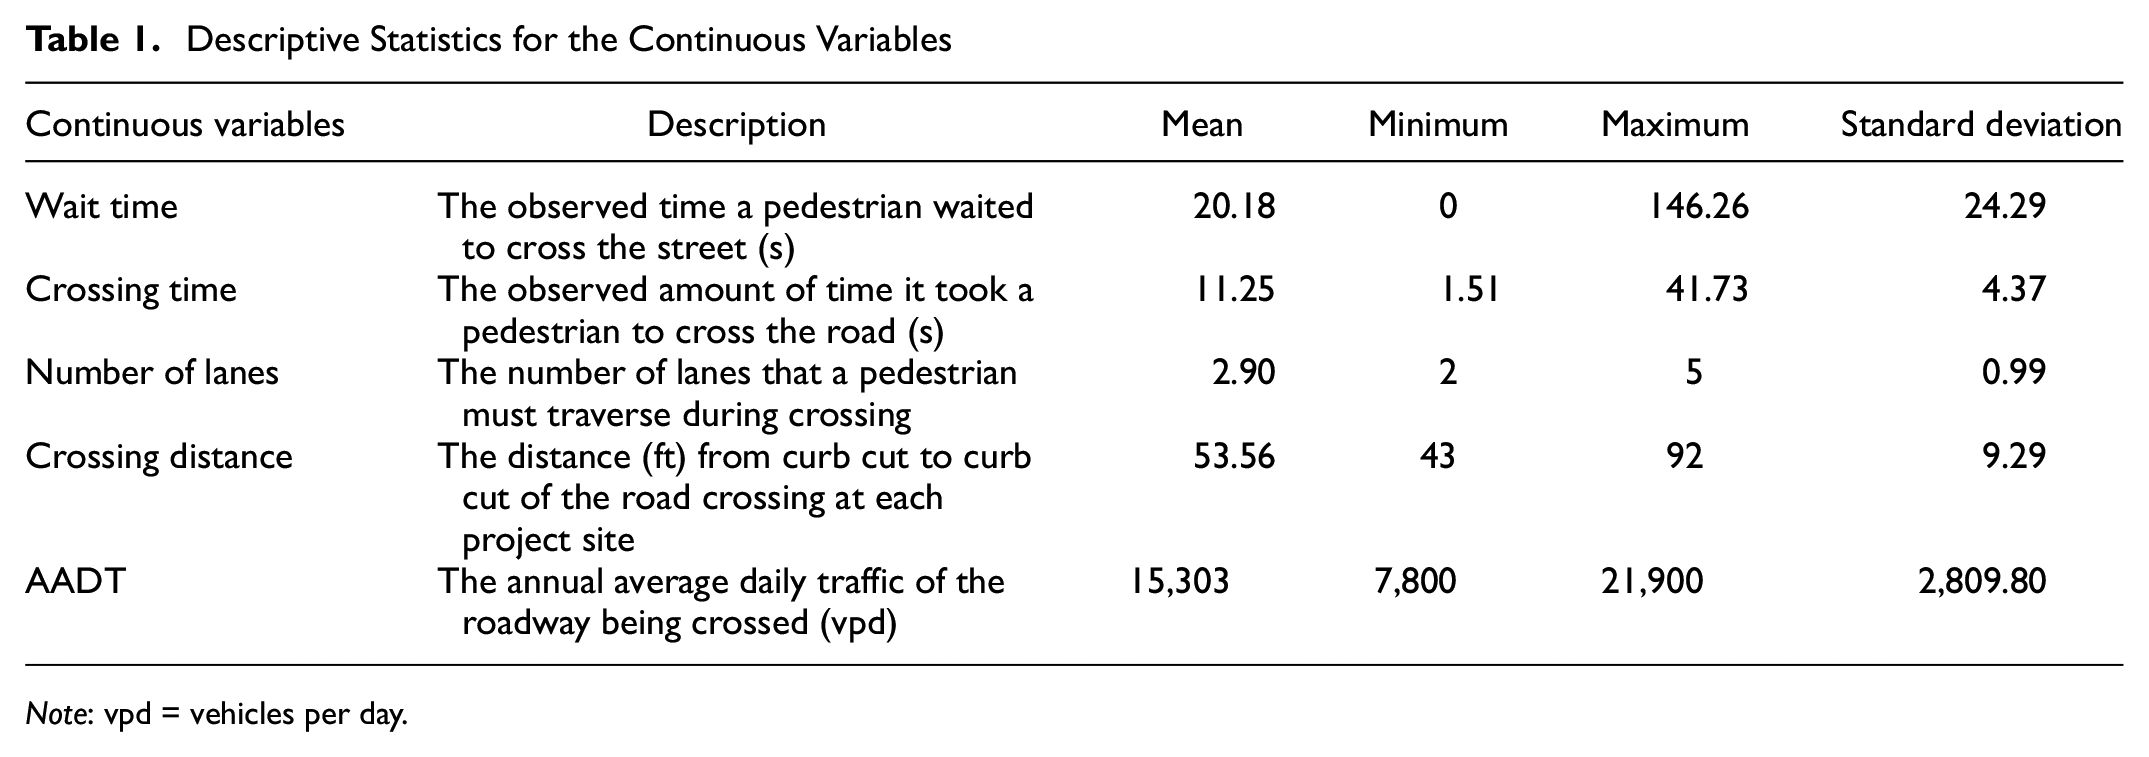
Note: vpd = vehicles per day.
Descriptive Statistics for Discrete or Categorical Variables
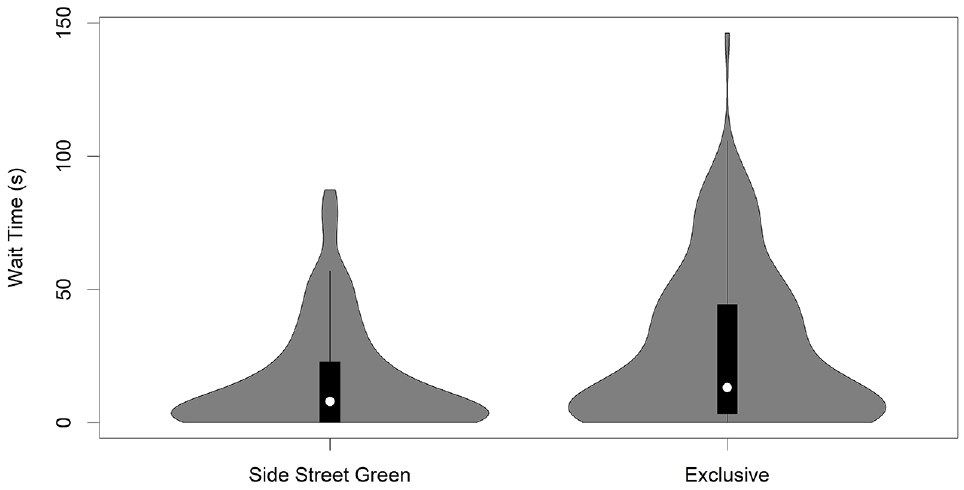
Violin plot of wait time for both types of pedestrian crossing. The width of the plot indicates the number of observations for a specific value of wait time.
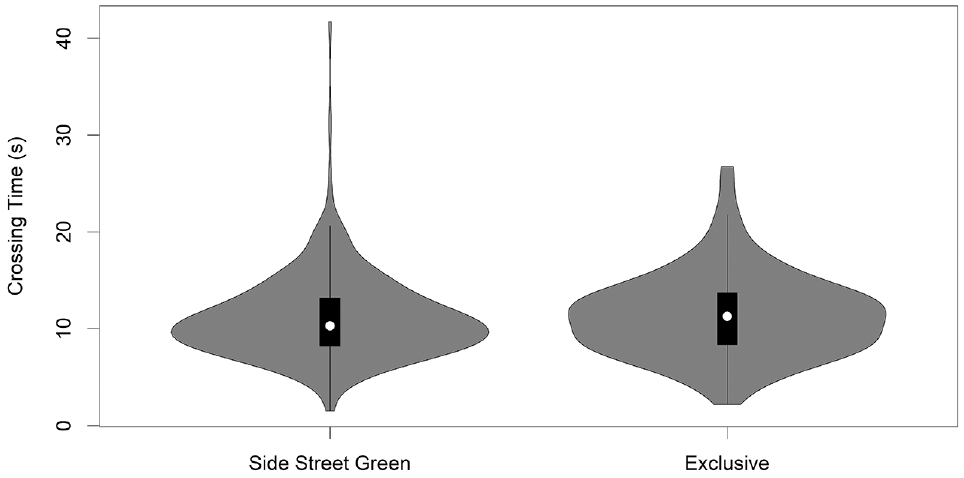
Violin plot of crossing time for both types of pedestrian crossings. The width of the plot indicates the number of observations for a specific value of crossing time.
The interaction type was recorded and classified based on the Swedish Traffic Conflict Technique (TCT) ( 14 ). All observers were trained in this methodology and practice observation sessions were held to ensure consistent data collection among observers. The four different interaction types recorded in this project are described below in increasing order of severity; undisturbed passage and potential conflict were classified as nonconflict events, whereas the remaining two categories were classified as conflict events. These definitions are borrowed from Islam et al. ( 3 ) and Zhang et al. ( 4 ).
Undisturbed passage: Under this categorization, a pedestrian crosses the road when there is no possibility that a crash can occur. This type of interaction is observed when all vehicles are stationary, or there are no vehicles near the individual who is crossing the road.
Potential conflict: This event takes place when a pedestrian and a vehicle interact with each other, but there is a very low chance that a crash will occur. An example of this would be a driver gradually coming to a complete stop while a pedestrian is crossing the street or when a pedestrian nonverbally communicates to a driver before crossing the road.
Minor conflict: This interaction type is observed when there is a chance of a collision between a pedestrian and a vehicle. Key characteristics of a minor conflict include low vehicle speed and a long time-to-collision (14). Both conditions allow the driver to stop with adequate distance between the motor vehicle and the pedestrian or the driver can perform some type of maneuver to avoid a collision. The pedestrian should also have enough time and space to avoid the possible collision because the automobile is traveling at a slower speed. Because of this, the possibility of a fatality is low if a collision does occur.
Serious conflict: A serious conflict is observed when a pedestrian and a vehicle are on an imminent collision course. As a result, the driver must perform a late evasive action, such as swerving or aggressively braking, to avoid a collision. The pedestrian may also need to make an unplanned, erratic movement, such as jumping out of the roadway, so that they are not struck by the vehicle.
Methodology
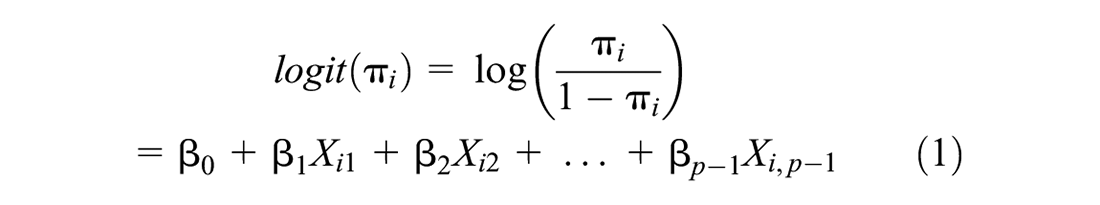
Information was gathered about the physical characteristics of each intersection, as well as details about the crossing experience of every pedestrian. Since no serious conflicts were observed, the type of pedestrian–vehicle interaction was classified based on whether a minor conflict occurred: a value of 0 was given to observations corresponding to undisturbed passage or potential conflict (i.e., 0 = undisturbed passage or potential conflict) and a value of 1 was given to the observations classified as a minor conflict (i.e., 1 = minor conflict). Because of this categorization, binary logistic regression was used to analyze the data. The form of the logistic regression model is given in Equation 1.
The above expression can also be written as shown in Equation 2,

where


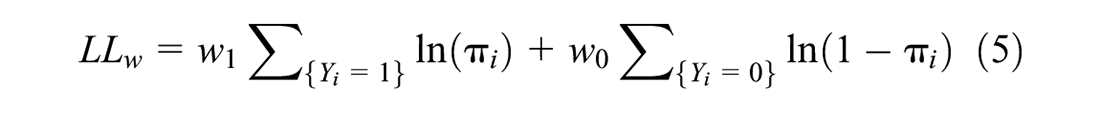
As shown in Table 2, only 3.3% of the observations were classified as minor conflicts. This indicated that the data were imbalanced, which means that a standard binary logistic regression model may not have been able to account for the excess zero-values in the dataset. In other words, the model may underpredict the number of minor conflicts. To account for this data imbalance and potentially improve a specific model, weights were calculated as shown in Equations 3 and 4 ( 15 ).


where
Here,
where
Another way to account for imbalanced data is upsampling. This technique increases the size of the minority class, so that the number of records in the minority and majority classes are equal. Here, the minority class was composed of the observations classified as a minor conflict and the majority class was all other observations. To perform this operation, the upSample( ) function from the caret package in R was used; this function randomly samples with replacements from the minority class until the distribution of the two classes is equal ( 16 ).
This study design consists of observations of pedestrians at each of 32 intersection crosswalks, resulting in a repeated measures study design. Consequently, these repeated measures might have needed to be accounted for to reduce bias and remove heteroskedasticity in the logistic regression model. To do this, the glmer( ) function from the lme4 package in R was used ( 17 ). Since multiple observations were recorded at a crosswalk at each intersection, the crosswalk number was chosen as the random effects term in the glmer( ) function. All other covariates were designated as fixed effects.
A series of performance measures were used to determine the predictive ability of a specified model. For each of the following quantities, a value close to 1 is preferable; values close to 1 indicate that the model is useful in predicting the probability of a minor conflict occurring ( 18 , 19 ).
True positive rate (TPR) (i.e., sensitivity):

True negative rate (TNR) (i.e., specificity):

Positive predictive value (PPV) (i.e., precision):

Negative predictive value (NPV) (i.e., negative accuracy):

Balanced accuracy (BA) (i.e., average prediction accuracy):

The terms listed in the expressions above are defined as follows:
TP is number of true positives,
FN is the number of false negatives,
TN is the number of true negatives, and
FP is the number of false positives.
Deviance residual plots were evaluated to determine whether a model was a good fit to the data. Since this type of residual is centered around zero, has a standard error equal to 1, and is approximately standard normal, 95% of the residuals should fall within two standard deviations of the mean. In other words, the majority of points on a deviance residual plot should lie between −2 and 2; if a significant number of residuals lie outside of this range, the plot indicates that the selected model does not fit the given data well ( 20 ). The formula used to calculate deviance residuals is given in Equation 11. Along with this, likelihood ratio tests were performed to compare the selected model with a reduced model. If this test has a p-value less than a specified significance level, then the model is considered useful in predicting the probability of a minor conflict; if the test has a large p-value, then the specified model is no better than the reduced model. If the reduced model contains only the intercept and the result of the likelihood ratio test has a high p-value, this means that the full model is not useful in predicting the probability of a minor conflict.
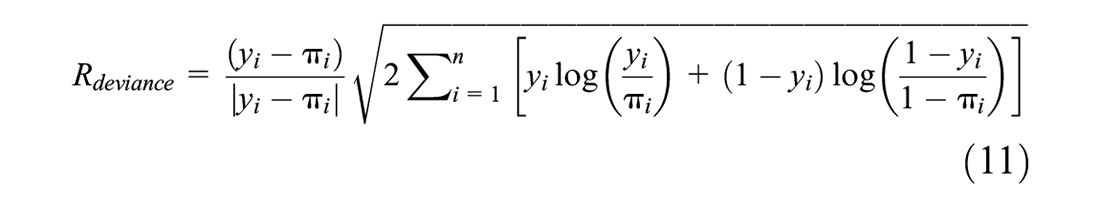
where
Brier scores were used to determine the accuracy of the predicted probabilities for a given model. The values for this measure can range from 0 to 1; a score of 0 indicates that the model is completely accurate, whereas a score of 1 means that the predicted probabilities are not accurate at all ( 21 ). The expression in Equation 12 was used to calculate the Brier scores.

where
Six types of regression models were developed to incorporate different combinations of weighting or upsampling, and random effects. The models are described as follows:
Model 1: an unaltered binary logistic regression model.
Model 2: a mixed effects binary logistic regression model that includes a random intercept for each intersection.
Model 3: a weighted binary logistic regression model.
Model 4: a mixed effects binary logistic regression model that includes weights and a random intercept for each intersection.
Model 5: a binary logistic regression model that uses an upsampled dataset.
Model 6: a mixed effects binary logistic regression model that uses an upsampled dataset.
Results
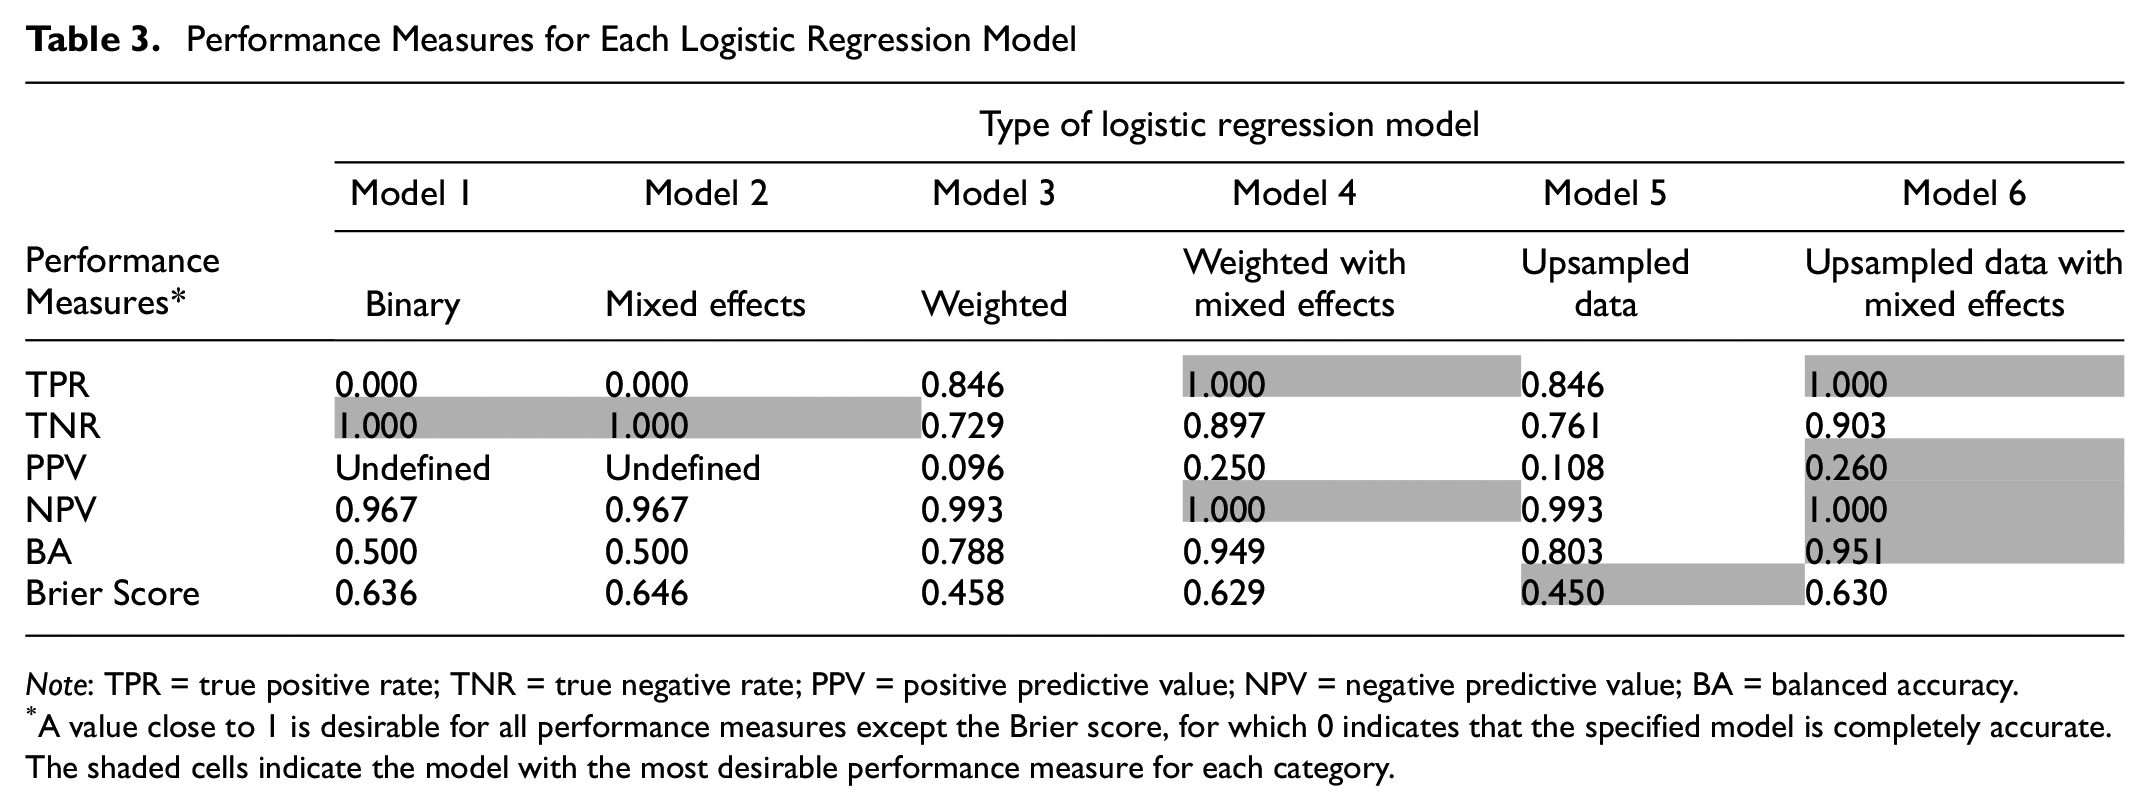
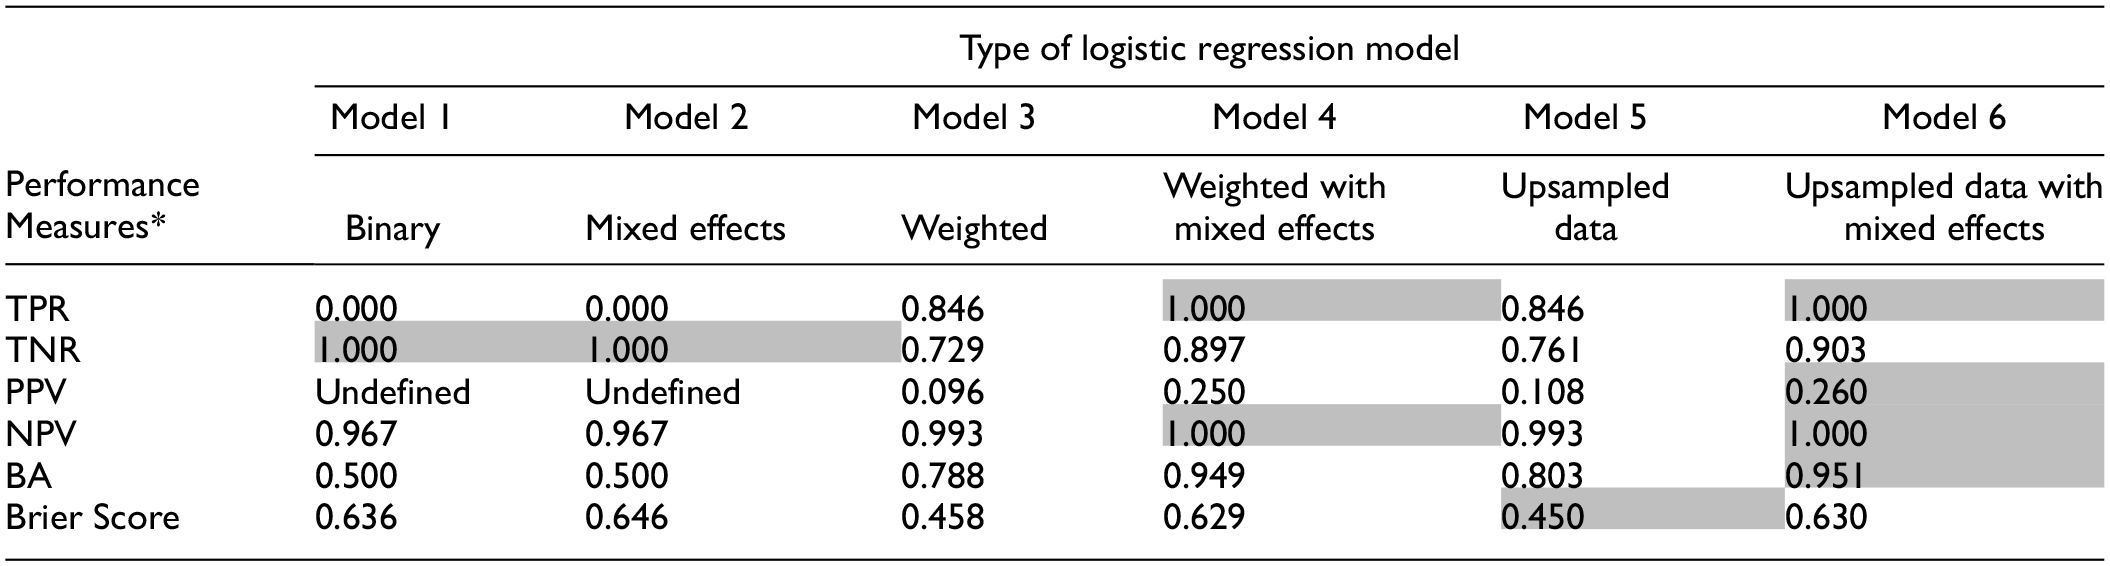
Regression models were estimated for each of the six modeling approaches. A significance level of 0.05 was used to determine whether a variable should be included in the final model formulation. Interactions between variables were also considered. After multiple iterations of the model specification, each model was evaluated using a series of different performance measures, which can be seen in Table 3. Here, the shaded cells indicate the model with the most desirable performance measure for each category. For instance, Model 6 has the highest PPV, so this entry is shaded. As shown by a TPR of 0 and a TNR equal to 1, Models 1 and 2 were unable to predict any conflict events; in other words, these two models were unable to capture any of the positive events, which may be the result of the imbalance between conflict and nonconflict events. To potentially remedy this issue, Models 3 and 5 were created. These models both had a high TPR and a low PPV, which indicated that they overpredicted the number of conflict events. A similar observation can be made for Models 4 and 6; in this case, both models had a TPR of 1 and a PPV near 0.25. This means that they accurately predicted a conflict for all events that were classified as a conflict, but these models also produced a significant number of false positives.
Performance Measures for Each Logistic Regression Model
Note
A value close to 1 is desirable for all performance measures except the Brier score, for which 0 indicates that the specified model is completely accurate.
The shaded cells indicate the model with the most desirable performance measure for each category.
In addition to the performance statistics, deviance residual plots were used to determine whether a model was a good fit to the data. The plots for all six models can be seen in Figure 3, in which the horizontal axis of each graph represents the index assigned to each observation. The index is an ordered, arbitrary value that was automatically applied to each observation in the dataset when imported into R. Owing to the data upsampling process, the index was slightly different for Models 5 and 6. Here, the deviance residuals from observation Index 1 to 380 were still ordered based on the group number, but consisted solely of events classified as nonconflict. The points from Index 381 to 760 consisted only of events classified as a conflict; in other words, all the residuals beyond Index 380 were the same 13 conflict observations, which were randomly repeated until there was an equal number of conflict and nonconflict events.
As displayed in Figure 3, all models had less than 3% of their deviance residuals outside of the appropriate interval. This indicated that each binary logistic regression model was a good fit to the dataset, and they were suitable for determining the probability of a conflict in this study. However, some distinct patterns were present in the deviance residuals for Models 4, 5, and 6. For Models 5 and 6, the shape of the residual plots were the result of the data upsampling process. In both plots, all residuals classified as nonconflict had values that were less than or equal to zero, suggesting that the models overestimated the response variable for each of these observations. Along with this, all the residuals from data categorized as a conflict had a value that was greater than or equal to zero. In cases for which the deviance residuals were positive, this indicated the model was underestimating the response variable for the events classified as a conflict. Distinct patterns were also present in the residual plots for Models 4 and 6 between approximately Index 250 and 380. Even though the addition of a random effects term appeared to improve the residuals, these groups of points seemed to be exaggerated in Models 4 and 6, both of which were mixed effects models. In other words, the random intercept appeared to decrease the magnitude of the deviance residuals, except in these small clusters. This suggested that the random intercept in each of these models may not be able to fully account for the unobserved heterogeneity that is potentially present at some of the intersections where data were gathered.
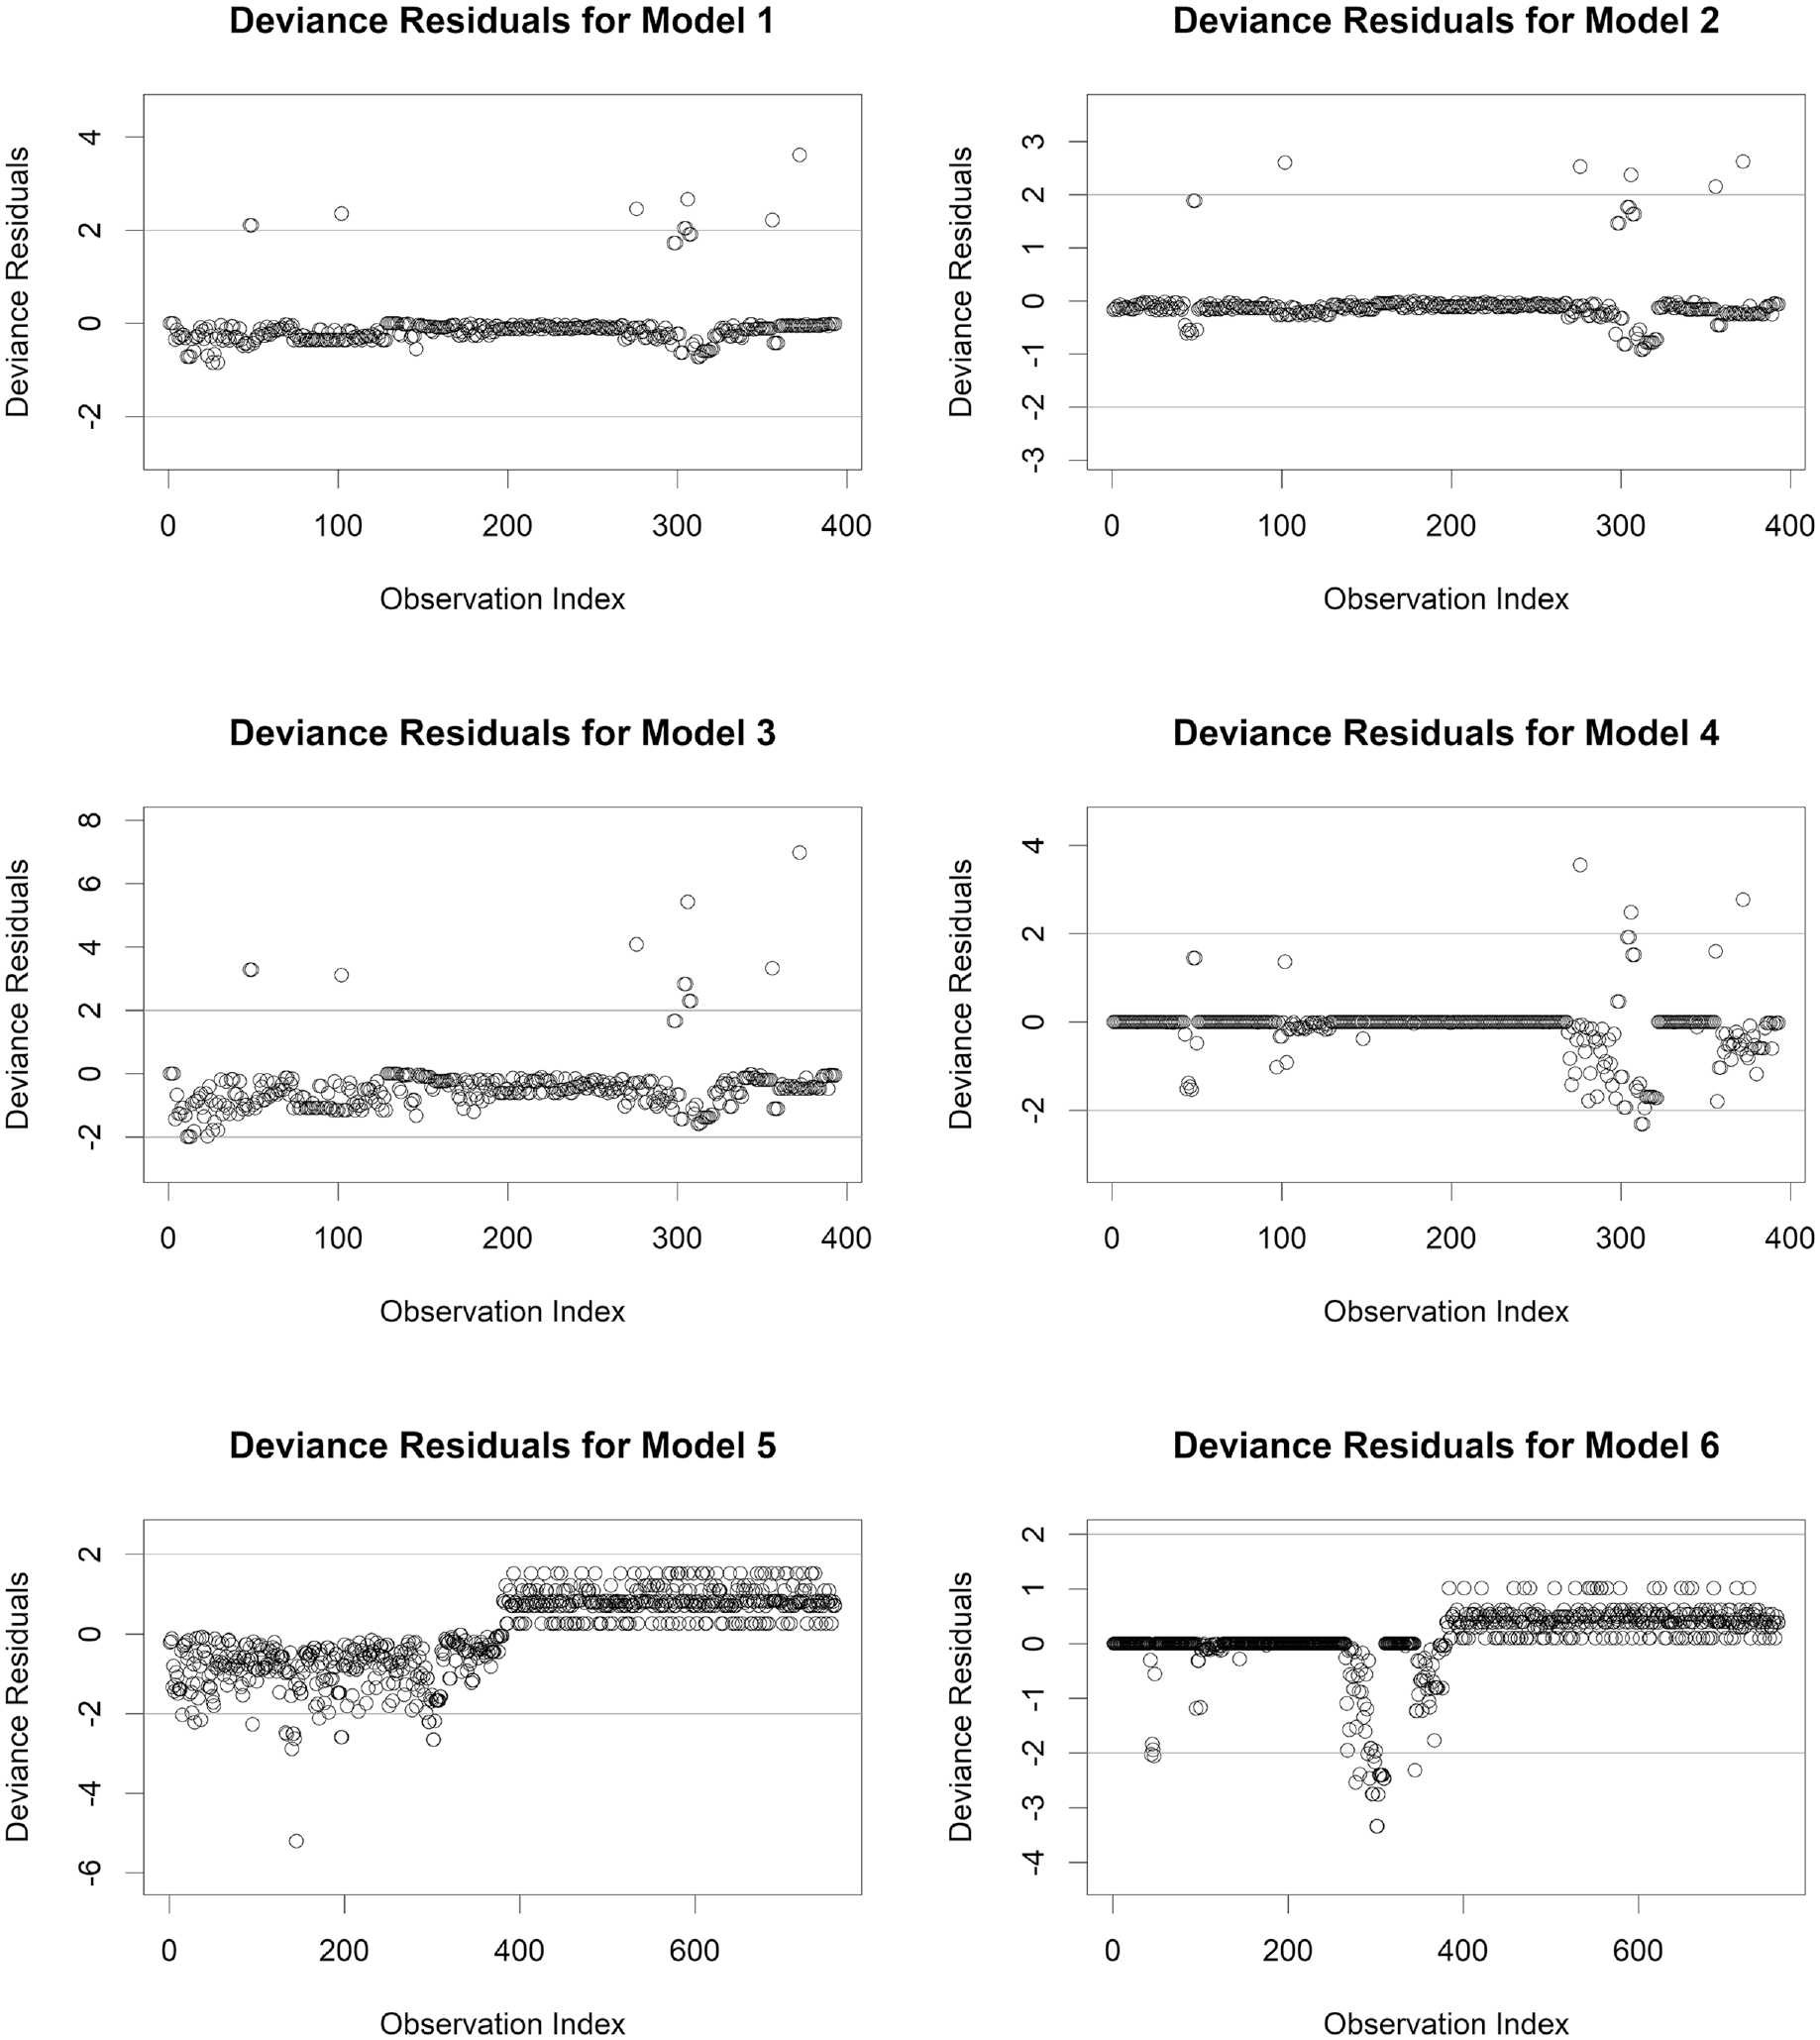
Deviance residual plots for all six models.
Based on the performance measures in Table 3 and the plots in Figure 3, Model 6 was selected as the best performing model. This model had the highest TPR, PPV, NPV, and BA, and ranked highly in the remaining performance measures. Model 5 is also shown in detail because it was the best performing model that did not include random effects. The coefficient estimates, p-values, and the unit change in odds for both Models 5 and 6 can be seen in Table 4.
Coefficient Estimates, p-Values, and Unit Change in Odds for Model 5 and Model 6
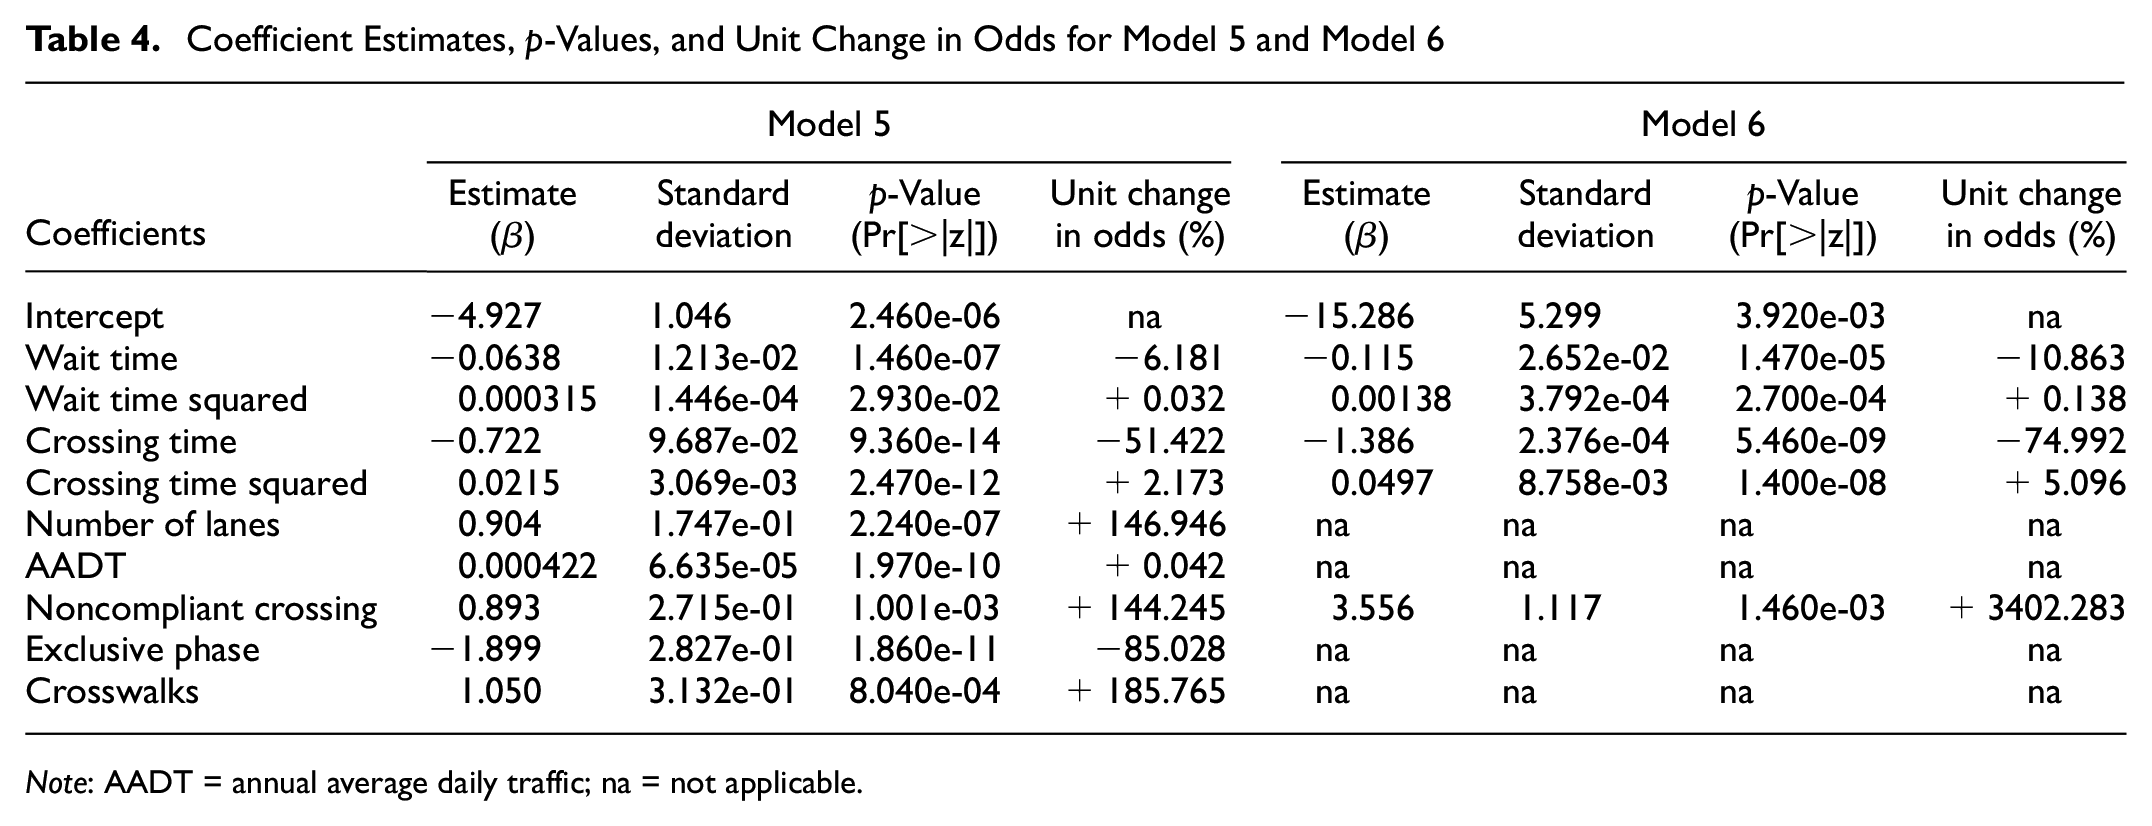
Note: AADT = annual average daily traffic; na = not applicable.
Two likelihood ratio tests were used to determine whether the second order terms of wait time and crossing time were meaningful covariates. The full model contained all the significant parameters for either Model 5 or Model 6, whereas the reduced model contained all the parameters except the second order terms. For example, the full for Model 6 included the intercept, wait time, wait time squared, crossing time, crossing time squared, and noncompliant crossing; the reduced model only has four terms: the intercept, wait time, crossing time, and noncompliant crossing. The results of both tests can be found in Table 5. Since the p-value associated with both comparisons was less than 0.05, this means that the second order terms for wait time and crossing time were not equal to zero and that these two predictors were useful in determining the probability of a conflict.
Likelihood Ratio Test for the Significance of Wait Time and Crossing Time in Model 5 and Model 6
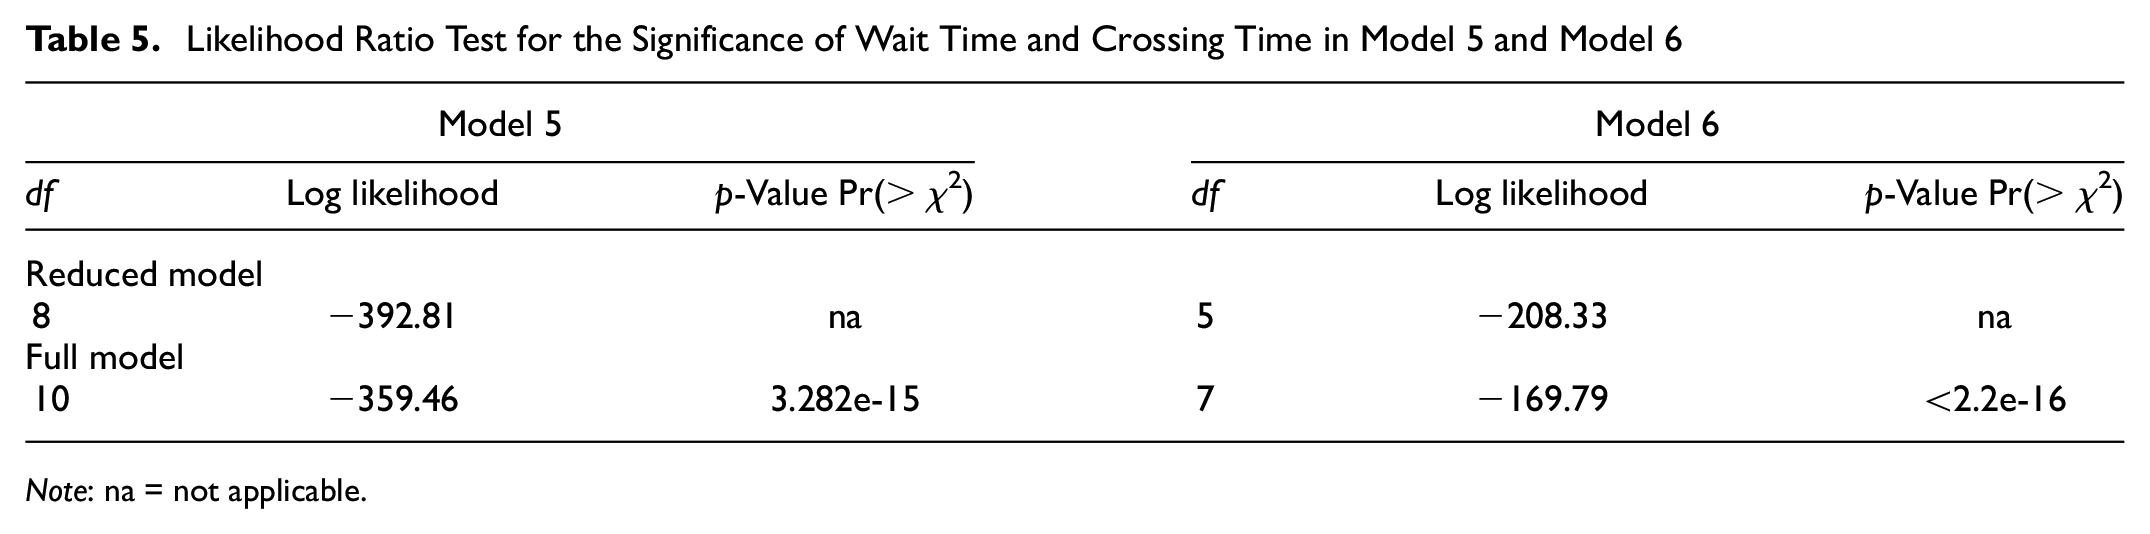
Note: na = not applicable.
Model 5 is a binary logistic regression model that uses an upsampled dataset to account for the small number of observed conflicts. Since wait time and crossing time were considered to be variables of interest, they were both added to the initial model formulation. After attempting to include each variable from the dataset, the only statistically significant factors were wait time, wait time squared, crossing time, crossing time squared, number of lanes, AADT, noncompliant crossing, exclusive phase, and crosswalks. Here, the noncompliant crossing variable indicates whether a person started crossing the street during a red or “Don’t Walk” pedestrian signal phase. Since wait time and crossing time both had first and second order terms, a plot of the unit change in odds across the observed values of these two variables was created. This plot, which is shown in Figure 4, revealed that longer waiting times led to a reduction in the odds of a conflict. It also showed that short and intermediate length crossing times caused a decrease in the odds of a conflict, whereas large values caused an increase in the odds of a conflict. The coefficients of number of lanes, AADT, noncompliant crossing, and crosswalks were all positive, which indicated that a unit increase in each of these variables will increase the odds of a conflict. On the other hand, exclusive phase had a negative coefficient; if all other terms remain constant, an exclusive phase pedestrian signal could reduce the odds of a conflict by 85.028%. To test whether this finding was related to a correlation between exclusive phasing and noncompliant crossings, a tetrachoric correlation test, which measures the correlation between two binary variables, was performed. This test resulted in a correlation of 0.033, indicating that there was an exceedingly small correlation between exclusive phasing and noncompliant crossings. The effect of this phasing type differed from what was concluded in previous research. Past studies found that pedestrians experience higher interaction severity at exclusive phase crossings, however, neither the time spent waiting nor crossing time were considered in these studies.
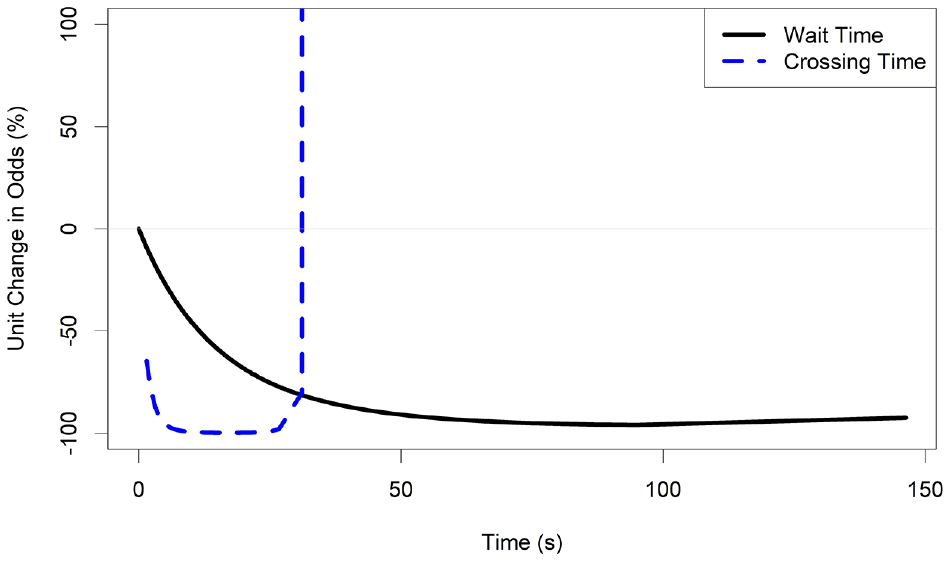
Unit change in odds of event occurrence with changes in wait time and crossing time using coefficients from Model 5.
Similar to Model 5, Model 6 used upsampling to account for imbalanced data. The main difference between these two formulations was that Model 6 included a random effects term to account for repeated measures and unobserved heterogeneity at each intersection. Specifically, Model 6 had a random intercept that varied as a result of unobserved factors at each pedestrian crossing. As shown in Table 4, this intercept was found to be statistically significant. Since Model 6 contained four fewer parameters than Model 5 and each of these missing variables was related to the attributes of each crosswalk, the random effect term in Model 6 appeared to adequately account for differences in the physical characteristics at each intersection. The other significant variables in this model were wait time, wait time squared, crossing time, crossing time squared, and noncompliant crossing. A plot of the unit change in odds across the observed values of wait time and crossing time can be seen in Figure 5. This graph shows that both short and intermediate waiting times were associated with a decrease in the odds of a conflict, whereas long waiting times resulted in an increase in the odds of a conflict. A similar trend can be seen in the plot of crossing time; here, small values of crossing time caused a reduction in the odds of a conflict, whereas long crossing times led to an increase. The final term in this model was noncompliant crossing, which had a very large coefficient estimate, especially when compared with the other variables. Based on this, crossing the street during a red or “Don’t Walk” signal phase could increase the odds of a conflict by 3,402.283%.
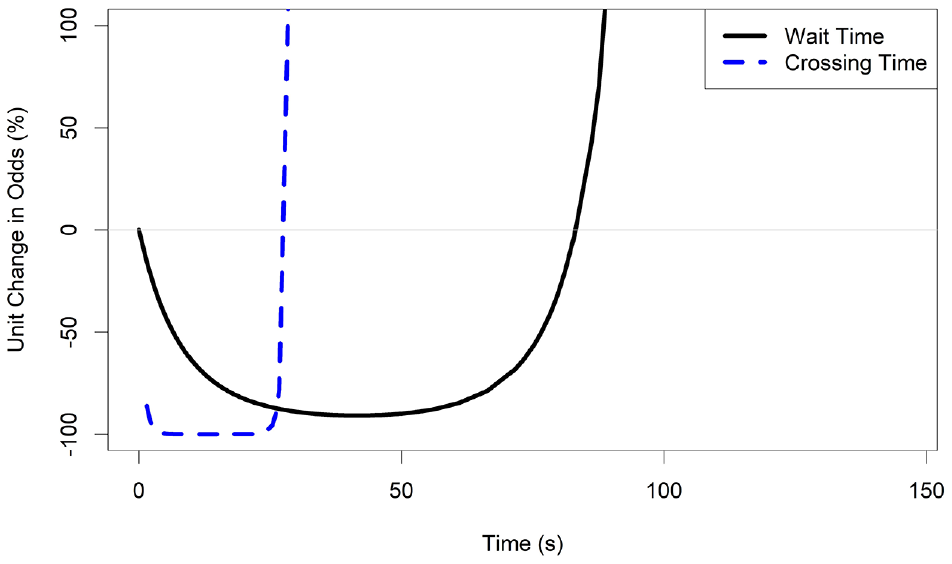
Unit change in odds of event occurrence with changes in wait time and crossing time using coefficients from Model 6.
Summary and Conclusions
The main objectives of this study were to estimate the probability of a minor conflict, establish whether there was a significant difference in the interaction severity experienced by pedestrians at side street green and exclusive phase intersections, and determine whether wait time and crossing time are useful for predicting the probability of a pedestrian–vehicle conflict occurring. To do this, data related to the physical characteristics of the intersection and the crossing experience of each pedestrian were gathered at 32 intersections throughout Connecticut. The Swedish TCT was used to classify each crossing into one of four categories: undisturbed passage, potential conflict, minor conflict, and serious conflict. Since zero serious conflicts were recorded, a variable was created to denote whether a conflict occurred: a value of 1 was given to observations of a minor conflict, and 0 was given to all other interaction types. As a result of this, binary logistic regression was used to calculate the probability of a conflict. After defining six binary logistic models and analyzing a series of performance metrics, it was determined that Model 6, which is a mixed effects logistic regression model that uses an upsampled dataset, had the highest predictive ability.
Model 6 contains first and second order terms for wait time and crossing time, as well as noncompliant crossing, which were all significant at the 0.05 level. Based on this, the time a pedestrian spends waiting at a crossing, as well as the time spent crossing the road, were found to be useful in determining the probability of a minor conflict. If all other terms are held constant, both small and intermediate values of wait time were found to decrease the odds of a conflict, whereas long waiting times caused an increase. The magnitude of this decrease, however, was dependent on the length of time spent waiting; intermediate values of wait time caused the largest decrease, whereas short waiting times led to a smaller decrease in the odds of a conflict. Similarly, short crossing times were found to significantly decrease the odds of a conflict, whereas large values of crossing time caused an increase. Lastly, the variable noncompliant crossing was found to increase the odds of a conflict by 3,402%. This model, however, did not include a variable that distinguished between side street green and exclusive phase pedestrian crossings. In fact, all variables related to either signal phasing type were found to be insignificant and were not useful predictors.
Although it scored lower in most performance measures, Model 5 was the best performing model without a random effects term. In this case, the type of pedestrian signal phasing was a significant covariate. Specifically, it was found that exclusive phase signals decreased the odds of a conflict by 85%. If all other terms remained constant, a unit increase in both the number of lanes and AADT were found to increase the odds of a conflict by 147% and 0.042%. Along with this, noncompliant crossings and the presence of crosswalks increased the odds of a conflict by nearly 144% and 186%, respectively. Lastly, it was determined that long waiting times and short crossing times could significantly reduce the odds of a conflict.
The dataset gathered for this project had a very small number of observed conflicts, which may have affected the accuracy of the results. To account for this data imbalance, either upsampling or weights were used, but it is likely that a better dataset would enhance the results. An unexpected result of this research was the large coefficient of the noncompliant crossing variable. In Model 6, the odds of a conflict increased by over 3,402% when a pedestrian crossed the road during the red or “Don’t Walk” phases, which seems drastic. Future studies should aim to build a dataset that has a larger proportion of events that are classified as a conflict. If a more robust dataset is used, data imbalance issues will probably be resolved and perhaps a more reasonable coefficient of noncompliant crossing could be determined. Since demographic information and land use characteristics were not accounted for in this project, future work should aim to incorporate these variables and determine whether they are useful covariates; if enough variables are gathered in this new dataset, then a random effects term might not be needed. Along with this, the effect of painted crosswalks on pedestrian crossing behavior should be investigated; the results from this analysis revealed that this feature was positively associated with pedestrian–vehicle conflicts, even though crosswalks are locations where pedestrians are encouraged to cross the street. This effect could be the result of changes in pedestrian behavior, such as an increase in confidence or a higher chance of engaging in risk-taking behavior, when approaching a marked crosswalk. Lastly, this study only analyzed pedestrians that crossed the street at designated pedestrian crossings and did not consider those who crossed elsewhere. Studies could be conducted to analyze the interaction severity associated with pedestrians who do not cross at signals to establish whether it is different from the interaction severity at signalized intersections.
Footnotes
Acknowledgements
The authors acknowledge Connecticut Department of Transportation and the Federal Highway Administration for funding this study.
Author Contributions
The authors confirm contribution to the paper as follows: study conception and design: J. Ivan, K. Wang, M. Auguste; data collection: O. Green; analysis and interpretation of results: O. Green, J. Ivan, M. Filipovska; draft manuscript preparation: O. Green, J. Ivan, M. Filipovska. All authors reviewed the results and approved the final version of the manuscript.
Declaration of Conflicting Interests
The authors declared no potential conflicts of interest with respect to the research, authorship, and/or publication of this article.
Funding
The authors disclosed receipt of the following financial support for the research, authorship, and/or publication of this article: This study was funded by Connecticut Department of Transportation and the Federal Highway Administration under Project No. SPR-2321.
Data Accessibility Statement
The data are available subject to approval by these project sponsors.
The findings and conclusions of this paper are those of the authors and do not necessarily represent the views of the Connecticut Department of Transportation or the Federal Highway Administration.