
Abstract
Signal retiming is a cost-effective practice to improve intersection operations through periodic updating of the timing plans. Traditionally, signal retiming has focused on vehicular-based performance (e.g., reducing vehicle delay or number of stops), while often unintentionally ignoring the needs of other users, such as pedestrians, cyclists, and transit vehicle passengers. This unintended omission is further exacerbated by the signal timing tools used in the industry, which tend to primarily report vehicular metrics. To address these challenges, this research developed a multimodal signal timing framework along with easy-to-use performance measures. These performance measures include (1) vehicle delay, (2) crosswalk delay, (3) crossing stress, and (4) bus delay. To assess the approach effectiveness, the proposed framework and the developed tools were applied to 12 intersections along the North Glebe Corridor, in Arlington, VA, for the weekday a.m. peak. Analysis results showed that the proposed framework and tools can incorporate most multimodal considerations and address the limitations of the traditional vehicle-based approaches by quantifying multimodal tradeoffs at signals. With the proposed tools, the alternative timing plan developed for the a.m. peak yielded a 4.5% improvement in performance along the corridor, versus a degradation of 3.7% if only vehicle delay was considered in the analysis. Additional sensitivity analysis conducted along the corridor using various timing plan scenarios showed that the calculated values of the measures are accurately reflecting the anticipated effects of signal timing changes that aim to improve crossing stress for non-motorized users and/or reduce their delay at the intersection crosswalks.
Keywords
Signalized intersections are typically the primary capacity bottlenecks of arterial roads. The extent of traffic congestion is largely dependent on the quality of signal timing, as inefficient timing will lead to unnecessary delay and stops at an intersection. To increase vehicular capacity and alleviate traffic congestion within the existing intersection right-of-way, signal retiming and optimization is considered one of the most cost-effective strategies. A study conducted by Skabardonis ( 1 ) found that signal optimizations can lead to approximately 25% reduction in vehicle delay and vehicle stops, based on the analysis of 76 projects.
During signal timing optimization, practitioners often aim to minimize vehicle delay or a combination of vehicle delay and number of stops. During oversaturated conditions, another commonly used objective is throughput maximization. These objectives are appropriate when the primary goal is to improve vehicle operations; however, they often, and unintentionally, may result in degraded safety and mobility for pedestrians, cyclists, and transit vehicle passengers. This unintended consequence is further exacerbated by the widely available signal timing software tools that, for the most part, exclusively report vehicular performance metrics. This limitation often results in disproportionally higher delays and safety risks to other users of the intersection, proving the business maxim that “only what’s measured counts.”
Recently, there has been a recognition by agencies for the need to design safer and convenient facilities to encourage walking and cycling and to promote public transit use. This need extends to signalized intersection and signal timing design as well. However, the lack of guidance for multimodal signal timing and evaluation makes it challenging for agencies to develop signal timing plans that balance the needs of all users of an intersection. Another challenge is the lack of performance measurement with which one can quantify tradeoffs between various modes. As a result, attempts by practitioners to improve non-vehicle experiences at signals tend to be ad hoc, and often practitioners experience push-back from citizens and decision-makers who are accustomed to accepting a solution that “optimizes” traffic as proven by a traffic analysis report. For example, the implementation of protected left-turn phases or leading pedestrian intervals (LPIs) to enhance pedestrian safety will often result in a reported drop in intersection (vehicular) performance by most software tools. This is despite that pedestrian safety may have improved considerably, especially when pedestrians are heavy users of the intersection. This points to the need for a process that can account for the tradeoffs between the user groups. Further evidence for this need is captured in the review that follows.
Literature Review
Past research has revealed a few studies that explored incorporating factors beyond vehicle mobility into the retiming of traffic signals. Stevanovic et al. ( 2 ) incorporated surrogate safety measures for vehicle-to-vehicle crashes in optimizing signal timing. That research utilized a multiple-objective genetic algorithm to identify the optimal compromise between surrogate safety and traffic efficiency. Another study investigated developing a signal timing optimization algorithm that can consider mobility, safety, and environmental measures on coordinated arterials ( 3 ). Using hill climbing and genetic algorithm techniques, the research developed an optimization methodology that considers vehicle crashes, delays, and emissions. However, their main limitation is that they both focused on vehicle mobility and safety and did not consider other users.
A few other studies attempted to incorporate multimodal perspectives for selecting the most appropriate signal timing rather than just focusing on the vehicular mode. For example, Lo et al. ( 4 ) applied multi-attribute decision-making methods to combine the effects of vehicles, pedestrians, bicycles, and transit in selecting the most appropriate signal timing. Their objective function was to minimize delay for all users of an intersection. Results from a test case study showed that the developed methods developed timing that followed general expectations with respect to cycle lengths and splits. However, an important limitation of that research is that it only incorporated multimodal mobility and did not consider the safety/risk effects of signal timing, which are of great interest to vulnerable road users. Another study by Alecsandru et al. ( 5 ) developed a tool to help select intersection signal plans that can accommodate the safety and efficiency of motorized and non-motorized users along urban arterials. The method utilized delay and perceived risk at intersection crossings as a combined performance measure. A neural-network model was defined to determine the signal timing plan that yielded the best tradeoff between vehicle delay and safety of non-motorized users. While this represents a good step toward incorporating other metrics into signal retiming, its application, like other models developed by researchers, remained rather limited because of the complexities involved during model implementation. As a result, these models have not changed the state-of-the practice with respect to multimodal signal timing and agencies have shied away from adopting them.
Another limitation in existing practice is that widely used analysis tools for signalized intersections typically only report vehicular metrics. For example, both Synchro and Vistro optimize cycle length, splits, and offsets, using only vehicle delay and stops in the objective function, without reporting pedestrian delay. Therefore, their reports would show no improvement if a walk interval were lengthened without constraining vehicle operations, even though pedestrian delay would be reduced. SIDRA offers the user a wide range of operational parameters for optimization, such as delay, queues, stop rate, emissions, and balanced degree of saturation; however, its results are limited to vehicular performance measures. Finally, the Highway Capacity Software (HCS) 2022 is consistent with other analysis tools in that it only focuses on vehicle mobility in optimizing the signal plans. To address the limitations of the state-of-the-practice, this research’s objectives are as follows:
develop an easy-to-implement multimodal signal timing guidance framework for agencies that can reflect intersection characteristics and intersection user priorities and their tradeoffs;
develop performance metrics that can support the framework and can incorporate the mobility and safety effects of traffic signals; and
apply the multimodal signal timing framework and the tools on a real-world arterial with widely varying intersection characteristics (i.e., congestion level, intersection spacing, surrounding land use, etc.).
Multimodal Signal Timing Framework Development
The second edition of the Signal Timing Manual (STM2) recognized the limitation of the historical approach to signal timing, which typically provides a solution based on vehicular needs. That approach often leads to the incorrect assumption that timing signals solely based on vehicle performance provides the optimum control solution ( 6 ). To address this limitation, STM2 recommends using an “outcome-based approach,” which encourages agencies to consider all system users during signal retiming and optimization and tradeoffs between various modes. However, while the “outcome-based approach” was conceptually promising, it lacks details with respect to multimodal signal timing and does not provide the necessary performance metrics to quantify tradeoffs between various modes.
The proposed multimodal signal timing framework in this research starts with the principles outlined in STM2 but includes additional details and performance metrics to provide a systematic multimodal signal timing method that can transform the state-of-the-practice. The developed framework is a “bottom-up” approach in which the detailed analysis starts at the intersection level before addressing corridor-level considerations (e.g., number of coordination zones, zone cycle length, etc.). This is to ensure that the desired outcomes at the intersection level are met first, such as phasing schemes and minimum cycle lengths, which then inform corridor-level decisions. Figure 1 displays the proposed multimodal signal timing framework, which includes four steps, as follows.
Define operational objectives based on intersection/corridor characteristics and user priorities.
Apply intersection treatments such as left-turn protection, LPIs, no turn on red (NTOR), and so forth. These are all based on agency practice and user needs. This step also develops phasing schemes, estimates the minimum cycle length to serve vehicle demand and pedestrians, and calculates splits using methods outlined in the HCM seventh edition ( 7 ).
Develop zones for signal coordination or make decisions to run certain intersections uncoordinated. Based on the local intersection needs identified in Step B, this step considers intersection spacing, travel demand directionality, and intersection commonalities (i.e., intersections with similar natural cycle lengths) to identify coordination zones and their cycle lengths. For intersections that are in the same zone and set for coordination, offsets are developed and analyzed in this step.
Check performance measures and re-assess outcomes to ensure they meet desired operational objectives. If some intersection needs are not met, reconsider local intersection treatments (Step B) and the designation of zones and uncoordinated intersections (Step C).
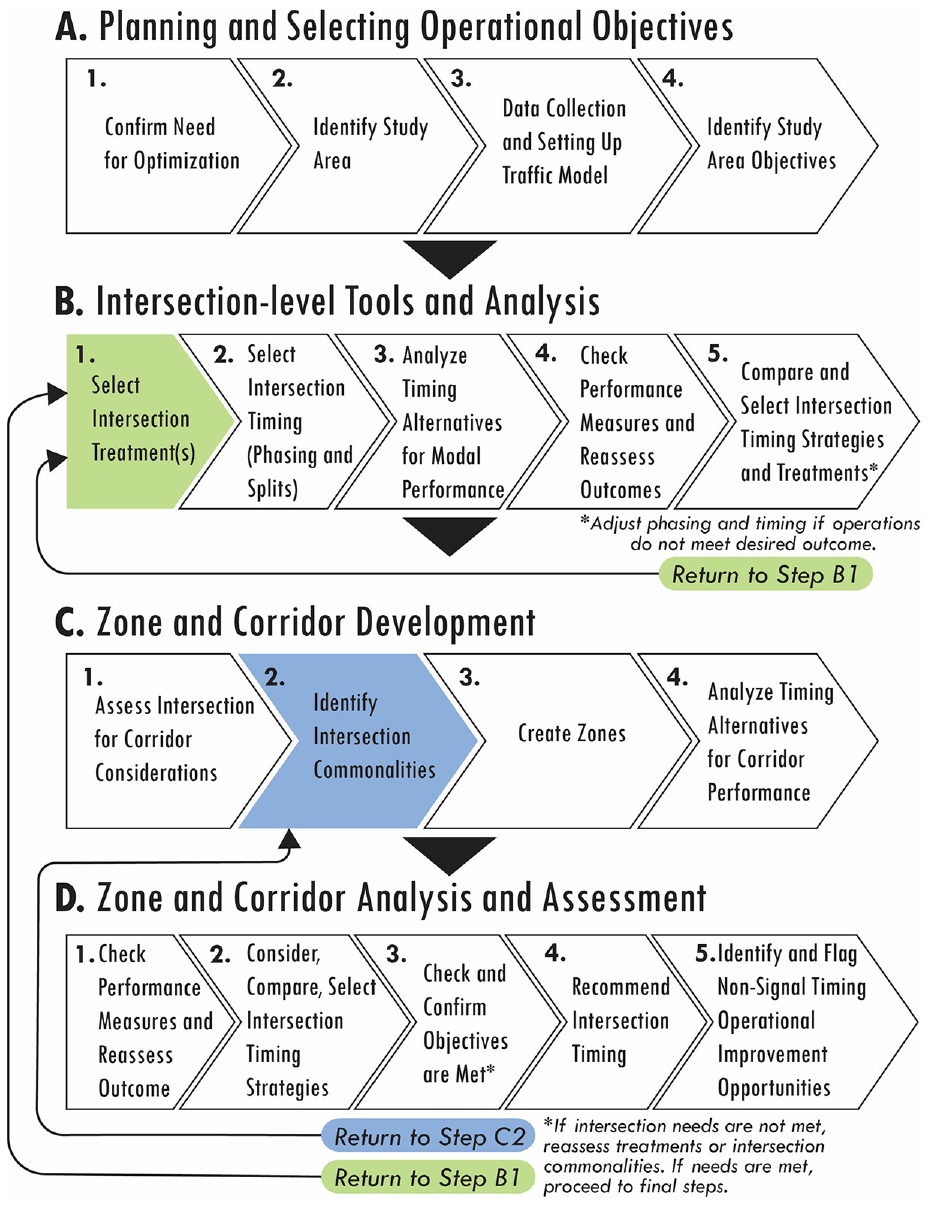
Intersection focused performance-based multimodal signal timing framework.
Performance Metrics Development
To support the framework and quantify safety and mobility tradeoffs for multimodal users, four tools were developed: (1) crosswalk delay tool; (2) crossing stress tool; (3) vehicle delay tool; and (4) bus delay tool.
Crosswalk Delay Tool
The crosswalk delay tool is a spreadsheet-based tool that estimates average pedestrian delay at each crosswalk of a signalized intersection, as well as average cyclist delay when cyclists use pedestrian signals to cross. For single-stage crossings, the tool considers the following factors:
cycle length (average cycle length when intersections are running free);
walk duration for the pedestrian phase; and
pedestrian detection mode, namely phase recall, actuated, or rest in walk (RIW).
For pedestrian phases that are on recall, the tool uses the equation given in the HCM seventh edition ( 7 ):

where C is the average cycle length and gWalk is the effective walk interval duration. The HCM seventh edition suggests including some additional walk time (of 4 s) recognizing that many pedestrians begin to cross in the first few seconds of the flashing don’t walk (FDW) interval. We also assumed the same in our calculation.
For crosswalks that are set to RIW, the tool uses the same equation given above; however, the effective walk interval is adjusted based on the actual green duration for the concurrent vehicular phase (minus the pedestrian clearance interval). Note that for intersections where RIW is actuated and intersections have low pedestrian volumes, the proposed calculation would underestimate pedestrian delay. However, because all crosswalks that run concurrently with coordinated phases are set to pedestrian recall in our test corridor, this was not an issue in our study.
For crosswalks that are pushbutton actuated, the HCM seventh edition delay formula given above will tend to underestimate average pedestrian delay, because a pedestrian arriving during the scheduled walk interval will find the pedestrian signal in its solid don’t walk state and will have to wait for the next cycle. The crosswalk delay tool recognizes this difference and applies the set of equations given in National Cooperative Highway Research Program (NCHRP) Research Report 969 ( 8 ), particularly the following.
Where pedestrian demand is low enough (i.e., fewer than one pedestrian per four cycles) such that an arriving pedestrian is likely to be the only one using that crosswalk in a cycle, average delay with pushbutton actuation is given by Equation 2:

Where pedestrian demand is high enough (i.e., three pedestrians per cycle or greater), then the pedestrian phase will come up almost every cycle, and the formula given in Equation 1 is a good approximation.
For intermediate levels of pedestrian demand, pedestrian delay can be interpolated between the results in Equations 1 and 2 using the equations given in NCHRP Report 969 ( 8 ).
Once crosswalk delay for each crossing is estimated, then the intersection level crosswalk delay is calculated by taking the root mean square (RMS). In applying the RMS formula, the final intersection crosswalk delay is more heavily weighted by those crosswalks that experience high delay, to incentivize improvements to those crosswalks. The intersection-level delay is given by the following equation:
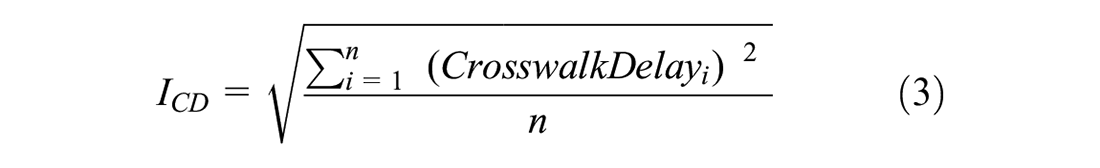
where ICD is average crosswalk delay aggregated at the intersection level and n is the number of crosswalks evaluated for the intersection.
Note that pedestrian volumes are not considered in the calculation of average crosswalk delay for two reasons: (1) agencies may not collect pedestrian volumes at each intersection; and (2) when collected, pedestrian volumes may not represent actual demand, since pedestrians tend to not use intersections that are not hospitable or comfortable for them.
Crossing Stress Tool
The crossing stress tool is a spreadsheet-based tool that approximates the safety effect of signal timing and quantifies the amount of discomfort experienced by crosswalk users. While there are many factors that affect crossing stress, the review of the literature indicated that six factors are critical ( 8 , 9 ).
i. Conflicts with right-turning vehicles: higher volumes of right-turning vehicles, permitted phases, and high-speed right turns increase the crossing stress for pedestrians.
ii. Conflicts with left-turning vehicles: a higher left-turning volume along with longer permitted phase durations increase the crossing stress for pedestrians. Turning speed, however, is not considered since there is typically less variation in left-turn speeds compared to the right-turning vehicles.
iii. Signal timing treatments to mitigate turn conflicts: certain signal timing treatments such as LPIs or delayed turns (10) can mitigate turn conflicts and thus can reduce crossing stress.
iv. Crosswalk delay: higher crosswalk delays also increase the likelihood of pedestrian non-compliance at signals and therefore increase crossing stress. It should be noted that the crosswalk delay considered here is strictly to account for the potential discomfort experienced by pedestrians.
v. Lowest pedestrian crossing speed accommodation: according to the Manual on Uniform Traffic Control Devices (MUTCD), a walking speed of 3.5 feet per second (fps) should be used to calculate pedestrian clearance times for those who begin crossing up to the last moment of the walk interval. However, research has shown that about 8% of adults 60 and younger and 26% of adults older than 60 years old walk slower than 3.5 fps (10). Therefore, the longer the walk duration at a crossing, the larger the population of pedestrians that can safely cross.
vi. Type of crossing: a multi-stage crossing can increase crosswalk delay, especially if there is no signal progression between the crosswalks, leading to pedestrian non-compliance. In addition, multi-stage crossings often result in pedestrians waiting in relatively narrow medians with traffic flowing on both sides of the refuge, increasing pedestrian stress associated with the crossing.
For conflicts with right-turning vehicles and conflicts with left-turning vehicles, intermediate calculations are needed and performed in the tool before assigning a crossing stress. In both cases, it is necessary to determine the permitted green time per vehicle (PGTV) that conflicts with concurrent pedestrians and/or cyclists to calculate the associated stress for each crossing (for turn phases that are “protected only,” the PGTV is not needed in the tool). The motivation for including this metric is that with a shorter permitted green time that conflicts with a crossing, a turning vehicle is less likely to find an acceptable gap in the opposing traffic movement. In fact, drivers will often focus on the road while searching for a gap, without paying much attention to pedestrians and cyclists. Therefore, shorter permitted green times are likely to increase crosswalk stress. For turning vehicles without any protected phase, the PGTV (seconds per vehicle) is given as follows:

where PGT is the permitted green time per cycle (seconds) for the turn movement that conflicts with the concurrent crossing and V is the hourly turn volume.
For turn movements with a protected and permitted phase, the PGTV (seconds per vehicle) is calculated based on the number of vehicles expected to turn (either right or left) during the protected phase over the course of 1 h and subtracting that from the total hourly volume of the turn movement. The total hourly permitted green time is then divided by the reduced hourly volume to calculate the PGTV. In calculating the number of vehicles turning during the protected phase, it is assumed each phase has a lost time of 4 s ( 11 ) and an adjusted saturation flow rate of 1600 vehicles per hour per lane. This calculation is given in the following equation:
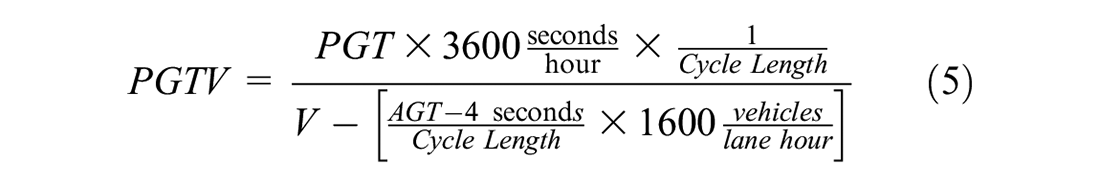
where AGT is the estimated average protected green time for the turn movement, in seconds.
Should the total turn volume be fully served during the protected phase, PGTV will take on a large value that corresponds to the lowest stress value, as shown in Table 1. Conversely, for small values of protected green time (e.g., AGT = 5 s) where less than one turning vehicle per cycle is expected to clear the intersection, the tool assumes that one vehicle per cycle clears the intersection during the protected phase and all other vehicles clear the intersection during the permitted phase. Once intermediate calculations are completed, a stress value is assigned to each crosswalk based on the factors described above. Higher values indicate higher stress.
Crossing Stress Values for the Right-Turn and Left-Turn Conflicts
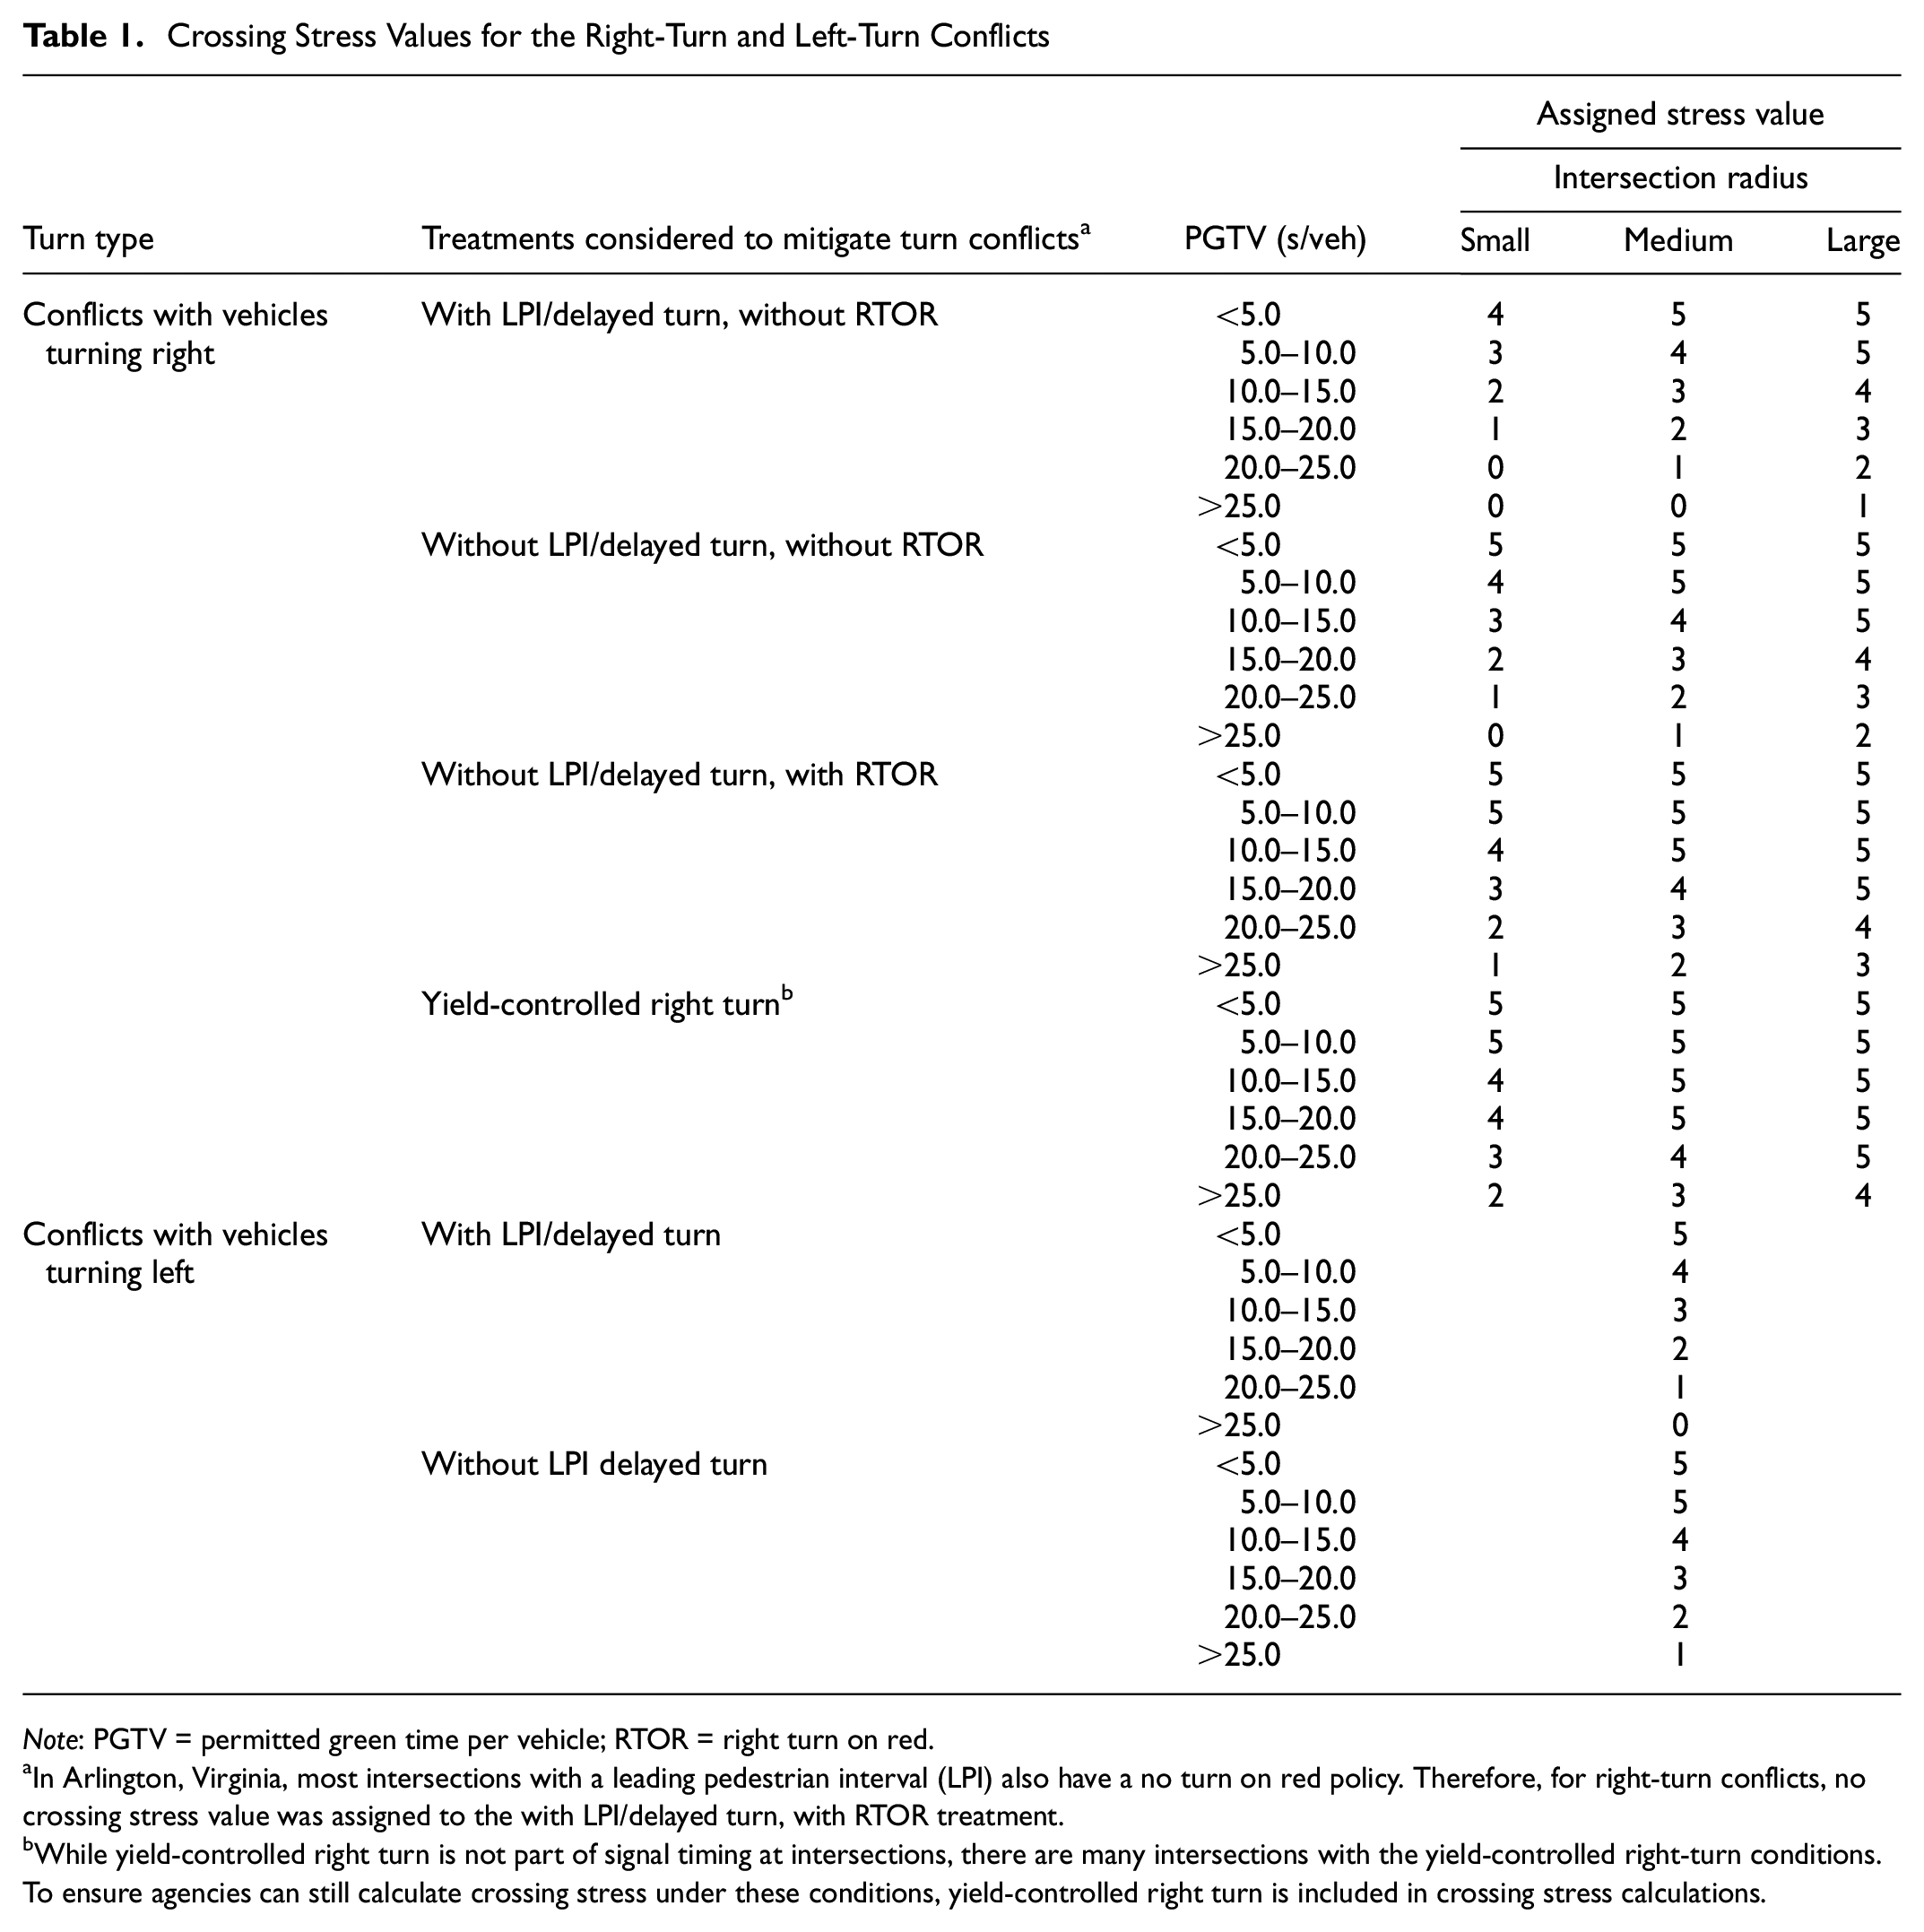
Note: PGTV = permitted green time per vehicle; RTOR = right turn on red.
In Arlington, Virginia, most intersections with a leading pedestrian interval (LPI) also have a no turn on red policy. Therefore, for right-turn conflicts, no crossing stress value was assigned to the with LPI/delayed turn, with RTOR treatment.
While yield-controlled right turn is not part of signal timing at intersections, there are many intersections with the yield-controlled right-turn conditions. To ensure agencies can still calculate crossing stress under these conditions, yield-controlled right turn is included in crossing stress calculations.
Table 1 shows the proposed crossing stress values associated with the right- and left-turn conflicts as a function of treatments considered to mitigate turn conflicts along with the PGTV. For right-turn conflicts, corner radius categories (small, medium, large) are also considered as a proxy for turn speeds. This is because a large corner radius results in higher vehicle turning speeds, and recent research shows that, all else being equal, higher pedestrian crashes are expected at intersections with an increase in corner radius ( 12 ). Note that corner radius categories are used to make the calculation simple rather than requiring an analyst to the measure corner radius and estimate the associated turn speed. For left-turn conflicts, the turning speed is not considered since left-turn speeds are typically similar at most intersections and are little influenced by the corner radius in most cases.
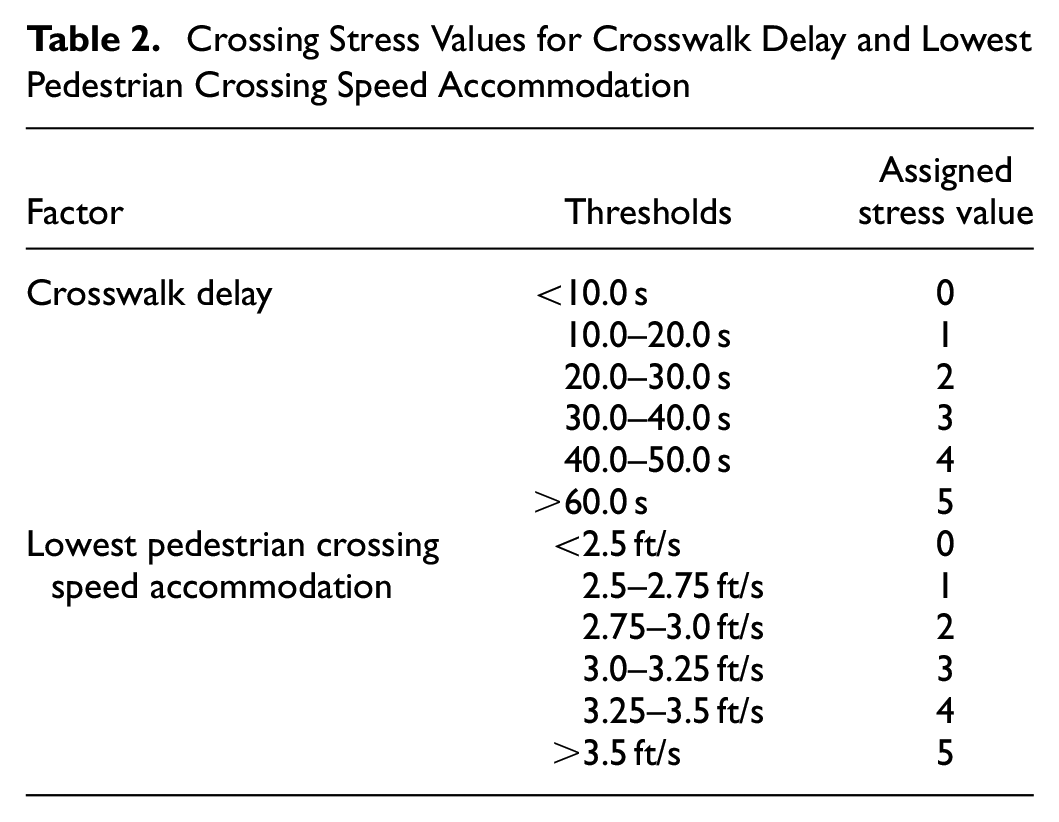
Crossing stress values for the crosswalk delay and lowest pedestrian crossing speed accommodation are provided in Table 2. For crosswalk delay, the selection of the thresholds was based on the level of service (LOS) for pedestrian delay at signalized intersections provided in the HCM 2000 (HCM7’s methodology for pedestrian LOS has other factors beyond pedestrian delay). The threshold selected for the lowest pedestrian crossing speed accommodation has an upper bound of 3.5 fps, consistent with MUTCD guidance. Finally, the method assigns a scaling factor of 1.0 for single-stage crossings and a factor of 1.2 for multi-stage crossings per the rationale explained earlier.
Crossing Stress Values for Crosswalk Delay and Lowest Pedestrian Crossing Speed Accommodation
For a given signal timing plan, the crossing stress at each crosswalk is calculated as follows:

where Ci is the crossing stress for crosswalk i, FL is the stress value associated with the conflicts with vehicles turning left onto crosswalk i, FR is the stress value associated with the conflicts with vehicles turning right onto crosswalk i, FD is the stress value associated with the crosswalk delay stress at crosswalk i, FS is the stress value associated with the lowest pedestrian crossing speed accommodation at crosswalk i, and FC is the stress value scaling factor associated with the crossing stages at crosswalk i.
Finally, the equation for calculating the intersection stress value is shown below:

where I is the intersection stress value and n is the number of crosswalks evaluated for the intersection.
By using the RMS, the final intersection stress value is more heavily weighted by the lower-performing crosswalks to incentivize improvements to those crosswalks.
Vehicle Delay Tool
The vehicle delay tool is an Excel-based spreadsheet that allows an analyst to export HCM reports from the software tool Synchro. The tool is designed such that it can export both the HCM 2000 and HCM sixth edition reports from Synchro. This is because for intersections with non-standard (NEMA) phasing, Synchro can only generate HCM 2000 reports, while all other intersections use the HCM sixth edition.
Bus Delay Tool
The bus delay tool is a spreadsheet that estimates bus delay at signalized intersections. The tool utilizes Synchro’s vehicle delay as the base value, and then adjusts it to better reflect bus operations at signals. The tool considers the following factors in estimating bus delay. Additional details with respect to the assumptions and the delay adjustments can be found in the bus delay tool documentation ( 13 ).
i Vehicle delay: at intersections where vehicles and buses share the same lanes, bus delay is heavily tied to vehicle delay. The tool uses the vehicle delay from Synchro as the basis then estimates bus delay by adjusting the vehicle delay using a series of parameter inputs by the user (discussed below).
ii. Bus stop location: at intersections with a near-side stop, previous research showed that buses experience longer delays when the approach volume-to-capacity (v/c) ratio for the bus movement is high (14, 15). To account for this, the tool applies a delay adjustment to Synchro’s vehicle delay.
iii. Bus movement turn type and phasing type: buses making a left turn during a permitted phase can be problematic since buses typically require longer gap times, thus increasing their delay. Therefore, for left-turning buses that use either a protected-permitted phase or permitted-only phase, the tool adjusts Synchro’s vehicle delay by 2.5 and 5.0 s, respectively.
iv. Bus preferential treatment type: at intersections with preferential treatments such as queue jumps or transit signal priority (TSP), bus delay can be reduced (14). This is not captured in Synchro and, thus, the tool reduces Synchro’s vehicle delay based on the presence of TSP and queue jumps.
v. Bus stop type: when buses stop in a bus bay, they may experience additional delay while merging to the general-purpose lane(s). To incorporate this, the tool increases Synchro’s vehicle delay by 5.0 s when buses stop in a bus bay.
Methodology to Integrate the Tools’ Outcomes
The proposed framework follows a “score-based evaluation method” where each tool’s output is used to generate a score based on intersection conditions during the analysis period. Scores range from 1 to 10 where a low score is assigned to low-performing intersections (i.e., high delay or high crossing stress, see Table 3). Note that in the crosswalk delay, vehicle delay, and bus delay tools, scores are anchored to the HCM’s LOS thresholds where a score of 2 is assigned to LOS F. In determining the appropriate thresholds for the crossing stress tool, a sensitivity analysis was conducted with data from five signalized intersections. The results showed the range of the intersection crossing stress to be narrow, typically averaging between 1.5 and 3.5, and thus the smaller increment of 0.25 is used for the crossing stress thresholds.
Proposed Scores Based on the Tool Outputs
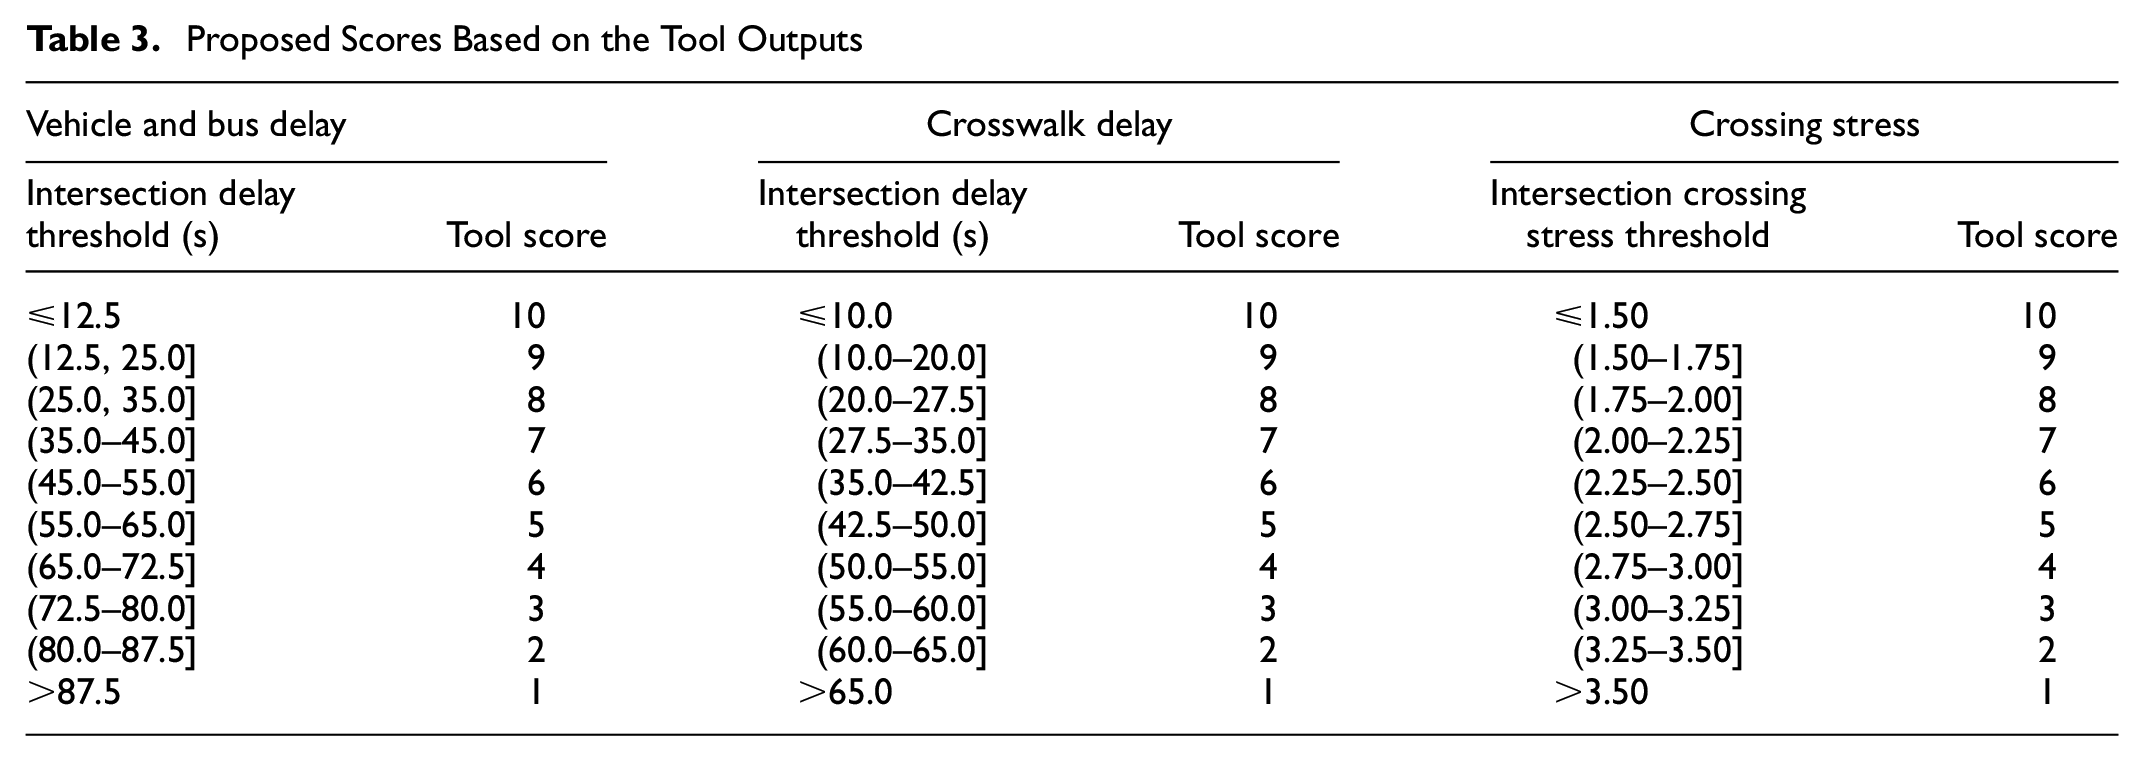
Another important consideration during the development of scores was how to define the thresholds in the crosswalk delay, vehicle delay, and bus delay tool outputs. As was shown in Table 3, smaller delay thresholds were used when intersections experience high delay. This is because improving intersections that experience high delays should be given a higher weight over intersections that already have low delay. Once the scores are generated using each tool outputs, the overall intersection score is calculated using Equation 8:
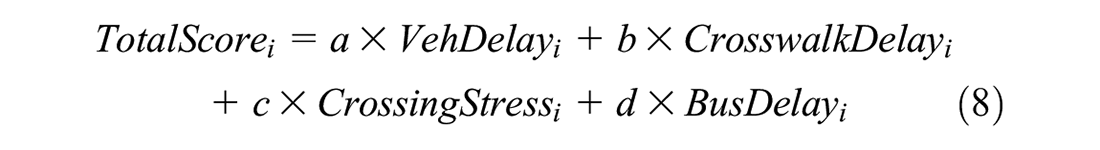
where i is the subject intersection, VehDelay, CrosswalkDelay, CrossingStress, and BusDelay are scores generated from each tool at intersection i, and a, b, c, and, d are weighting factors, as explained next.
Although the weighting factors are applied at the intersection level, they are selected and calibrated based on the desired objectives at each zone, as discussed earlier in the framework. In addition, although the weighting factors will likely vary between corridors and respective zones because of the varying intersection characteristics, the sum of the weighting factors is fixed to ensure consistency across intersections and corridors. In this application, the summation of the weighting factors is set to 4.0. Thus, if all factors are treated equally, then the weighting factors would be identical and equal to 1.0. For zones with different operating conditions and modal priorities, it is recommended that the minimum and maximum ranges for the weighting factors be set between 0.5 and 1.5 (in 0.25 increments), with the summation of the weighting factors still adding up to 4.0. Note that the recommended minimum and maximum ranges for the weighting factors as well as how they should be set was based on our judgment in this study. Therefore, further research is required to better understand the relationship between weighting factors and agencies’ desired objectives.
Once the score for each intersection is calculated, the last two steps are (a) to calculate the corridor score and (b) to normalize the total corridor score by the total number of intersections and the ideal score an intersection can achieve, as provided below:
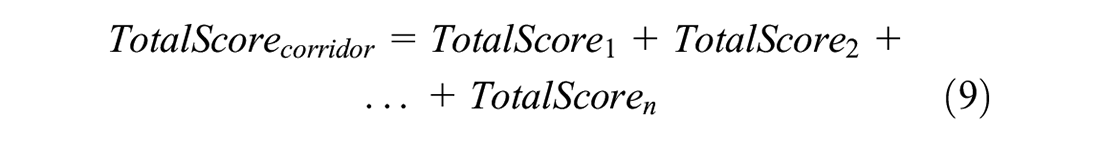
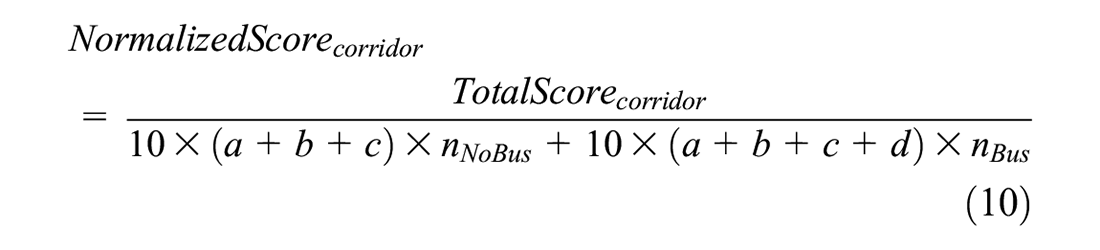
where n is the total number of intersections in the corridor, nNoBus is the number of intersections without a bus service, nBus is the number of intersections with a bus service, where nNoBus + nBus = n, and a, b, c, and d are the weighting factors, as previously discussed.
Case Study Development
The developed framework and the performance measures were applied to the North Glebe Road corridor in Arlington, Virginia, for the weekday a.m. peak hour. Figure 2 displays the study intersections and intersection spacing (in feet). This corridor was selected because of the multimodal nature of the corridor along with modal priorities that vary from one intersection to another. The corridor signal timings have also recently been optimized (to vehicle conditions), making the corridor a good candidate for comparison.
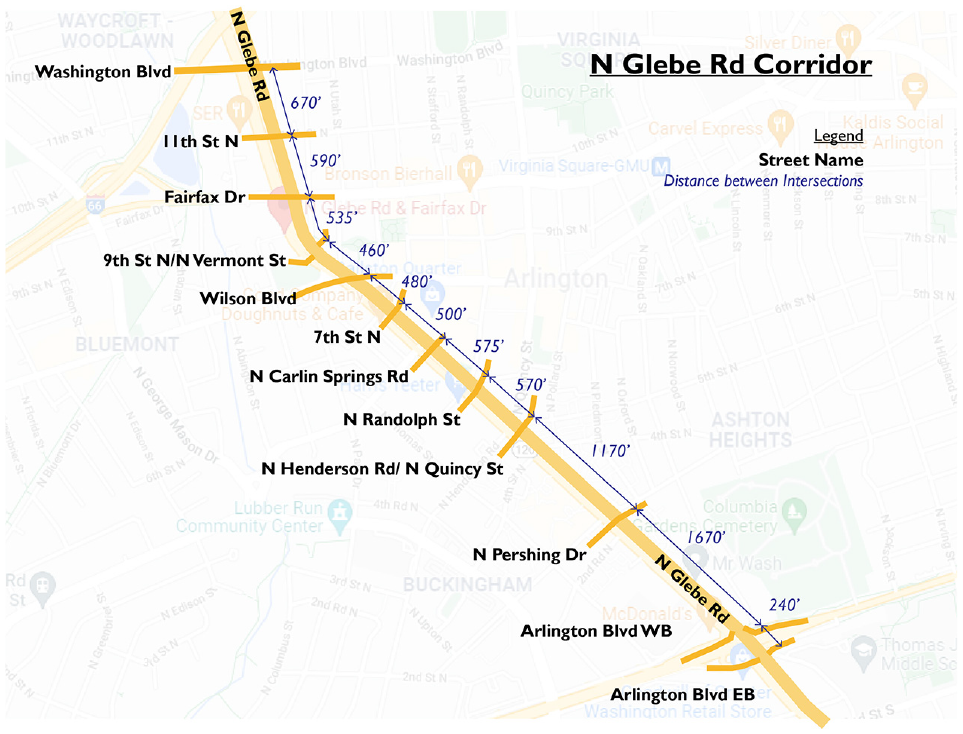
North Glebe Road corridor and study intersections.
During the weekday a.m. peak, all intersections are coordinated with a common cycle length of 140 s. In the alternative signal timing plan development, based on the direction provided by Arlington County, no phasing scheme adjustments were made to the intersections (i.e., maintained lead-lag or protected/permitted phasing at all intersections). Therefore, the only adjustments considered were changes to coordination zones and to intersection cycle lengths, splits, and offsets to enhance multimodal performance.
Figure 3 shows the alternative timing plans developed for the weekday a.m. peak. Natural cycle lengths and average vehicle delay under the existing conditions are provided as well. In the alternative timing plan, the corridor was split into three zones (Zones A–C) with lower cycle lengths compared to the existing conditions. In addition, “half-cycles” were assumed at the 9th Street N/N Vermont Street intersection. Note that Fairfax Drive and N Henderson Rd/N Quincy St intersections were not considered as part of any zones as they operate independently with a different cycle length.
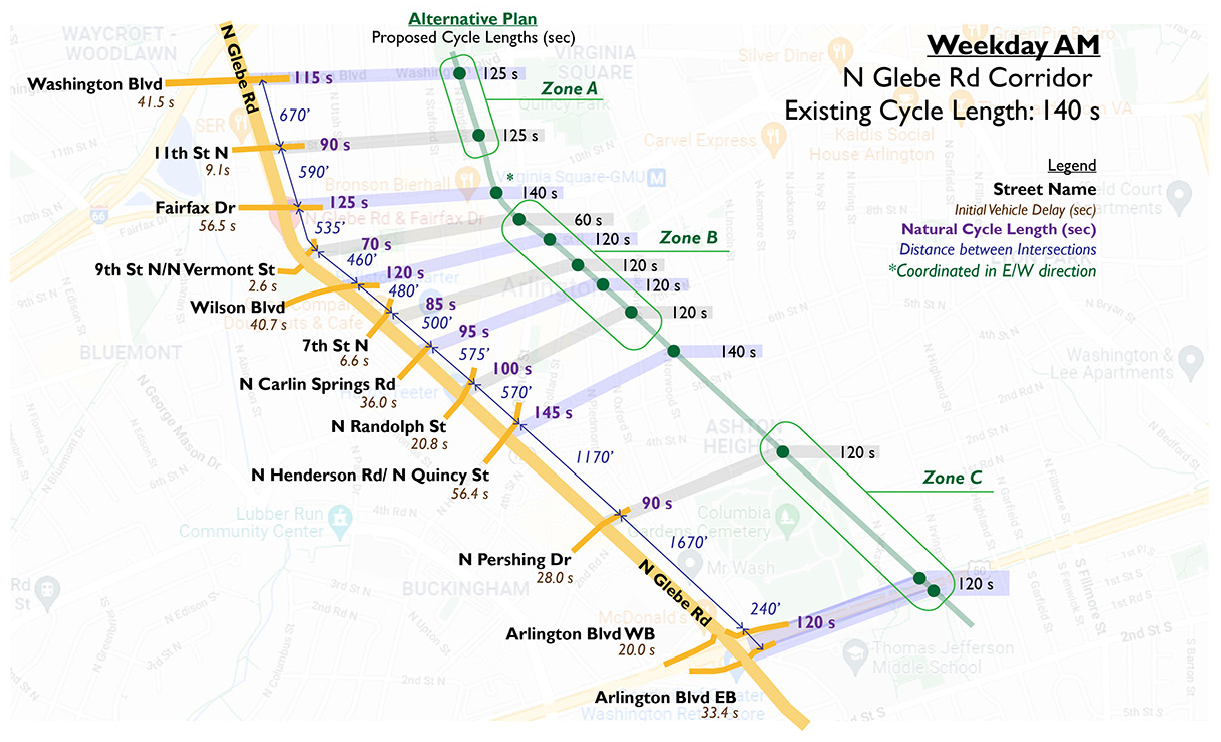
Alternative timing plan for the weekday a.m. peak hour.
Once the zones were defined, the following weighting factors were selected based on the feedback received from Arlington County:
Zone A: a = 0.75; b = 0.75; c = 1.25; d = 1.25;
Zone B: a = 0.75; b = 0.75; c = 1.25; d = 1.25;
Zone C: a = 1.25; b = 0.75; c = 1.00; d = 1.00.
These factors resulted in certain adjustments to the initially assumed cycle lengths and coordination zones to account for priorities. For example, we assumed the intersections in Zone C to be coordinated to provide progression and more green time for through vehicles, since there is a higher weight for vehicle delay even though intersection spacing and natural cycle lengths could allow running these intersections free.
Analysis Results
Figure 4 shows the normalized scores for each zone and for the total corridor under the existing and alternative timing plans during the a.m. peak hour. The alternative timing plans improved multimodal conditions for each zone, leading to a 4.5% increase in performance for the entire corridor. Note that if only vehicle delay scores were used with the same timing plans, the corridor operational performance would decrease by 3.7%. These results confirm the effectiveness of the tools and verify their ability to incorporate and quantify the mobility and safety effects for all intersection users.
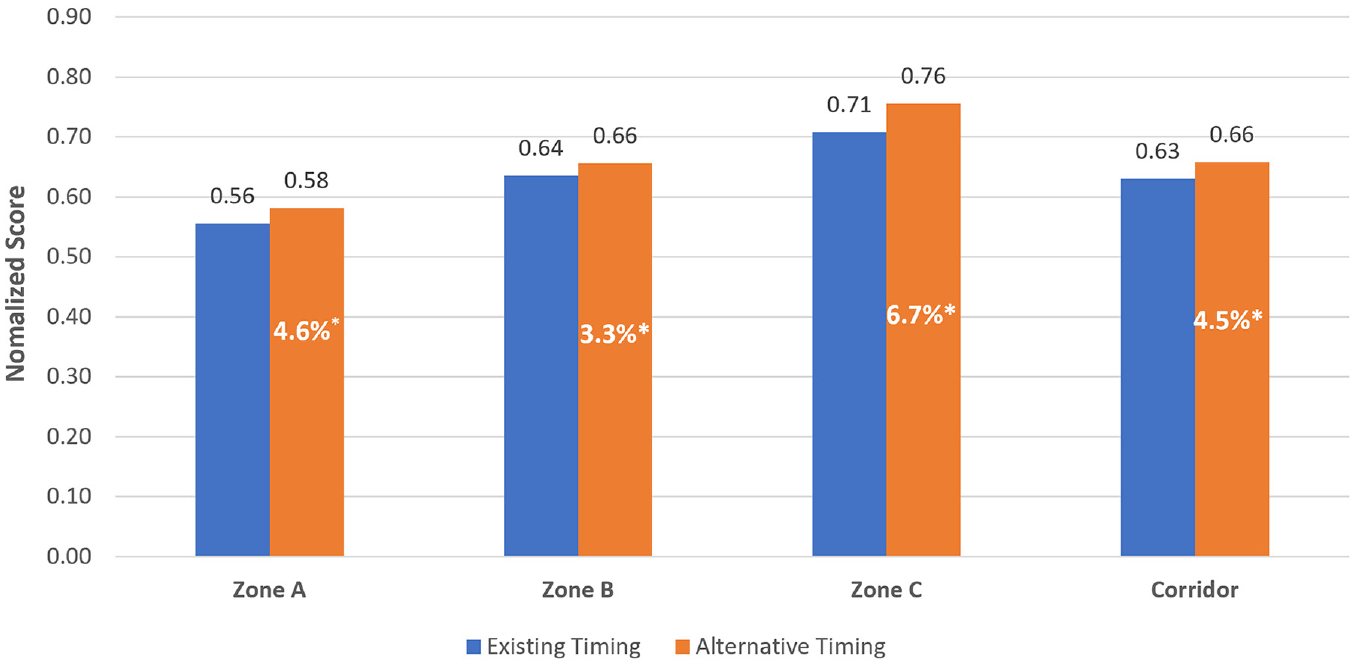
Normalized score for each zone and the corridor under the existing and alternative timing plans during the a.m. peak hour.
Since the alternative timing did not include phasing adjustments to reduce crossing stress, a sensitivity analysis was conducted in which five timing scenarios are tested.
Timing plan 1 (TP1): existing a.m. timing plan with a 140-s cycle length, with RIW for coordinated phases.
Timing plan 2 (TP2): existing a.m. timing plan but without RIW for coordinated phases.
Timing plan 3 (TP3): fully actuated, free operation, to test shorter cycle lengths.
Timing plan 4 (TP4): existing a.m. timing plan, but with added pedestrian protection (e.g., NTOR, protected turn phases) to reduce crossing stress.
Timing plan 5 (TP5): existing phasing scheme with RIW for coordinated phases, but with a cycle length of 170 s.
Table 4 shows the results of the sensitivity analysis. Various weighting factors were also tested to investigate whether they can accurately reflect the anticipated effect of each timing plan. When only vehicle delay is considered, the existing timing (TP1) and the longer cycle length scenario (TP5) outperform TP3 and TP4. This outcome is expected because running intersections in free mode (TP3) typically reduces the cycle length but also increases vehicle delay because of the lack of coordination, thereby degrading performance. In the added pedestrian protection scenario (TP4), green times for turning vehicles are reduced to provide protection, leading to higher vehicle delay. In addition, excessively long cycle lengths typically do not bring any additional benefit since headways increase with long green times because of queue interactions (queue spillback and departing turning vehicles), offsetting the benefit of longer cycle lengths ( 16 ). Therefore, TP5 performs the same as the existing timing plan.
Sensitivity Analysis of Normalized Scores with Varying Weighting Factors and Timing Plans
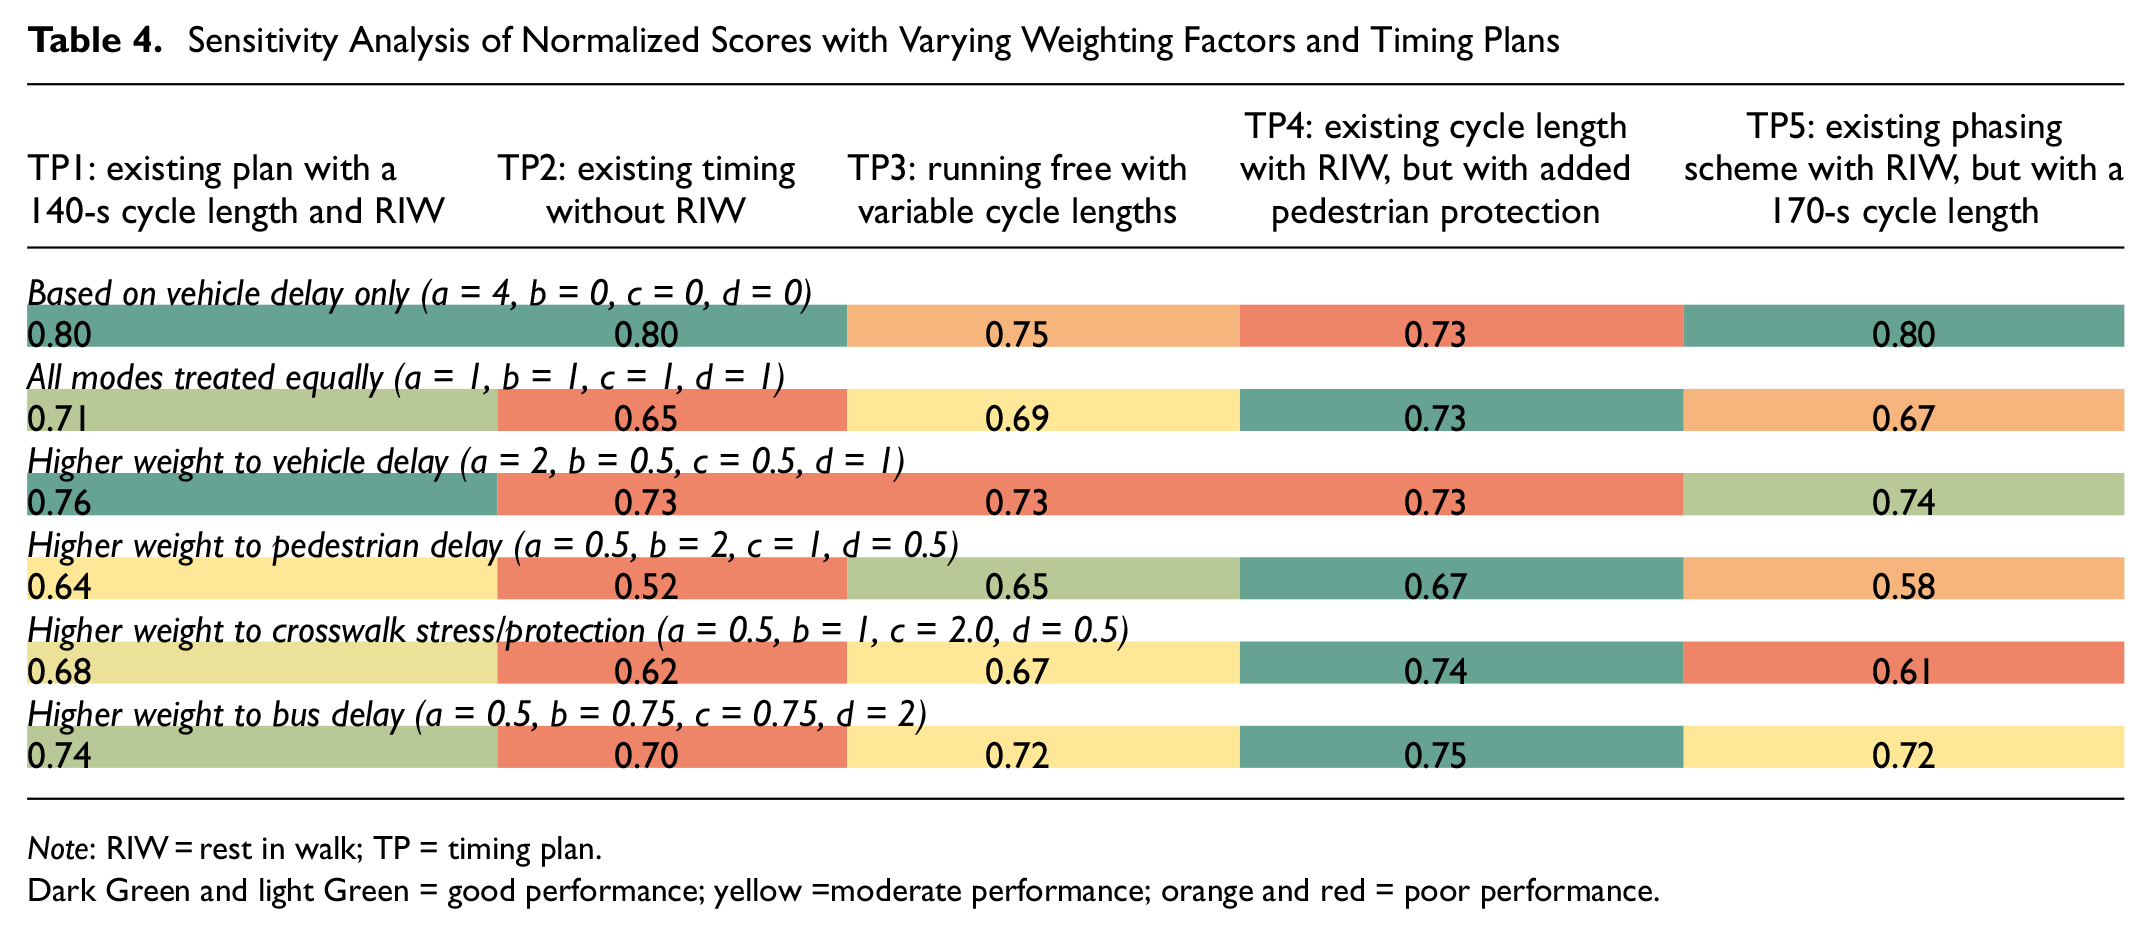
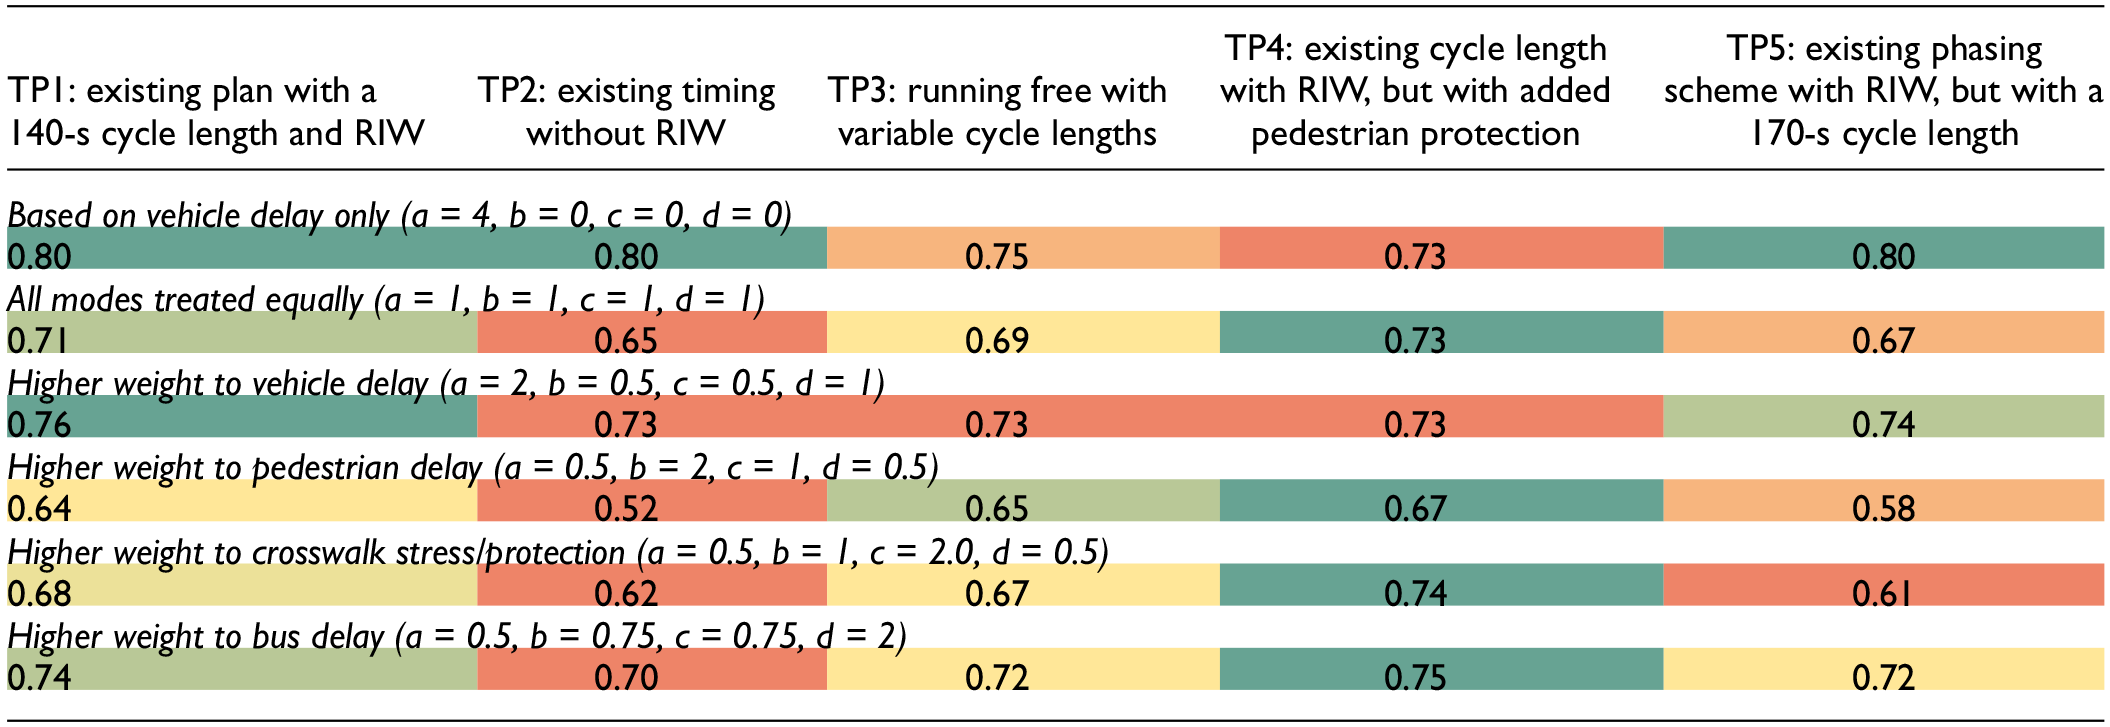
Note: RIW = rest in walk; TP = timing plan.Dark Green and light Green = good performance; yellow =moderate performance; orange and red = poor performance.
When all modes are treated equally, however, the existing cycle length with more protected phases (TP4) performed the best. This can be attributed to the considerable reduction in crossing stress while causing only a small degradation to vehicle delay. Another interesting result is the score with the running free alternative (TP3) when all modes are treated equally. Here, pedestrian delay improvements were not as large compared to the existing timing plan because of the presence of the RIW. With coordinated phases, RIW can increase the walk duration considerably for pedestrians, and thus reduce their delay. With free running intersections, pedestrian delay is reduced for pedestrians crossing the mainline because of the shorter cycles. Pedestrians crossing side streets, however, experience a delay increase (compared to the existing timing plan) because of the elimination of RIW. As a result, when all factors have the same weight, the running free scenario performs slightly worse than the existing one (0.69 versus 0.71) and performs only slightly better when a higher weight is given to pedestrian crosswalk delays (0.65 versus 0.64). The effect of RIW can also be observed from the TP2 scenario. Without RIW, when all modes are treated equally, the existing timing performs worse than all other scenarios and significantly worse when higher weight is given to pedestrian delay because of large delays for both pedestrians crossing the mainline and side street.
When higher weight is given to crosswalk protection, the existing cycle length with more protection scenario (TP4) again performs the best by providing good protection and acceptable service for vehicles with a small impact on vehicle delay. Finally, when higher weight is given to bus delay, the difference in score was relatively small across the board. This can be explained by buses operating both on the mainline and on side streets along this corridor. As a result, improving mainline conditions increased vehicle (and bus delay) for side streets and vice versa.
Summary and Conclusions
Signal timing design in the U.S.A. is strongly oriented toward minimizing delay for vehicles, often leading to suboptimal conditions for other intersection users. The issue is further exacerbated by signal timing tools used in the industry tending to only report vehicular metrics. As a result, the lack of analytical tools and non-vehicular performance measures limit practitioners’ ability to implement solutions that can address the need of multimodal users, and where solutions are implemented, they tend to be on an ad hoc basis. To address these challenges, this research developed a multimodal signal timing framework along with easy-to-use performance measures. These performance measures include (1) vehicle delay, (2) crosswalk delay, (3) crossing stress, and (4) bus delay. The framework and the performance measures were tested on a real corridor in Arlington, Virginia. Sensitivity analysis was also conducted to test various boundary conditions. Analysis results showed the proposed framework with the multimodal performance metrics allow explicit tradeoffs between various intersection users in the timing plan development. This will allow agencies to establish a systematic framework that can incorporate the needs of all intersection users by leveraging measures that are quantified, reported, and that can be mathematically optimized. Note that this research tested the developed methodology by comparing the changes in intersection performance (by quantifying delay for multimodal users and crossing risk). However, future research efforts could investigate benefit–cost tradeoffs between applying the analysis methodology and the retiming tools developed in this paper and the traditional timing methods.
Footnotes
Author Contributions
The authors confirm contribution to the paper as follows: study conception and design: B. Cesme, A. Hayes, S. Wang; data collection: A. Hayes, S. Wang, A. Root, K. Bhagat; analysis and interpretation of results: B. Cesme, A. Hayes, S. Wang, S. Warchol, A. Root, K. Bhagat, N. Rouphail; draft manuscript preparation: B. Cesme, S. Warchol, N. Rouphail. All authors reviewed the results and approved the final version of the manuscript.
Declaration of Conflicting Interests
The author(s) declared no potential conflicts of interest with respect to the research, authorship, and/or publication of this article.
Funding
The author(s) received no financial support for the research, authorship, and/or publication of this article.