
Abstract
This study assessed the viability of utilizing post-processed bagasse ash (PBA) along with Class F fly ash (FA) to partially replace cement in engineered cementitious composites (ECCs). Field-collected sugarcane bagasse ash was processed by sieving, burning, and grinding to produce PBA. Cement replacement with supplementary cementitious materials (SCMs) was kept constant at 60% (by mass) in all composites. However, the composition of the SCMs was varied as follows: (1) 100%FA as control; (2) 75%FA/25%PBA; (3) 50%FA/50%PBA; (4) 25%FA/75%PBA; and (5) 100%PBA. Fresh and hardened properties of the composites were evaluated through a flow table, uniaxial tensile tests, surface resistivity, and compressive strength. Furthermore, single-crack tensile tests were conducted to evaluate fiber-bridging properties, and fracture toughness tests were conducted to determine fracture toughness. Results showed that the incorporation of PBA decreased workability. Furthermore, using PBA produced a negligible impact on the compressive strength, yet significant improvements in surface resistivity. Whereas the tensile strain capacity of the composites decreased for PBA contents greater than 25%, the tensile strength was not significantly affected. The decrease in ductility was mainly attributed to the decrease in pseudo-strain-hardening performance indexes. Overall, results suggest that producing ECCs using combined systems of FA and PBA as partial cement replacement is feasible. Yet, achieving high ductility of the composites is challenging when utilizing high content of PBA (i.e., more than 25% of FA replaced with PBA by mass).
Keywords
Engineered cementitious composites (ECCs) are concrete materials that exhibit a characteristic strain-hardening behavior via a multiple steady-state microcracking referred to as pseudo-strain hardening (PSH) ( 1 ). ECCs are carefully designed based on fracture mechanics and micromechanics concepts to display high tensile ductility (i.e., tensile strain capacity ranging from 1% to 8%, yet more commonly 2%–5%) at a relatively low fiber content (i.e., ≤2% volume fraction) ( 2 ). ECCs exhibit tight cracks (i.e., typically below 100 µm) and, thus, are expected to enhance the durability of civil infrastructure ( 3 ).
Two design criteria—the strength criterion and the energy criterion—must be fulfilled for robust PSH behavior to occur in ECCs (
4
,
5
). The strength criterion necessitates, on any crack plane, the matrix’s first-cracking strength (
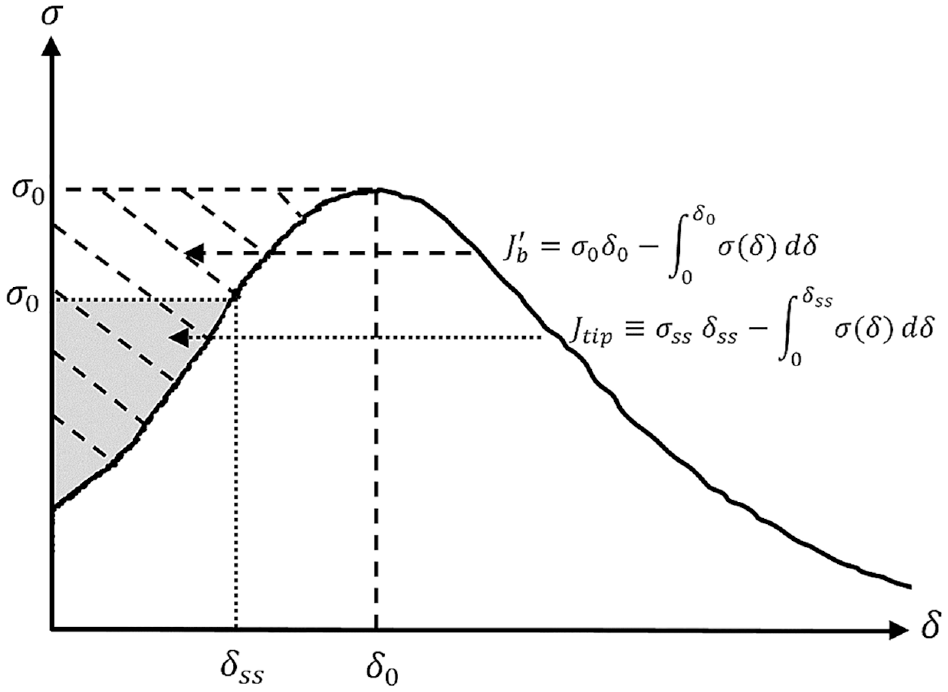
Fiber-bridging relation of engineered cementitious composite mixtures (the shaded area is illustrative of
Based on the ECC design criteria, a cementitious matrix with low matrix toughness is conducive to robust PSH behavior. Therefore, a key element in the manufacture of ECCs is the use of ultra-fine aggregate, which lowers the matrix fracture toughness and improves fiber dispersion (
7
,
8
). Consequently, ECC formulations avoid the use of coarse aggregates and typically use artificial sand with an average particle size of 110 to 150 µm (
9
,
10
). Because coarse aggregate is not used, ECC mixtures have a higher cement content than conventional concrete, ranging between 830 and 1200 kg/m3 (
11
). The high cement content can lead to high hydration heat and drying shrinkage, which is undesirable (
12
,
13
). In addition, using a high content of Portland cement in ECCs increases their carbon footprint and embodied energy, which negatively impacts the environment. To enhance the greenness of ECC materials, various studies have assessed the use of SCMs to partially replace cement (
11
,
14
). Furthermore, some studies have produced a new class of cement-free composites using geopolymers as a binder (
15
,
16
). Nonetheless, the partial substitution of cement with substantial amounts of Class F fly ash (FA) is common in the production of cost-effective and environmentally friendly ECC with high ductility (
11
). The use of FA as SCMs in ECCs has proved effective in decreasing the fiber/matrix interface chemical bond (increasing
In this study, sugarcane bagasse ash is proposed as an alternative SCM to partially replace FA in ECCs. Bagasse ash is an agricultural by-product produced by burning sugarcane bagasse, which remains after the processing of sugarcane for juice extraction (
18
). Nearly 17.1 million tons of bagasse ash could be produced each year globally (
19
). The presence of pozzolanic components (i.e., mainly silica and alumina) in bagasse ash gives it potential to be employed as an SCM (
20
). The existing literature shows that the further processing of bagasse ash produced in sugar mills by burning and grinding can yield a material comparable to FA (i.e., a silica and alumina-rich material with small particle size and low carbon content) (
20
). Therefore, post-processed bagasse ash (PBA) is a promising material to be used as SCM in ECC mixtures. In a recent study, the authors evaluated the feasibility of developing ECCs using PBA as a partial replacement to cement (at 40%, 50%, and 60% replacement levels by mass) (
21
). The study revealed that the use of PBA improved fiber/matrix interface properties (i.e., increase
Materials and Methods
Materials
Type I ordinary Portland cement (OPC), Class F FA, river sand, potable water, and polyvinyl alcohol (PVA) fibers were utilized in the manufacturing of ECCs. While river sand had an average particle size of 474 µm, FA had an average particle size of 11.2 µm. The particle size distribution of river sand and FA is presented in Figure 2. To obtain the necessary workability of the composites, a high-range water reducer (HRWR) was utilized. In all the mixtures, non-oil-coated PVA fibers with a diameter of 38 µm, a length of 8 mm, and tensile strength of 1600 MPa were employed. The morphology of FA investigated by scanning electron microscopy (SEM) imaging is presented at low and medium magnification in Figure 3, a and b , respectively. The majority of FA particles appear to be spherical in shape. X-ray fluorescence (XRF) was used to assess the chemical composition of cement and FA and is presented in Table 1a.
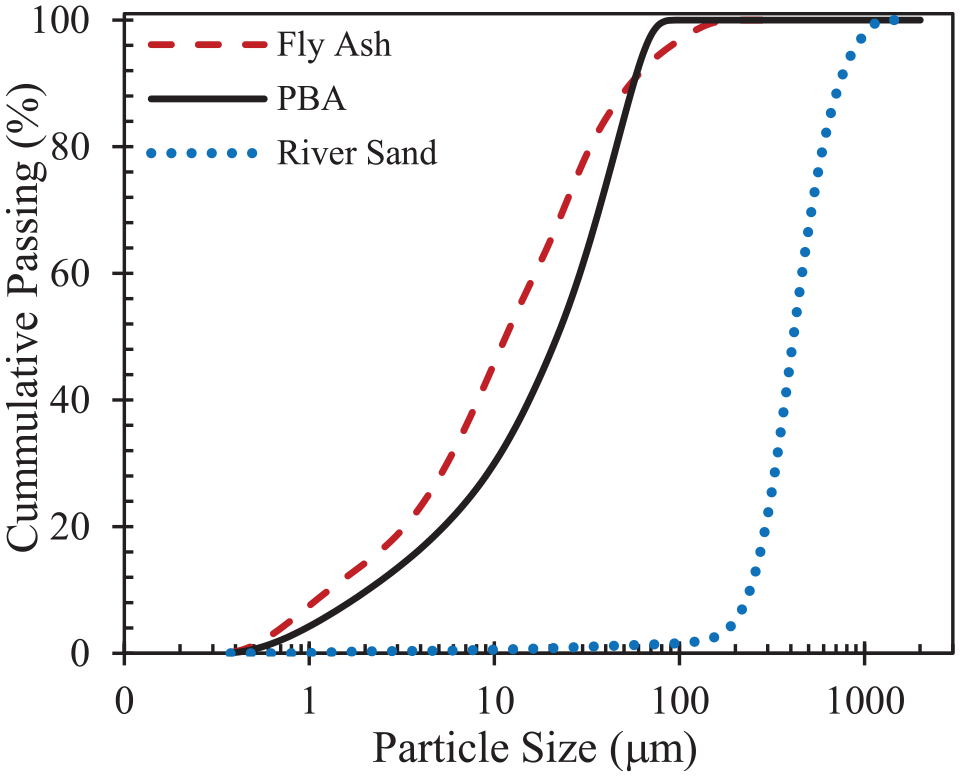
Particle size distribution of fly ash, post-processed bagasse ash, and river sand.
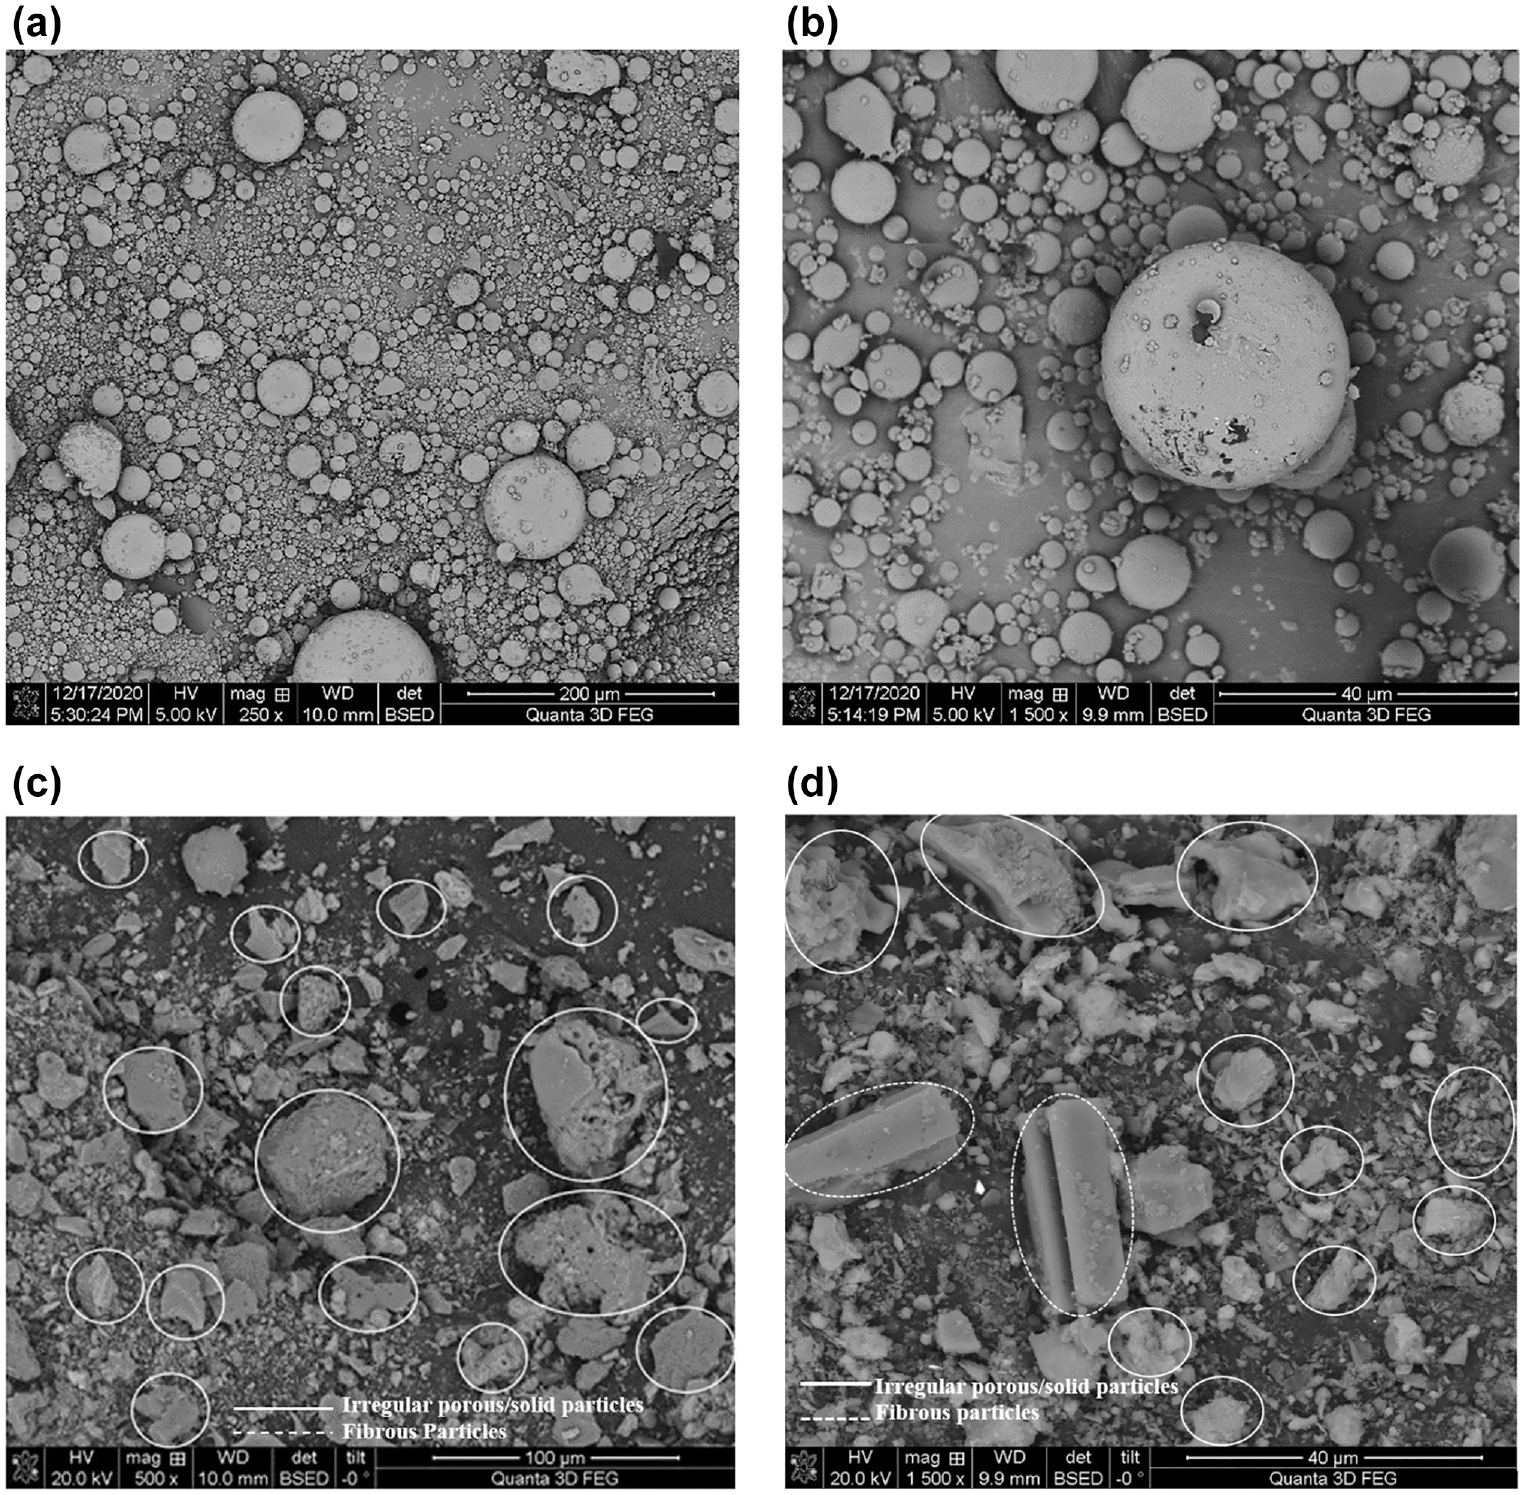
Scanning electron microscopy images of fly ash and post-processed bagasse ash (irregular porous/solid particles identified by solid lines and fibrous particles by dotted lines): (a) fly ash at 250x magnification factor, (b) fly ash at 1500x, (c) post-processed bagasse ash at 500x, and (d) post-processed bagasse ash at 1500x.
(a) Oxide Composition (Mass %) and LOI of Cement, FA, and PBA
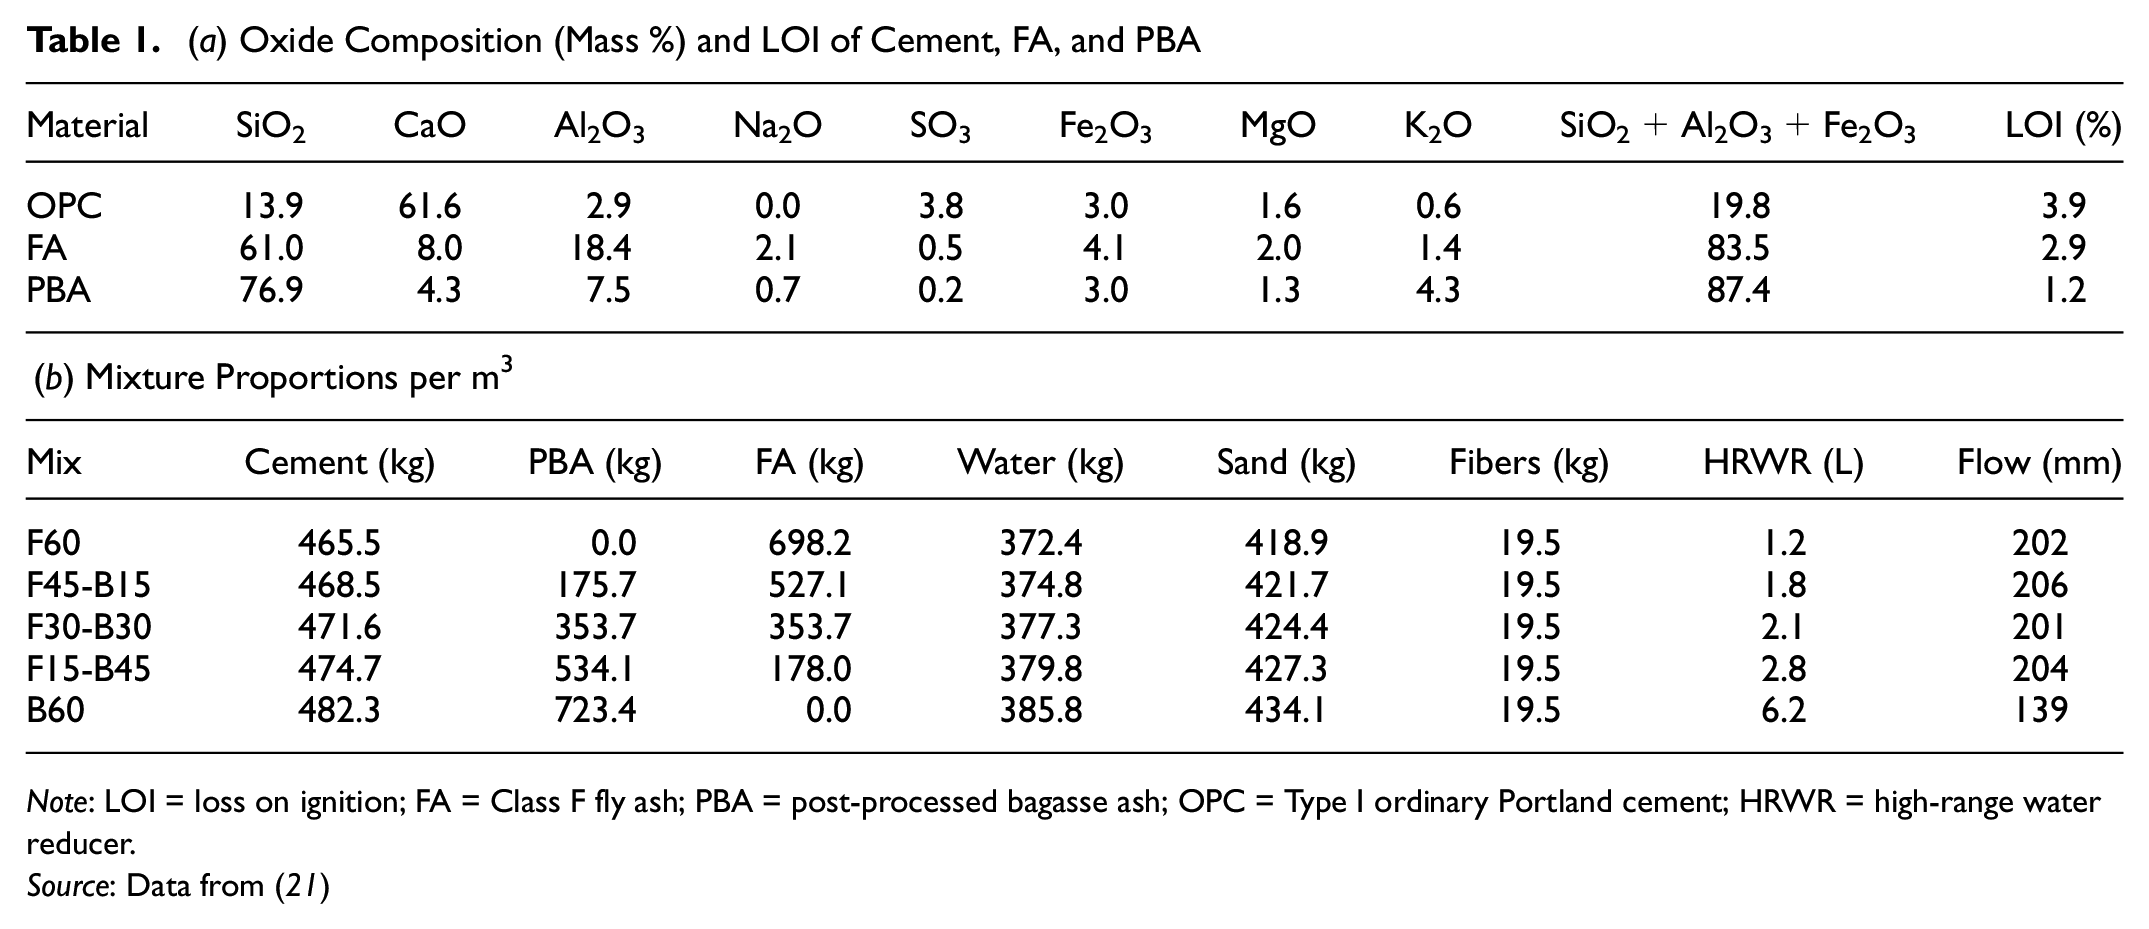
Note: LOI = loss on ignition; FA = Class F fly ash; PBA = post-processed bagasse ash; OPC = Type I ordinary Portland cement; HRWR = high-range water reducer.
Source: Data from ( 21 )
In addition to FA, bagasse ash collected from a Louisiana sugar mill was used as a SCM after post-processing. The collected bagasse ash was sieved initially utilizing a No. 20 sieve to remove coarse particles and later calcinated at 450°C for 3 h to reduce carbon content following a previous study ( 21 ). The loss on ignition (LOI) of the as-received bagasse ash was 11.4% and reduced to 1.2% after calcination, thus indicating a considerable loss of carbon impurities. The loss of carbon was also noticeable by simple visual inspection because the bagasse ash color changed from black to light brown after calcination (as shown in Figure 4, a and b , respectively). Finally, using a jar mill, the bagasse ash was ground for 35 min at 300 rpm. The material produced after post-processing is referred to as PBA hereinafter. The post-processing procedure is depicted in Figure 4c.
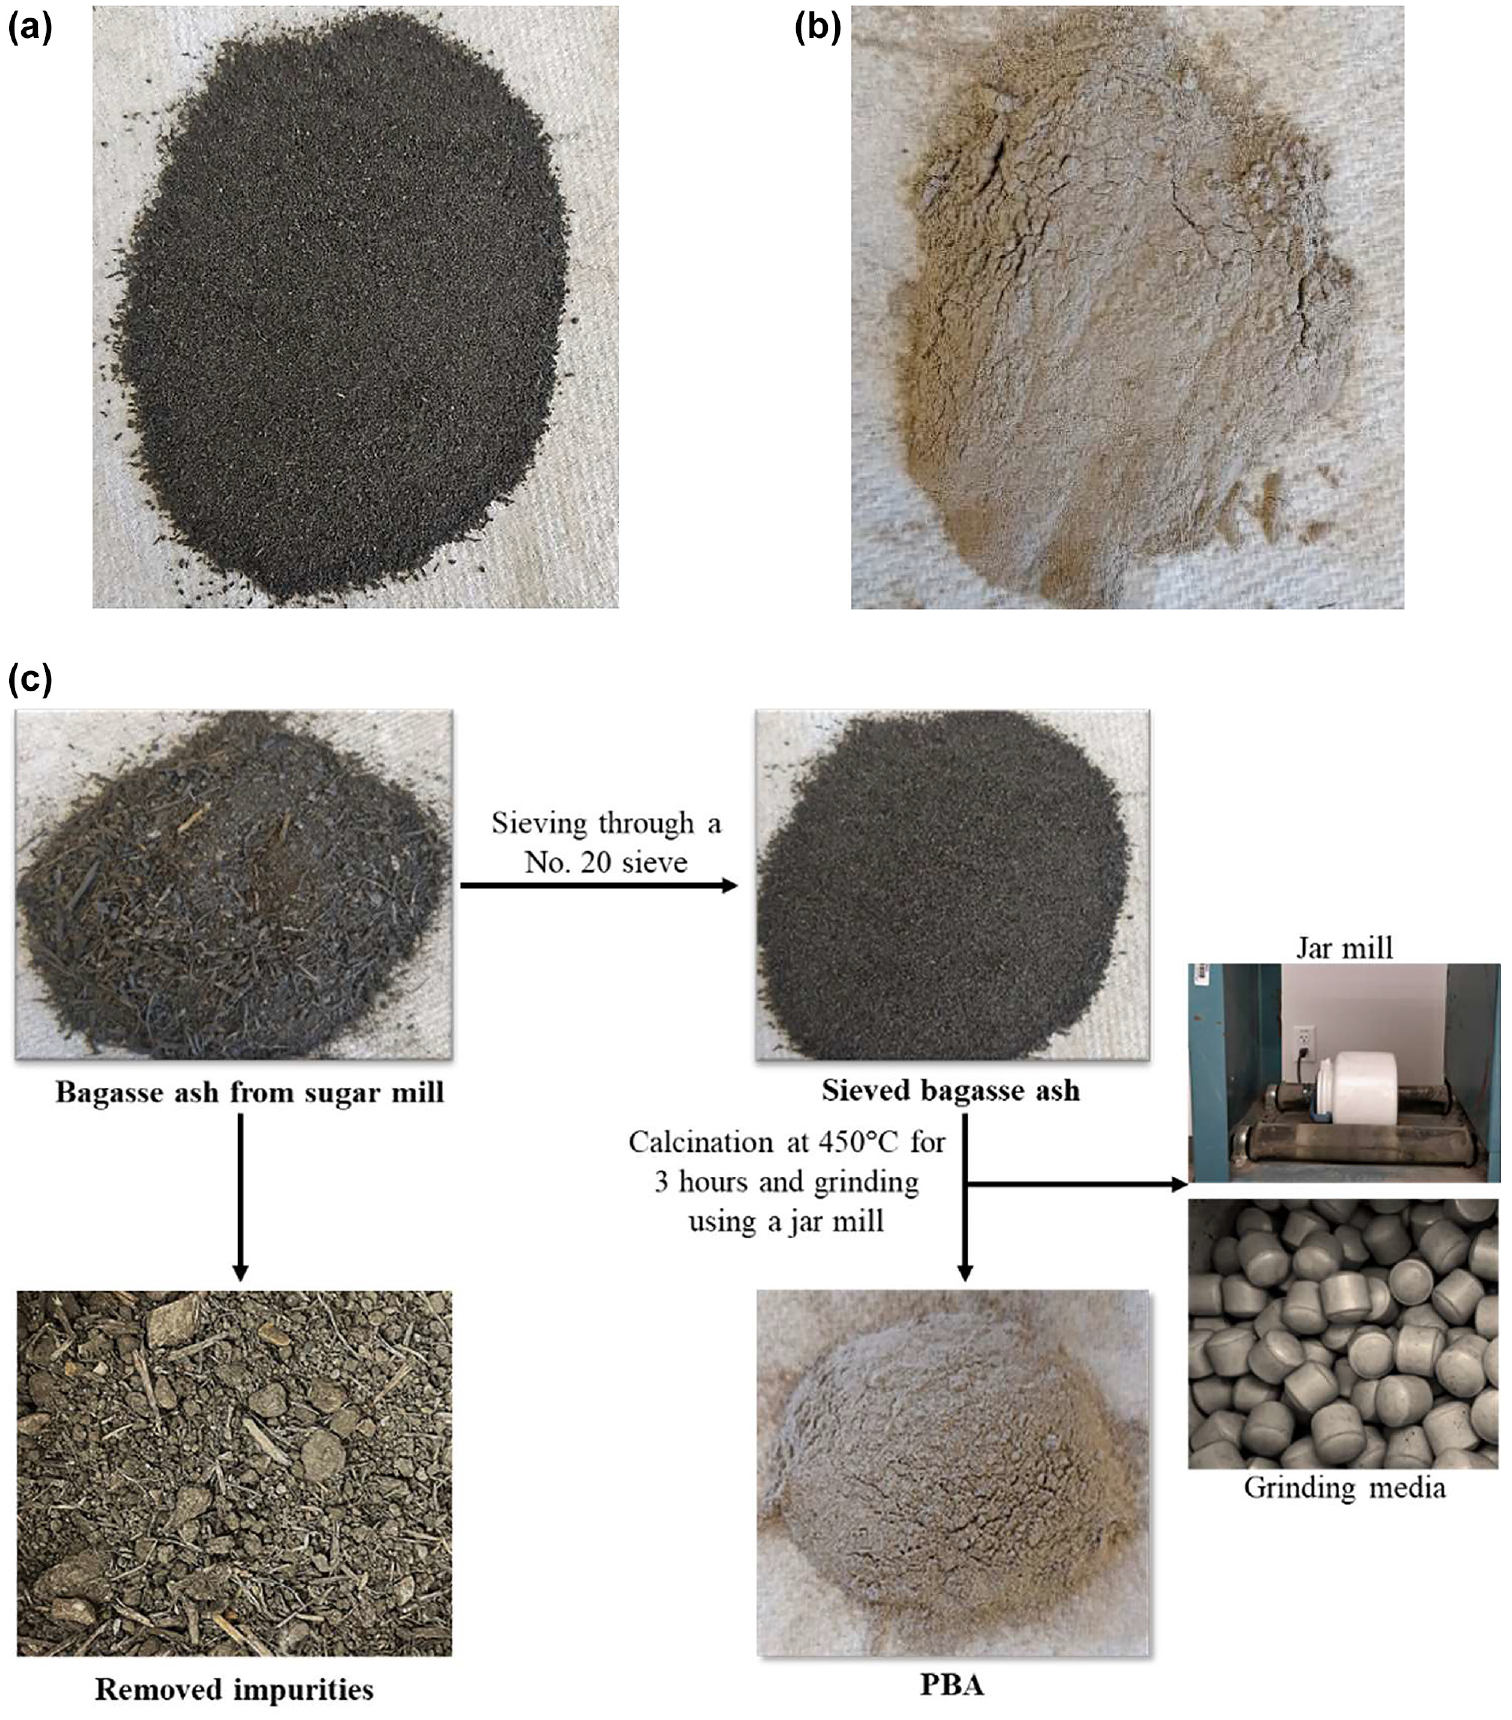
Materials: (a) bagasse ash before calcination, (b) bagasse ash after calcination and grinding (PBA), and (c) processing methodology of PBA.
The chemical composition of the PBA achieved via XRF is presented in Table 1a. PBA mostly consisted of silica and had an oxide composition similar to FA. Interestingly, the sum of iron oxide (Fe2O3), alumina (Al2O3), and silica (SiO2) in PBA (i.e., 87.4%) was slightly higher than that of FA (i.e., 83.5%). The 28-days strength activity index (SAI) of PBA was 78.9%. PBA presented a particle size distribution similar to FA, with a mean particle size of 20 µm. Notwithstanding the similarities, FA and PBA showed an entirely different morphology. SEM images of PBA at low and medium magnification are shown in Figure 3, c and d , respectively. As presented in Figure 3c, PBA mainly consists of porous and solid irregular particles (identified by solid line ovals in Figure 3) and fibrous particles (identified by dotted line ovals in Figure 3), with some of the solid particles exhibiting a prismatic-like morphology. A few spherical particles were also observed. According to the literature, the prismatic particles and irregular particles are indicative of crystalline silica and amorphous silica, respectively ( 22 ). Overall, PBA satisfied requirements for LOI (i.e., ≤6%), SO3 (i.e., ≤5%), the sum of silica, alumina, and iron oxide (i.e., ≥70%), and SAI (i.e., ≥75%) for Class F fly ash per ASTM C618, thus indicating that PBA is a suitable alternative to FA for use as SCM in ECC mixtures.
Mixture Proportions and Preparation
Five mixtures were considered in this study. All materials incorporated SCMs at 60% of cement replacement by mass. The control mixture in this study was a mixture with 60% of cement replaced with FA. The remaining mixtures replaced 25%, 50%, 75%, and 100% of the FA with PBA by mass. The fiber volume fraction for all mixtures was kept at 1.5%. In addition, water-to-binder and sand-to-binder ratios were 0.32 and 0.36 for all the composites. Table 1b shows the mixture proportions of the composites evaluated in the current study. Mixtures were labeled as FY-BZ for ternary mixtures and FY or BZ for binary mixtures, where Y and Z denote the percent replacement of cement (by mass) with FA and PBA. Mechanical, physical, fiber-bridging, and matrix properties of F60 and B60 mixtures were evaluated in an earlier study by Subedi et al. ( 21 ). Conversely, mixtures F45-B15, F30-B30, and F15-B45 were produced and evaluated in the present study.
The HRWR dosage was modified for the different mixtures to obtain proper workability for material processing. Overall, a progressive decrease in workability was observed with the increase in FA replacement level with PBA, thus leading to the necessity of a higher dosage of HRWR. The higher water requirement of mixtures using PBA is likely because of porous irregular particles (as presented in Figure 3). The impact of PBA on the workability was assessed as per ASTM C1437. Table 1b presents the spread diameter for all the composites. F60 exhibited a flow diameter of 202 mm, which decreased to 139 mm for B60 (even with a substantial increase in HRWR dosage), thus indicating a marked loss in workability when replacing all FA with PBA. Notably, for the ternary systems (i.e., F45-B15, F30-B30, and F15-B45), the negative impact of PBA on the flowability was significantly reduced. Figure 5 presents the mixtures after the flow table test. From Figure 5a, it is evident that F60 presented a good flowability, whereas, as shown in Figure 5e, a significant fiber clumping was present in the B60 mixture because of its poor flowability. However, none of the ternary mixes showed any evidence of fiber clumping, as seen in Figure 5, c to e .
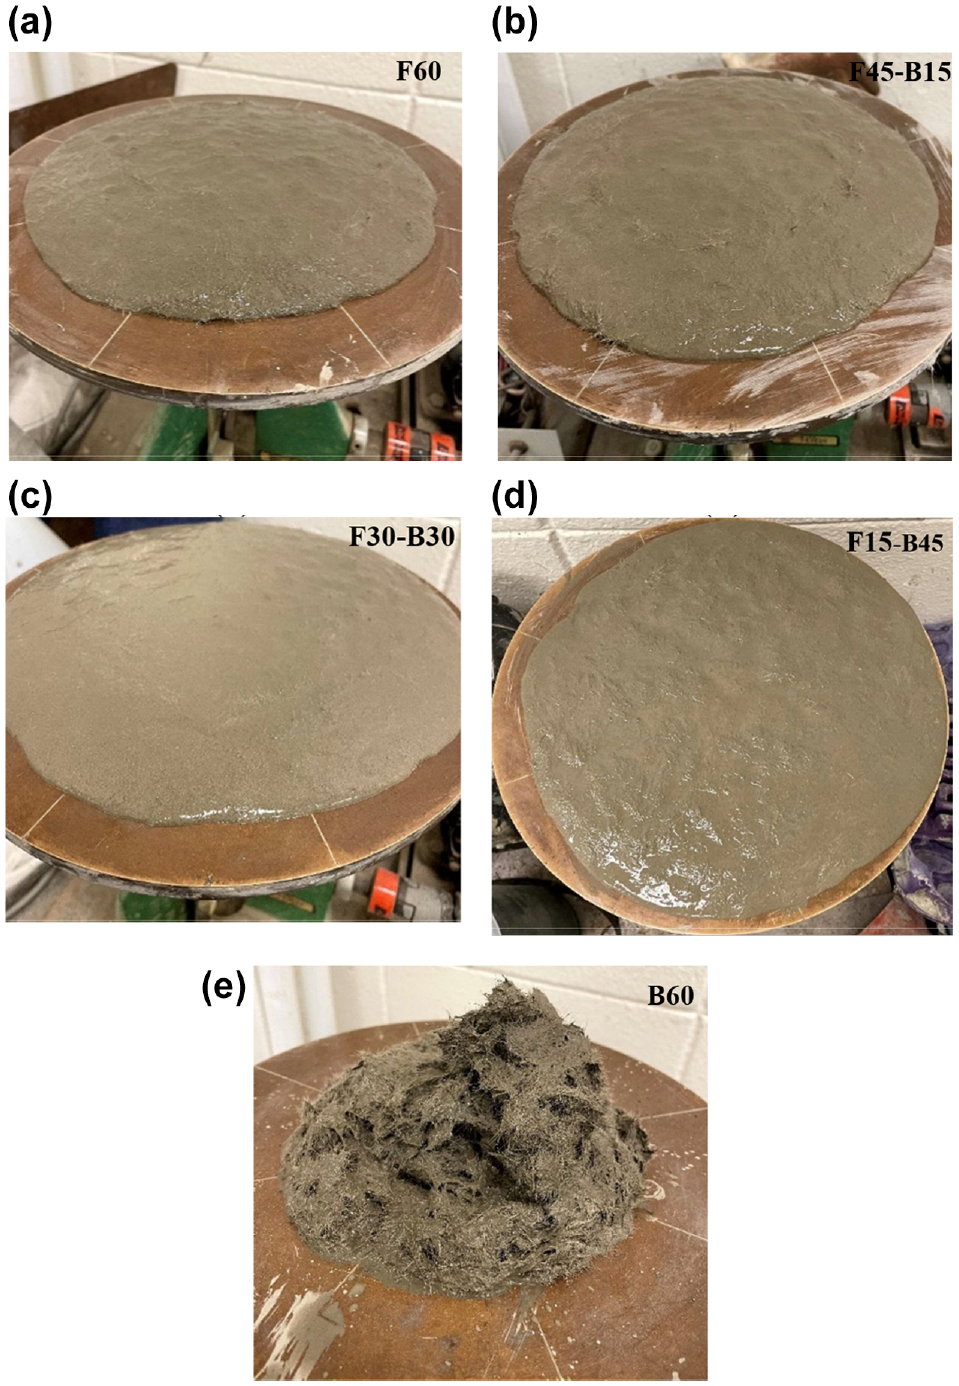
Flow table test for results: (a) F60, (b) F45-B15, (c) F30-B30, (d) F15-B45, and (e) B60.
The mixing procedure involved the following steps: (1) for 3 min, the dry components (river sand, FA, cement, and PBA) were mixed at a slow speed (60 rpm); (2) water and HRWR were added gradually for 1 min and then mixed at a medium speed (110 rpm) for 2 min; and (3) PVA fibers were introduced within 2 min, and then were mixed for 5 min at a fast speed (200 rpm). On completion of the mixing procedure, the composites were cast into molds. For each mixture, three cylinders (for compression test) and nine dumbbell-shaped specimens (three for single-crack tensile test [SCTT] and six for uniaxial tensile test) were prepared. Additionally, for the fracture toughness test, three prismatic specimens (without fibers) were prepared for each mixture. In accordance with ASTM C511, the specimens were demolded after 24 h of casting and cured for 28 days in a lime-saturated water tank.
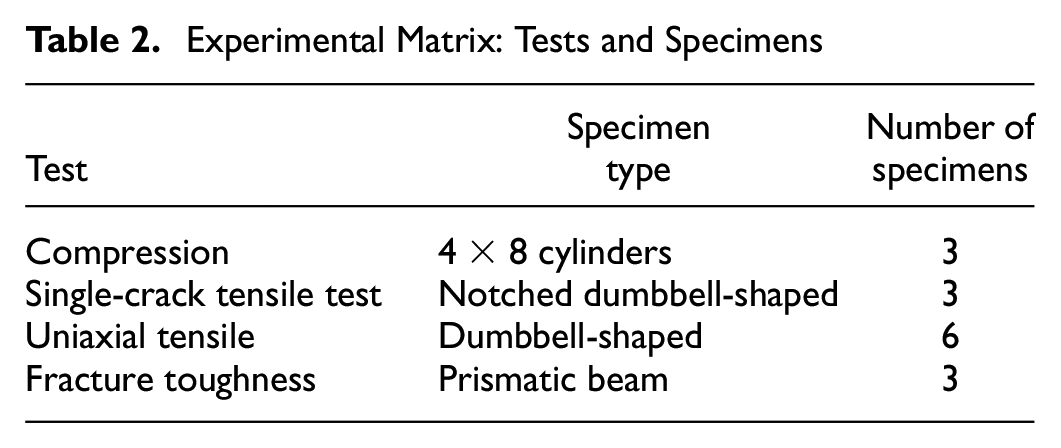
Experimental Matrix: Tests and Specimens
Materials Testing
Compressive Strength and Surface Resistivity
In accordance with ASTM C39 and AASHTO T358, cylindrical specimens measuring 101.6 × 203.2 mm (4 in. × 8 in.) were utilized to evaluate the 28-day compressive strength and surface resistivity of the materials, respectively. The average resistivity readings were multiplied by a curing correction factor of 1.1, in accordance with AASHTO T358 for saturated lime water. After measuring the surface resistivity, compression tests were conducted on the cylindrical specimens. The compression test was performed at 0.25 MPa/s utilizing hydraulic compression testing equipment (Forney LT-8031-FTS).
Single-Crack Tensile Test
In this study, the fiber-bridging relationship,
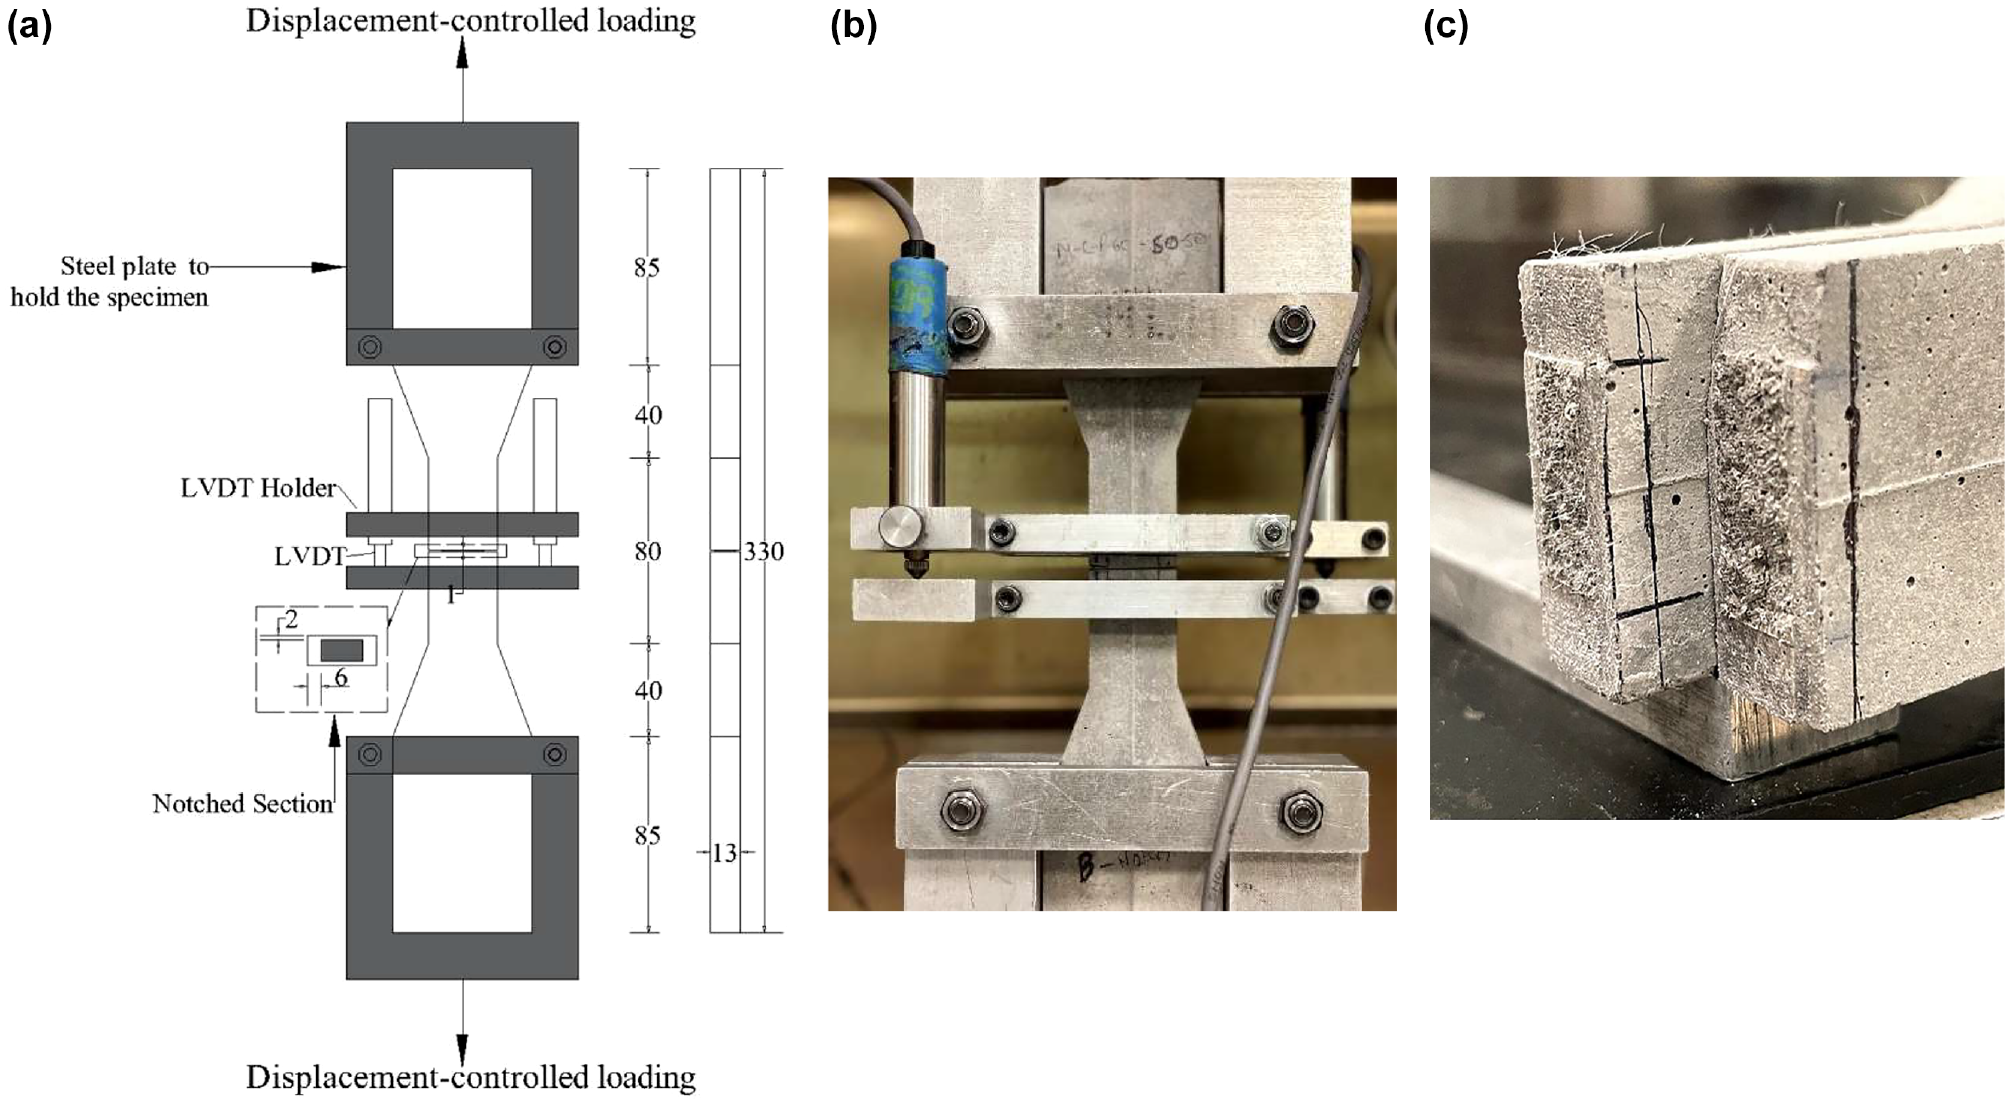
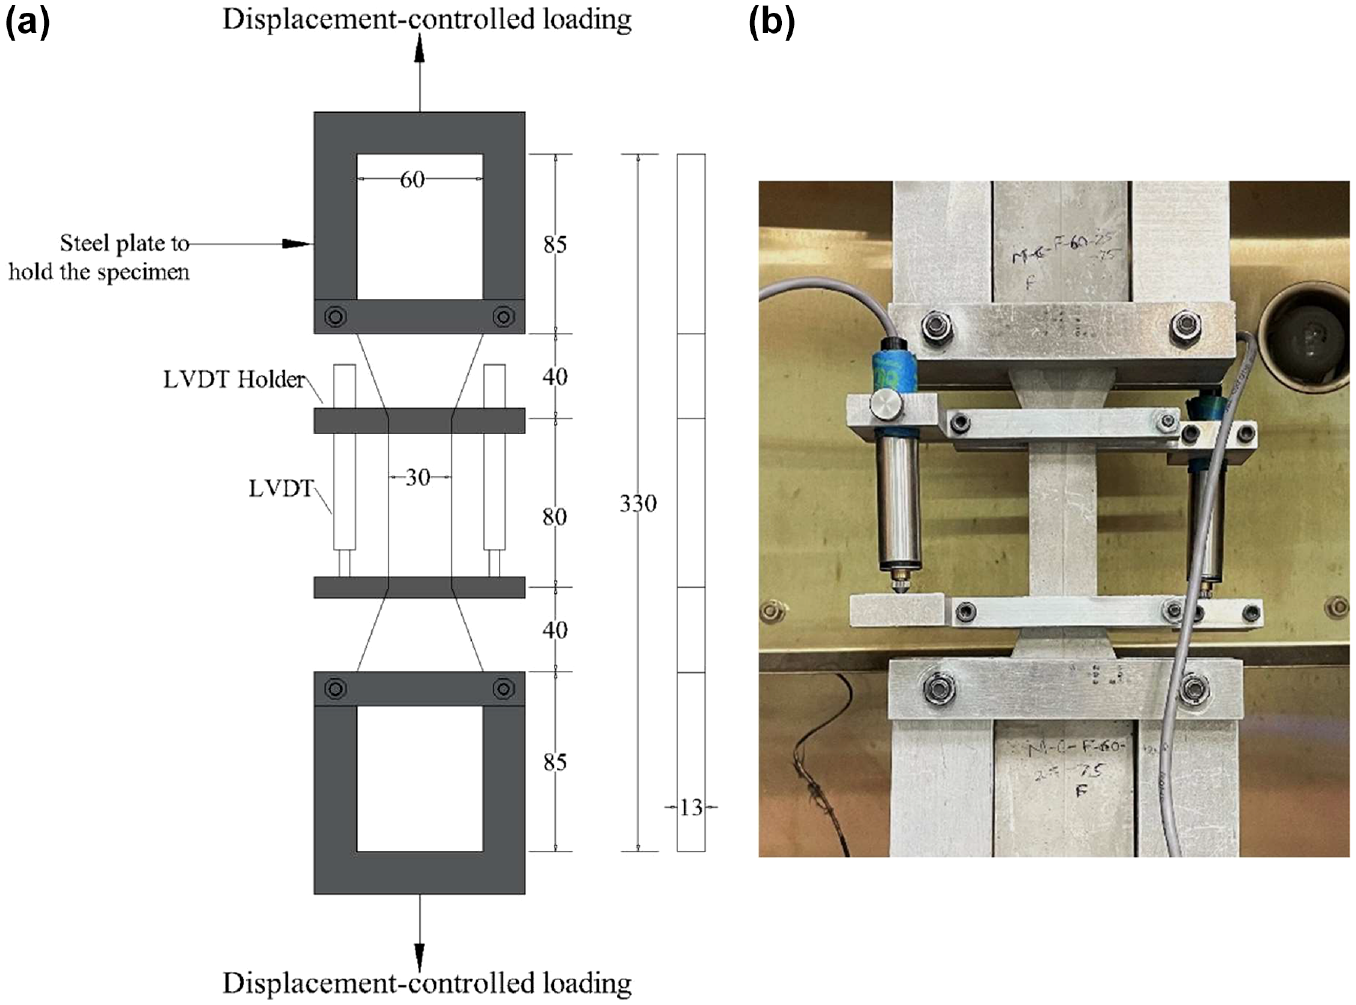
Single-crack tensile test: (a) dimensions (in mm) of a notched dumbbell-shaped specimen, (b) experimental setup, and (c) specimen after testing.
During the test, the specimens were axially loaded at a displacement-controlled rate of 0.5 mm/min. To measure the crack opening displacement, a linear displacement sensor was placed on both sides of the specimen, as shown in Figure 6b. The gauge length in this test was fixed at 20 mm to reduce the impact of matrix deformation on crack opening displacement measurements. Three specimens were evaluated for each mixture after 28 ± 1 day of curing. Figure 6c presents a specimen on completion of the SCTT.
Uniaxial Tensile Test
Uniaxial tensile tests were conducted on 13 mm thick dumbbell-shaped specimens to evaluate the composites’ tensile performance, as illustrated in Figure 7a. The specimens used for uniaxial tensile test were identical to those used for the SCTT; however, the specimens did not have a notch, and the gauge length was 80 mm. A linear displacement sensor was mounted to both sides of the specimen to measure material deformation. A total of six specimens were evaluated for each considered mixture after 28 ± 1 days of curing. The experimental setup is depicted in Figure 7b.
Uniaxial tensile test: (a) dumbbell-shaped specimen dimensions (in mm) and (b) experimental setup.
Fracture Toughness Test
Matrix properties—fracture toughness (
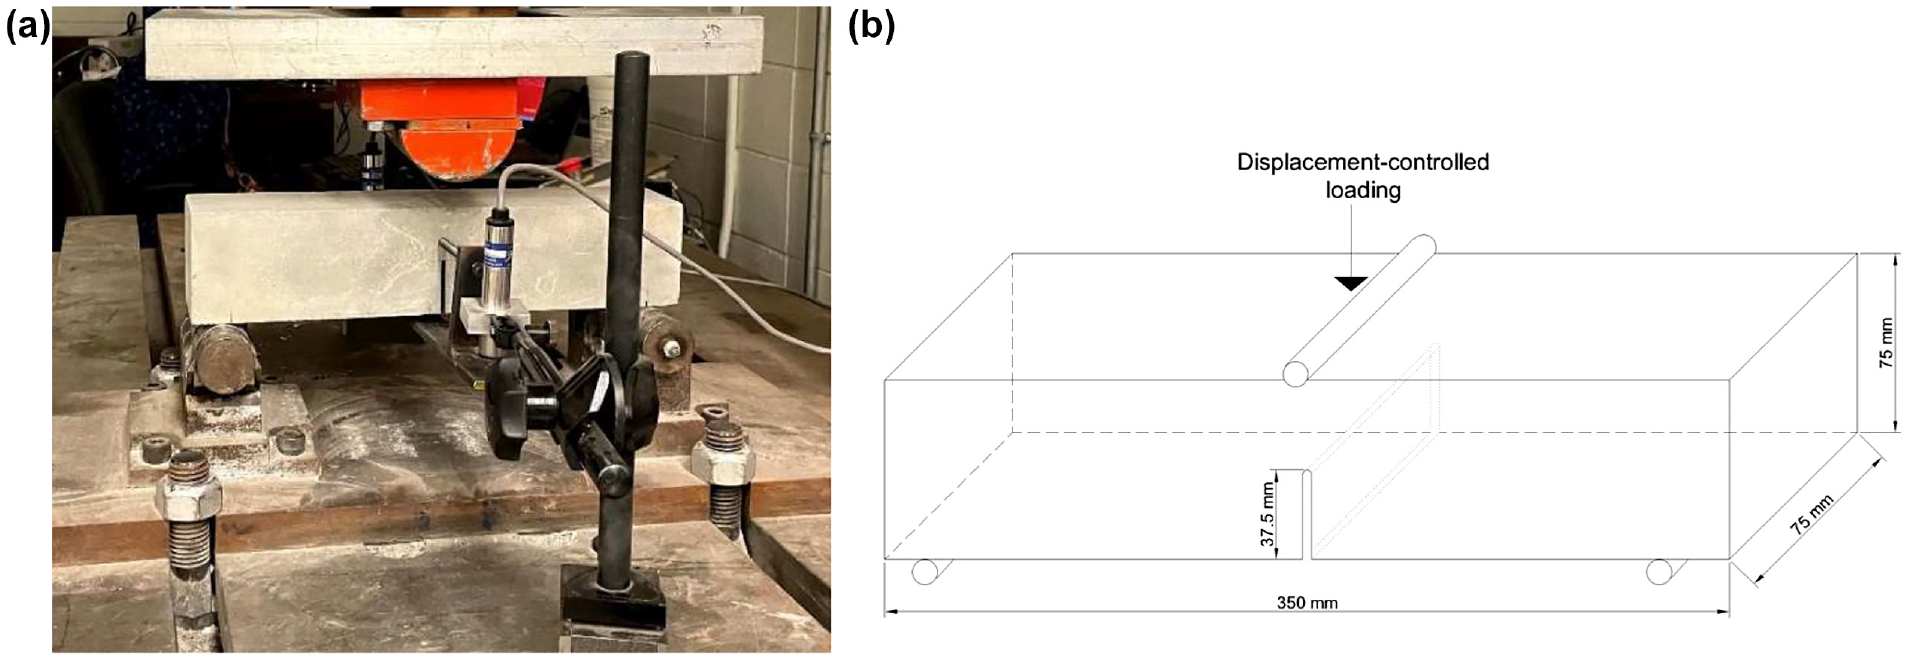
Fracture toughness test: (a) experimental setup and (b) notched prism dimensions.
Results and Discussion
Compressive Strength and Surface Resistivity
The 28-day compressive strength averages (indicated by the bars) ± one standard deviation (indicated by the whiskers) of all the composite materials are presented in Figure 9a. In general, partial or complete replacement of FA with PBA resulted in marginal changes in the compressive strength of the composites. For instance, F60 (control mixture) exhibited a compressive strength of 36.8 MPa, which increased to 38.6 MPa (i.e., a 4.9% increase) for mixtures replacing 100% of FA with PBA (i.e., B60). Among all the composites produced in this study, B60 presented the highest average compressive strength. As for the mixtures implementing combined systems of FA and PBA (i.e., F45-B15, F30-B30, and F15-B45), the average compressive strength ranged from 36.3 MPa to 36.9 MPa, thus practically matching the strength of the control mixture. Analysis of variance (ANOVA) revealed no statistically significant difference in the average compressive strength of the composites at a level of confidence of 5% (p-value = .77).
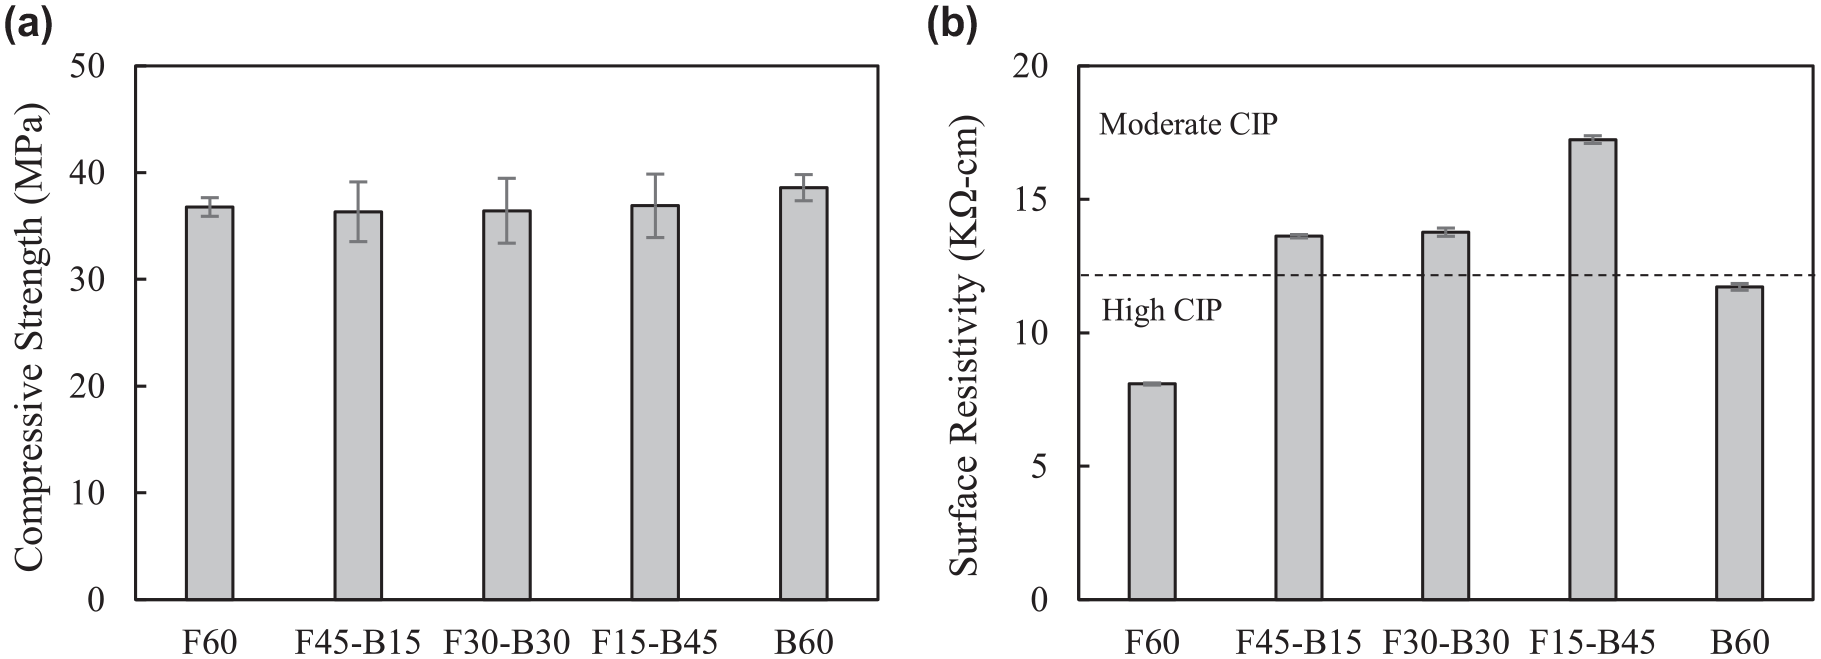
Hardened properties: (a) compressive strength and (b) surface resistivity.
The 28-day surface resistivity of all the materials is presented as average ± one standard deviation in Figure 9b. The average surface resistivity increased for increasing replacement of FA with PBA in mixtures using combined systems of FA and BA. Nonetheless, when completely replacing FA with PBA (i.e., B60), the surface resistivity decreased in contrast to mixtures implementing the combined systems. The decrease in surface resistivity reported for B60 in comparison to F15-B45 is likely attributed to the poor workability of B60, which led to the formation of fiber clumps and the likely addition of micro- and meso-pores (i.e., <50 nm), thus producing a larger degree of interconnections of micro-pores. It is noted here that this addition of micro- and meso-pores does not affect the compressive strength of the composites (
25
). Interestingly, among all the materials, the control mixture (i.e., F60) exhibited the lowest surface resistivity of 8.1 k
Fiber-Bridging Relation Properties
Figure 10 presents the fundamental fiber-bridging relations,
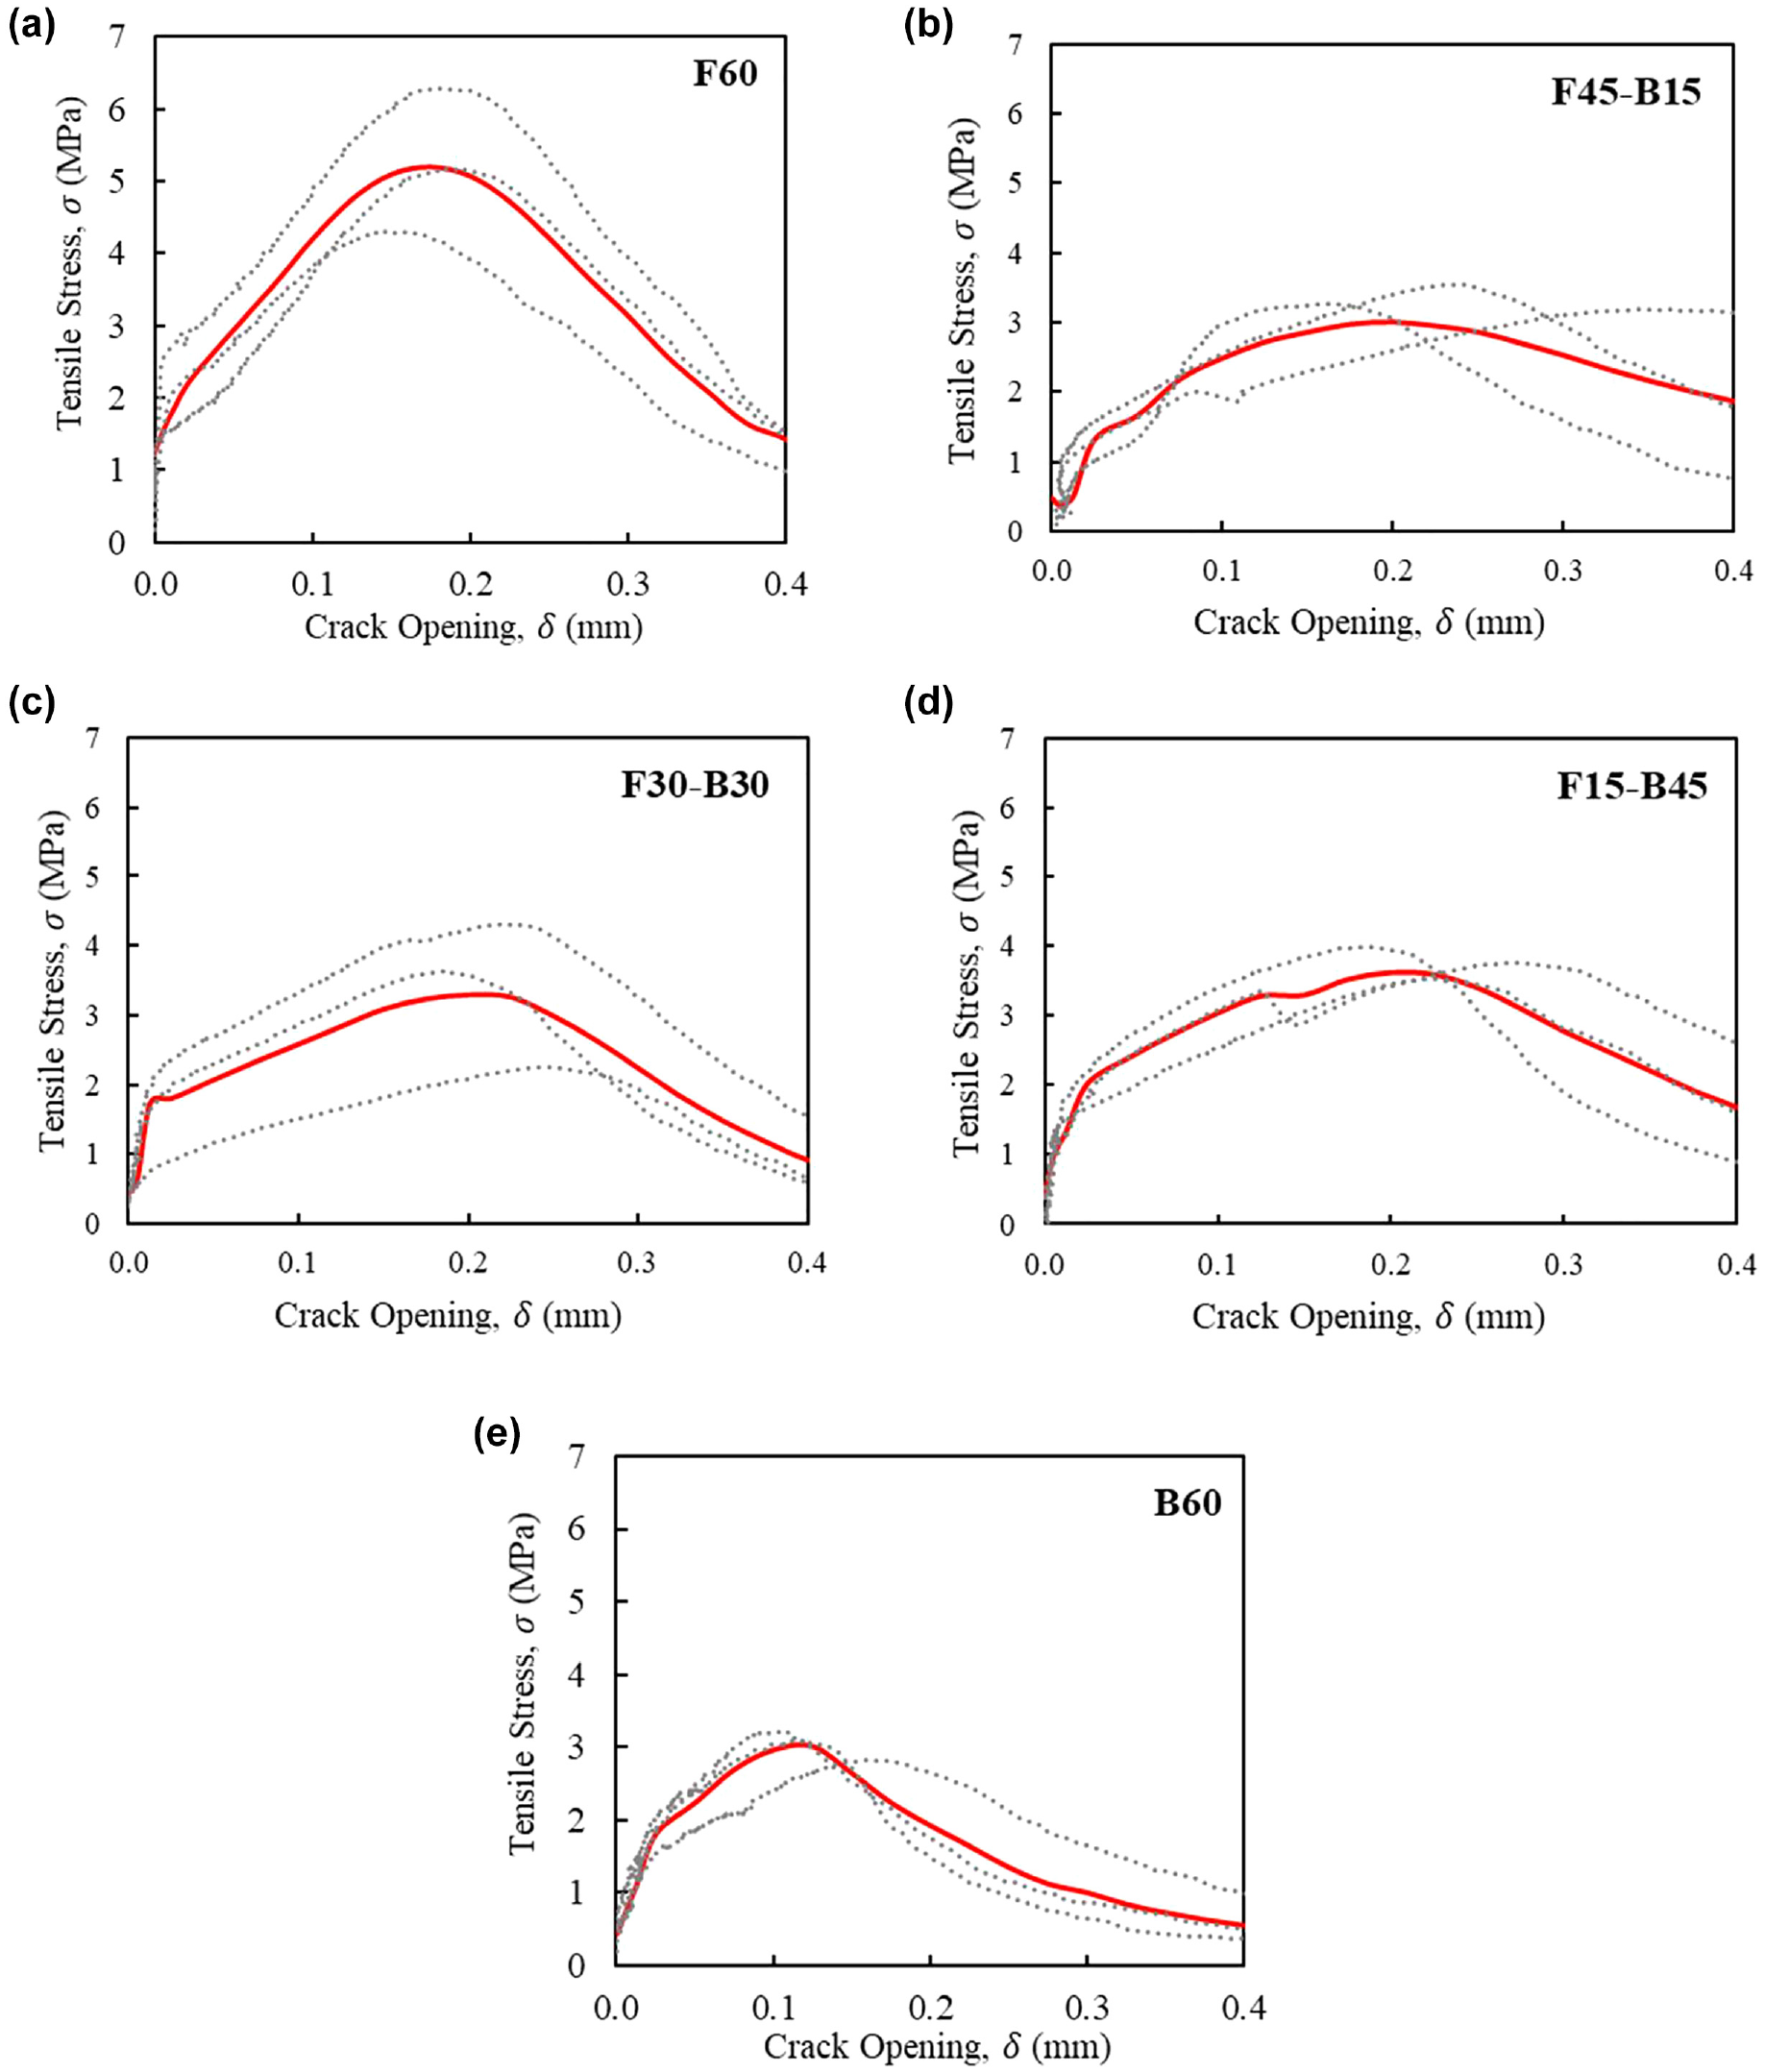
Fiber-bridging relations obtained from single-crack tensile test: (a) F60, (b) F45-B15, (c) F30-B30, (d) F15-B45, and (e) B60. Dotted lines represent individual tests conducted and solid lines represent the average
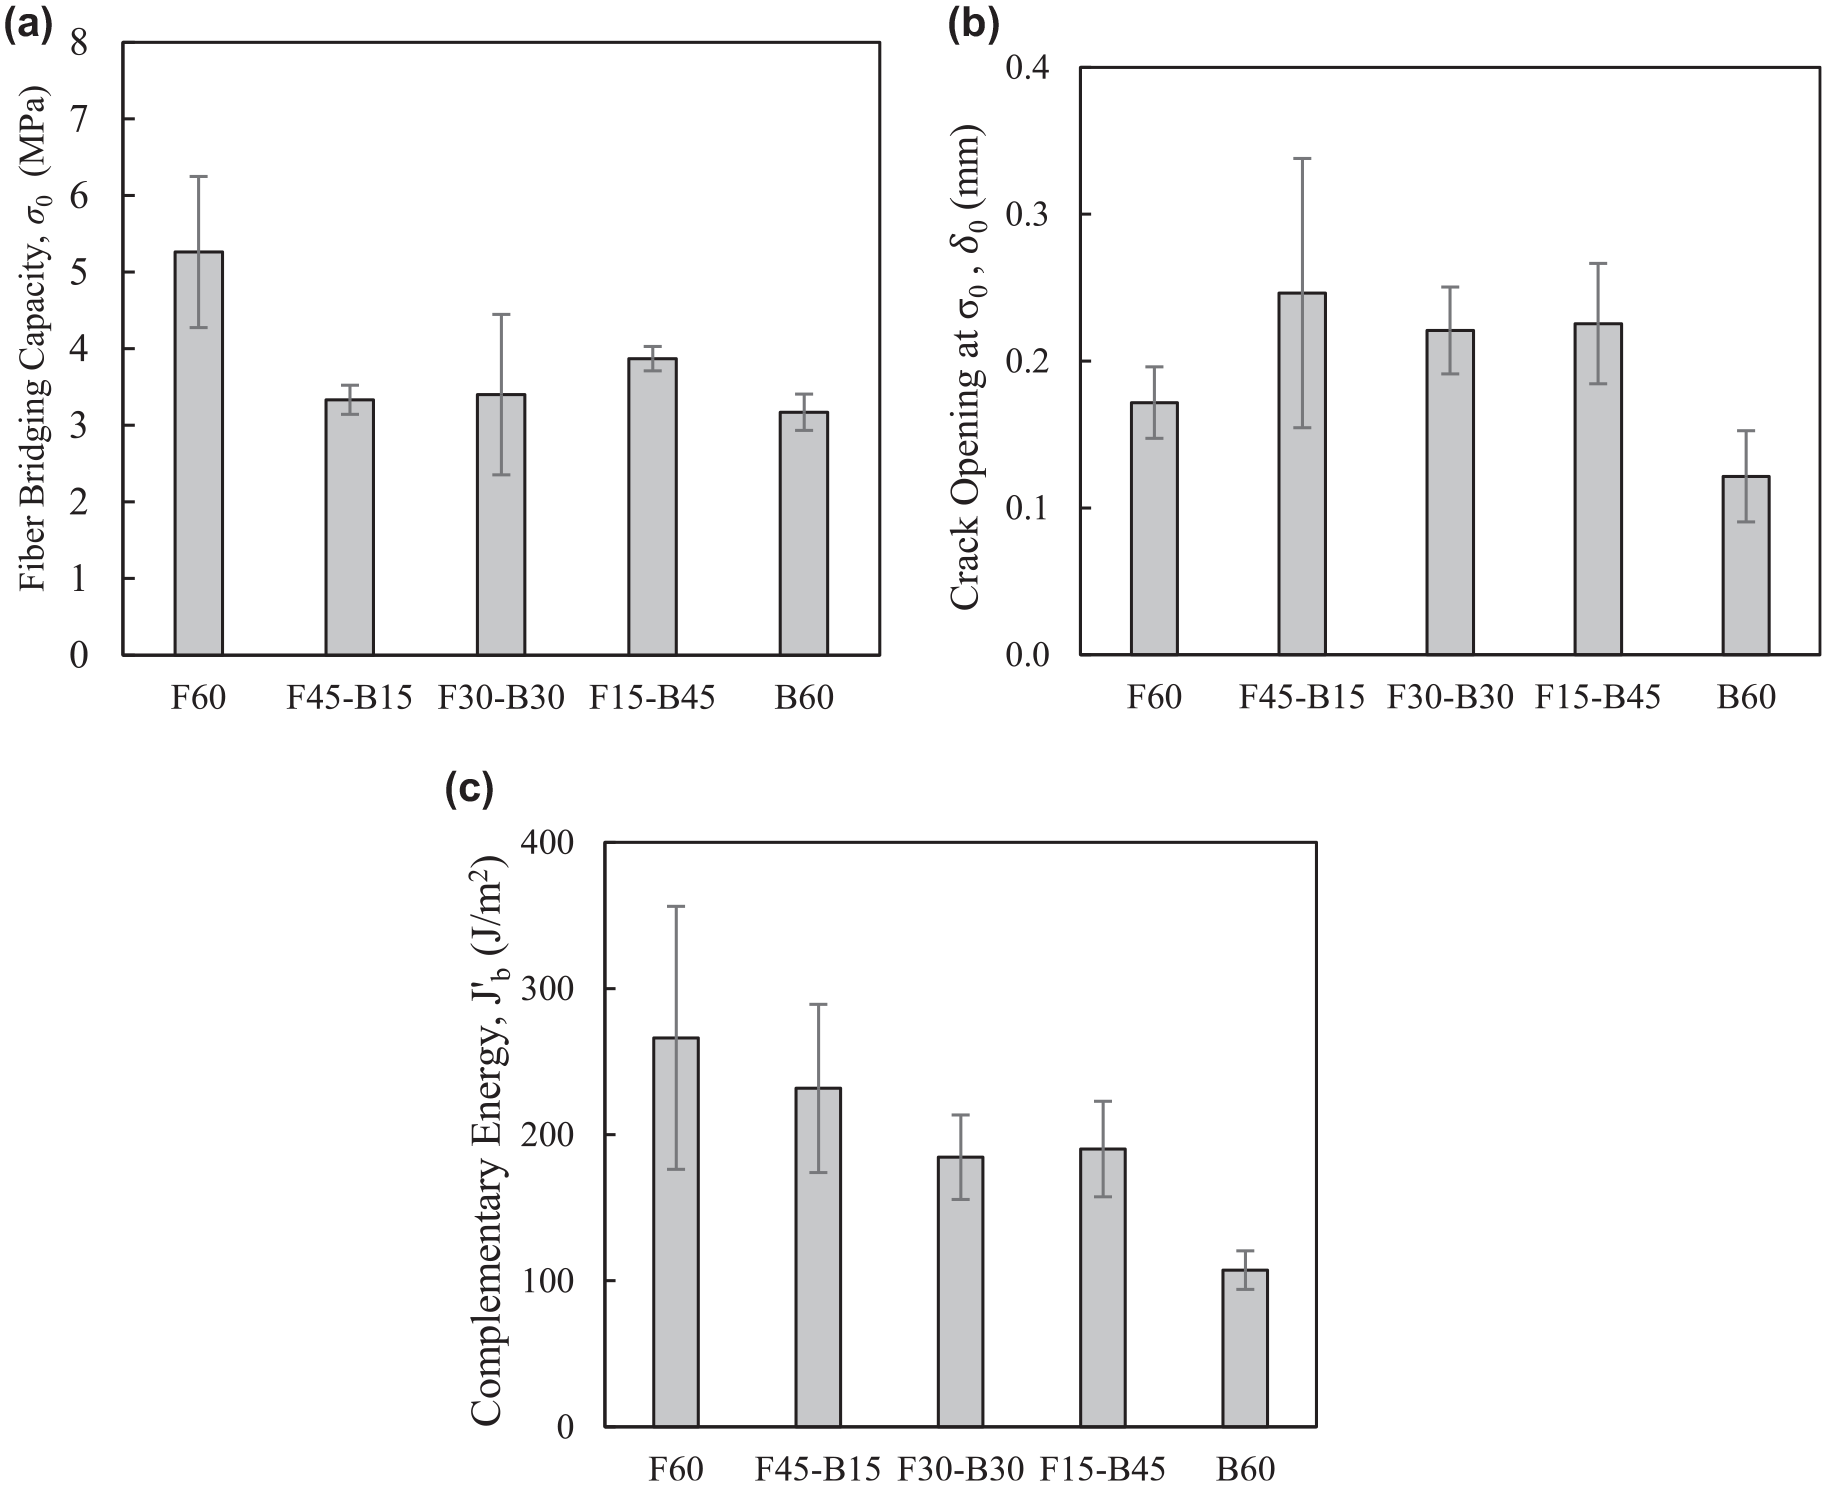
Fiber-bridging properties: (a)
Figure 11a presents the fiber-bridging capacity (
Figure 11b shows the
Figure 11c presents the calculated average
Matrix Properties
The average
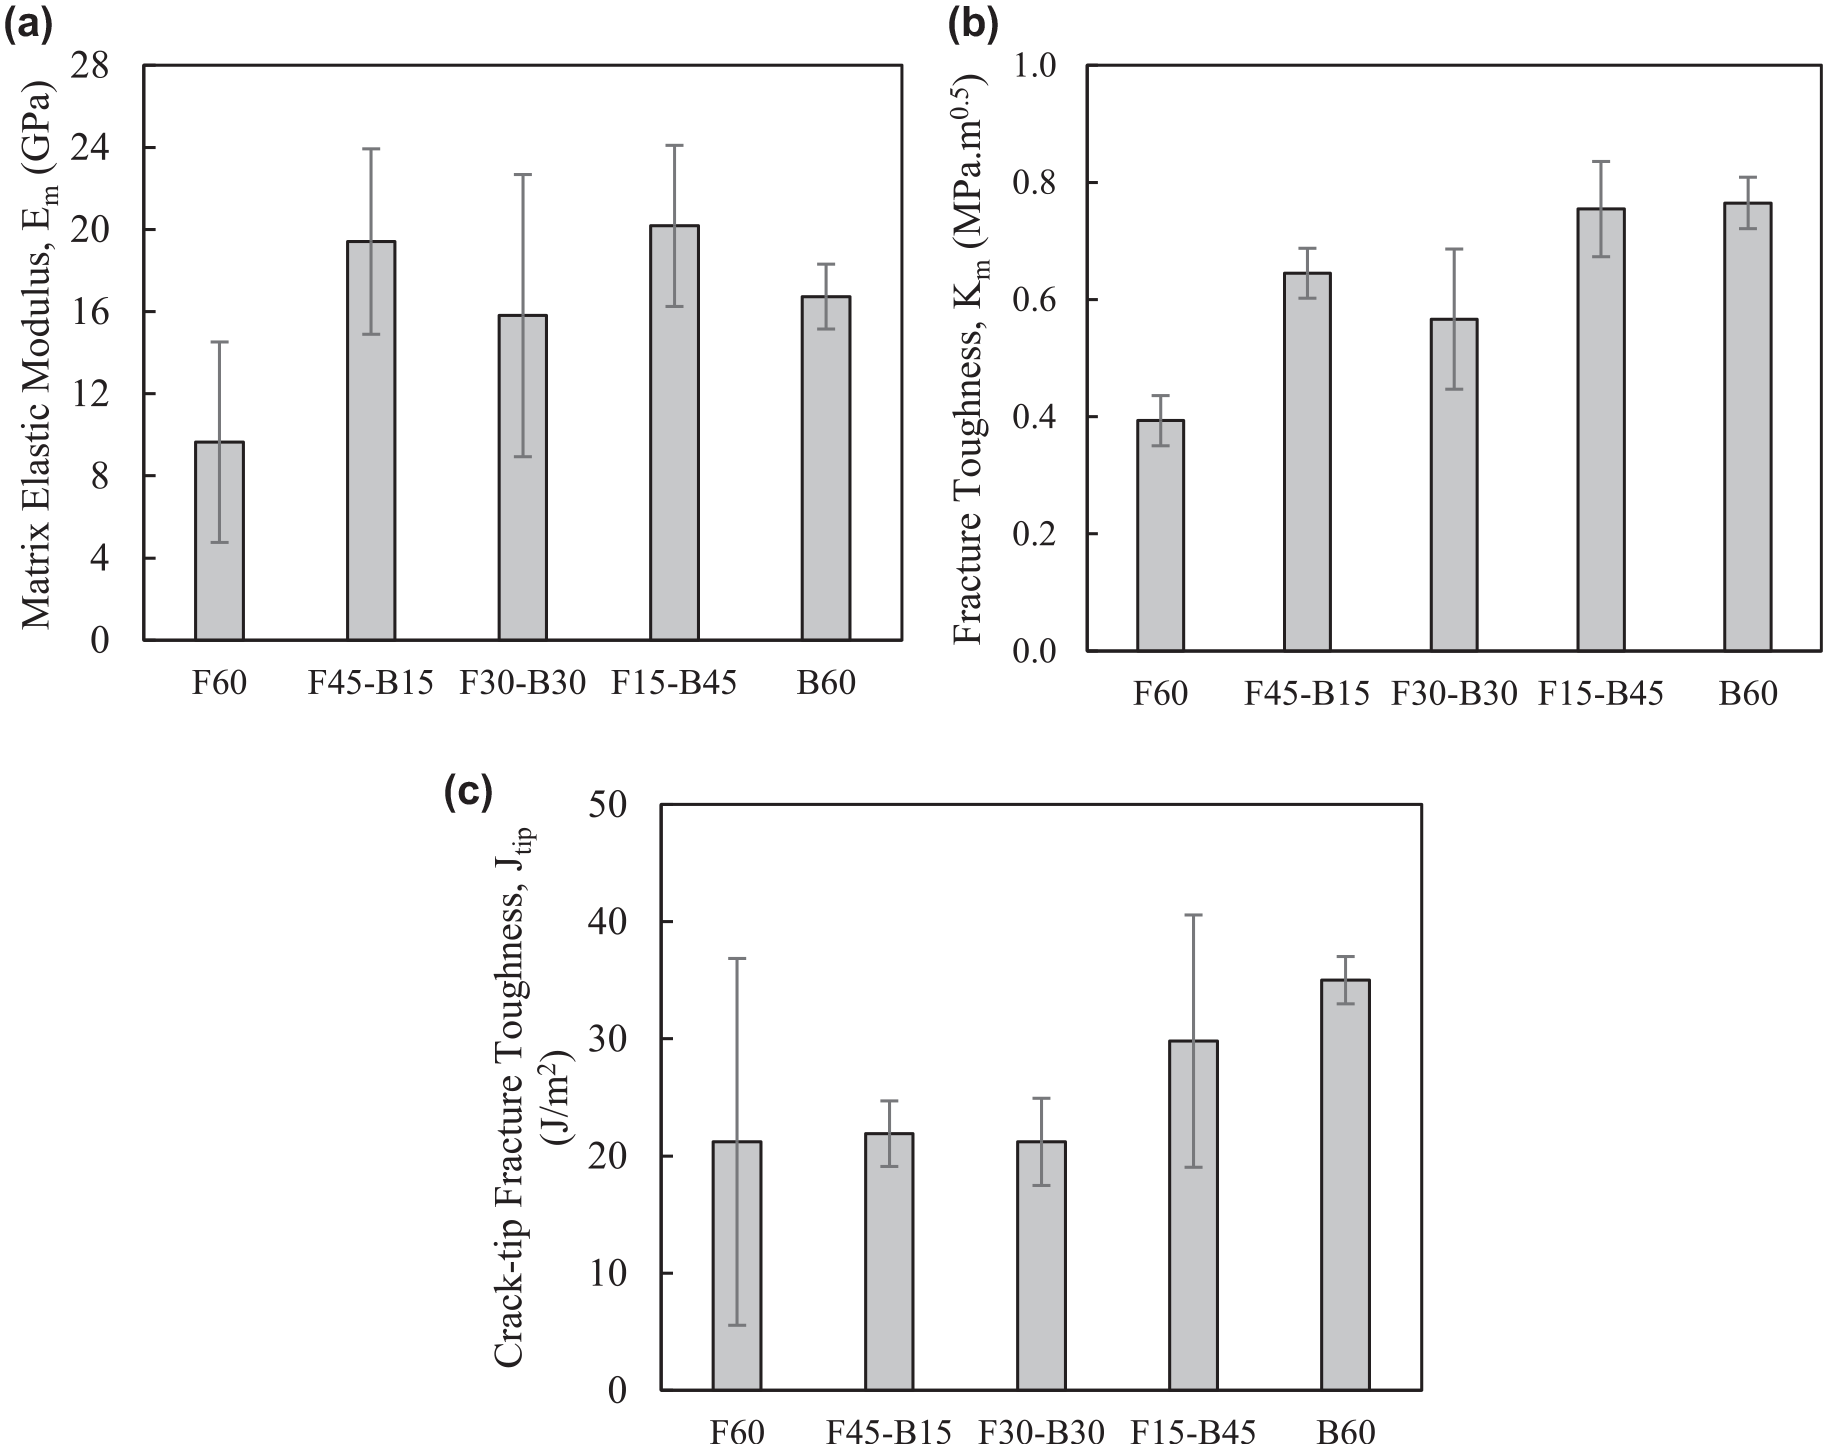
Matrix properties: (a) matrix elastic modulus (
Tensile Properties
The tensile stress-strain curves for all composites are illustrated in Figure 13. Figure 14a reports the first-cracking strength
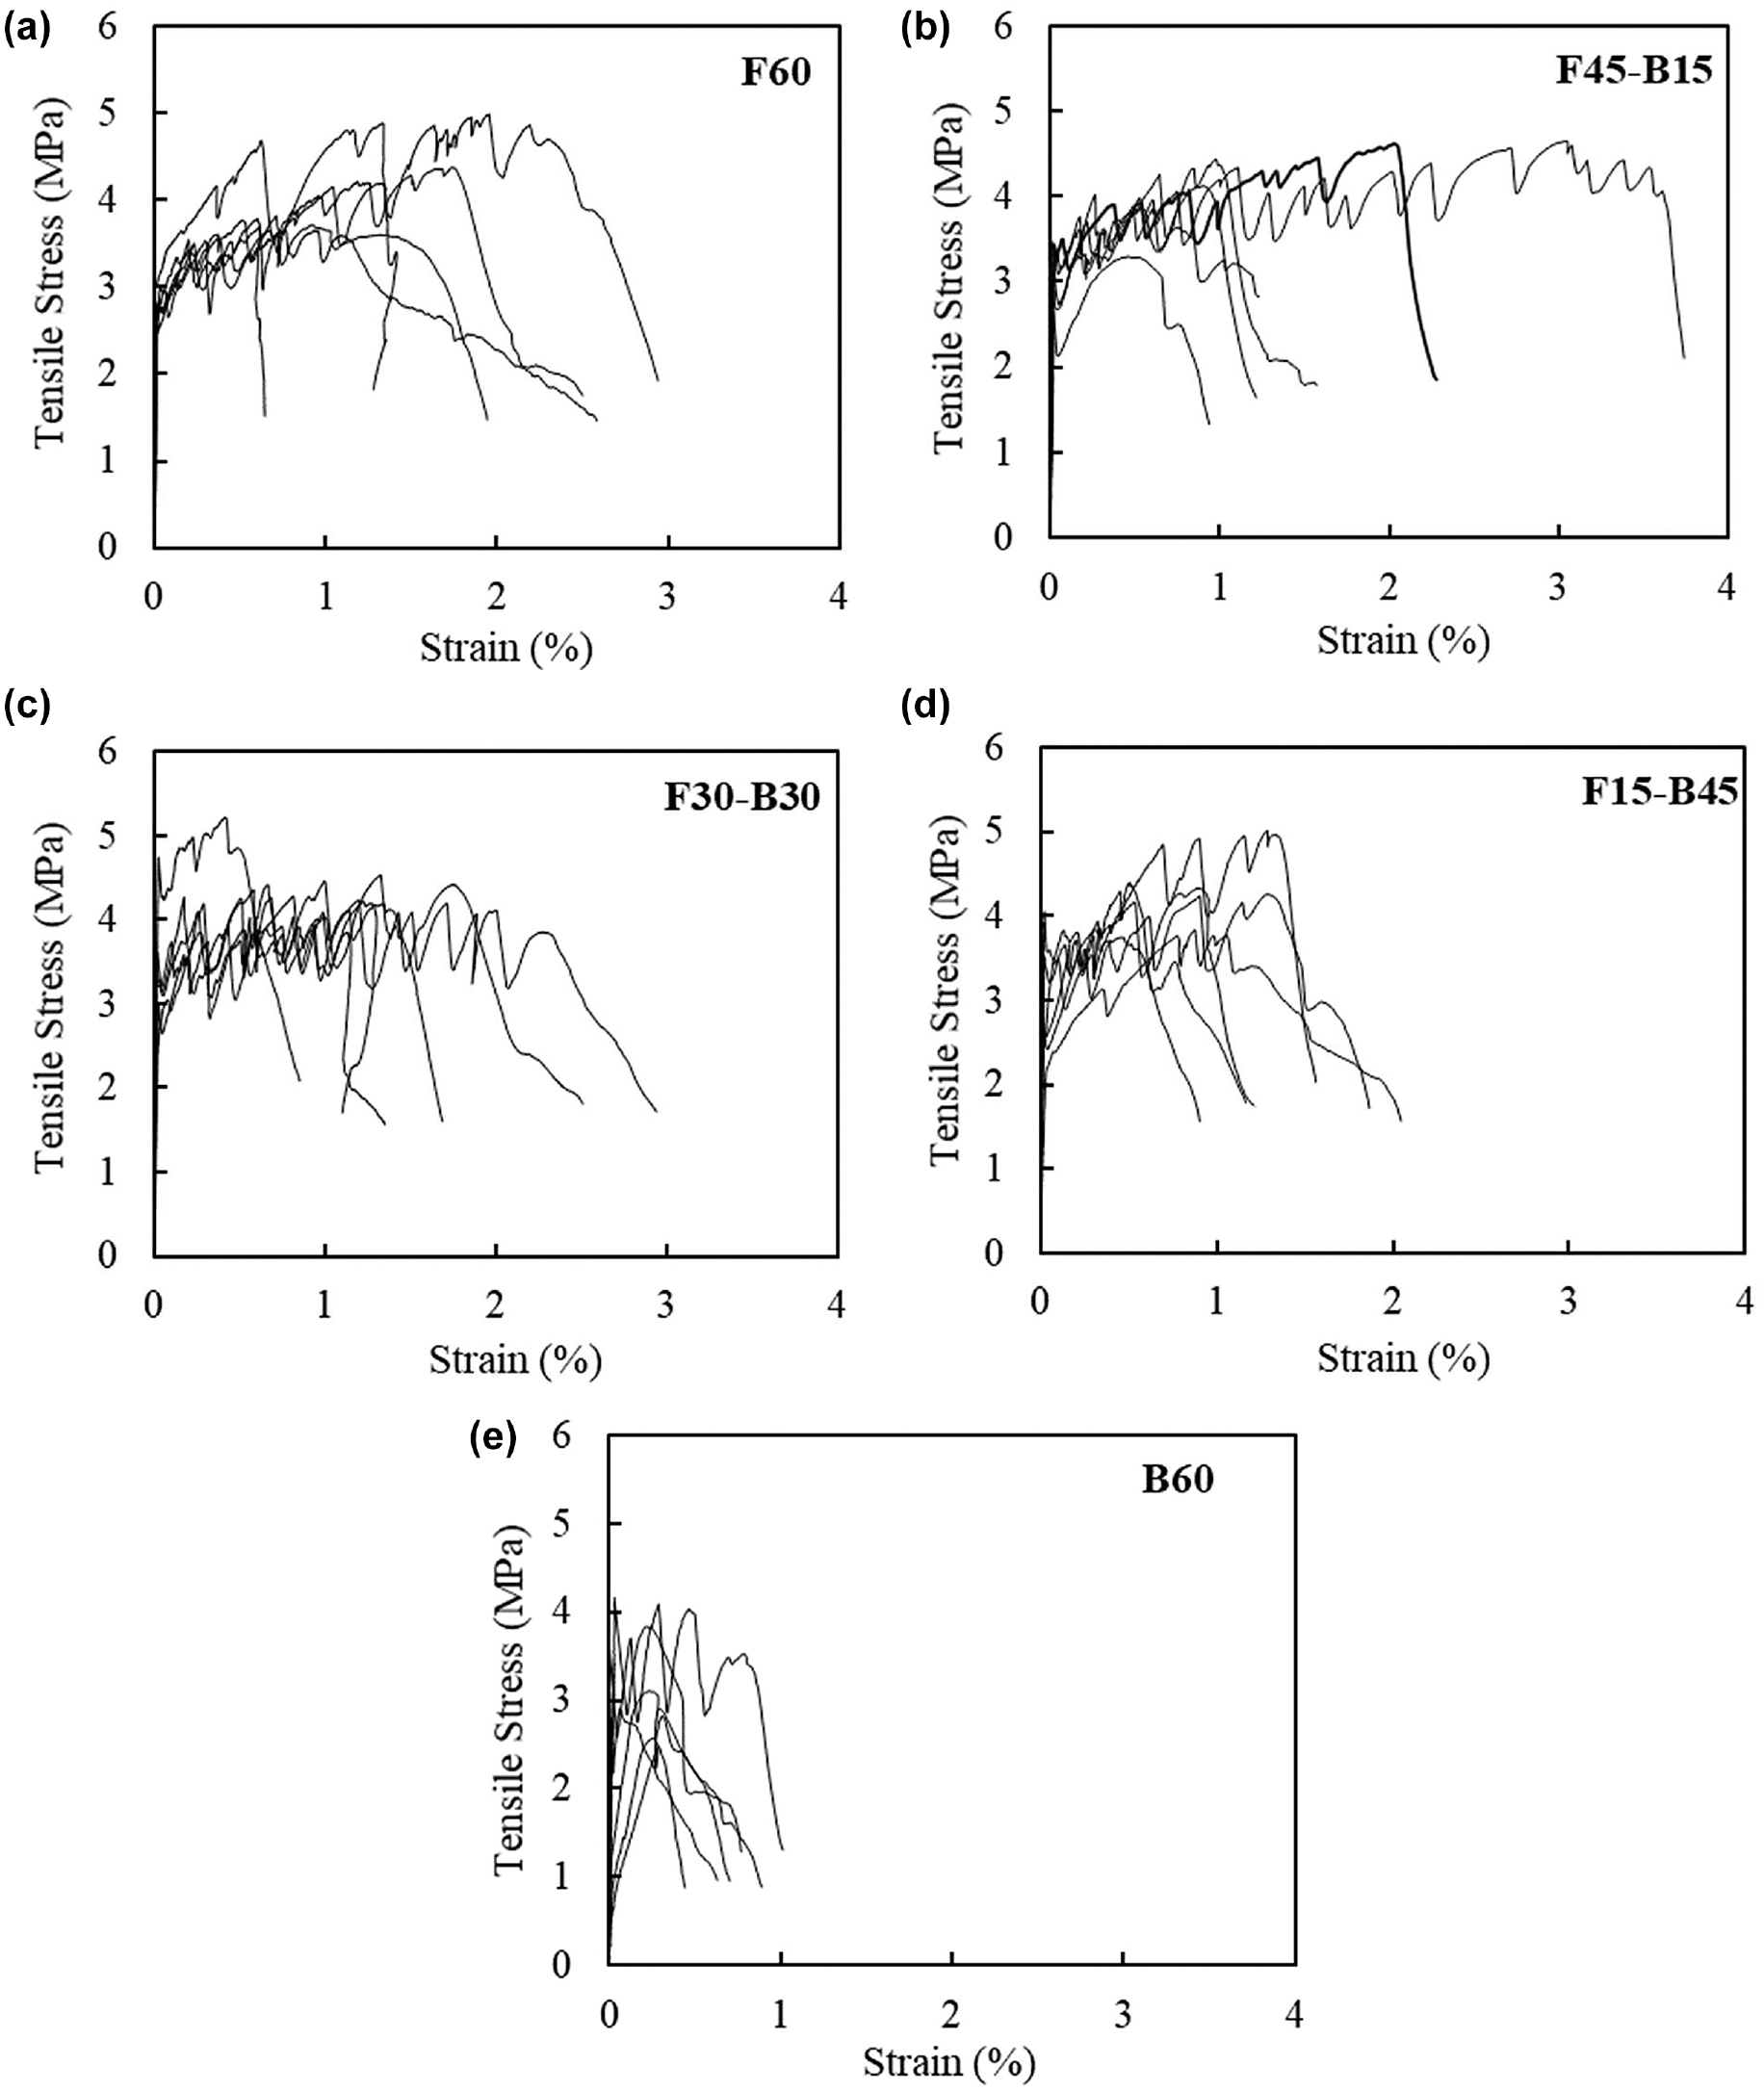
Tensile stress versus strain: (a) F60, (b) F45-B15, (c) F30-B30, (d) F15-B45, and (e) B60.
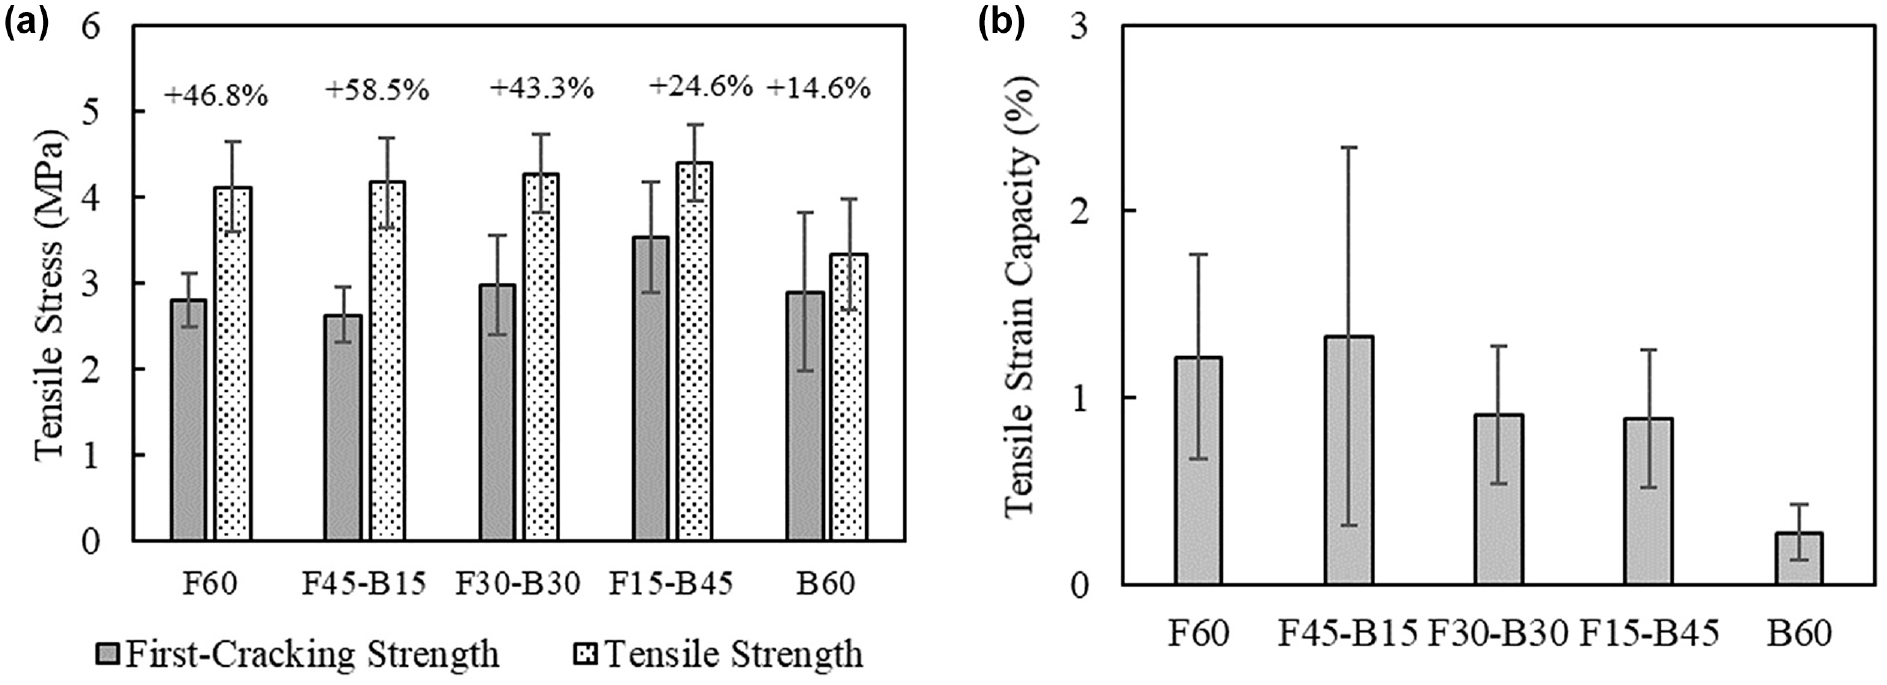
Tensile properties: (a) tensile and first-cracking strength and (b) tensile strain capacity.
From Figure 14a, it is evident that increments in the FA replacement level with PBA generally produced marginal increments in the tensile strength for combined FA/PBA systems. For instance, the tensile strength of the F15-B45 mixture (i.e., 4.40 MPa) was only 6.8% higher than that of the control mixture (i.e., 4.12 MPa). By contrast, a noticeable decrease in tensile strength (i.e., 19.4%) was observed for the B60 mixture when compared with F60. The low tensile strength exhibited by B60 is attributed to fiber clumping, as discussed earlier. Moreover, the tensile strength did not exhibit a trend similar to that of
For matrix first-cracking strength, it is evident that all composites implementing PBA, except for F45-B15, exhibited higher
From Figure 14b, it is observed that the composites’ tensile strain capacity decreased as FA substitution with PBA increased. F45-B15 presented the highest ductility of all the materials evaluated; however, differences with the control mixture were marginal. In fact, the control mixture presented a tensile strain capacity of 1.22%, which increased to 1.33% for F45-B15 (i.e., a 9.0% increase). However, for F30-B30, F15-B45, and B60, the tensile strain capacity was 24.6%, 27.0%, and 77.0%, respectively, lower than that of the control mixture. Statistically significant differences in average tensile strain capacity were encountered based on an ANOVA conducted at a 5% confidence level (p-value = .034). Additionally, F45-B15 and B60 showed statistically significant differences as per Tukey’s pairwise analysis. Only two mixtures (i.e., F60 and F45-B15) exhibited tensile strain capacity values greater than the minimum to be categorized as ECC (i.e., ≥1%). However, the typically desired ductility of ECCs (i.e., >2%) was not achieved in any of the considered mixtures. Moreover, all the other mixtures exhibited tensile strain capacities ranging from 0.28% to 0.92%; therefore, they cannot be classified as ECCs. Since most of the composites did not exhibit PSH behavior, the tensile properties among the specimens were not consistent. As a result, a high variability in tensile strain capacity was observed among the specimens. Therefore, a larger data set would be required to fully validate the trends observed in this study. The low ductility exhibited by the control mixture is credited to the low fiber content used and the utilization of non-oil-coated PVA fibers, which form a strong fiber/matrix chemical bond reducing ductility. Nevertheless, the tensile strain capacity of these composites far exceeded that of conventional concrete (i.e., ∼0.01%).
The tensile strain capacity of ECC mixtures is closely related to the PSH performance indexes. Specifically, higher PSH strength (
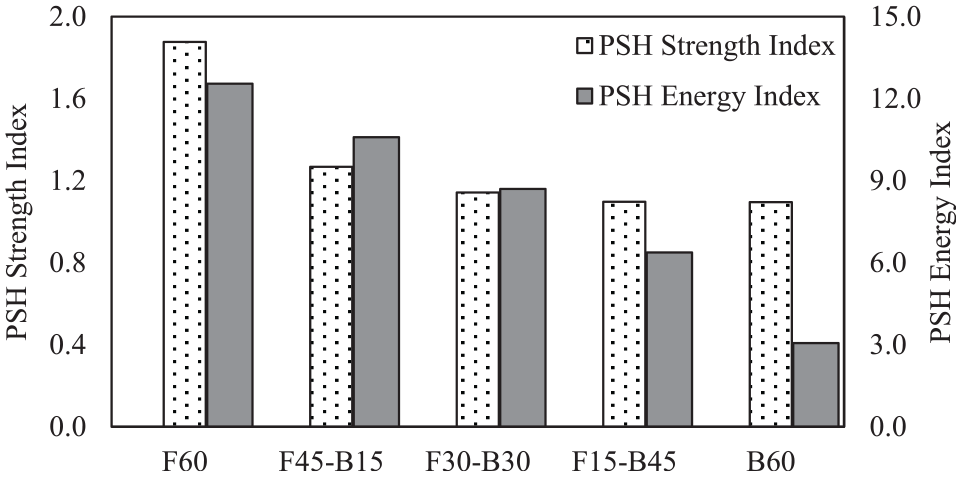
Pseudo-strain-hardening performance indexes.
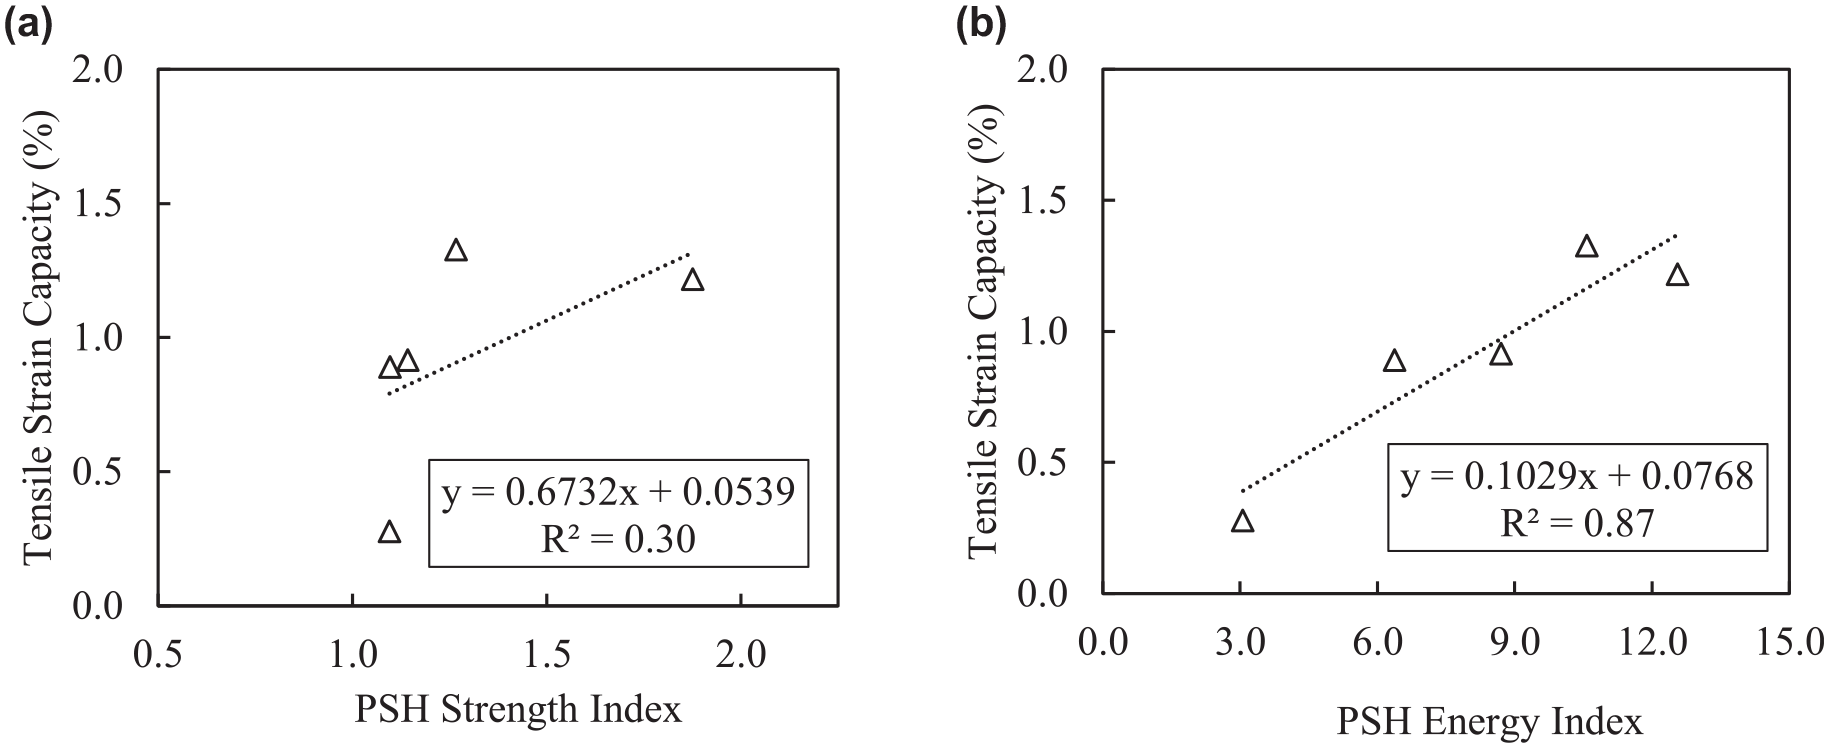
Figure 16a illustrates the relationship between the PSH strength index and the tensile strain capacity, and Figure 16b depicts the relationship between the tensile strain capacity and the PSH energy index, with the corresponding fitted simple linear regressions. The PSH strength index exhibited a weak correlation with the tensile strain capacity (R
2
= .30), but the PSH energy index exhibited a stronger correlation (R
2
= .87). These results indicate that the theoretical considerations of ECC design are generally in agreement with the experimental findings. In fact, only the control mixture F60 exceeded the minimum recommended values to guarantee robust PSH behavior (i.e., 1.3 and 2.7 PSH strength and energy indexes, respectively). However, even F60 did not exhibit robust PSH behavior, which is often associated with tensile strain capacities above 2%. The explanation for this disagreement in PSH energy index between theory and experimental results is related to the experimental method employed in the present study to assess
Relationship between the tensile strain capacity and (a) pseudo-strain-hardening strength index, (b) pseudo-strain-hardening energy index.
Conclusion
The influence of partial and complete substitution of FA with PBA in ECC materials was investigated in the present study. Specifically, the mechanical and physical properties of composites using 60% replacement of cement with SCMs were evaluated, where the SCMs were composed of: (1) 100%FA as control; (2) 75%FA/25%PBA; (3) 50%FA/50%PBA; (4) 25%FA/75%PBA; and (5) 100%PBA. Based on the experimental findings, the subsequent inferences are made:
The 28-day compressive strength of the ECC mixtures was minimally affected by the replacement of FA with PBA.
Relative to the control mixture, all composites incorporating PBA exhibited higher 28-day surface resistivity than the control mixture. For mixtures implementing FA/PBA combined systems, the surface resistivity increased for increasing replacement of FA with PBA. Interestingly, the composite using only PBA as SCM (i.e., B60) presented a lower surface resistivity than the materials implementing FA/PBA combined systems. These results were attributed to the poor workability and fiber clumping observed in B60, which likely resulted in an increased porosity of the material.
In general, replacing FA with PBA resulted in a reduction in
Both the fracture toughness and modulus of elasticity of the cementitious matrices increased for increasing replacement levels of FA with PBA. As a consequence,
Incorporation of PBA in FA/PBA combined systems produced a minimal impact on the tensile strength of the composites. However, the mixture using solely PBA as SCM (i.e., B60) exhibited a noticeable decrease in tensile strength (attributed to poor workability and fiber clumping). Furthermore, the use of PBA generally increased the matrix first-cracking strength. The tensile strain capacity was generally reduced with the increment in FA replacement with PBA. However, at the 25% replacement level, the effect of PBA on the ductility relative to the control mixture was slightly positive, although not statistically significant. The observed decrease in ductility of mixtures incorporating PBA beyond 25% was mainly attributed to the measured decrease in
From the findings of this investigation, it is concluded that ECC materials can be developed using combined systems of FA and PBA. However, attaining high tensile ductility of the composites when incorporating PBA is more challenging, especially when more than 25% of FA (by mass) is replaced by PBA. On the positive side, the use of PBA in ECC mixtures does not produce negative impacts on compressive or tensile strength and significantly improves surface resistivity. Future research should evaluate the use of different fibers (i.e., PE = Polyethyleneor oil-coated PVA fibers) and/or higher fiber contents to guarantee that robust PSH behavior is achieved for mixtures incorporating PBA.
Footnotes
Author Contributions
The authors confirm contribution to the paper as follows: study conception and design: Gabriel Arce, Sujata Subedi, Marwa Hassan, Michele Barbato; data collection: Sujata Subedi; analysis and interpretation of results: Sujata Subedi, Gabriel Arce; draft manuscript preparation: Sujata Subedi, Gabriel Arce, Marwa Hassan, Michele Barbato, Hassan Noorvand, Louay Mohammad. All authors reviewed the results and approved the final version of the manuscript.
Declaration of Conflicting Interests
The author(s) declared no potential conflicts of interest with respect to the research, authorship, and/or publication of this article.
Funding
The author(s) disclosed receipt of the following financial support for the research, authorship, and/or publication of this article: The authors gratefully acknowledge the assistance of the Louisiana Transportation Research Center and the financial assistance of Tran-SET (69A3551747106 & project19CLSU03). This study was funded by the Transportation Consortium of South-Central States (Tran-SET).
Data Accessibility Statement
Data and models that support the findings of this study are available from the corresponding author on reasonable request.