
Abstract
The high demand for containerized cargo and the low market share of low-carbon transportation modes for hinterland freight systems in China are causing severe traffic congestion and environmental pollution. Dry ports offer an opportunity to reduce carbon emissions, relieve congestion, and expand the hinterland of seaports. Therefore, this paper focuses on the dry port multilevel location problem considering capacity constraints, shippers’ choice behavior, and empty container transportation in a four-mode port-hinterland freight network. A Stackelberg game-theoretical model is built for the government and shippers. In the model, the government determines the number, location, and capacity level of dry ports, and shippers choose seaports and paths according to the constrained nested logit model because of the capacity constraints of nodes and links. To solve the problem, a complete enumeration algorithm and a hybrid genetic algorithm are designed. Numerical experiments in China are performed, and two analyses are conducted on the cost parameters and time parameters. The results indicate that constructing dry ports can decrease carbon emissions and generalized transportation costs, and promote the mode shift from road to railway. However, building a larger number and higher capacity level of dry ports sometimes increases total costs, contrary to expectations. There are also some interesting findings with respect to the effects of costs and time parameters on dry port location results, carbon emissions, modal split, and seaport market share.
Keywords
Maritime transport plays a crucial role in the world economy, amounting to 10.7 billion tons in 2020 ( 1 ). Since the early 1960s, the share of containerized cargo in the international maritime trade has significantly increased. The dominance of China in container shipping is clear from the data on the world’s top 20 seaports with respect to container throughput, about half of which are in China ( 1 ). With the continuous growth of container volume, most seaports in China are suffering from a shortage of terminal space, traffic congestion, and environmental pollution caused by heavy-duty vehicles. More importantly, the road market share is much higher than that of the railway and waterway, and road transportation distance is excessive in the hinterland freight system ( 2 ). The energy consumption ratio per unit turnover of railway, waterway, and road in China is about 1:0.7:5.2 ( 3 ). Therefore, if more medium and long-distance road transportation is shifted to the railway or waterway, it will produce considerable social benefits, and move the freight system in the direction of sustainability.
Under these circumstances, dry ports have gained attention from seaport authorities and local governments in China, which are freight nodes linked to seaports through the railway that allow customers to operate containers as if they were at the seaport ( 4 ). The primary advantage of dry ports over traditional inland depots is that they offer additional services, such as container storage and maintenance and customs clearance ( 5 ). In addition, several pieces of evidence show that dry ports help improve the freight system by decreasing costs, reducing emissions, relieving congestion, and expanding the hinterland of seaports ( 6 ). However, problems such as overcapacity and waste of resources will arise in poorly located dry ports. Thus, it is of great importance to determine the appropriate location at the beginning of the dry port development.
When considering the dry port location, the relationship between shippers and the government cannot be neglected. Specifically, because of the limitation of mode transportation capacity and transit node processing capacity, shippers’ choice behavior for seaports and paths is consistent with the constrained nested logit model. At this time, shippers compete for transportation resources considering their preferences and reach an equilibrium situation ( 7 ). To reduce generalized transportation costs and carbon emissions, the government selects several places to build dry ports. When the set of transportation paths available to shippers changes, they make relevant transportation decisions that offset the government’s choice of location, and eventually, the dry port construction scheme will reach equilibrium.
By exploiting the above relationship, this paper uses the constrained nested logit model and Stackelberg game theory to optimize the dry port multilevel location problem considering capacity constraints and shippers’ choice behavior. The contributions are four-fold. Firstly, this paper combines the multi-attribute decision method with the bilevel programming model, considering macro evaluation factors and micro-economic objectives. We answer the following questions: How many dry ports should be built? What is the location and capacity level of a dry port? How will container cargo flows be distributed on the transportation network? Secondly, the seaport-hinterland container transportation network in the paper contains four transportation modes: road, railway via railway station, waterway, and railway via dry port, instead of only the two modes of road and railway in the existing literature, which is more in line with the actual freight network. Thirdly, the paper constructs the constrained nested logit model based on the entropy maximization principle to incorporate capacity constraints into shippers’ choice behavior for seaports and paths. Fourthly, this study considers the differences in customs clearance and empty container transportation among different transportation modes.
The remainder of the paper is structured in the following way: the literature is summarized in the second section. The third section elaborates on the dry port multilevel location problem and establishes the bilevel programming model. The fourth section describes the two algorithms for solving the problem. The fifth section reports the numerical experiments, which are conducted in China’s Yangtze River Economic Belt (YREB). The sixth section contains the conclusions and research directions.
Literature Review
Dry ports have been extensively studied by many researchers, primarily on the topics of concept, benefit, operation, and location ( 8 , 9 ). The dry port location problem (DPLP) belongs to the hub location problem category. The multi-attribute decision seems to be a common method, and the attributes of environment, economy, infrastructure, and policy are among the general evaluation indicators ( 10 ). For example, Roso et al. ( 11 ) considered legislative, environmental, goods flow, spatial, technological, and organizational criteria. Komchornrit ( 12 ) applied an integrated approach based on confirmatory factor analysis, categorical-based evaluation, and preference ranking organization to select dry ports. Bozicevic et al. ( 13 ) determined locations for dry ports at three different distances by an analytical hierarchy process. A major disadvantage of the above approach is that the weights of the location criteria are based on human experience, which is difficult to measure precisely ( 14 ). Besides, simulation is a powerful tool for hub location problems, but existing studies have mainly used system dynamics simulation to study the relationship among factors affecting dry port operation ( 15 , 16 ), and fewer studies have applied this method to dry port location ( 17 ).
There exists an emerging trend in the study of the DPLP by optimization approaches recently, and the literature is summarized in Table 1. These methods can be divided into two basic design perspectives: single actor and multiple actors, which are related to the perspective of the problem and the modeling approach.
A Classification of Relevant Papers in the Literature
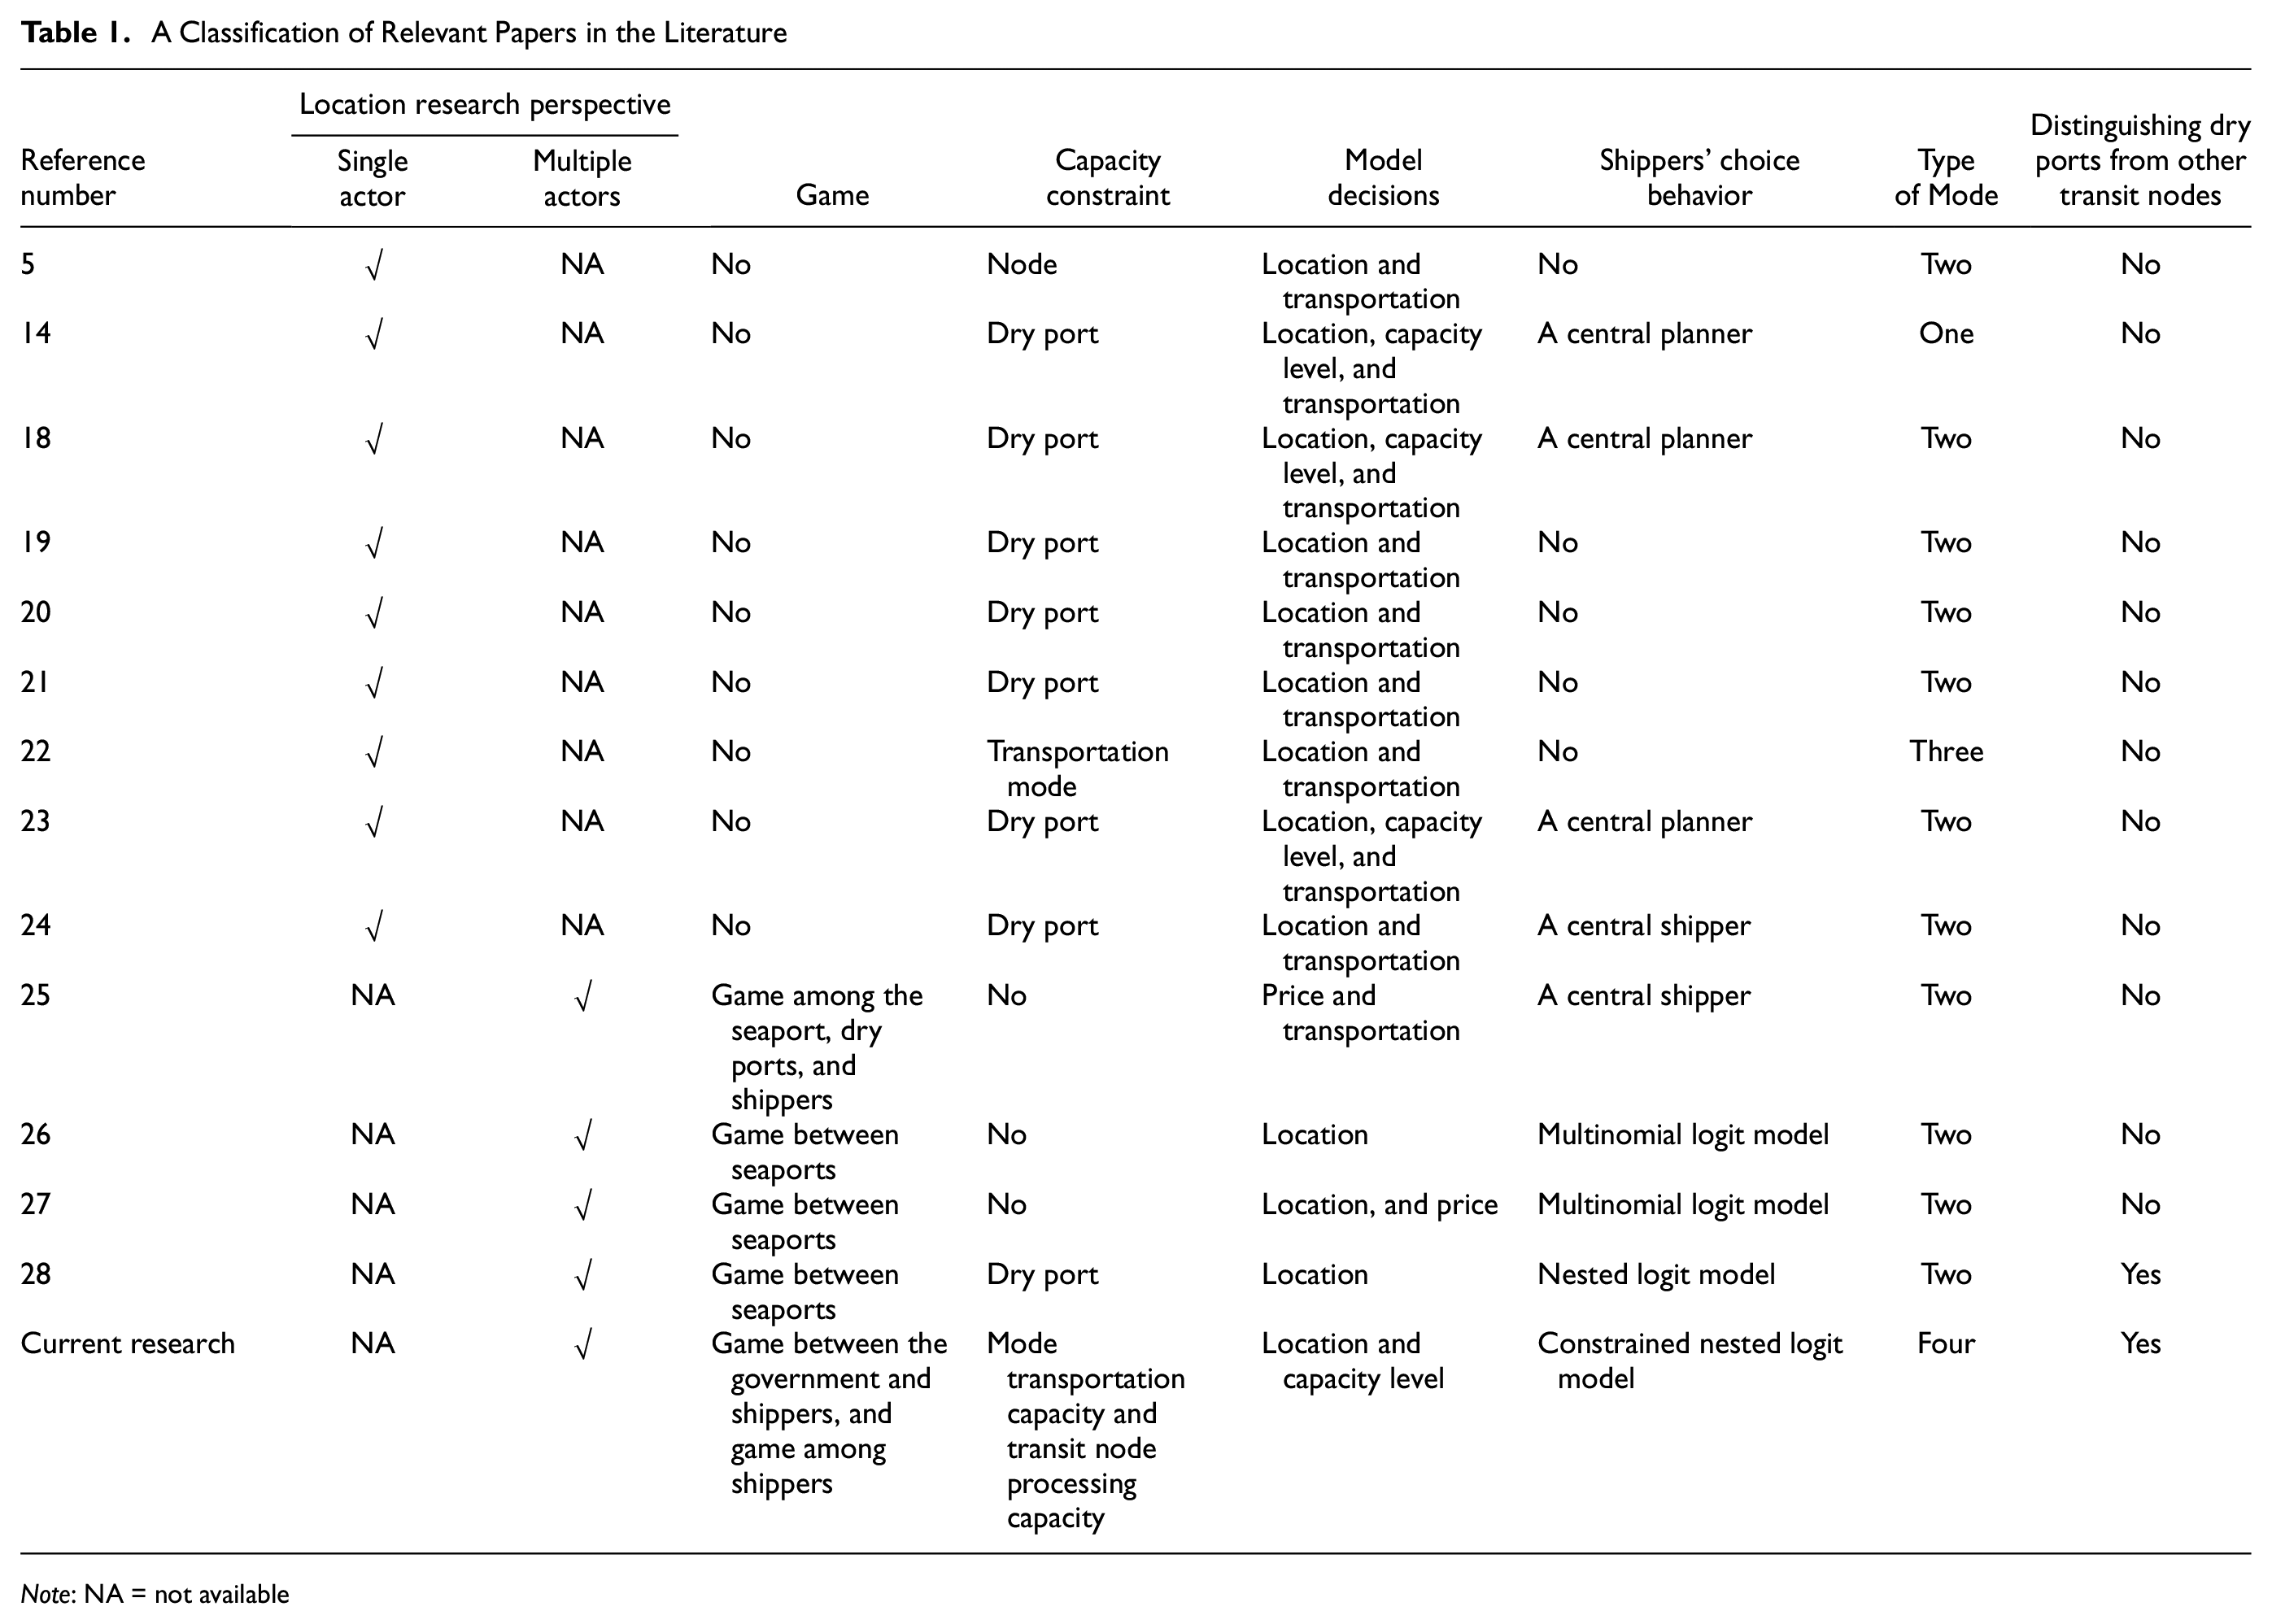
Note: NA = not available
In the single-actor perspective, there is a central planner who decides on dry port locations as well as flow paths to minimize the system-wide costs or carbon emissions ( 18 , 19 ). For instance, Wang et al. ( 20 ) considered the possibility of closing existing dry ports. Ambrosino and Sciomachen ( 21 ) considered dry port capacity constraints. Sarmadi et al. ( 5 ) integrated the decisions of container transportation, inventory, and dry port locations. To emphasize the opposition between economic costs and environmental impact, some authors adopted multi-objective optimization approaches. Mostert et al. ( 22 ) developed a bi-objective mathematical model with three modes and economies of scale. Tsao and Vo-Van ( 23 ) designed a multi-objective model considering uncertainty in demand, carbon emissions, and social costs. Xie et al. ( 24 ) used multi-objective programming and the Technique for Order Preference by Similarity to Ideal Solution (TOPSIS) method to select dry ports in the Shandong Province of China. However, determining the dry port location involves many stakeholders and their goals may conflict. The optimal solution from a single actor cannot solve this situation well. Compared with other modes, the advantages of dry ports with respect to empty container depot storage and customs clearance have been neglected.
On the other hand, a few scholars have taken a multiple-actor perspective, where the DPLP is determined by at least two stakeholders. Game theory is the main modeling technique for solving this kind of problem. For example, Tsao and Vu Thuy ( 25 ) introduced game theory with multi-followers to guide the seaport, dry ports, and shippers to determine decision variables. Xu et al. ( 26 ) studied the DPLP with environmental concerns and seaport competition. Zhang et al. ( 27 ) discussed the competition between two seaports with respect to seaport prices, locations, and service fees at dry ports. Jiang et al. ( 28 ) established a Stackelberg game model and applied the nested logit model to describe the joint choice of shippers on the seaport, mode, and dry port. There are clear differences between what is considered in this paper and the previous research. Firstly, Jiang et al. ( 28 ) studied the location strategy of each seaport considering the game between two seaports, but we optimize the layout of dry ports in a region with multiple seaports from the perspective of the central government. Secondly, we consider the nested logit model together with capacity constraints of nodes and links to form a constrained nested logit model to jointly describe the shippers’ choice behavior, rather than considering both separately in different parts of the model. Thirdly, we consider multiple capacity levels of dry ports with corresponding differences in construction costs. All models in the above research are correlated with the game relationship between seaports and shippers or between seaports. However, owing to the impact of capacity constraints, the game among shippers cannot be ignored.
In conclusion, compared with the generic location planning problem, this paper constructs a bilevel programming model to consider the interaction between the builder (the government) and the users (shippers) of the dry port when studying the DPLP and uses the constrained nested logit model to describe the shippers’ transportation mode choice behavior. Although the above studies have important references for this paper, they only treat dry ports as general transit nodes, and rarely consider the effect of dry ports on intermodal transport with respect to reducing empty container transportation time and customs clearance time and improving efficiency. Research on the game among shippers when choosing paths and seaports in the DPLP is even scarcer. Besides, results according to the multi-attribute decision are only ideal locations at the macro level. At the micro level, some additional factors need to be considered, such as costs and efficiency, to attract enough shippers to maintain economic viability ( 29 ). Therefore, based on previous research, the paper combines the multi-attribute decision method with a bilevel optimization model to solve the DPLP considering macro factors and micro-economic objectives. Specifically, we use the fuzzy C-means (FCM) method to analyze which cities are more suitable for the construction of dry ports by considering macro factors, including the local economic condition, traffic status, and policy environment. Then, we develop a bilevel programming model with the aim of cost minimization (micro factors) to identify the dry port construction plan among candidate dry port locations. At the upper level, the government is the main decision-maker, and seeks to minimize total costs by constructing multilevel dry ports, considering the storage time at transit nodes for laden containers, customs clearance time, and empty container transportation time. At the lower level, shippers’ reaction to the government’s strategies is depicted by the constrained nested logit model.
Problem Description
For the sake of clarity, we present the dry port multilevel location problem with respect to export flows for containerized cargo. The problem could be reversed by considering import flows. We assume that dry ports have different capacity levels and corresponding differences in construction costs. The government makes strategic decisions on the dry port location under the constraint of the investment budget. Meanwhile, to keep the dry port construction economically viable, the number of containers transiting via this dry port needs to exceed the minimum value set in advance. Shippers make operational decisions about seaports and paths. In reality, the network capacity is limited, and shippers need to compete for these transportation resources.
The port-hinterland freight network in the paper comprises hinterland freight demand nodes, potential locations for dry ports, railway stations, inland waterway terminals, and seaports, as illustrated in Figure 1. Moreover, we consider three functions of dry ports: one is that shippers can complete customs clearance operations at dry ports, including the customs declaration, inspection, and so forth. Among them, the customs declaration can be managed electronically, and inspection needs to be conducted on-site. Since all of the above actions are handled by the customs agency established at dry ports, it is equivalent to completing all customs clearance procedures at dry ports; the second is that shippers can directly pick up empty containers at dry ports; the third is that because of operational priorities and train density, the storage time for laden containers at dry ports is shorter than at other transit nodes. For export businesses, this results in four modes, as shown in Figure 2. Since empty containers are already stored at dry ports and waterway terminals, shippers can pick them up directly instead of waiting for empty containers to be transported from the seaport. Road and railway via station require picking up empty containers from seaports. Thus, the process of transporting empty containers differs in each transportation mode. This paper synthesizes the variability of empty container transportation time among transportation modes. For cargoes transported by road, empty container transportation time is equal to the travel time from the demand node to the seaport. For railway via station, it is the sum of railway transportation time from the seaport to the railway station, road transportation time from the railway station to the demand node, and waiting time for trains at the seaport and railway station. For waterway or railway via dry port, it is the road travel time between the waterway terminal/dry port and the demand node. The waiting time at transit nodes when picking up empty containers is the waiting time for empty containers in the yard of the transit nodes until the departure of the transport vehicle (train/ship) according to the schedule. Among the four modes, only the railway via station involves waiting time, while the other modes can pick up empty containers for direct transportation on arrival at the location of the empty containers. In addition, customs clearance time has differences for the four modes. Road transportation and railway via station need to complete customs clearance at the seaport, including the customs declaration and inspection. Waterway transportation requires a separate customs declaration at the inland waterway terminal and seaport, with the possibility of inspection occurring at both locations, resulting in the longest time. The railway via dry port can complete customs clearance at the dry port, which takes the least amount of time because of the proximity of the dry port and the small amount of business handled by the customs agency. Thus, the order of customs clearance time is as follows: waterway transportation > road transportation = railway transportation > railway via dry port.
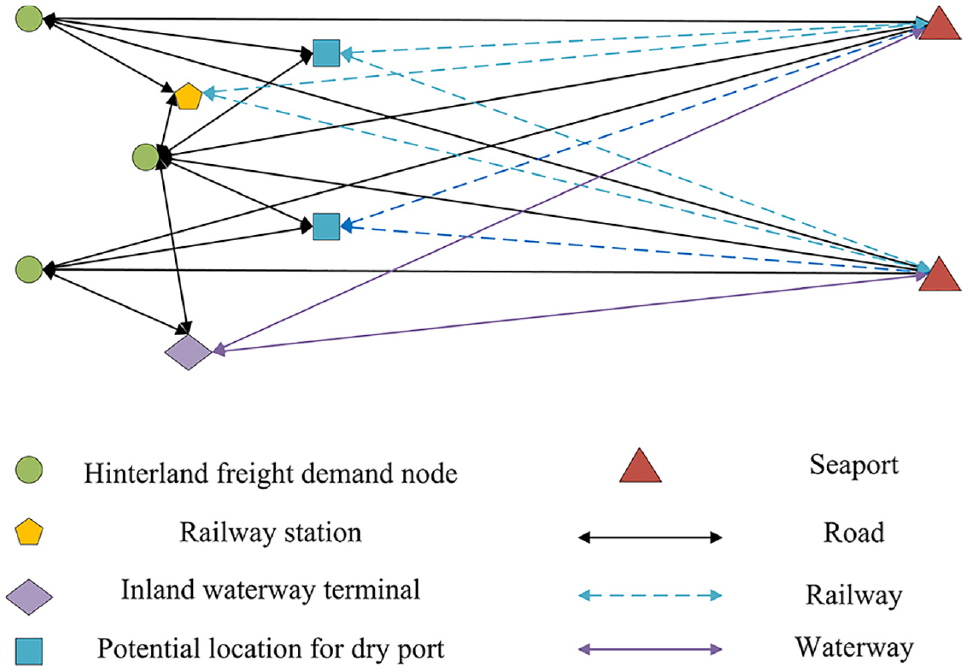
The port-hinterland freight network.
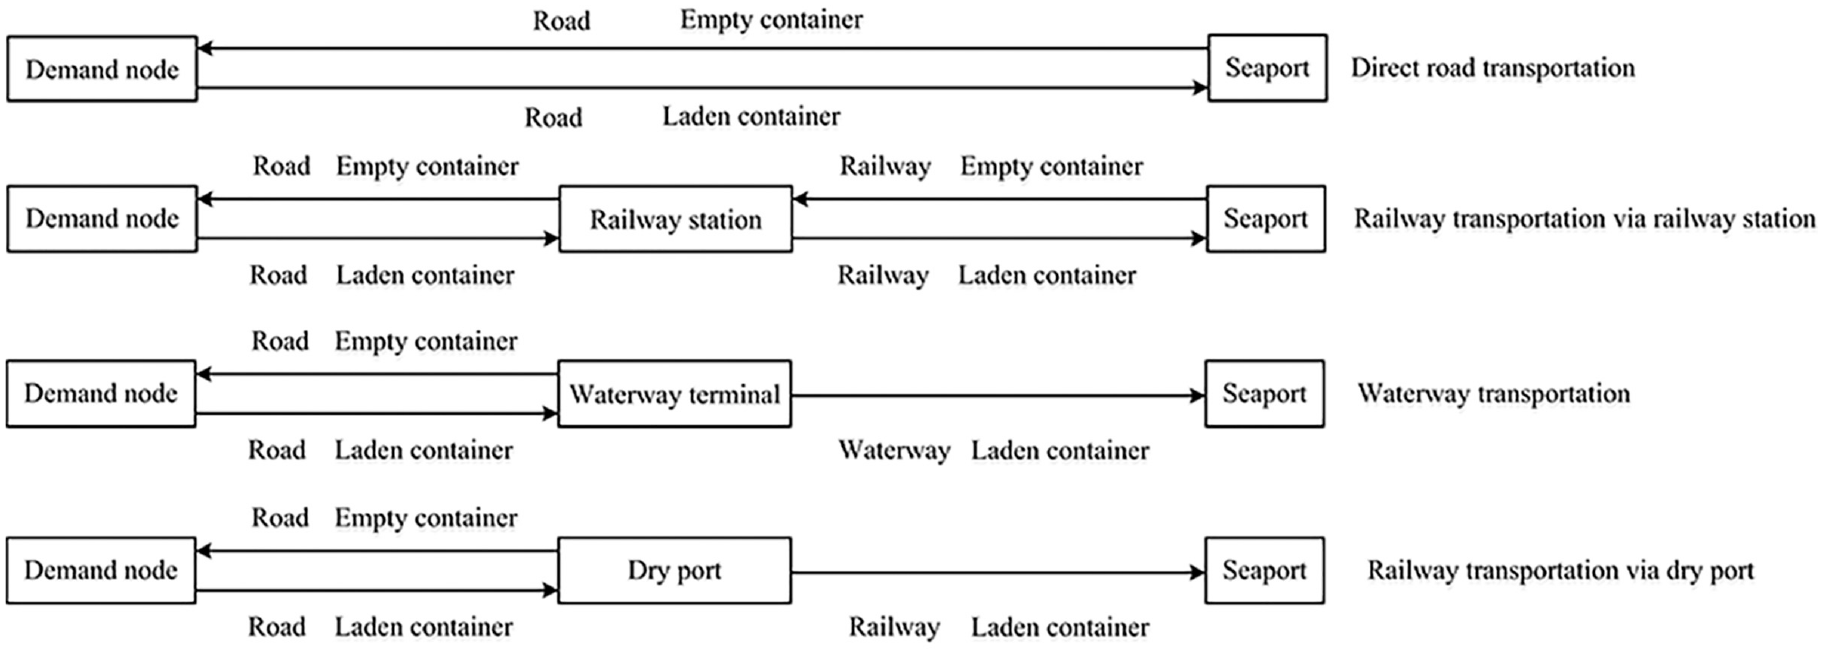
Transportation modes.
Model Formulation
Dry Port Decision-Making Framework
Dry port location mainly includes two stages, as shown in Figure 3. Firstly, considering macro factors such as the economic condition, traffic status, and policy environment, the set of candidate locations suitable for building dry ports is identified according to the cluster analysis method. Secondly, with the objective of minimizing costs, the best dry port construction plan is selected based on a bilevel programming model and shippers’ choice behavior.
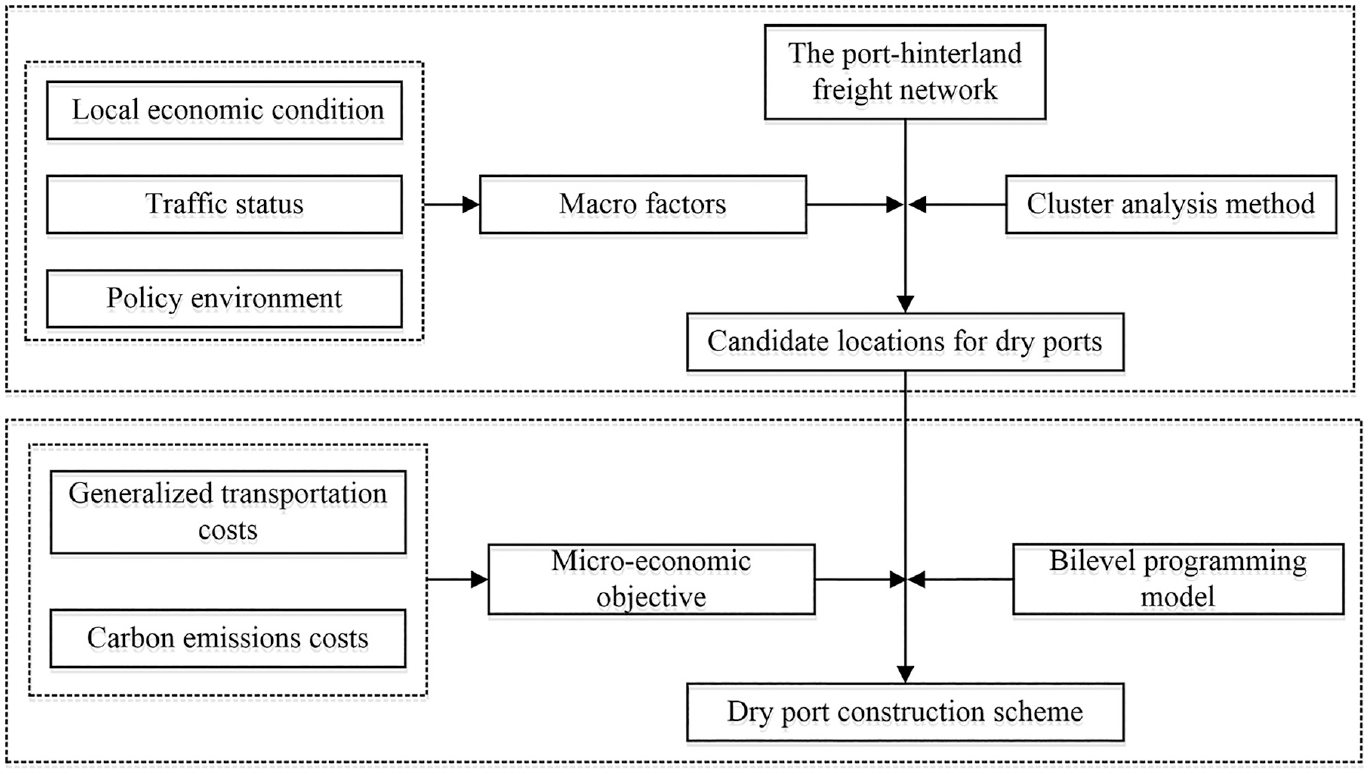
The decision-making framework.
Notation
The transportation network is expressed as
Main Notations
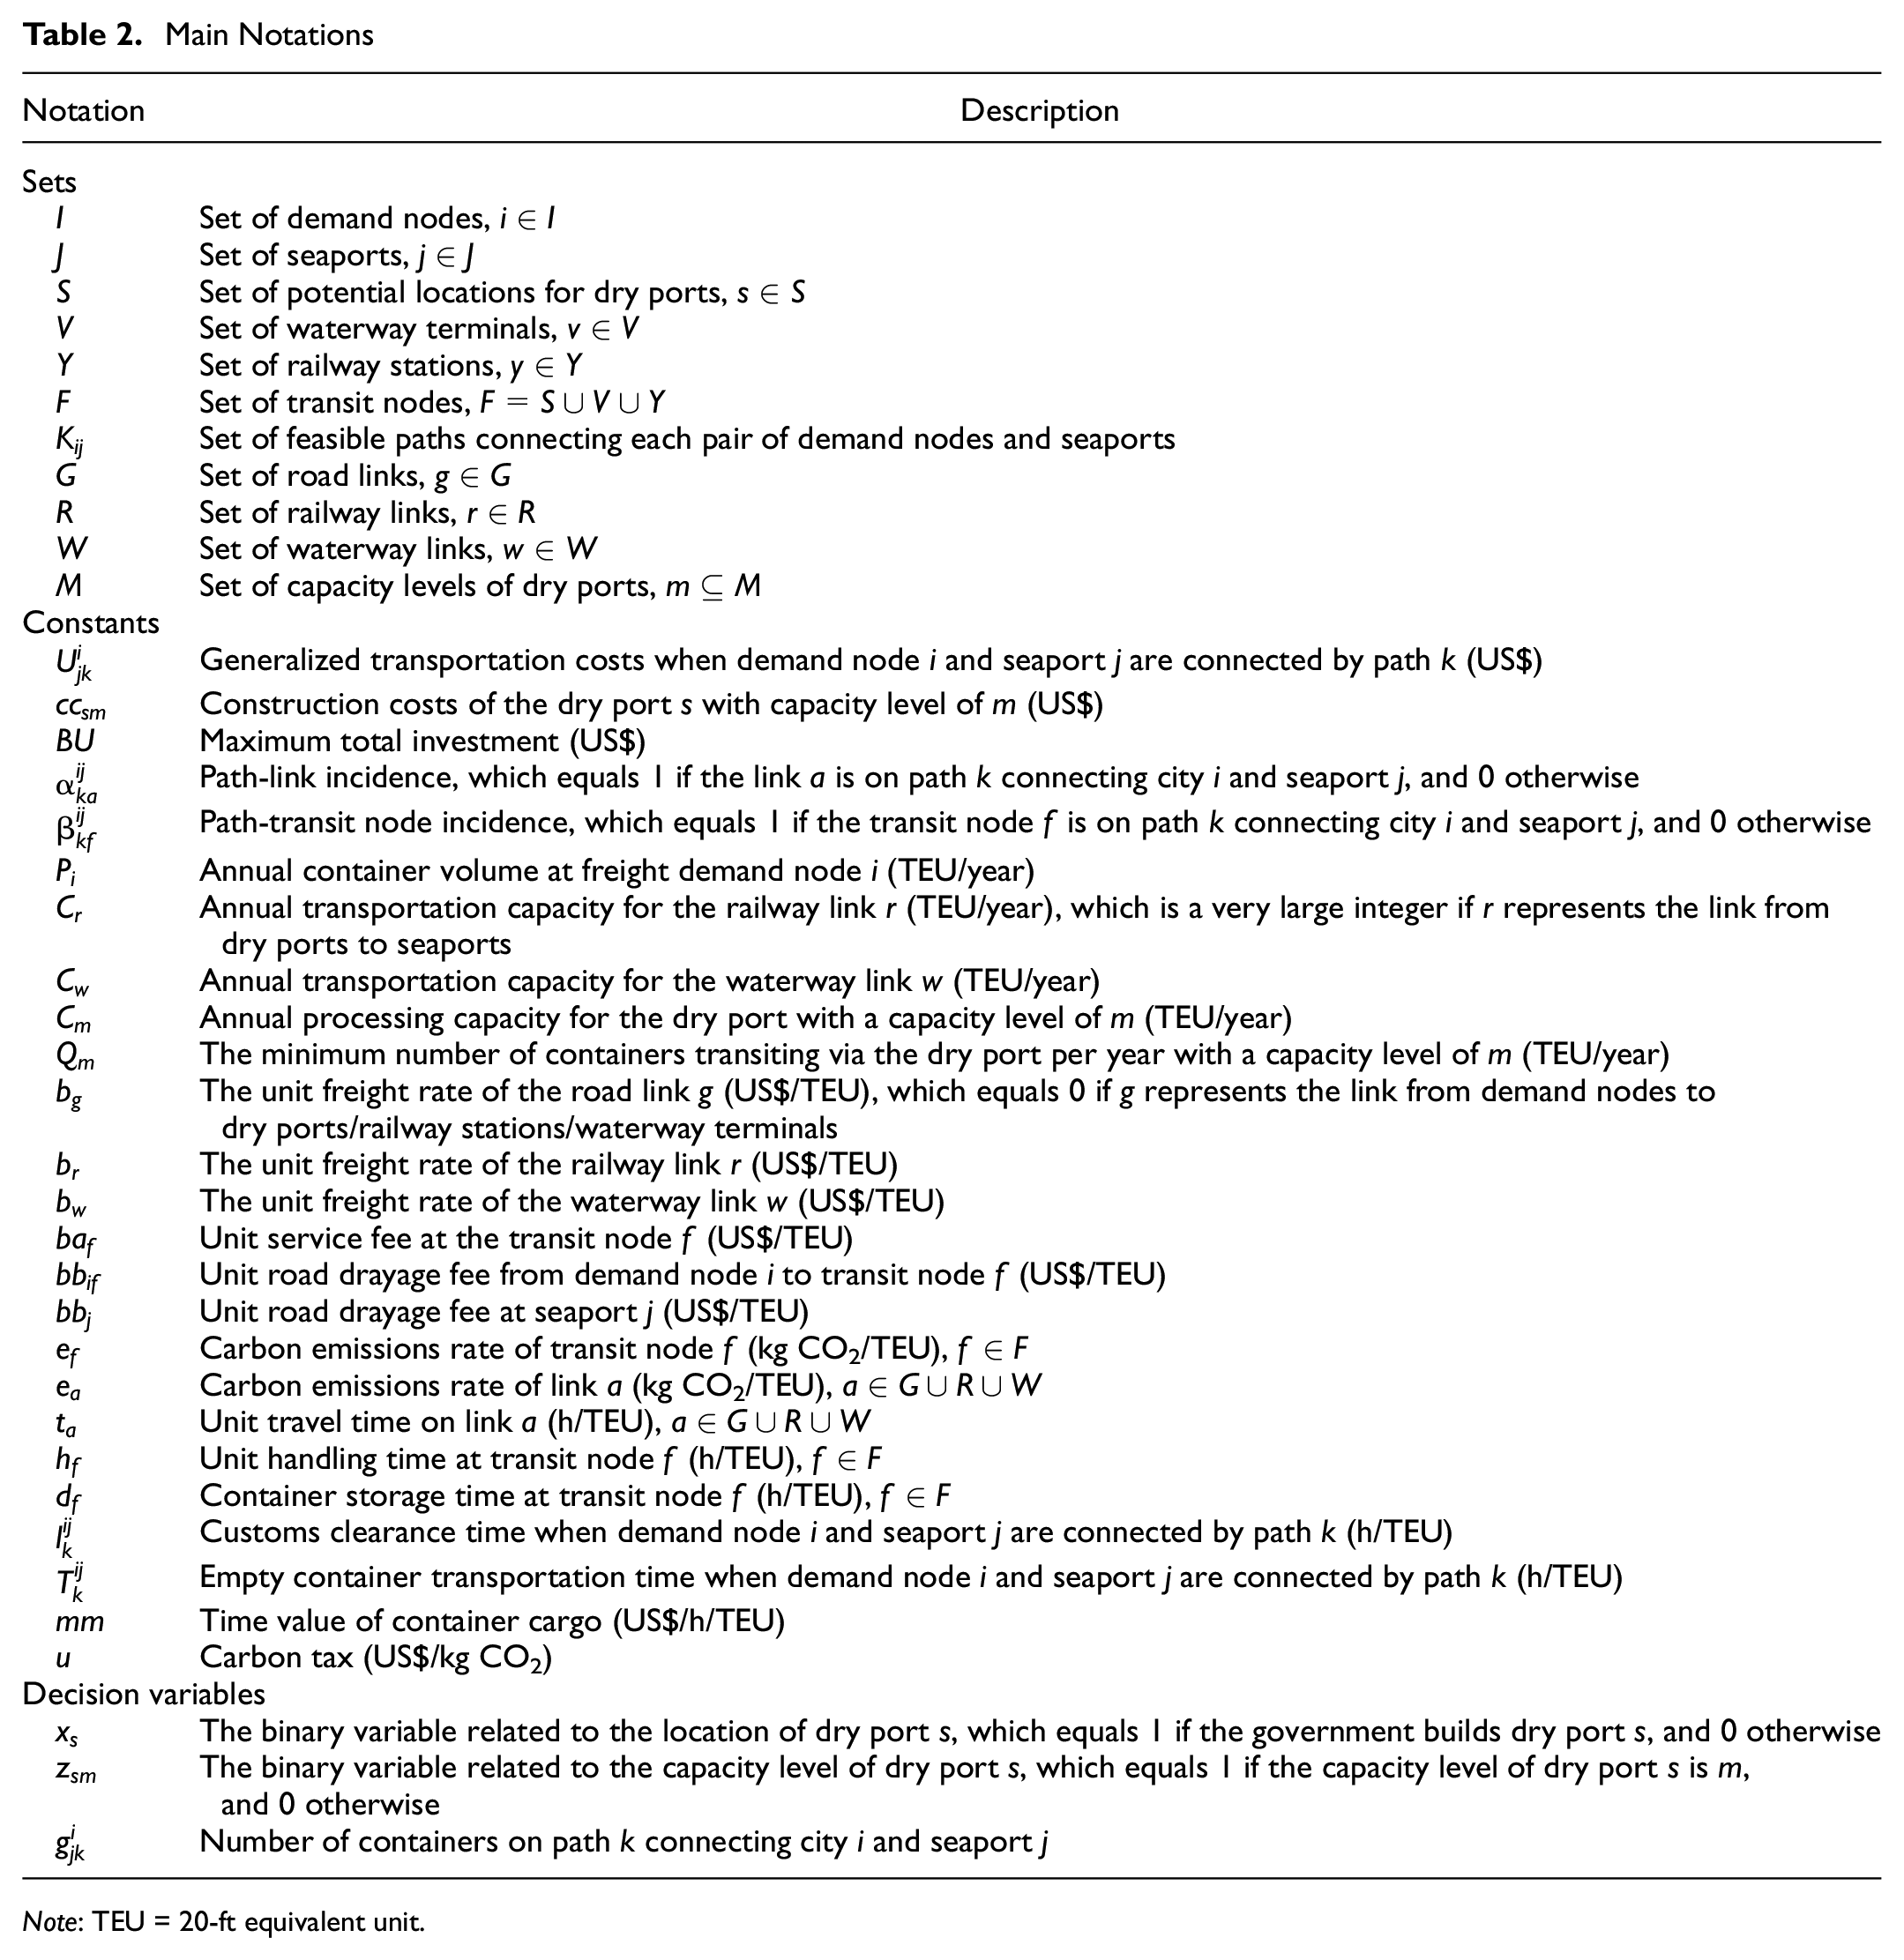
Note: TEU = 20-ft equivalent unit.
Candidate Locations for Dry Ports
Dry ports serve container intermodal transport and international trade, so the location of dry ports should fully consider the local economic condition, traffic status, and policy environment ( 10 ).
Local economic condition: the level of local economic development affects the size of container cargo, as well as the amount of goods that needs to be transported to the region for production and consumption. The economic condition is measured by the evaluation indicators of gross domestic product, total foreign trade import and export, the number of industrial enterprises above the scale, and total retail sales of social consumer goods.
Traffic status: with perfect transportation facilities, dry ports can expand the scope of attraction for cargo, especially for transshipment containers. Therefore, traffic status is the main factor affecting the location of dry ports, which can be reflected by the evaluation indicators of total regional freight volume and grade road miles.
Policy environment: regional transportation must be subject to the requirements of national macroeconomic and transportation development planning. The national policy guidance and support will profoundly affect the degree of perfection of the regional transportation network. We use two indicators, the administrative attribute and logistics hub index, to assess the policy environment. The administrative attribute is 1 if the city is a municipality or provincial capital, and 0 for others. According to the China Logistics Hub Layout and Construction Plan, the logistics hub index value is 2 if the city is nominated as a dry port type national logistics hub, 1 for other types of national logistics hubs, and 0 otherwise.
Combining the above indicators, the FCM method is employed to analyze which cities are more suitable for constructing dry ports. To identify the optimal number of clusters, we use the clustering effectiveness index
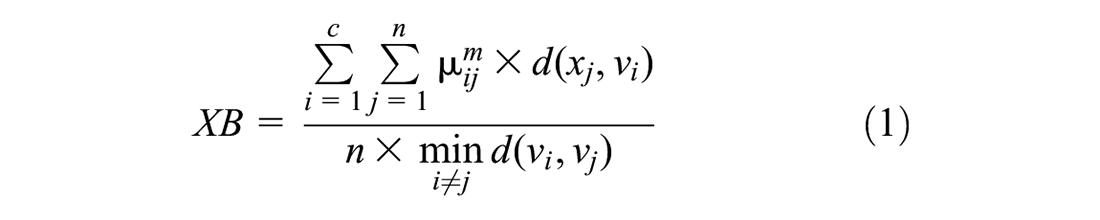
where
Dry Port Location Optimization Model
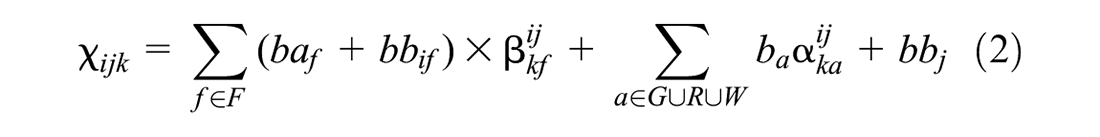
Generalized Transportation Costs
Shippers make decisions on paths and seaports depending on the generalized transportation costs, namely transport costs, time, and carbon emissions.
Transport costs
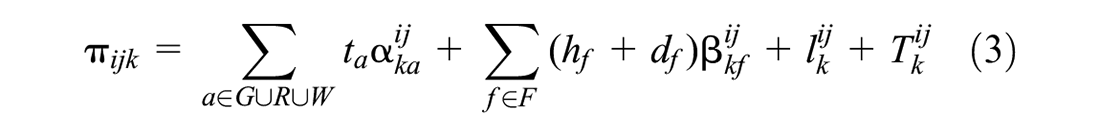
Transport time
Carbon emissions are generated during link transportation and transit node operations. We use

In summary, the generalized transportation costs can be expressed as follows:

Shippers’ Choice Behavior
The choice of seaport determines the choice set of paths, which are given exogenously. In addition, unobserved attributes of different paths to a seaport are likely to be correlated. To avoid irrelevance between paths in the multinomial logit model, the nested logit model is introduced, and the decision process is shown in Figure 4. The probability of shippers at the demand node

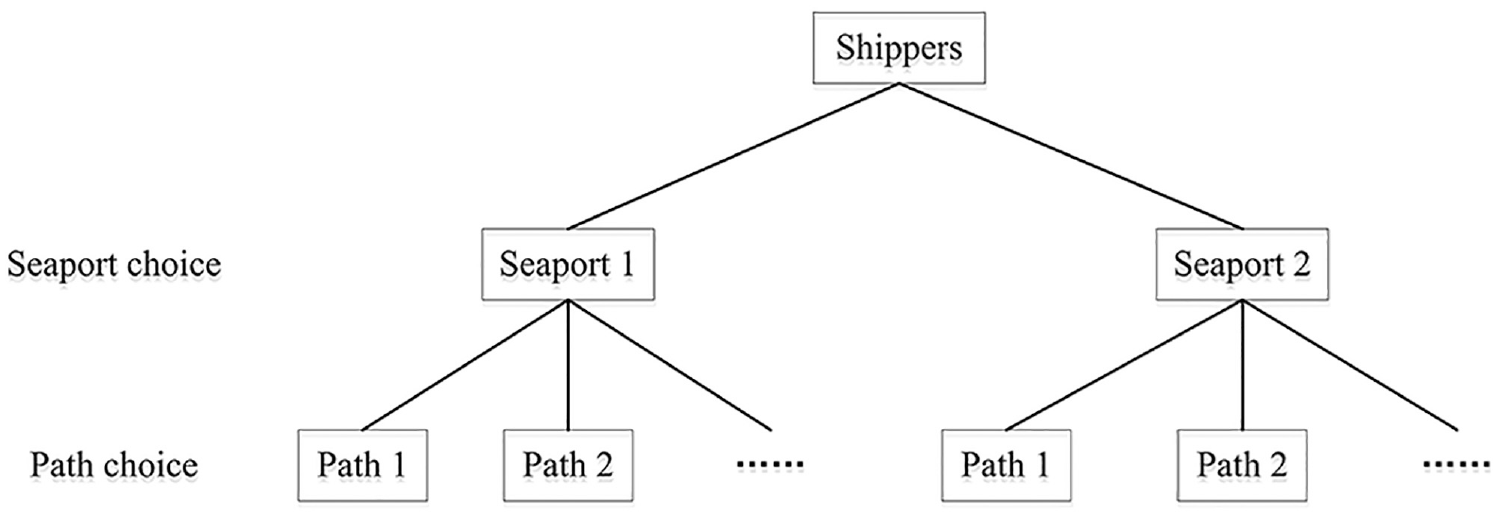
The structure of shippers’ choice behavior.
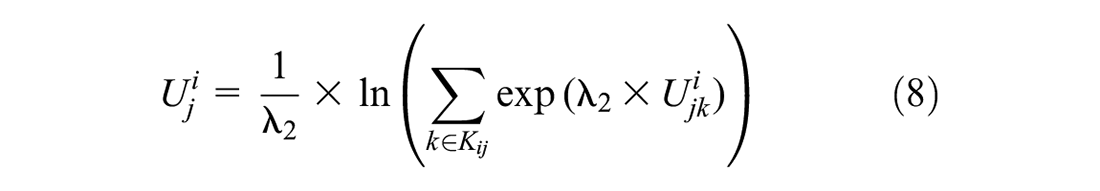
In addition, the probability of shippers at the demand node

In the above two equations,
The number of containers transported by shippers at demand node

Moreover,

In this paper, we consider capacity constraints (system thresholds) in the study of shippers’ choice behavior, including link transportation capacity and transit node processing capacity. Thus, the nested logit model should incorporate capacity constraints. Specifically, dry ports mainly serve seaports, and when the number of containers transported by dry ports increases, seaports, dry ports, and railway authorities will work together to increase the link transportation capacity (the number of container trains) to meet the transport demand. Therefore, this article considers the limitation of dry port processing capacity, not the link capacity from dry ports to seaports. Besides, for waterway terminals/railway stations, because they serve not only seaports but also other nodes for domestic cargo transportation, we consider the transportation capacity constraints of waterway/railway links.
The theory of consumer behavior uses utility maximization to interpret how users choose among alternatives. Anas ( 30 ) showed that entropy maximization and utility maximization were two equivalent views of the same problem. According to Espinosa-Aranda et al. ( 7 ), entropy maximization permits the incorporation of constraints, resulting in the constrained nested logit model whose solution satisfies the classic nested logit probability equations. This approach leads to the following problem:
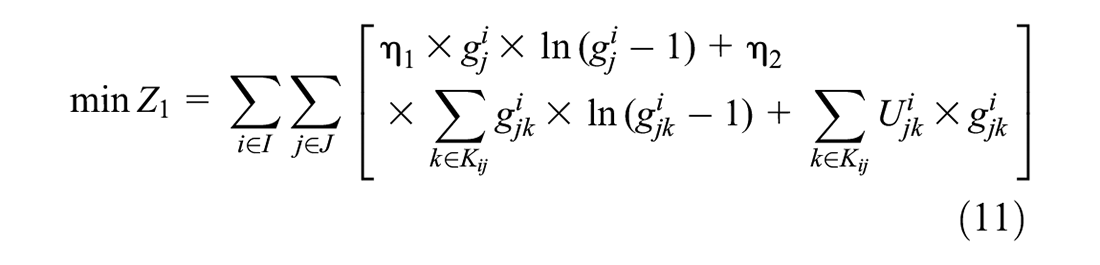
subject to the following:


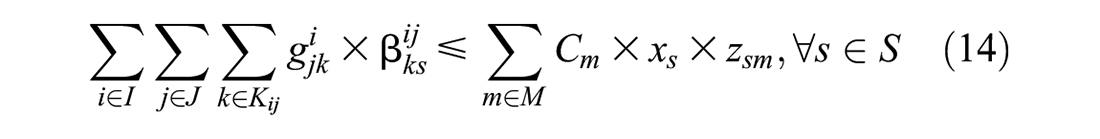

where
Model Establishment
We build a bilevel programming model. The higher level produces the dry port location scheme. At the lower level, shippers who understand paths and associated costs choose a specific path and seaport to export containers.
Upper level:


Lower level: see Equations 10–14.
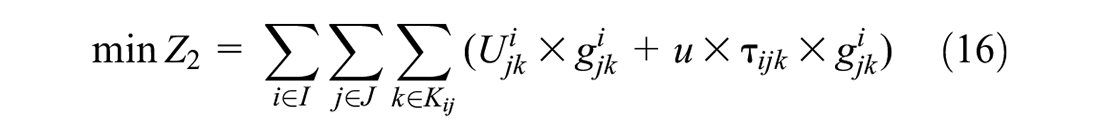
The objective function (Equation 16) is composed of two parts. The first part is generalized transportation costs. The second part indicates the relevant carbon emissions costs. The constraint in Equation 17 ensures that a capacity level should be assigned to the dry port when it is built. The constraint in Equation 18 prohibits the sum of construction costs exceeding the maximum total investment. The constraint in Equation 19 indicates that if a new dry port is constructed, the number of containers transiting through it shall be greater than the specified minimum quantity. The constraint in Equation 20 represents the upper-level binary variables.
Solution Procedure
The bilevel mathematical model is difficult to solve as it is a non-deterministic polynomial-time hard (NP-hard) problem ( 31 ). Because the lower-level model objective function is nonlinear and decision variables are discrete in both layers, the model in the paper is an integer nonlinear bilevel programming model, making the problem more complicated. The complete enumeration method enumerates all government plans for dry port locations and the corresponding responses of shippers. However, this method is inefficient when the number of alternative plans is large. At this time, the hybrid genetic algorithm is designed to determine solutions for large-size instances, which is widely used to solve real-world transportation network design ( 32 ).
Complete Enumeration Algorithm
We first offer a complete enumeration algorithm for small-size instances, which can also be a benchmark to check the quality of other algorithms. The complete enumeration algorithm has a running time of
Step 1. Initialization. Generate the set of dry port location schemes
Step 2. Calculating the number of containers on each path. For each scheme
Step 3. Judgment of infeasible schemes. For
Step 4. Calculating the objective value. Based on the objective function of the upper-level model, the objective value is calculated for
Step 5. Determining the optimal solution. Compare the objective values for
Hybrid Genetic Algorithm
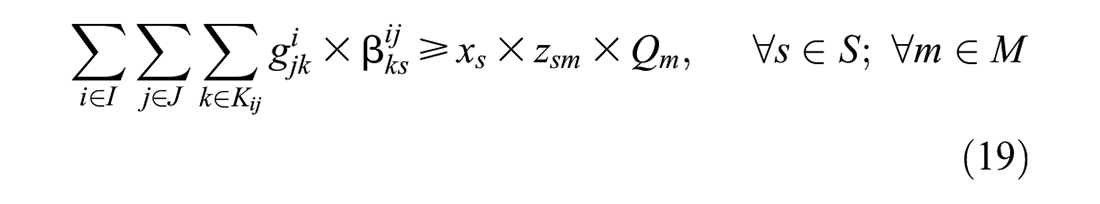
This section describes a hybrid genetic algorithm, that is, improved measures are adopted in the traditional genetic algorithm to expand the search scope and make up for the weakness of easily falling into the local optimal solutions. The tabu table from the tabu search algorithm and the probability that represents whether inferior solutions are acceptable are introduced into the population generation process to increase the algorithm exploration ability to skip the local optimum (
33
–
35
). Besides, the neighborhood search operator is performed on some individuals to enhance the exploitation ability. In addition, to promote population diversity and balance the search efficiency between local and global optimization, the dynamic parameters
Step 1. Parameter initialization. The population size (
Step 2. Generating the initial population. The decision variables of the upper-level model are encoded in real numbers and each individual in the population is represented as a matrix with two rows and
Step 3. Generating a new population. Based on the roulette wheel selection, an individual is chosen from the population. If the random number
Step 4. Calculating the flow distribution. According to the new individual, a port-hinterland freight network is constructed, in which the lower-level model is solved by a sequential quadratic programming method to obtain
Step 5. Judgment of infeasible individuals. If the inequality of
Step 6. Judgment of individual quality. If the fitness value
Step 7. Determining whether or not to accept an inferior solution. If random number
Step 8. Judgment of the population generation termination condition. If the number of new individuals is equal to
Step 9. Updating the tabu table. Individuals in the population are ranked from smallest to largest with respect to their fitness values, and the smallest fitness value that does not exist in the tabu table is selected and put into the tabu table. The individual corresponding to this fitness value is considered the best individual for this iteration.
Step 10. Updating
Step 11. Stopping criterion. If
The hybrid genetic algorithm process.
Case Study
Case Presentation
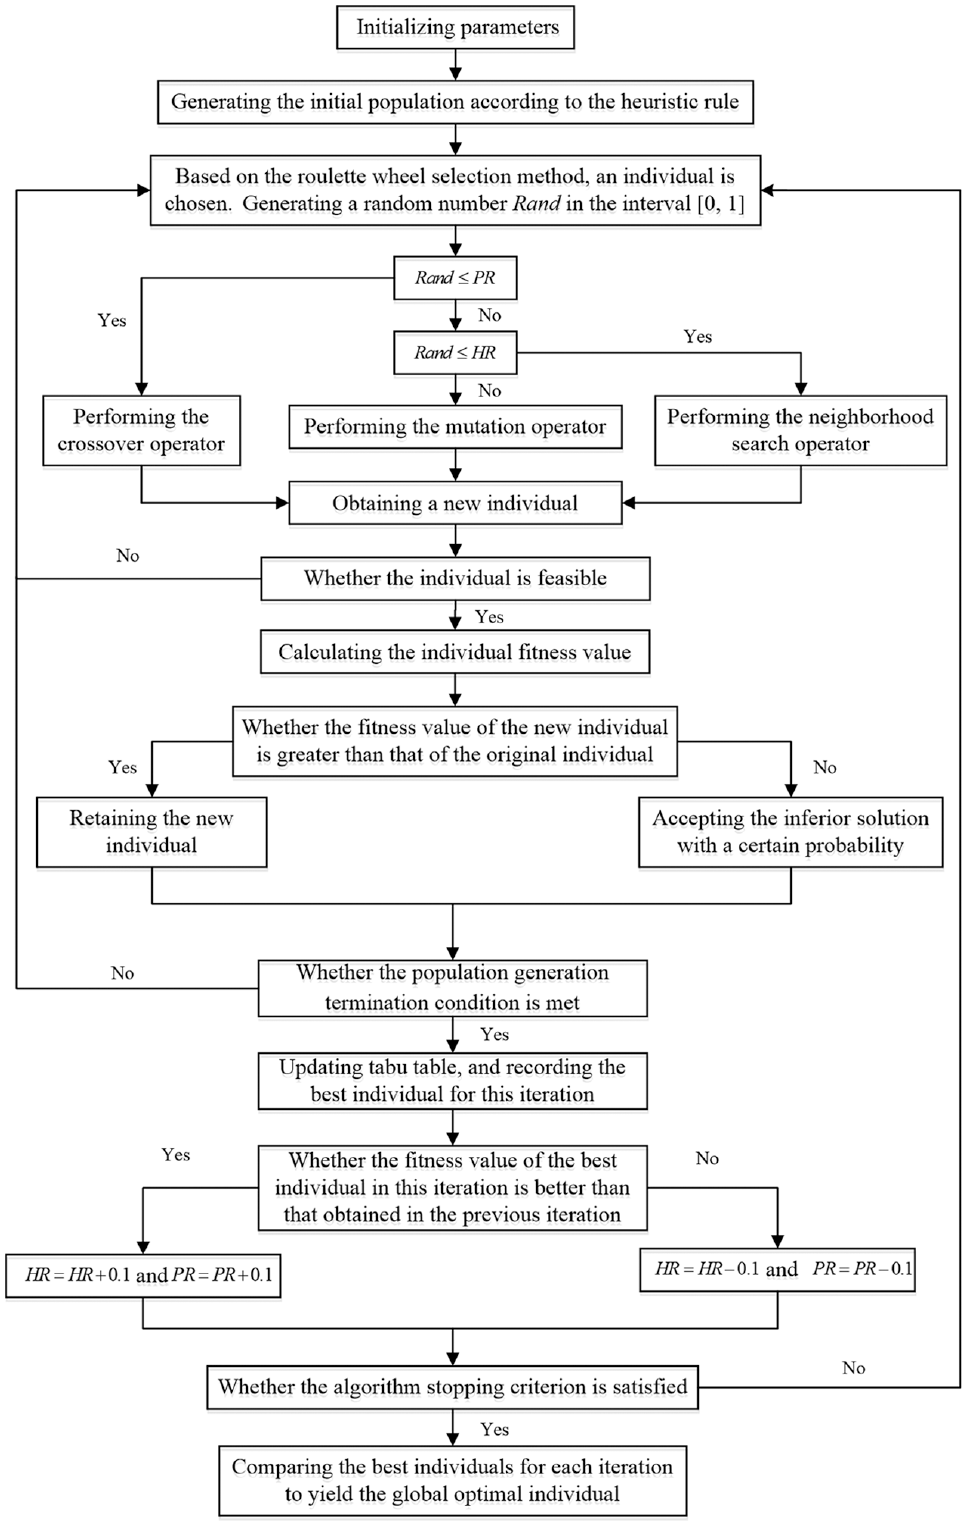
China’s YREB covers 11 provinces and municipalities, accounting for more than 40% of the national population and gross domestic product. Over the years, seaports have built dry ports in the YREB, but all of them only consider their interests, making the layout of dry ports unreasonable and causing problems such as overcapacity and waste of resources in some areas. Therefore, we analyze the YREB as an example to help the central government review/redesign dry port construction from the perspective of global optimization and consider the impact of the shippers’ choice behavior on the layout of dry ports. The transportation network is shown in Figure 6, comprising 35 demand nodes, 2 seaports, 9 inland waterway terminals (WT 1–9), 12 railway stations (RT 1–12), and 13 potential locations for dry ports.
The transportation network for the Yangtze River Economic Belt.
The annual container transportation volume at each freight demand node is obtained by multiplying the export value by the seaborne export ratio and dividing it by the cargo value. Among them, the cargo value is set at 38,880 US$/20-ft equivalent unit (TEU), and the seaborne export ratio is 0.7 for Jiangsu, Zhejiang, and Anhui Provinces, and 0.3 for the others. The main input parameters are shown in Table 3. Link transport costs are equal to the product of the distance and freight rate. The freight rate is a fixed value and does not vary with distance. Data on distances and costs for railway transportation are from the China Railway Website, and data on waterway distances are collected from the website of the Yangtze River Waterway Bureau. In addition, other data on costs, time, and emissions are based on previous research ( 2 ).
Main Parameters
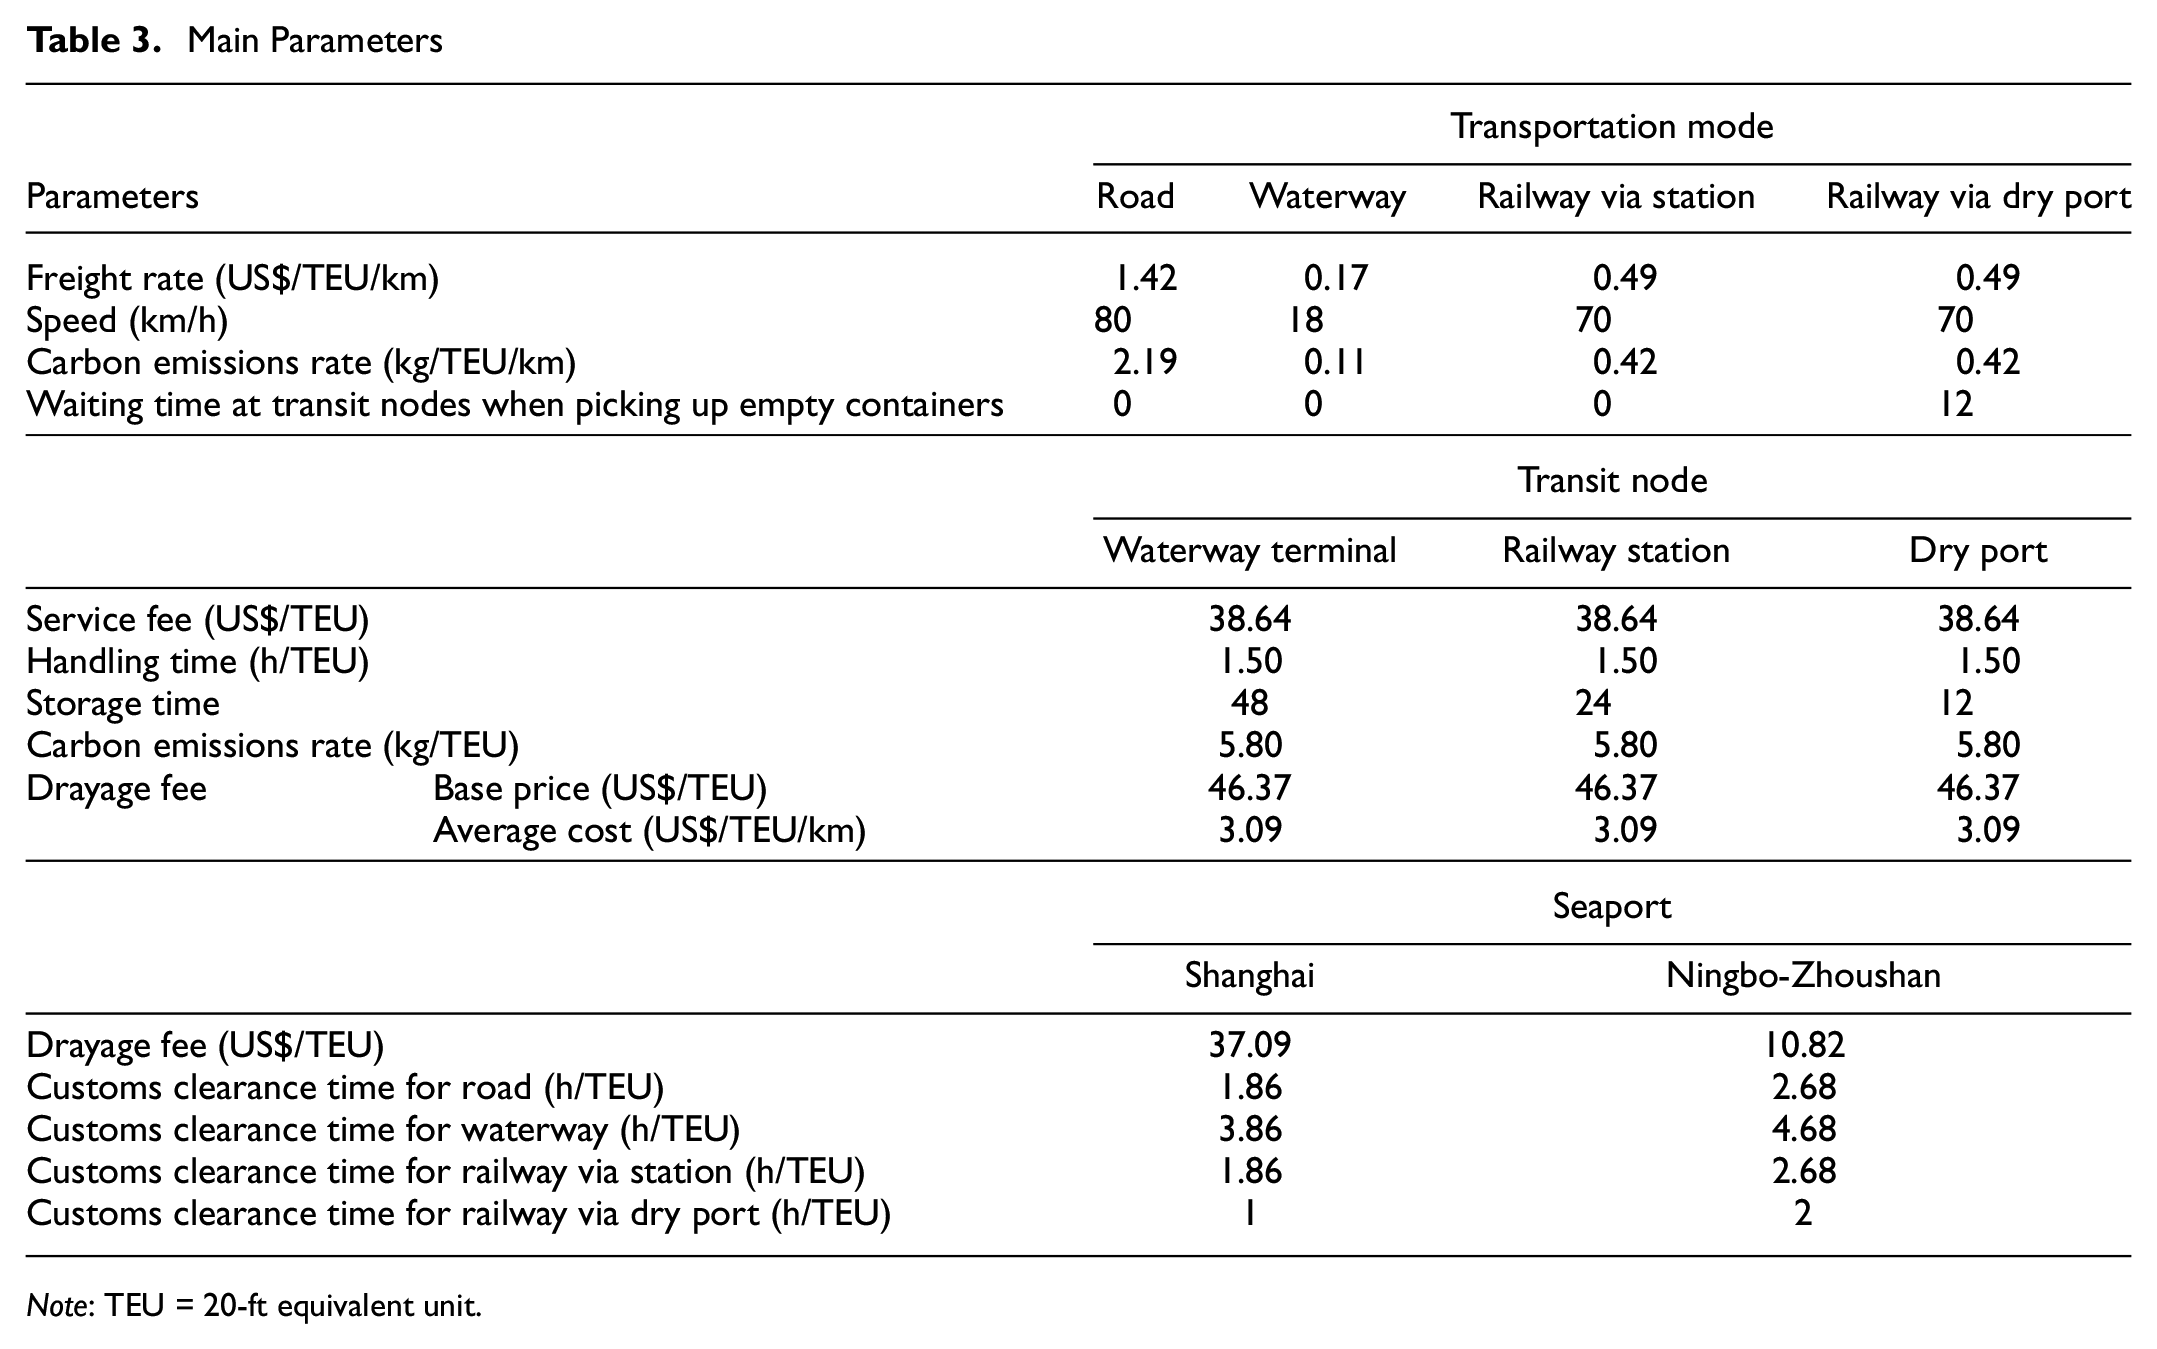
Note: TEU = 20-ft equivalent unit.
Based on the investigation of Xie et al. ( 24 ), there are three capacity levels of dry ports, namely 100,000, 200,000, and 400,000 TEU/year, and the corresponding construction costs are 38.6, 77.3, and 155 million U.S. dollars, respectively. In addition, the minimum number of containers transiting via the dry port is 65% of its capacity level, and the maximum total investment is 1.236 billion U.S. dollars. Trains from railway stations to each seaport are generally one to three times per day in the YREB. By searching the main liner routes and service frequency from the official website of shipping companies, the number of liners from WT (1–9) to Shanghai seaport every week is 33, 40, 17, 10, 20, 10, 13, 5, and 2, respectively. However, the data on liner routes of the Ningbo-Zhoushan seaport is incomplete. Because Shanghai seaport has formed a suppression advantage over Ningbo-Zhoushan seaport in liner shipping routes, we assume that the number of liners arriving at Ningbo-Zhoushan seaport is one-third of that at Shanghai seaport.
Screening Candidate Dry Port Locations
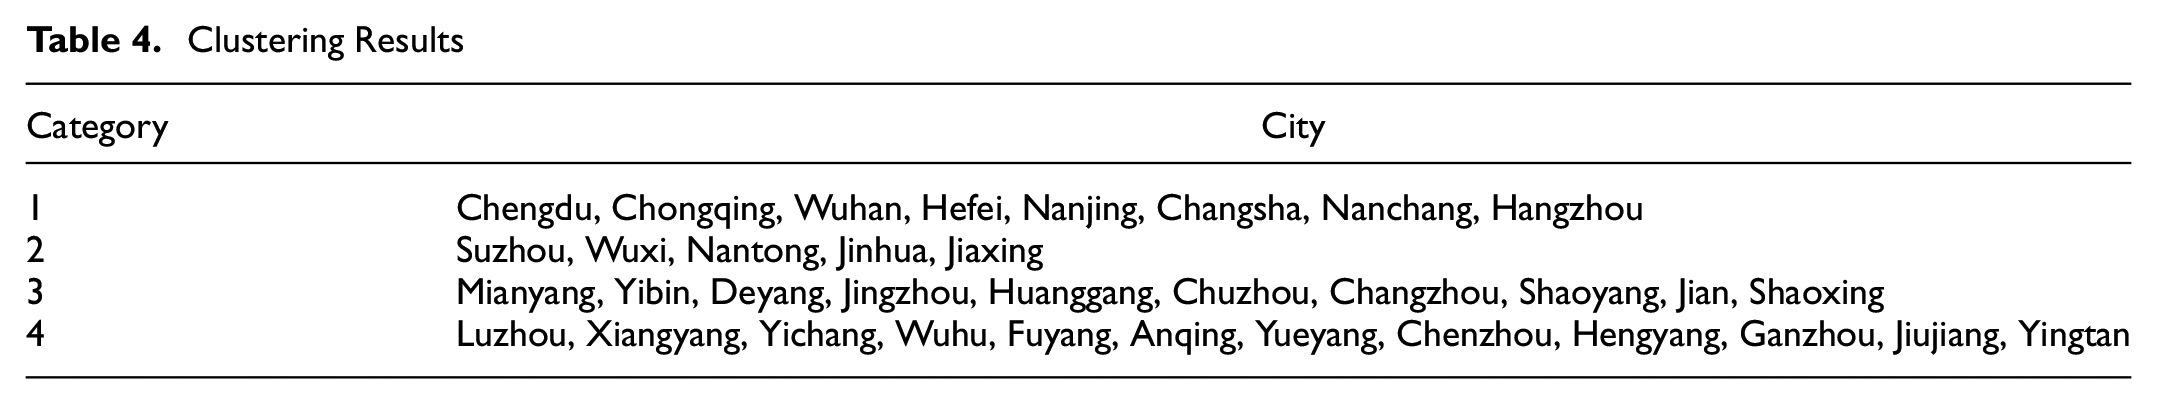
The data is obtained from the China Urban Statistical Yearbook and provincial statistical yearbooks in 2021. When the number of clusters is four,
Clustering Results
Optimal Dry Port Location Results
Three scenarios are considered to analyze the dry port location, as shown in Table 5: the benchmark scenario (S0), where there is no dry port construction plan; the total costs scenario (S1), where the objective of the government is to minimize the sum of system transportation costs and carbon emissions costs; and the carbon emissions scenario (S2), where the objective of the government is to minimize carbon emissions. The number of dry port construction plans is 67,108,864 and the computation time for each plan is estimated to be 2.27 s, which results in 1763 days if the complete enumeration method is used. Therefore, the paper uses a hybrid genetic algorithm, and the computation time for both scenarios S1 and S2 is about 165 min. The algorithm was implemented in MATLAB 2020, and the lower-level model was solved by the Fmincon function. The population size is 10, the maximum number of iterations is 1000, the tabu table length is 5, and the probability of accepting inferior solutions is 0.1.
Computation Results Under Three Scenarios
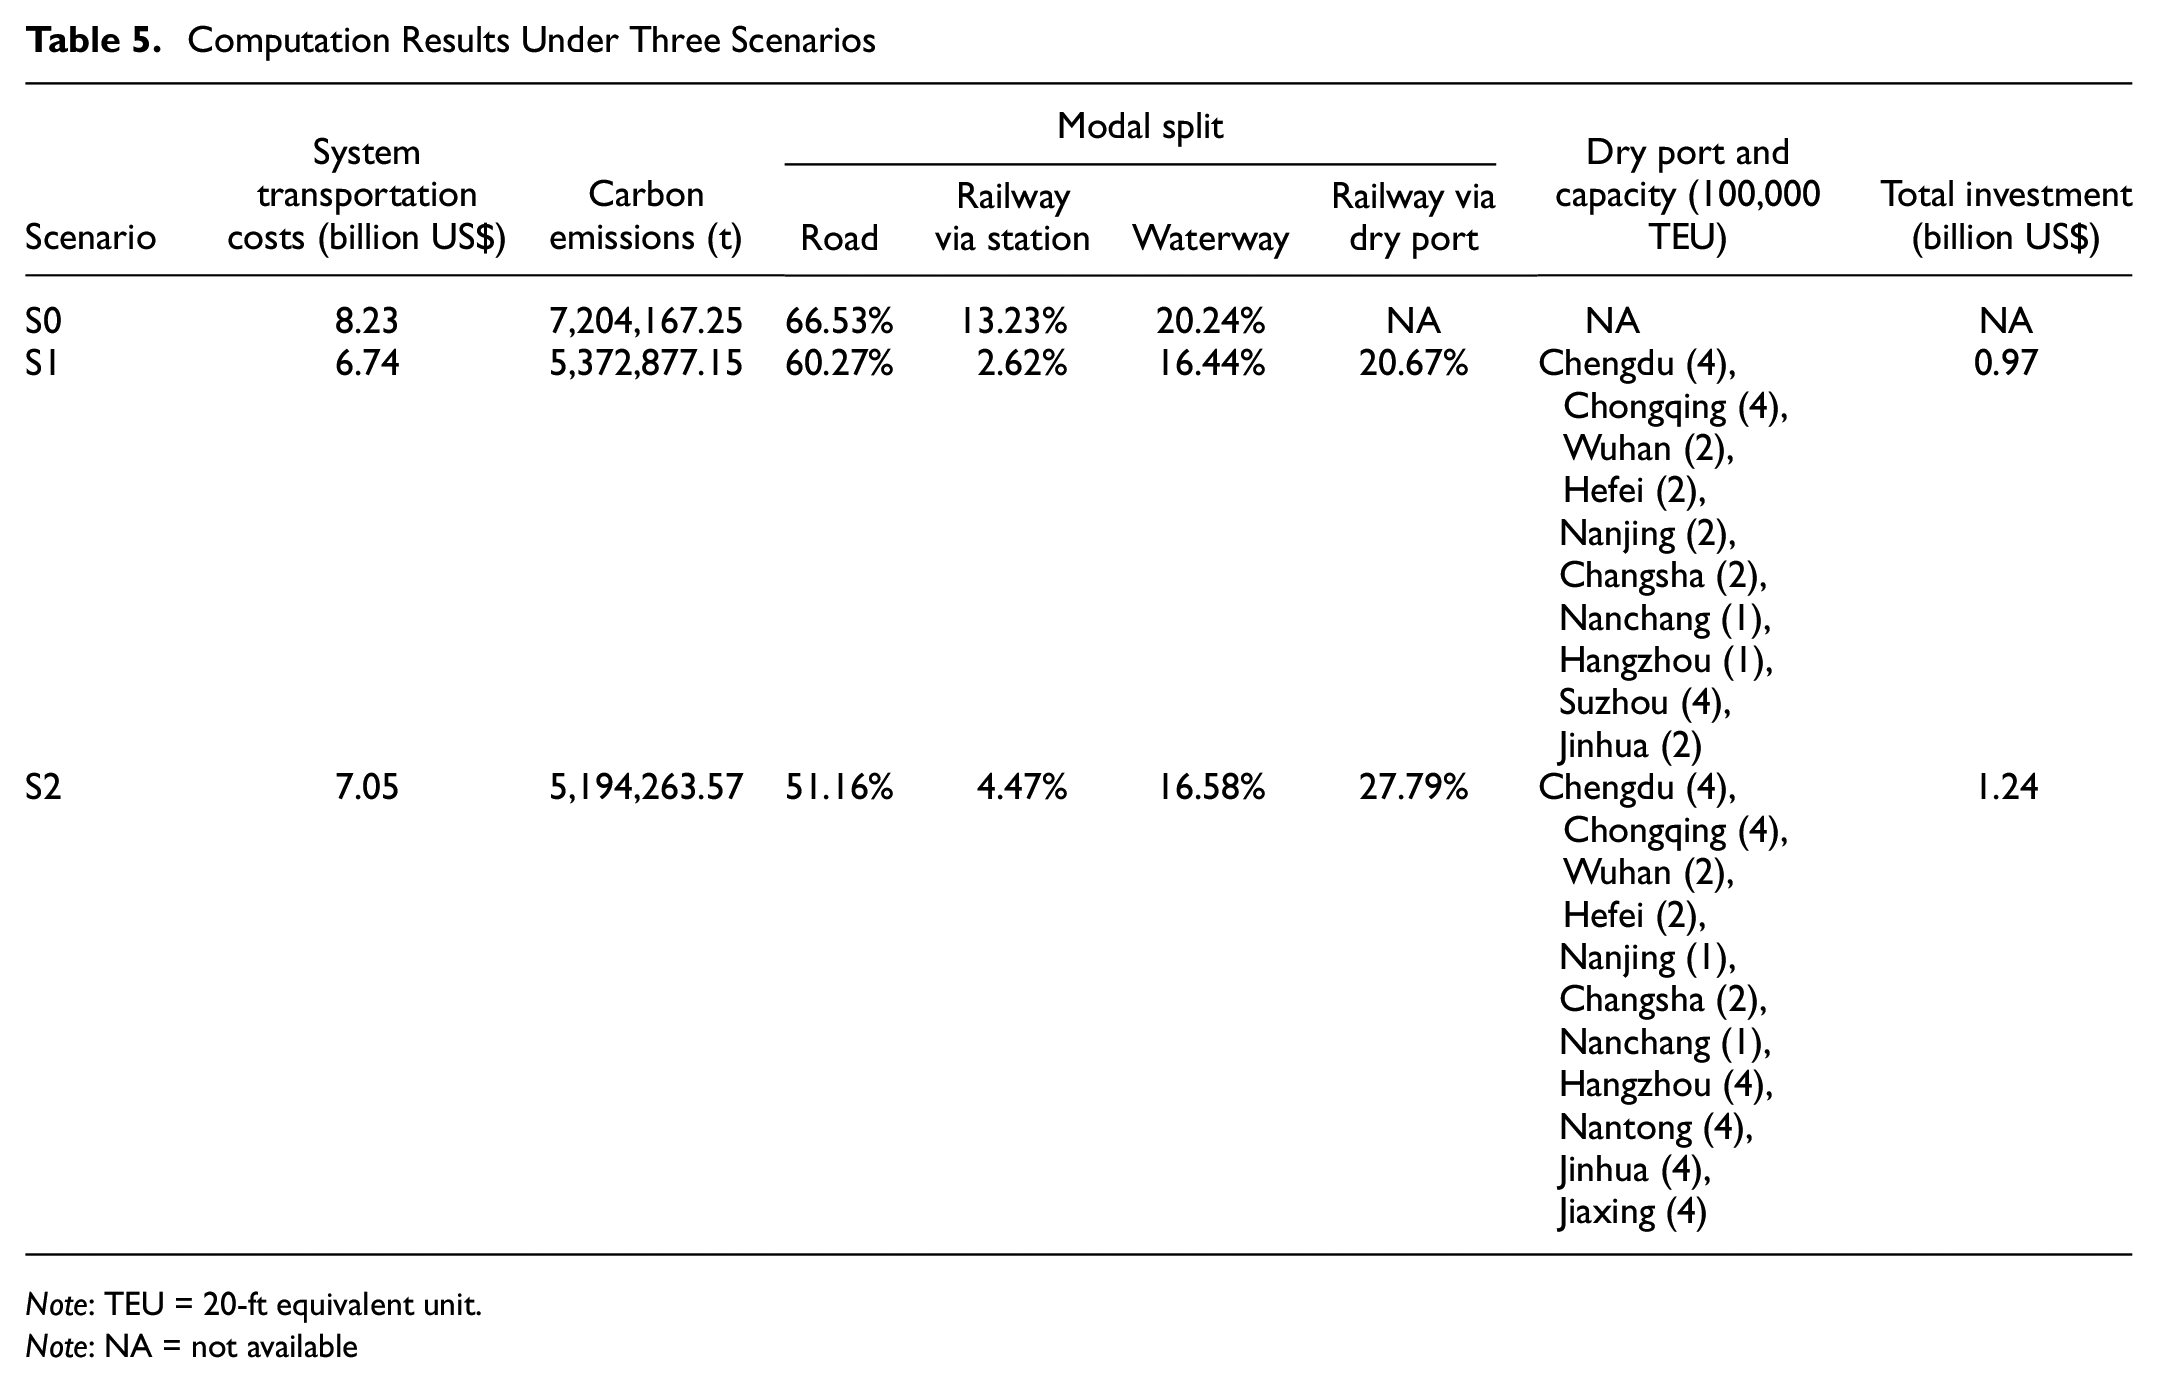
Note: TEU = 20-ft equivalent unit.
Note: NA = not available
Firstly, we analyze the influence of different objective functions (S1 and S2) on the dry port location. In the two scenarios, the market share of waterway transportation is approximately the same, while there are significant differences in the market shares of road and railway. This suggests that S2 will attract more shippers to choose railway transportation. Although the carbon emissions of S2 reduce by 3.32% compared to S1, system transportation costs increase by 4.51% and the total investment increases by 28%. This means that the government and shippers will need to pay an additional US$51.80 per container to achieve the lowest carbon emissions. In addition, the policies aimed at minimizing total costs and carbon emissions are not completely the opposite when it comes to dry port locations. Moreover, dry port location results in Zhejiang province under scenarios S1 and S2 show that building a larger number and higher capacity level of dry ports is likely to increase the sum of transportation costs and carbon emissions costs, which is contrary to expectations, and this finding has not been found in other similar studies ( 14 , 24 ). Two factors explain this phenomenon. On the one hand, dry ports will enrich the transportation modes available to local shippers, especially when the generalized transportation costs of railway via dry ports are similar to the lowest value of all modes. On the other hand, other parameters also influence the choice of railway via dry port. For example, dry ports can provide a one-stop transport service, and containers transported by dry ports have considerable advantages with respect to seaport storage time and operational priorities in seaports.
Then, we intend to find out whether dry ports will help reduce carbon emissions and transportation costs and facilitate a mode shift. Numerical calculations for scenario S1 prove that dry ports would decrease system transportation costs by 18.50% and carbon emissions by 25.42%, and increase the railway market share by 10.06%. The market share of railway transportation in the S1 scenario is 10.06% more than that in the S0 scenario, which demonstrates that railway via dry port is more attractive to shippers than railway via station. Besides, dry ports will compete with waterway terminals, and promote a mode shift from the waterway to the railway. However, because both are low-carbon modes, the above competition will result in the waste of transportation resources. Moreover, Figure 7 represents the share of transportation modes for every demand node. With respect to transportation costs, shippers far from seaports prefer intermodal transport to road transportation. Because of the advantage of railway via dry port for long-distance freight, the share of railway via dry port becomes larger with the increase of transportation distance, and the share in the cities close to seaports will not be significantly affected by the construction of dry ports; this conclusion is also confirmed by Zhang et al. ( 27 ).
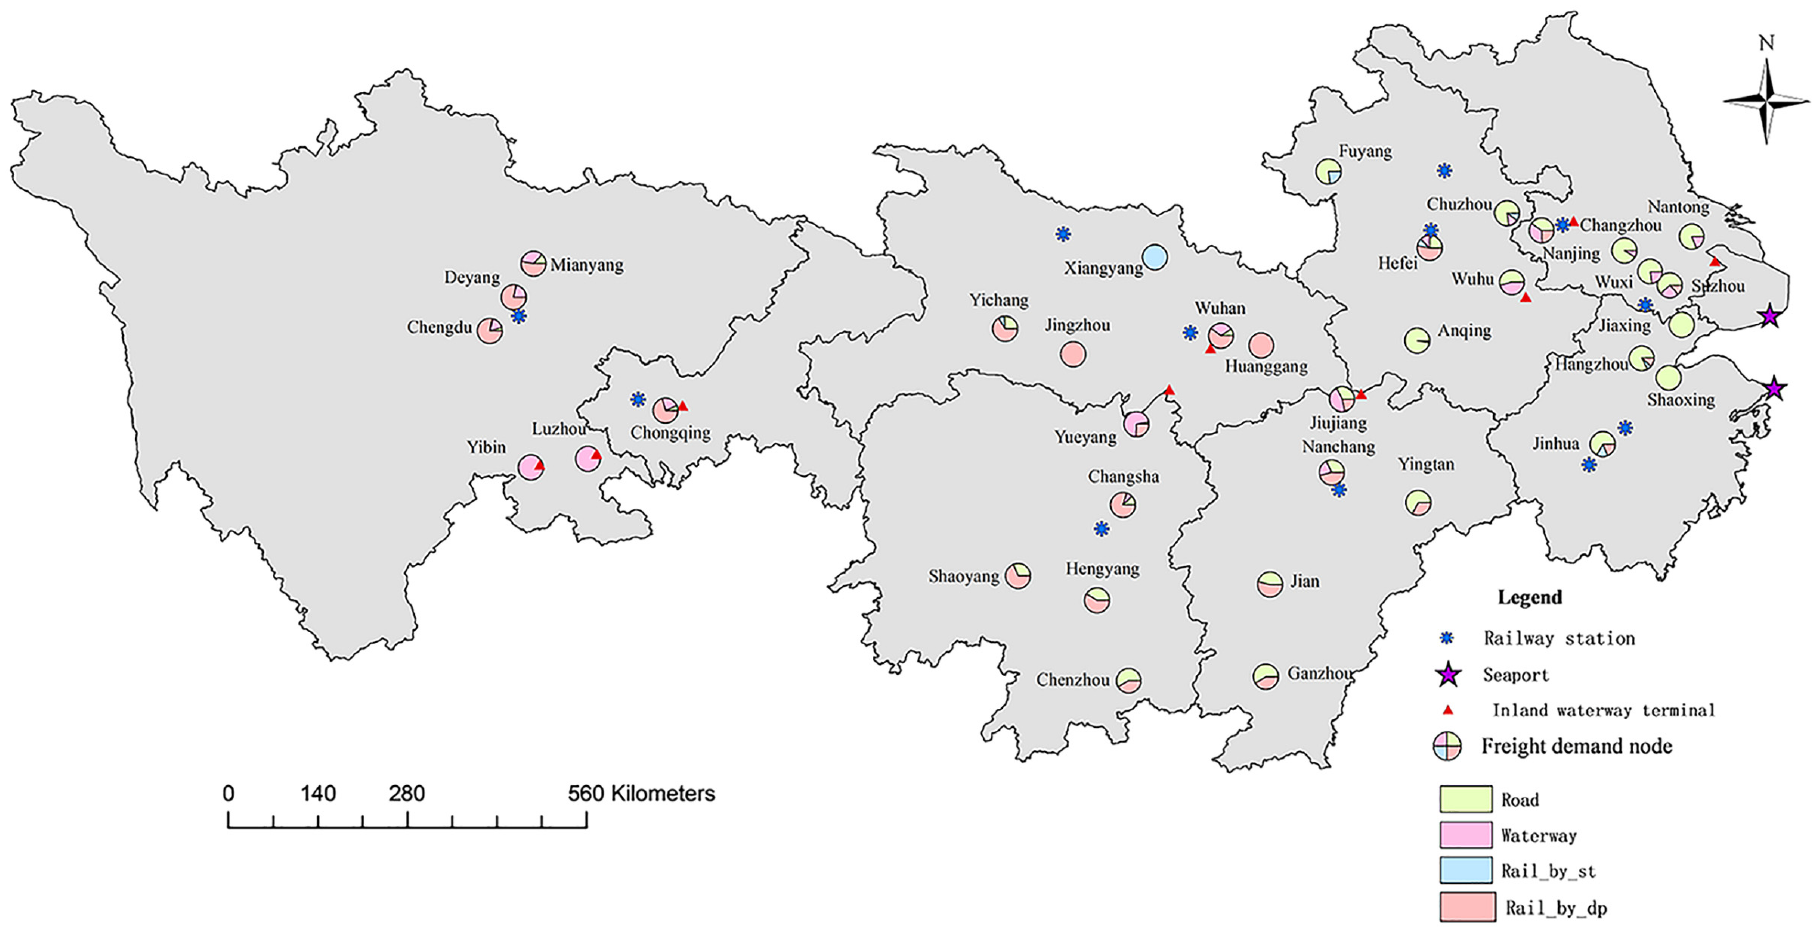
Modal split for each freight demand node.
Finally, we are interested in the location and utilization of dry ports. The dry port traffic volume and utilization for scenario S1 are calculated. Not surprisingly, as economic or political center cities in each province, Chengdu, Chongqing, Wuhan, Hefei, Changsha, Nanchang, Nanjing, Hangzhou, Suzhou, and Jinhua become the preferred locations for dry ports. Besides, the utilization rate of eight dry ports is 100%, which means container volume via these dry ports reaches processing capacity constraints. At this time, if we increase the capacity level of dry ports in Hefei, Changsha, and Nanchang, the container volume transiting via these dry ports cannot meet the minimum quantity requirement. Therefore, quantity constraints that maintain dry ports that are economically viable restrict the establishment of large dry ports. Moreover, only 357,128 TEUs are transited through the dry port in Chongqing and 137,182 TEUs are transported by Wuhan, which account for 89.28% and 68.59% of the available capacity, respectively. This denotes the significance of identifying optimum capacity levels when deciding on the locations of dry ports.
Algorithmic Comparison
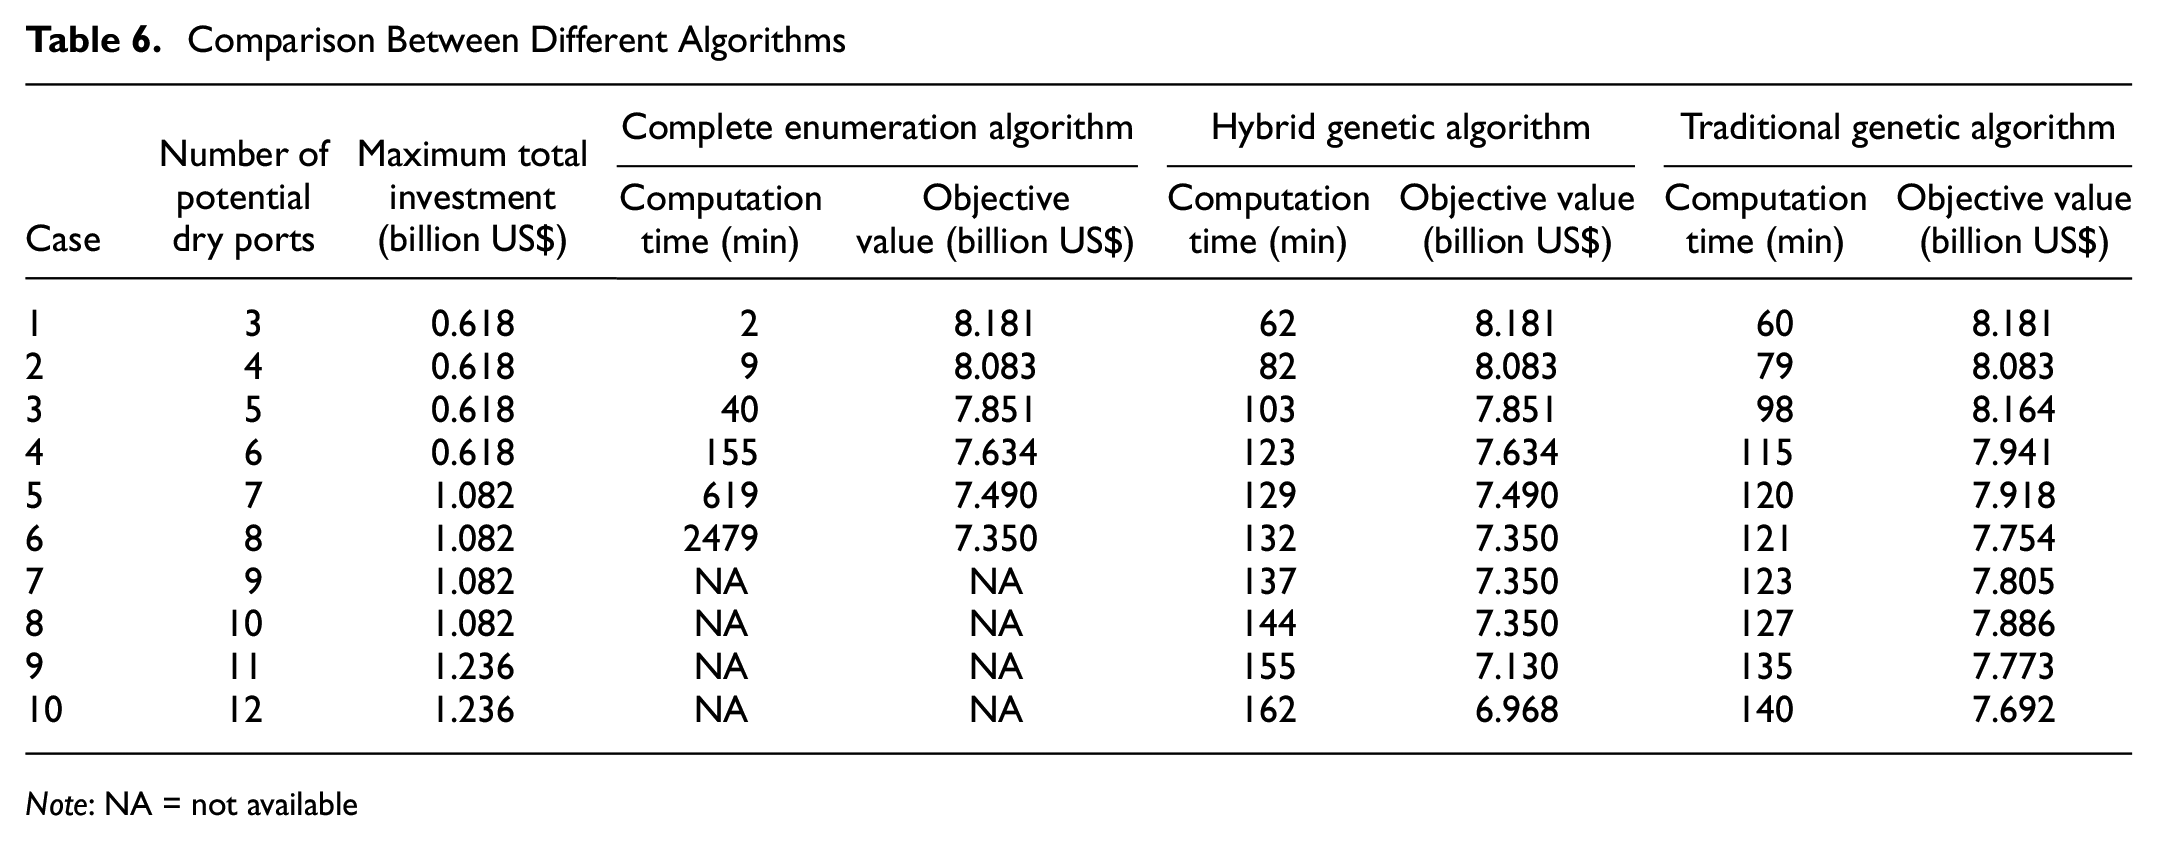
Figure 8 shows the variation of the optimal value obtained by the hybrid genetic algorithm with the number of iterations for scenario S1. It can be seen that the algorithm reaches the minimum value at the 694th iteration and remains constant thereafter, indicating that the algorithm converges to the optimal value from the 694th iteration. To examine the validity of the algorithm, the computation time and results of the traditional genetic algorithm, the hybrid genetic algorithm, and the complete enumeration method are compared by changing the problem size, as displayed in Table 6. We generate different cases by varying the number of potential dry ports and the maximum total investment. Since the number of potential dry ports for the port-hinterland transportation network proposed in this paper is 13, the maximum number of dry ports in the algorithm comparison section is 12. At the same time, considering the computation time of the algorithms, the algorithmic comparison section contains small-scale and large-scale cases.
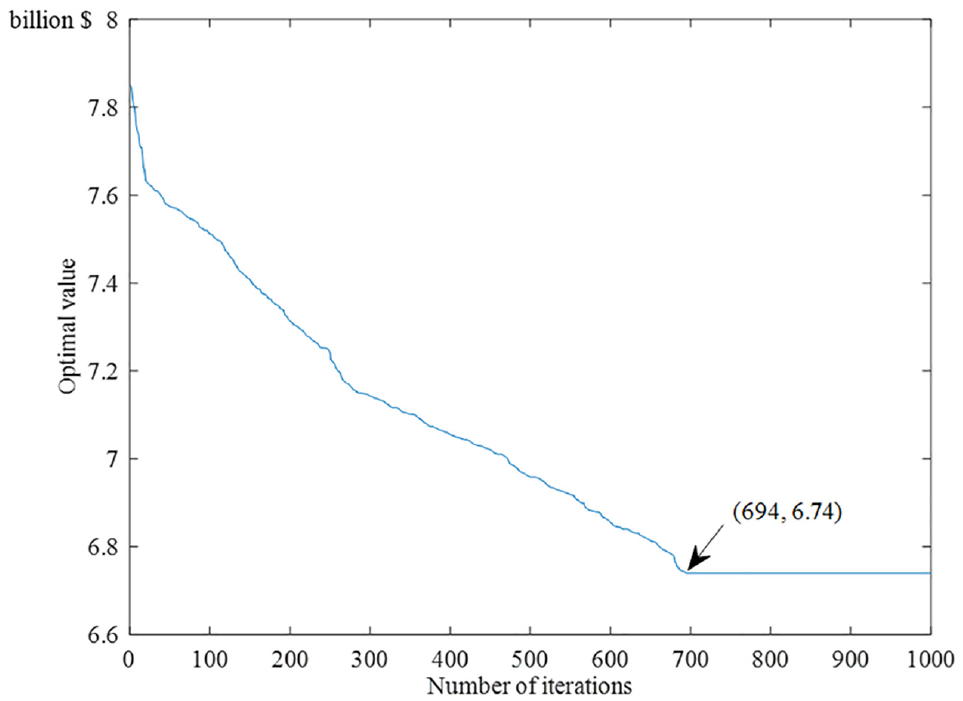
Variation of the optimal value with the number of iterations.
Comparison Between Different Algorithms
Note: NA = not available
The optimal solution can be obtained by the traditional genetic algorithm and the hybrid genetic algorithm in cases 1 and 2. When the number of dry ports changes from five to eight, the hybrid genetic algorithm ensures exact solutions, while the traditional genetic algorithm does not. Meanwhile, as the problem size increases, the difference between the objective values of the two genetic algorithms becomes larger, with an average difference of 5.20%. Besides, the lower-level model becomes larger and larger as the case size increases, so the computation time of the two genetic algorithms gradually increases, but both can obtain results within 180 min. Since the dry port multilevel location is a strategic planning problem, the computation time of both algorithms is within the acceptable range. Consequently, the hybrid genetic algorithm can find high-quality solutions in a relatively short time.
Variation in Cost and Time Parameters
We carry out correlation analyses to reveal the influence of cost and time parameters on location results, carbon emissions, seaport market share, the modal split of the hinterland, and total costs.
Cost Parameters
The dry port location, cost, and container flow relative variations compared to the cost parameters unchanged scenario are listed in Table 7, with a 10% increase or decrease in the initial cost parameter values. Dry port location results change with the variations in drayage fees at transit nodes and freight rates. The road freight rate is the parameter that has the greatest impact on total costs and carbon emissions. This occurs since road transportation has the largest share in the initial scenario, and the freight rate and carbon emissions rate of the road are both much higher than that of the railway and waterway. The modal share of railway via station is rather small in the initial scenario and building a dry port will cover the corresponding railway station. As a result, the modal share of railway via station fluctuates intensely in all scenarios, far exceeding the degree of change in other modes. Besides, a combination of policies to decrease the railway freight rate and build dry ports is most effective in reducing road share. In reality, waterway transportation costs are already low, but railway transportation costs can sometimes even be equal to that of road. For this reason, railway authorities in China now attract shippers to choose the railway by decreasing freight rates or providing subsidies. This study also verifies the effectiveness of the methods. In addition, these results underline the risk of mode shift within intermodal transport, not between intermodal and road transportation, and this finding is the same as that of Mostert et al. ( 22 ). Moreover, the drayage fee is an important component of overall transportation costs in low-carbon modes, especially when freight demand nodes are located far from railway stations or waterway terminals.
Calculation Results of Cost and Time Parameters
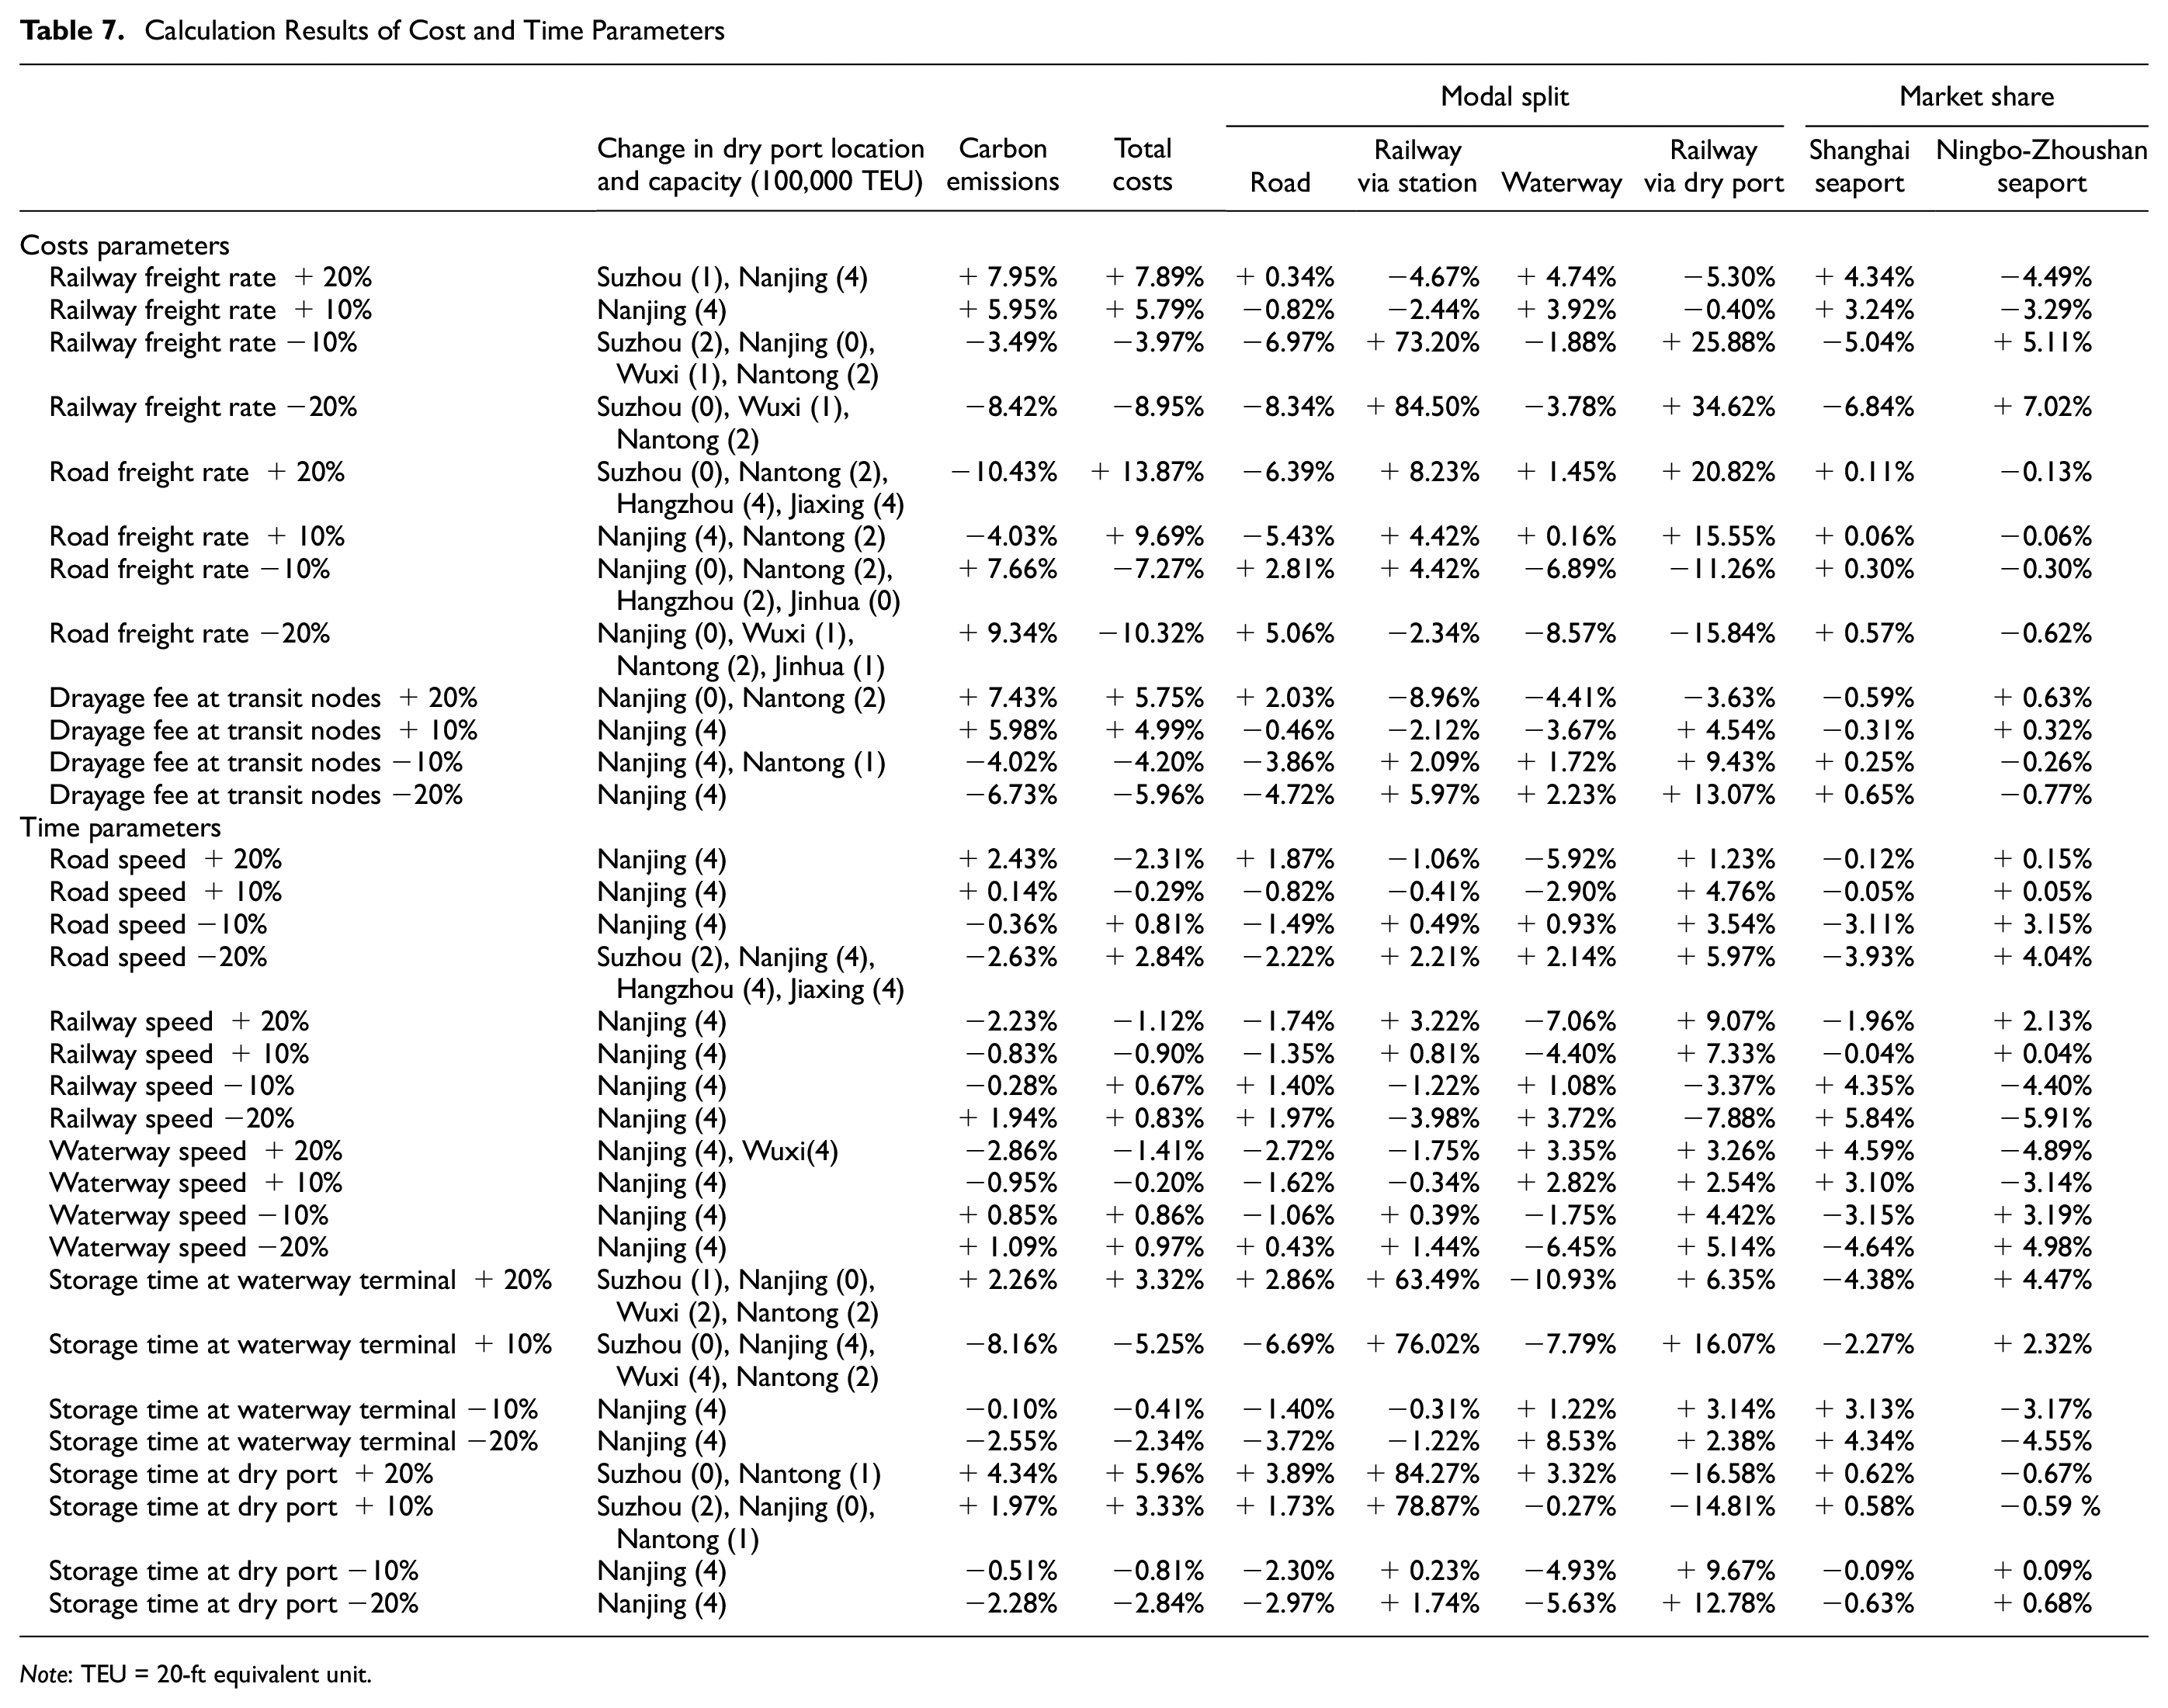
Note: TEU = 20-ft equivalent unit.
Time Parameters
Table 7 reports the analysis results when time parameters are increased or decreased, which refer to speed and storage time. Total costs and carbon emissions vary depending on different scenarios, but in most cases the changes are small. The maximum variation is noticed in the scenario with a 10% increase in storage time at the waterway terminal. At this point, the share of road and waterway transportation declines while the share of railway rises. Besides, according to the composition of waterway transportation time, the storage time at waterway terminals has the greatest effect on the share of the waterway. Similarly, comparing the three scenarios of road speed increase, railway speed increase, and storage time at dry port reduction, we note that the increment in the railway via dry port share is most sensitive to storage time. Furthermore, results also show that storage time has a much higher influence on dry port location results than speed. With respect to seaport market share, Shanghai seaport will increase its share when the competitiveness of the railway increases; in contrast, if the competitiveness of the waterway improves, the share of Ningbo-Zhoushan seaport will increase. In reality, Shanghai seaport and Ningbo-Zhoushan seaport have advantages in the waterway and railway, respectively. In other words, the growth of the market share of one seaport comes from the decline of competitiveness of the superior transportation mode of the other seaport.
Conclusion
With increased pressure to reduce pollution and design sustainable port-hinterland freight networks, some countries have stepped up infrastructure investment, such as building dry ports. The DPLP is studied concerning multilevel capacity, empty container transportation, and shippers’ choice behavior in the hinterland freight network, which comprises four transportation modes. A leader–follower game model is given to express the relationship between the government and shippers, and shippers’ choice behavior is consistent with the constrained nested logit model. Furthermore, the model and algorithm are adopted for an in-depth analysis of a case in China, and the main findings are summarized below.
Building dry ports is beneficial to reducing carbon emissions and transportation costs and promoting a mode shift from road to railway. Furthermore, the overcapacity of dry ports in Chongqing and Wuhan highlights the need for choosing an appropriate capacity level early in the dry port construction process.
Dry port location results under different objective functions of the government reveal that the economically oriented and environmentally oriented policies are not exactly the opposite with respect to dry port construction options. In addition, the expansion of the number and capacity of dry ports sometimes increases transportation costs and carbon emissions costs, contrary to expectations.
The variation in cost parameters analyses illustrates that the road freight rate is the most significant parameter affecting total costs and carbon emissions. The optimal way to decrease the road share is to apply a combination policy of reducing the railway freight rate and establishing dry ports. Moreover, the drayage fee at transit nodes is an important cost element in environmentally friendly modes, especially when shippers are close to seaports. The results also indicate the risk of mode shift within intermodal transport, rather than between road transportation and intermodal transport.
The variation in time parameters analyses shows that cutting storage time at transit nodes can effectively raise the market share of the railway and waterway. Compared to other factors, speed has the greatest impact on the market share of seaports. The growth of market share in one seaport derives from the competitiveness decrease of the dominant mode in another seaport.
The comparison results between different algorithms demonstrate that the hybrid genetic algorithm proposed in the paper can obtain exact solutions when the problem size is small, and it performs better than the traditional genetic algorithm for large-size instances.
This research has some limitations that should be surveyed in future studies. Firstly, shippers with a high time value prefer fast transportation modes. Thus, it is necessary to consider the heterogeneity of shippers. Secondly, it is worthwhile to explore the problem considering the dynamic changes in hinterland freight demand. Finally, the dry port location and pricing combination problem involving the three actors of the government, carriers, and shippers may be more realistic, considering link transportation capacity and node processing capacity.
Footnotes
Author Contributions
The authors confirm contribution to the paper as follows: study conception and design: Y. Wu, R. Zhang; data collection: Y. Wu; analysis and interpretation of results: Y. Wu, R. Zhang; draft manuscript preparation: Y. Wu, R. Zhang. All authors reviewed the results and approved the final version of the manuscript.
Declaration of Conflicting Interests
The author(s) declared no potential conflicts of interest with respect to the research, authorship, and/or publication of this article.
Funding
The author(s) received no financial support for the research, authorship, and/or publication of this article.