
Abstract
Pavement management data used in measuring the performance of a pavement network contribute to managing maintenance and rehabilitation needs and determining the required funding levels. A network’s performance can be measured in several ways. The method adopted by the Virginia Department of Transportation has been in use for more than 15 years. With the introduction of Transportation Performance Management by the Federal Highway Administration (FHWA), a set of performance measures required by FHWA are to be reported. A few methods from earlier efforts by others in predicting one or more pavement performance parameters are briefly discussed. The main challenges in the determination of federal performance measures are the lack of prediction models for those measures; the reporting on 1/10th-mi sections that are not directly used in analysis and maintenance planning; and the determination of funding levels based on 1/10th-mi sections. In this paper, a new method to predict the federal performance measures of pavement networks from the state performance measures is provided, along with the mathematical models developed.
Keywords
Pavement condition data in a pavement management system (PMS) are used for various purposes with an overarching aim of maintaining the pavement network. Composite condition indices are used to indicate the overall condition of a pavement section on a given scale. Individual distresses and combinations of distresses define the structural and functional performance levels of pavements. Composite condition indices and distress combinations are used in decision matrices to determine the recommended treatment selection for a pavement. Creation of reports may need summaries of individual distresses or combinations that can be used for tracking performance, determining maintenance needs, allocating budgets, etc. Individual agencies adopt different methods of condition data collection, summarization, storage in databases, and analyses.
With the introduction of Transportation Performance Management by FHWA, state agencies are expected to report the overall performance of the pavement network over a performance period of 4 years ( 1 ). A mid-performance-period target is also required at the end of the second year. According to 23 CFR 490 Subpart C, 23 CFR 490.105(e)(4)(iii), and 23 CFR 490.105(e)(4)(iv), each state department of transportation (DOT) shall establish 2-year and 4-year targets that reflect the anticipated condition/performance level at the end of each performance period ( 2 ).
To achieve advances in pavement management, improved predictions and measurement of performance levels are crucial. To evaluate pavement performance, the Virginia Department of Transportation (VDOT) in its PMS uses a composite condition index referred to as the Critical Condition Index (CCI), determined from condition surveys of distress types, severity, and extent ( 3 ). The CCI determination process was developed based on the PAVER ( 4 ) method and is measured on a scale of 0–100, where 100 represents a pavement with no distress, and 0 represents a pavement with significant distresses. Pavement sections with a CCI of 60 or above are considered to be in sufficient condition, and VDOT’s state performance measure reports the percentage of the network in sufficient condition annually. The CCI is used in planning maintenance and rehabilitation (M&R) activities on a project, and in the optimization analysis for efficient allocation of transportation funds.
The federal performance measure uses five metrics to categorize pavement under “good,”“fair,” and “poor” conditions: International Roughness Index (IRI), present serviceability rating, cracking percent, rutting, and faulting ( 2 ).
In the optimization analysis, VDOT’s state performance measures are used for determining future M&R activities and required budget levels. From this analysis, the resulting federal performance levels are extracted and reported. The purpose of this study was to determine the federal performance measures from the state performance measures for future years. Statistical models were developed that help not only in forecasting the condition of the network but also in setting the targets for future years.
Literature Review
Correlation Between IRI and Distresses
Several studies have described the relationship between pavement surface distresses and composite indices with roughness index. Aultman-Hall et al. explored the relationship between the IRI, rutting, and pavement cracking using a large database of 65,530 observations ( 5 ). The purpose of their study was to determine whether relationships were consistent enough to allow the IRI to be used as a surrogate for other metrics, or if the effort and resources to collect all three measures were necessary in pavement management programs. Overall, the findings showed statistically significant relationships among the IRI, rutting, and cracking, but the predictive power of the models developed was weak.
Mubaraki ( 6 ) indicated a significant relationship between the IRI, and cracking and raveling; however, rutting did not show a similar correlation with IRI values. A study by Cafiso et al. ( 7 ) indicated that a specific subset of distresses affects roughness at definite wavelength frequencies. Alligator cracking and rutting standard deviation provided the best correlation with the IRI at lower profile frequencies. At a high frequency domain, that is, wavelengths below 0.8 m, a better correlation between the IRI and high severity cracking was observed.
Patrick and Soliman stated that the correlation between the IRI and distress is inherent, as roughness is a function of both the changes in elevation of the distress-free pavement surface and the changes in elevation because of existing surface distress. A relationship between existing surface distress and the IRI was developed ( 8 ). The study used the Long-Term Pavement Performance (LTPP) program database and reported the models to be statistically significant. Baladi et al. introduced a dual pavement condition rating system: one for the functional rating based on the IRI and rut depth, and the other for structural rating based on cracking and faulting. The shortest time period to reach functional and structural thresholds was estimated to evaluate the recommended treatment type for that section ( 9 ).
Al-Mansour and Shokri investigated the correlation between the IRI and a composite index. They developed statistical models relating the IRI to individual distress types ( 10 ). They concluded that the IRI had a significant correlation with cracking, patching, and raveling, and therefore these distresses were classified as ride-quality type distresses. Potholes and rutting did not have a significant relationship with the IRI and were described as non-ride-quality type distresses. The benefit of these models is that the IRI can be used to evaluate pavement quality, being quicker and more cost-effective than visual inspection of distresses.
These studies showed that researchers have attempted to develop prediction models and have explored whether one form of pavement quality measurement can be used to predict other metrics to reduce cost and effort. Even where correlated or prediction models were developed, not all distress types and severities are used for prediction. The CCI used by VDOT encompasses all surface distress types, severities, and quantities that are measured. It is also influenced by rutting levels. However, the IRI is not included in its computation. Therefore, the CCI and IRI were investigated for use as independent variables in the prediction models.
Correlation Between State and Federal Measures Used by Other Agencies
The New York State DOT uses the state’s Surface Score Rating System on pavement management sections, and the scores are correlated to the federal performance categories of good and poor ( 11 ). The percentage differences between the state measure and the federal measure are considered to be constant and are used in the prediction of the federal measures.
The Michigan DOT reviewed historical trends of condition-metric data for one decade (2007–2017) to support future target establishment ( 12 ). The Oklahoma DOT has an established PMS with a key function of forecasting pavement performance using the Pavement Quality Index, anticipated funding levels, and detailed analytical models based on years of historical pavement condition and performance data. Targets were established by looking at historical trends and data collected by the Oklahoma DOT in 2016 and submitted to FHWA to forecast for a 10-year timeframe ( 13 ); good conditions are expected to stay stable for the interstate, and poor conditions are expected to worsen.
The Ohio DOT indicated that the 2-year and 4-year targets required by FHWA were derived from the DOT’s subject matter experts and engineering judgment. The targets were not explicitly analyzed as a part of the PMS optimization analysis. As stated in the Performance Audit of the Ohio DOT Pavements Program Evaluation Report ( 14 ), “The pavement section of the Ohio Transportation Asset Management Plan focuses mainly on the procedures used by the Ohio DOT to manage the pavement network using the state’s own distresses and metrics. This is in contrast to focusing on the federal metrics directly. The Ohio DOT approach is considered a good practice since managing specifically to just the federal metrics, and only on the National Highway System, can result in strategies that are less than optimal for the network as a whole. Managing only to federal metrics can sometimes result in following so-called ‘worst first’ strategies if the agency puts too much emphasis on the federal poor metrics.”
Several states have made efforts to predict the federal performance measures from their state measures. These include the historical trends and correlations between state and federal metrics.
Federal Pavement Performance Measures
The pavement condition rating thresholds for the five federal metrics are shown in Table 1 ( 1 ). For asphalt concrete pavements (ACP), the IRI, cracking percent, and rutting are considered in the evaluation of pavement performance, whereas for jointed reinforced concrete pavement (JRCP), the IRI, cracking percent, and faulting are considered. For continuously reinforced concrete pavement (CRCP) only two metrics, IRI and cracking percent, are considered. For ACP and JRCP, the condition of the pavement is classified as good if all three metrics are good. The condition of the pavement is classified as poor if two or more of the metrics are poor. With all other combinations, the condition of the pavement would be classified as fair. For CRCP, the condition of the pavement is classified as good if both metrics are good. The condition of the pavement is classified as poor if both metrics are poor. With all other combinations, the condition of the CRCP would be classified as fair.
Federal Pavement Performance Condition Thresholds
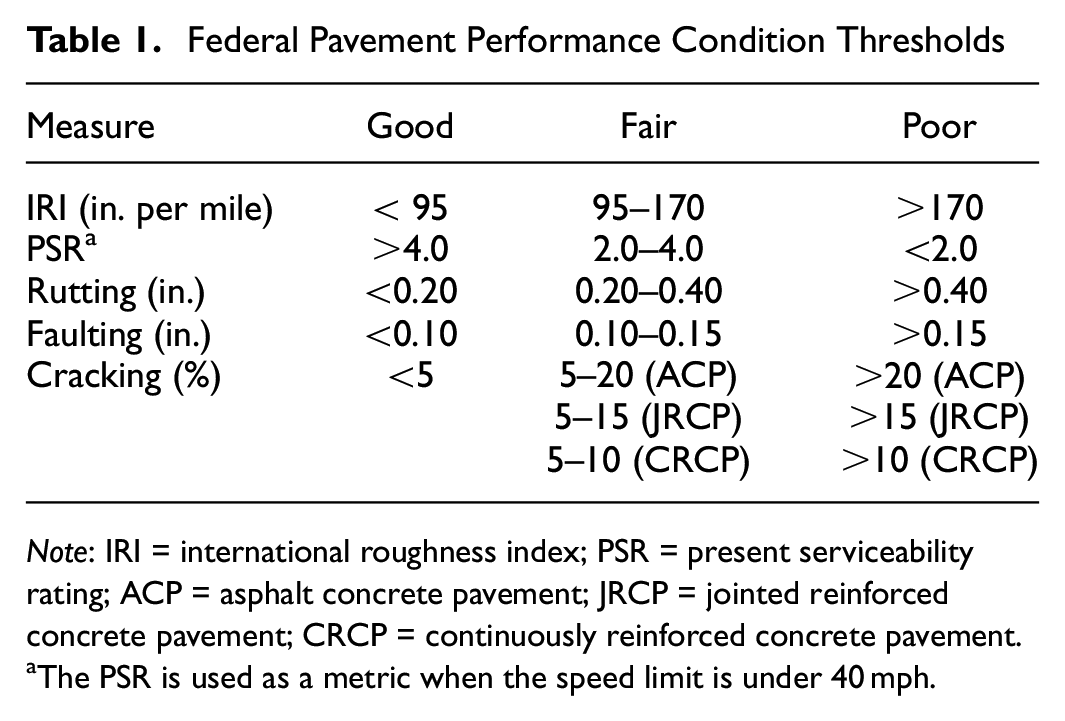
Note: IRI = international roughness index; PSR = present serviceability rating; ACP = asphalt concrete pavement; JRCP = jointed reinforced concrete pavement; CRCP = continuously reinforced concrete pavement.
The PSR is used as a metric when the speed limit is under 40 mph.
Study Methodology
Background
VDOT’s strategy is to reach and maintain the network targets based on the state’s performance measures. The network is classified as interstates; primary roads with annual average daily traffic (AADT)≥ 3500; primary roads with AADT< 3500; secondary roads with AADT≥ 3500; and secondary roads with AADT< 3500. Each of these categories has its own performance target with state measures to be reached in about 3 years and then to remain steady at the target levels over a long period of time. Using the PMS, optimization analyses are performed to determine the funding levels needed to reach and maintain the targets based on life cycle and required treatment. The PMS provides recommendation for treatment type and time of treatment for the management sections. This systematic approach of maintaining, preserving, and reaching the targeted performance levels for the overall network provides an optimal solution as determined from the analysis. State measures are used as input for the analysis, and the resulting federal performance levels are reported.
Optimization analysis predicts the CCI values of the management section at the end of each year for the entire analysis period. Though the CCI and the corresponding recommended treatment type are determined for the management section, FHWA performance measures are to be determined for 1/10th-mi sections.
A management section or homogeneous section, typically 0.5–3 mi long, may or may not have uniform deterioration throughout its length. Some locations could be in relatively good condition, whereas other portions could have higher levels of deterioration. For example, a 2-mi-long management section will have twenty 1/10th-mi sections within its limits. For a CCI of 75 for the management section, there could be 12 good sections, six fair sections, and two poor sections based on federal performance measures, as illustrated in Figure 1. Therefore, this management section would have a 60% good rating, a 30% fair rating, and a 10% poor rating. The purpose of the current methodology is to develop mathematical models to employ the CCI to predict the percent good and percent poor for the section.
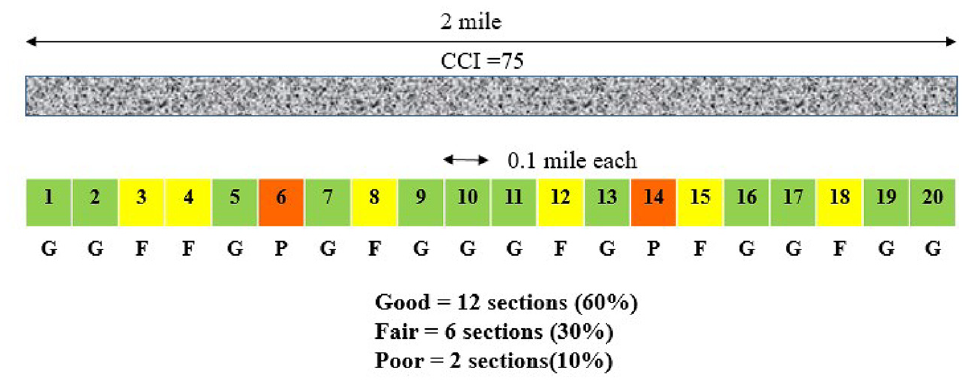
Representation of a management section and its corresponding 1/10th-mi sections with federal performance ratings.
VDOT has established a method of pavement condition assessment with definitions of distress types and severities, and this has been in use for more than 15 years. Using the established assessment method, VDOT collects 10 or more distress types for each pavement type, which is more than the four distress types needed according to 23 CFR 490.105 for Highway Performance Monitoring System (HPMS) submission. Desired performance levels based on state performance measures are set for the next 6 years in the medium term and for 20 years in the long term. The goal is to predict the federal performance levels from the state performance levels based on medium- and long-term analyses. Specifically, the prediction models are needed to predict the 2-year and 4-year targets and the expected levels of federal performance measures.
The challenges in predicting the federal performance measures are the development and utilization of models to predict them, that is, prediction models for cracking, the IRI, rutting, and faulting. The models are not yet developed, and these measures are not used in the determination of treatment types from the decision trees in the PMS. To do so would constitute a fundamental change in the current process VDOT has used for more than 15 years. Performance levels based on state measures have been tracked, and future specific state measure targets have been established for each year on a long-term basis up to 20 years. In Figure 2, the percent sufficient and target for the interstate network based on state performance measures are shown ( 15 ).
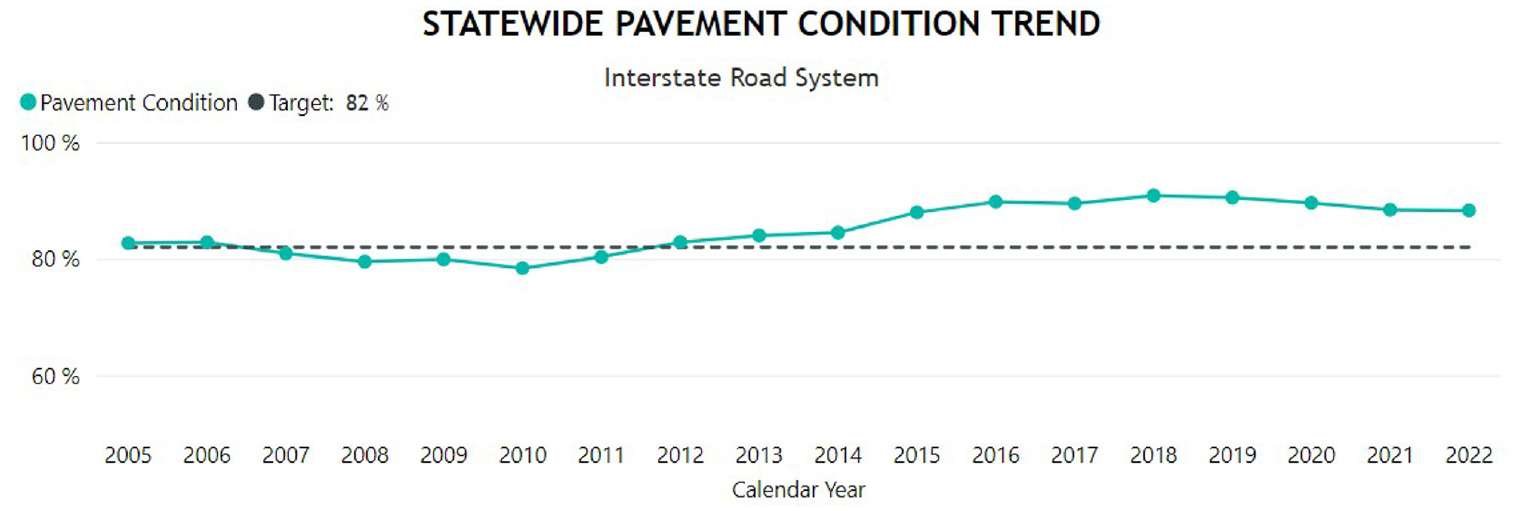
Performance of interstates based on state performance measures.
Pavement management and treatment planning will continue based on the state measures, and the resulting federal measures will be reported. The overall process is provided in Figure 3.
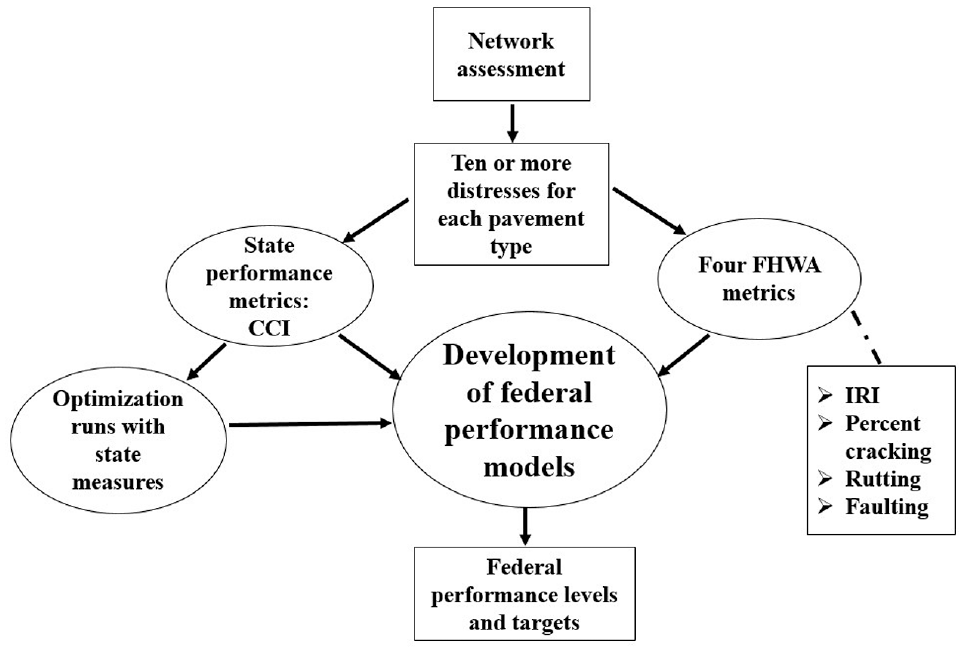
Schematic representation of the study methodology.
Initial Model Development
The PMS used for condition forecasting and the establishment of long-term targets does not provide an output to report directly the anticipated 1/10th-mi federal performance. Therefore, there is a need to develop a correlation between the pavement condition summary index and federal measures. Initial efforts were made in 2017 using the pavement condition data collected between 2013 and 2016. Regression modeling was used to capture the relationship between CCI and federal performance, which is presented in Table 2 for interstates.
Regression Model Developed for Interstates
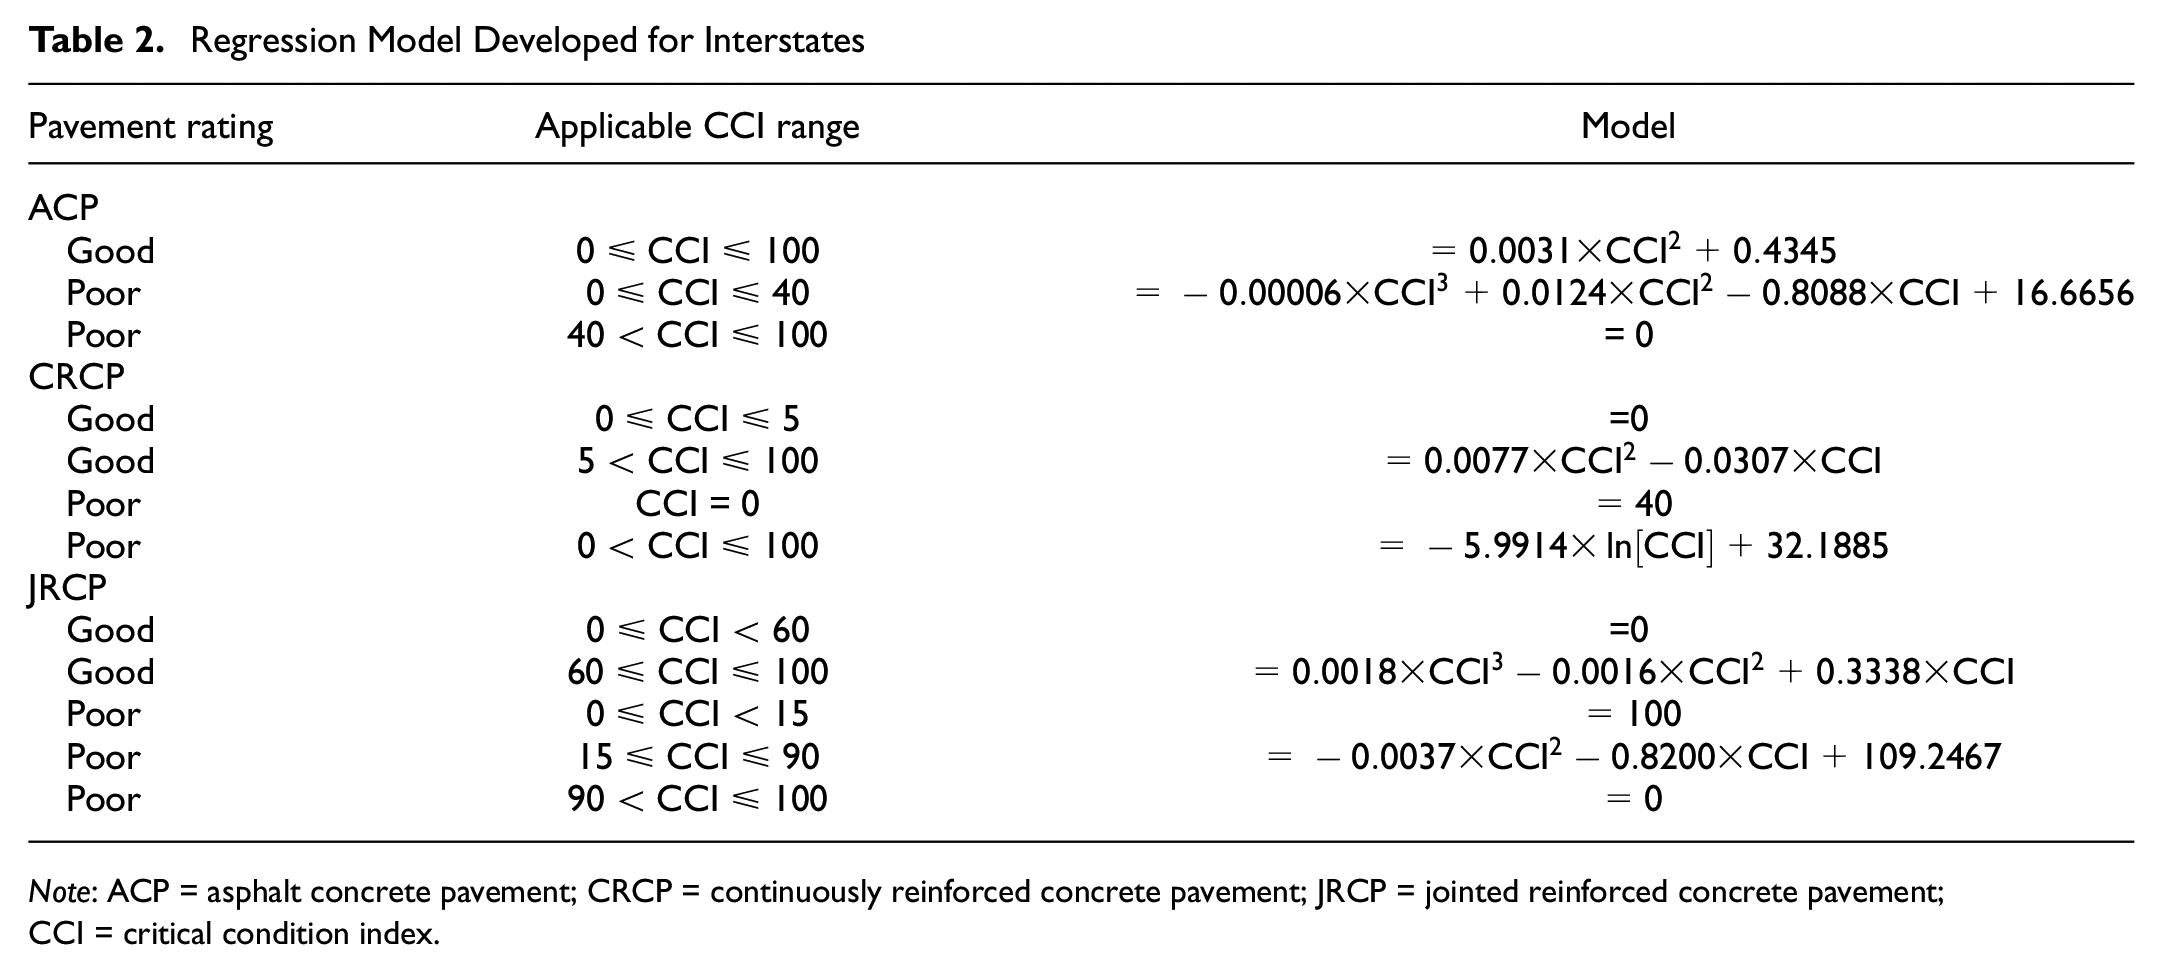
Note: ACP = asphalt concrete pavement; CRCP = continuously reinforced concrete pavement; JRCP = jointed reinforced concrete pavement; CCI = critical condition index.
The predicted percent good and percent poor for various CCI values for interstate ACP sections are presented in Figure 4.
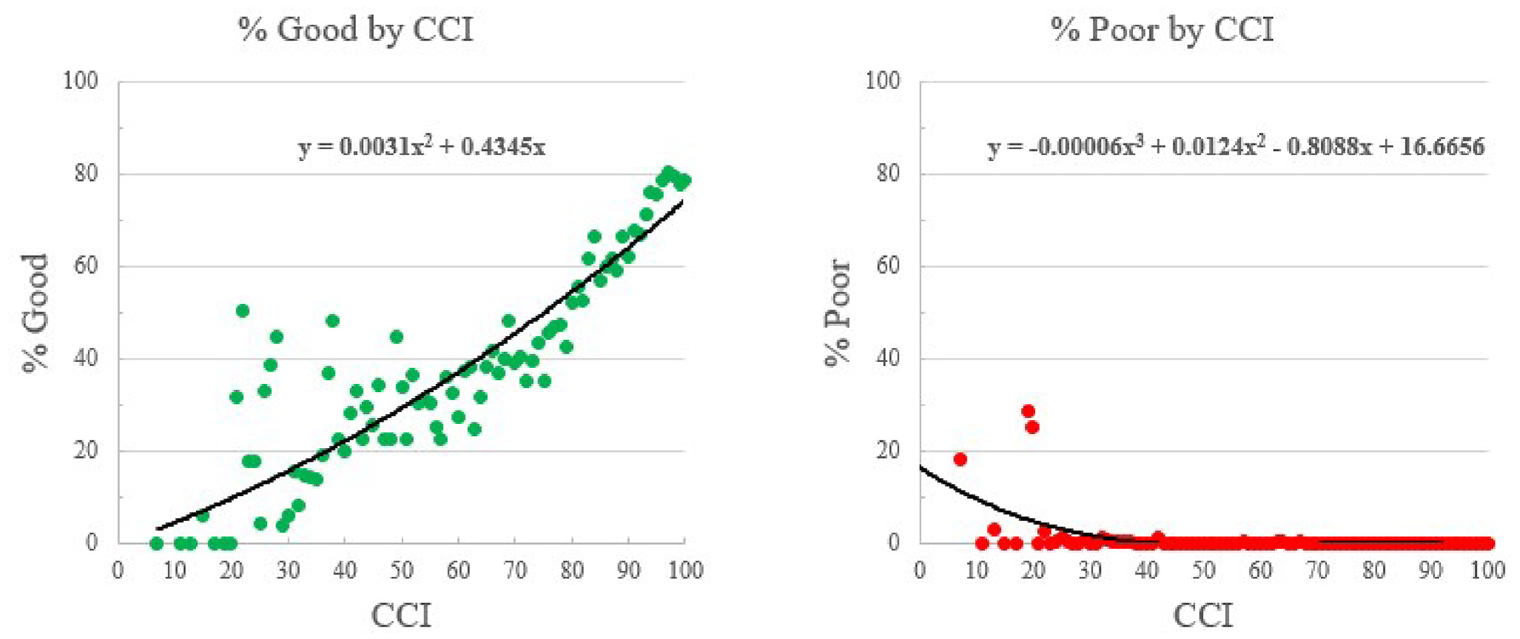
Federal Highway Administration (FHWA) percent good and percent poor with varying critical condition index values for interstate asphalt concrete pavements.
Federal performance is clearly related to the CCI; however, an effort to improve the prediction was made by including the IRI as a second variable in the model. Before that, it would be helpful to determine whether a relationship exists between the CCI and IRI. Based on several studies indicated previously, the CCI and IRI may or may not be correlated. Even where correlated or prediction models are developed, not all the distress types and severities are used for prediction. The CCI encompasses all the distress types, severities, and quantities that are measured. It is also influenced by rutting levels. Therefore, statistical tests were conducted to check the interdependency of the CCI and IRI using the data from the database. The check was conducted using Pearson’s correlation, and the results showed no interdependency between the CCI and IRI, with a degree of freedom of 14009 and p-value of 2.2 × 10⁻⁶.
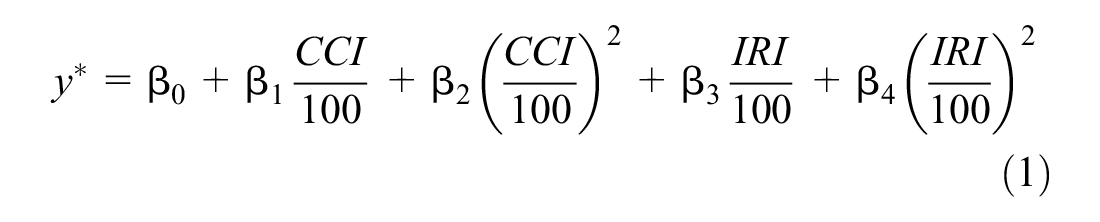
Federal performance was fitted to the CCI, the IRI, their squared values, pavement type, and highway system. A score based on the CCI and IRI was determined by the following equation. The score is a latent variable along the probability density function of the logistic distribution and does not have any immediate interpretation. The parameters for each type and system of pavement fitted to the pavement data are shown in Table 3.
Fitted Parameters Based on Pavement Type
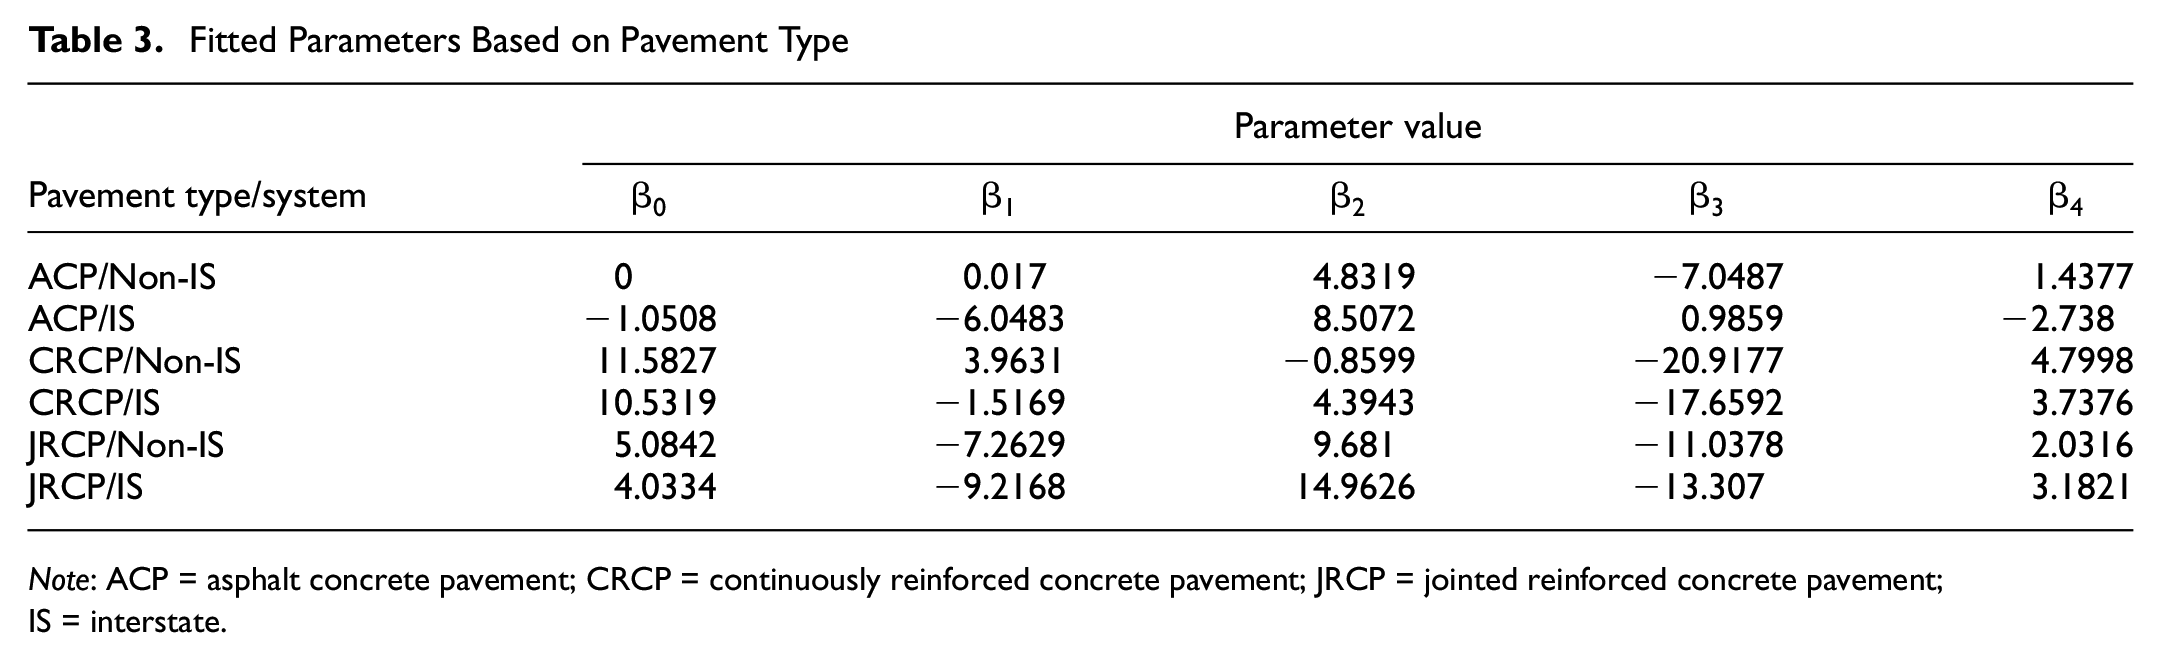
Note: ACP = asphalt concrete pavement; CRCP = continuously reinforced concrete pavement; JRCP = jointed reinforced concrete pavement; IS = interstate.
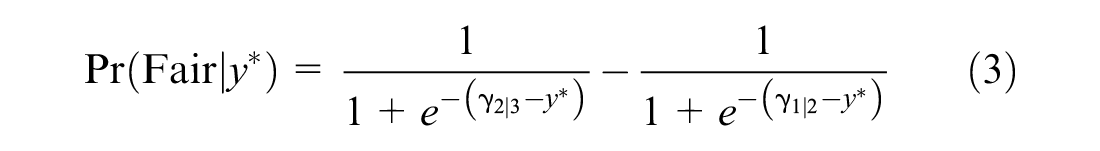
The two threshold values along the logistic probability density function for the three federal performance measures are:
Poor|Fair represented by γ1|2 = −9.1678
Fair|Good represented by γ2|3 = −1.2891.
The point prediction is simply determined by where the score falls in relation to the threshold values. The probability of a highway segment falling into each federal performance rating is determined by the distance of the score from each threshold value with the following equations based on the cumulative distribution function of the logistic distribution:


The combined CCI and IRI modeling outcomes were applied to the available historical management section data, and the results are presented in Figure 5.
Graph of percent good varying with critical condition index and international roughness index for interstate asphalt concrete pavements and jointed reinforced concrete pavements.
These results do not represent the expected trend between percent good with CCI and IRI. Similar results were obtained for percent poor. Quadratic curves observed here provide a concave form either upward or downward. While these curves are developed, the range of data used is to be noted. The prediction trends should be carefully considered where a quadratic curve changes the direction, to make sure it does not show a decreasing trend for an increasing performance measure or an increasing trend for a decreasing performance measure.
Therefore, different prediction models that made logical sense were explored. Among the various prediction models investigated, the s-shaped curves are expected to model the expected deterioration of pavements well in many aspects. They provide the ability to accommodate the variable rates of deterioration in the initial, middle, and final stages of a pavement life cycle. Typically, the rate of deterioration is slower in the initial stages, with a faster deterioration in the second stage, and the deterioration slows as the final levels are approached. The final level could be a maximum value for increasing levels of predicted quantities as in the case of percent poor or a minimum value as in the case of percent good as a pavement deteriorates. The s-shaped curves also display monotonically increasing properties as in the case of percent poor or a decreasing trend as in the case of percent good that represents the real-world situation for pavement deterioration. S-shaped curves also can constrain the prediction values to be within minimum and maximum values.
Refined Model Development
In 2022, another effort was made to refine the model to represent the correct trend. This time a larger set of data from the PMS, from 2007 to 2022, was used. For interstates, the number of sections for each pavement type used were ACP = 14,011; CRCP = 4811; and JRCP = 176. For primary roads, the number of sections for each type were ACP = 94,698; CRCP = 349; and JRCP = 263.
In Figure 6, the data points of percent good with respect to the CCI for interstate ACP sections are shown.
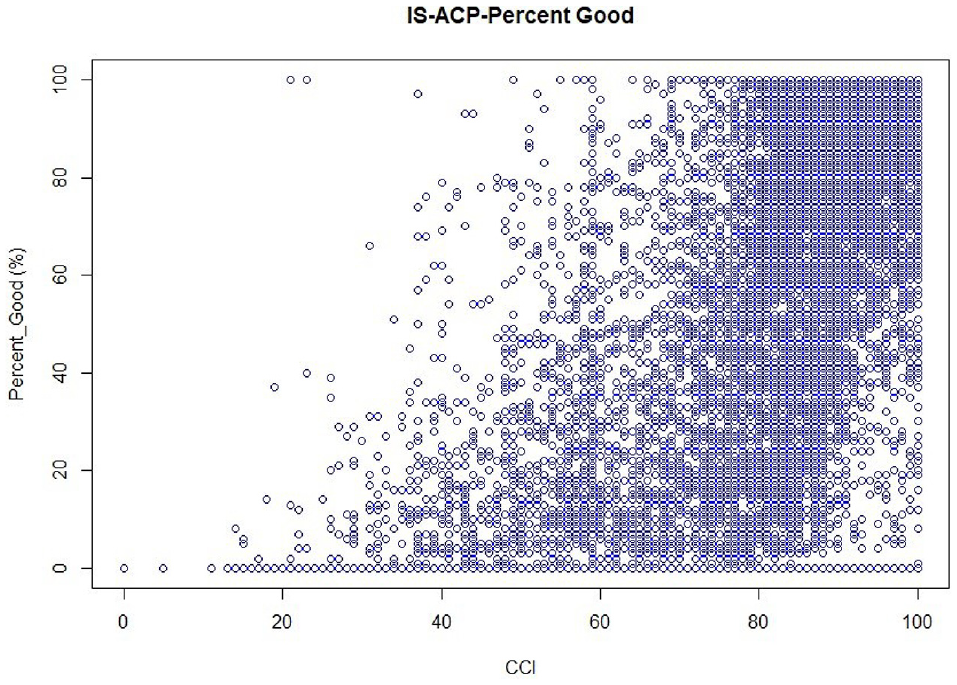
Percent good versus critical condition index for interstate asphalt concrete pavement sections.
For a section with a higher CCI, percent good is expected to be higher. But Figure 6 shows that there are a few sections with a higher CCI, for example, >80, with the percent good below 20%. This indicates that a pavement can be rougher without many surface distresses. In addition, sections may have low roughness with severe surface distresses, and this trend was observed in a minor portion of the data used. The implication is that the pavement sections with no or little surface distress but with high IRI values would not fall under the federal good category. Similarly, pavement sections with significant distresses with lower IRI values would not fall under the federal poor category. The accuracy of mathematical models is impacted by these trends, and the goodness of fit seen in the models described later is influenced by any wide scatter between the variables.
A Weibull distribution function is characterized by two non-negative parameters: a and y. Its cumulative distribution function, F(w), is defined as

In the specific application of the Weibull distribution to the study of pavement survivability, w is referred to as traffic load and the parameters a and y are referred to as a scale parameter and a shape parameter respectively. The survival function, denoted by s(w), is defined as the probability that an individual section of pavement of a given type survives a traffic load larger than w. From the definition of the cumulative distribution function F(w) it can be concluded that s(w) = 1−F(w), that is, (w) =
The Weibull distribution curve is used in


Here, the shape parameter y was considered 1 and the variable w was replaced by CCI/IRI in the case of percent good and IRI/CCI in the case of percent poor. Models developed with the parameter y values other than 1 did not result in high values of goodness of fit. The variable a is calculated using the sum of least square errors between the actual and predicted values.
The goodness of fit is calculated using

where
Results
Regression models were developed for ACP, CRCP, and JRCP separately. For percent good and percent poor, the mathematical forms in Equations 6 and 7, respectively, were used. The coefficient “a,” determined from model development, is presented in Table 4. Goodness of fit determined using Equation 8 is also presented along with the p-value for each equation. The Root Mean Square Error (RMSE) calculated as an additional measure of goodness of fit from the predicted and actual data is also presented in Table 4. The RMSE provides a measure of how close the predicted values are to the actual values.
Regression Equation Coefficient for Models
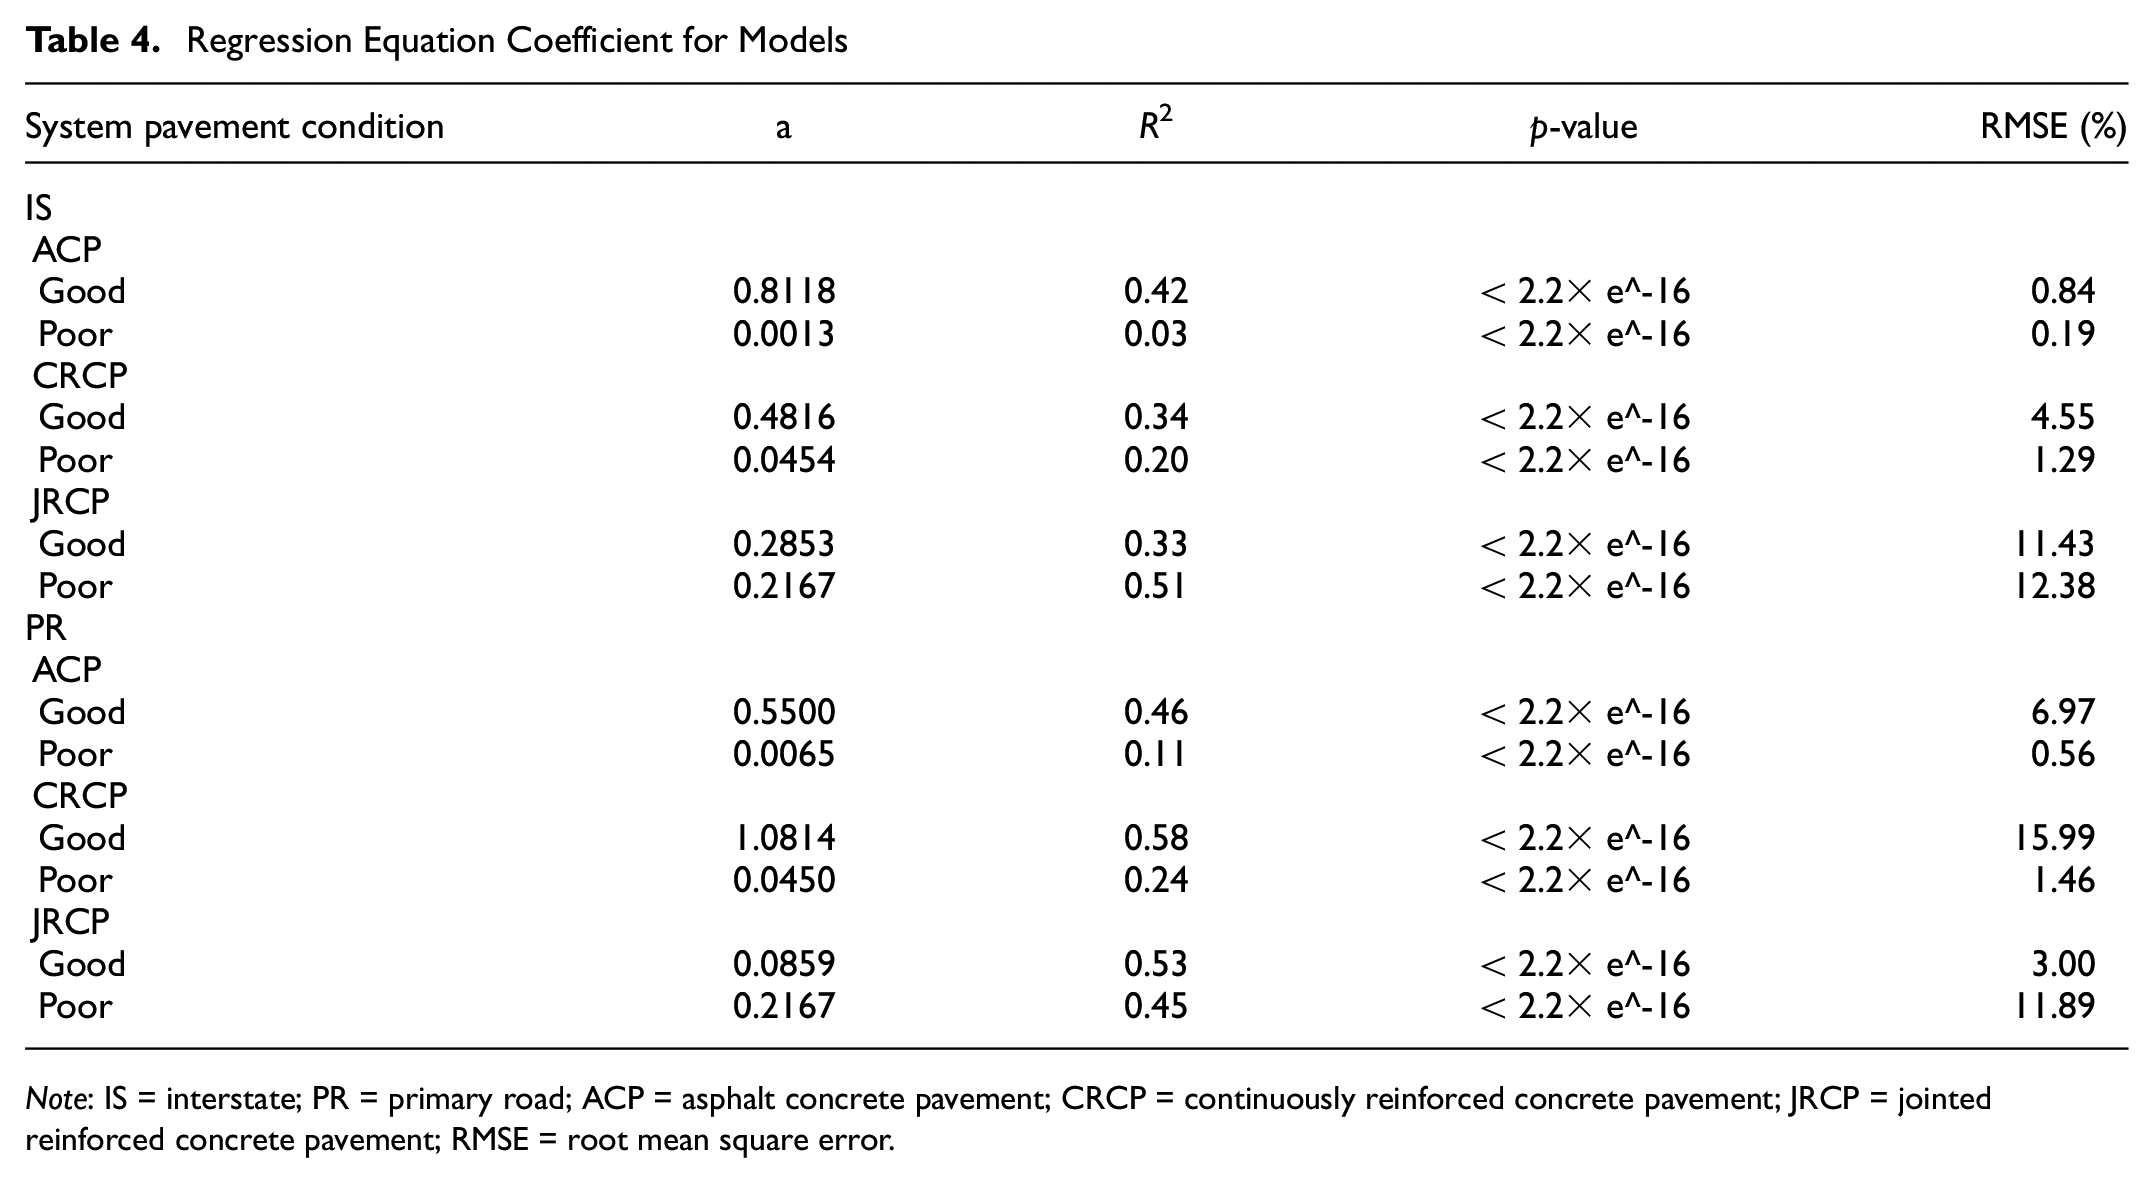
Note: IS = interstate; PR = primary road; ACP = asphalt concrete pavement; CRCP = continuously reinforced concrete pavement; JRCP = jointed reinforced concrete pavement; RMSE = root mean square error.
The predicted values of percent good and percent poor would help in the estimation of the performance levels of the network at the 2-year mid performance period and at the end of the 4-year full performance period. Together, the predicted values and RMSE would help in setting the performance targets for both the mid performance period and the end of the full performance period.
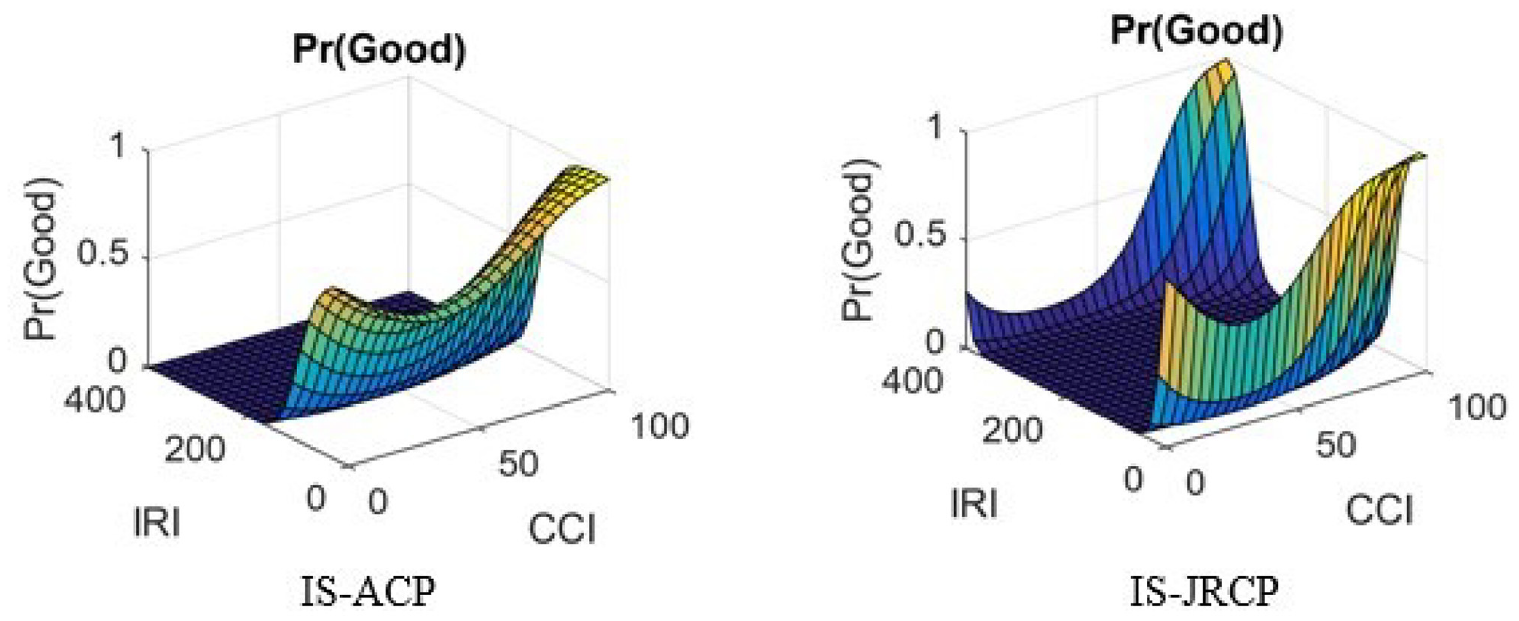
The 3D charts in Figure 7 show the predicted values along with the actual data. It can be seen that the prediction model encompasses the entire data range and follows the expected trend with regard to the variation of CCI and IRI. As can be seen in Figure 7, the number of data points for concrete pavements are relatively few, and most of the data points are for asphalt-surfaced pavements.
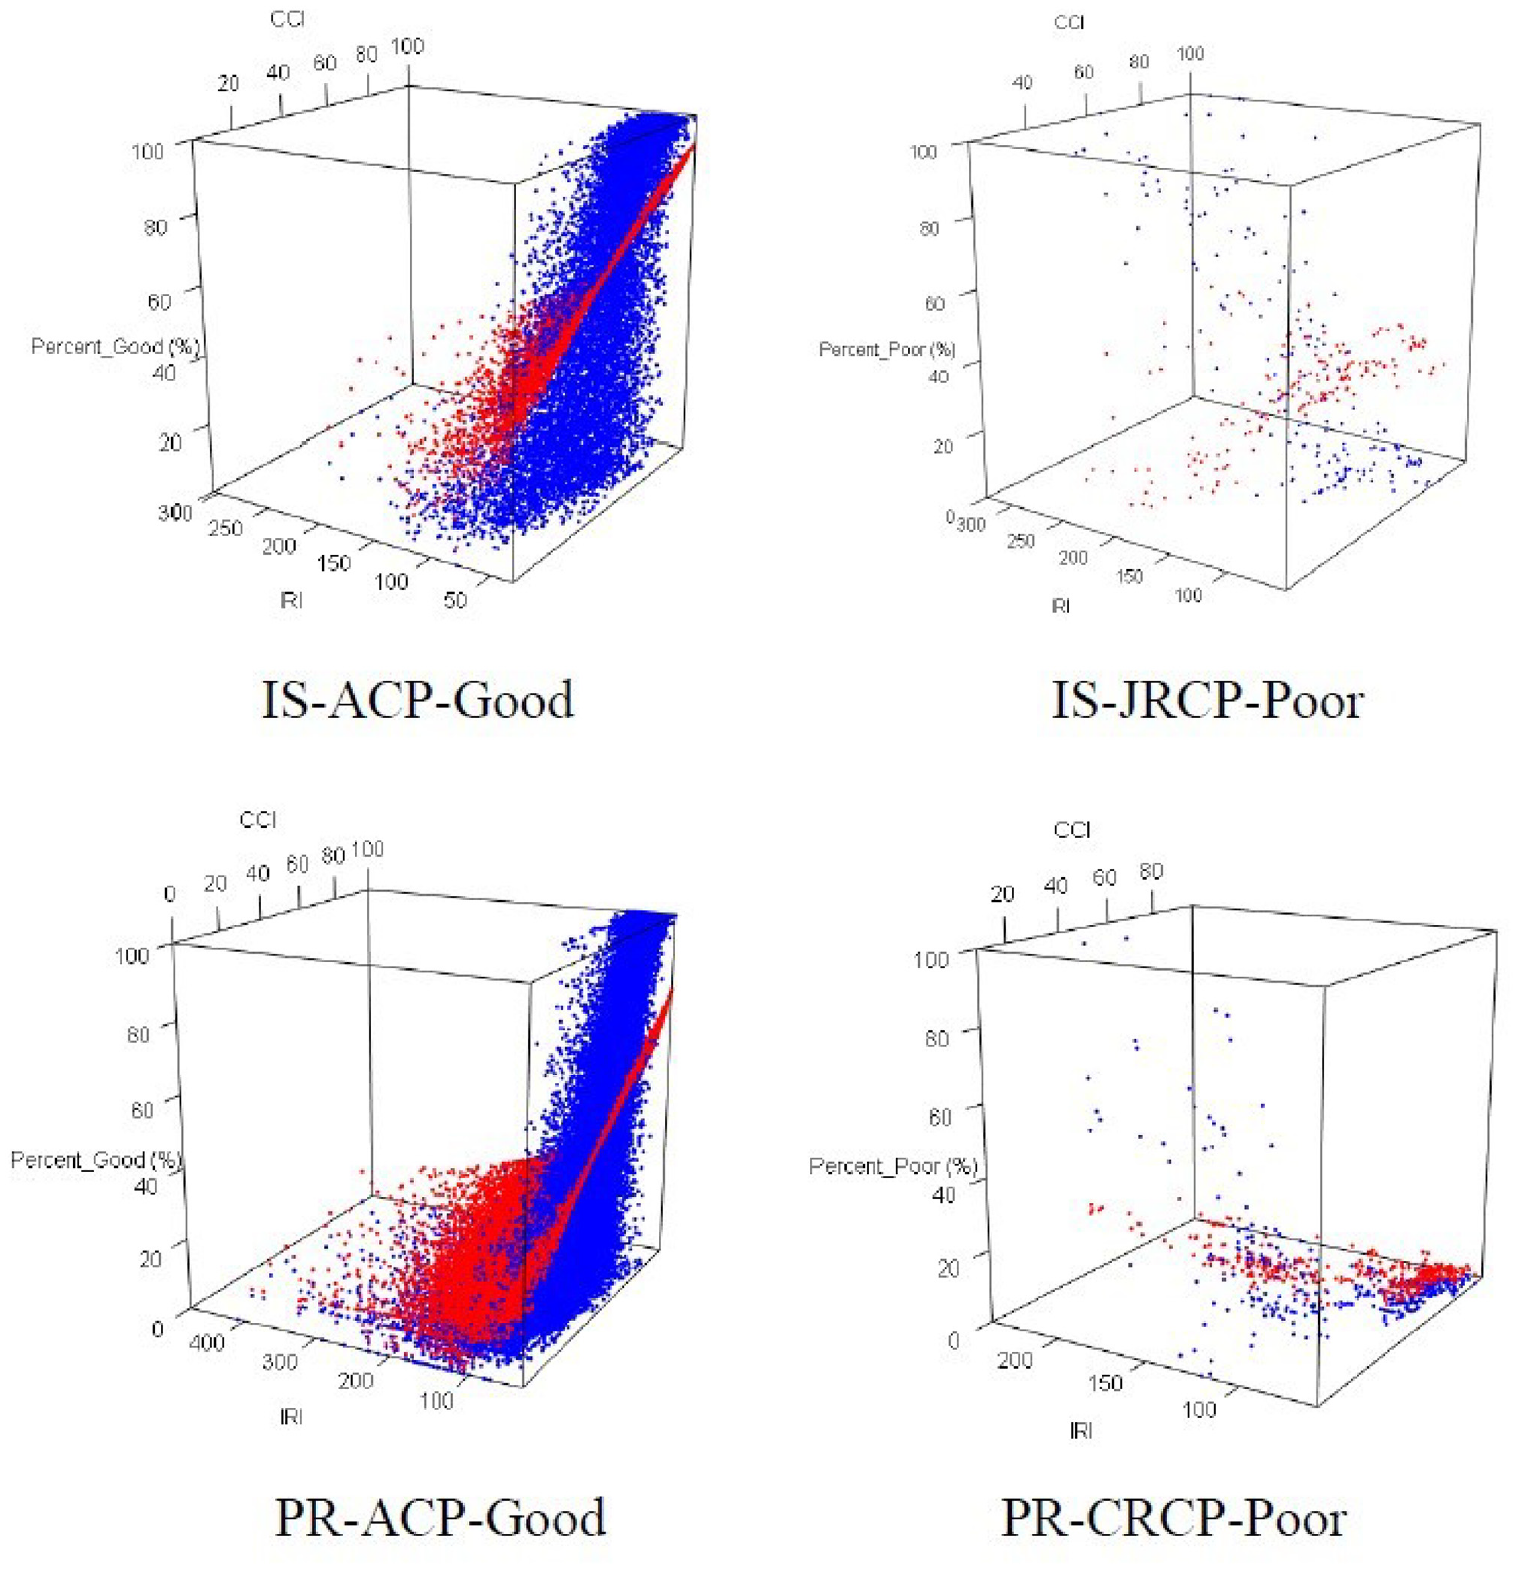
Actual data (blue) and fitted data (red) for interstates and primary roads based on pavement type.
To illustrate the application of this methodology to a wider data set, a portion of the LTPP data ( 19 ) was chosen from all four LTPP climate zones ( 20 ) with each zone containing many states. This represented not only different climate zones but also widely different geographical areas. Mathematical model forms similar to those in Equations 6 and 7 were used for these data. These equations were modified to include calibration factors for climate regions similar to those used in the Mechanistic-Empirical Pavement Design Guide ( 21 ) and are shown here.


where
a2 and a3 are the coefficients.
β2 and β3 are calibration factors for each region; for the global data, these factors are set to 1.0.
The coefficient values are a2 = 0.5263 and a3 = 0.0551.
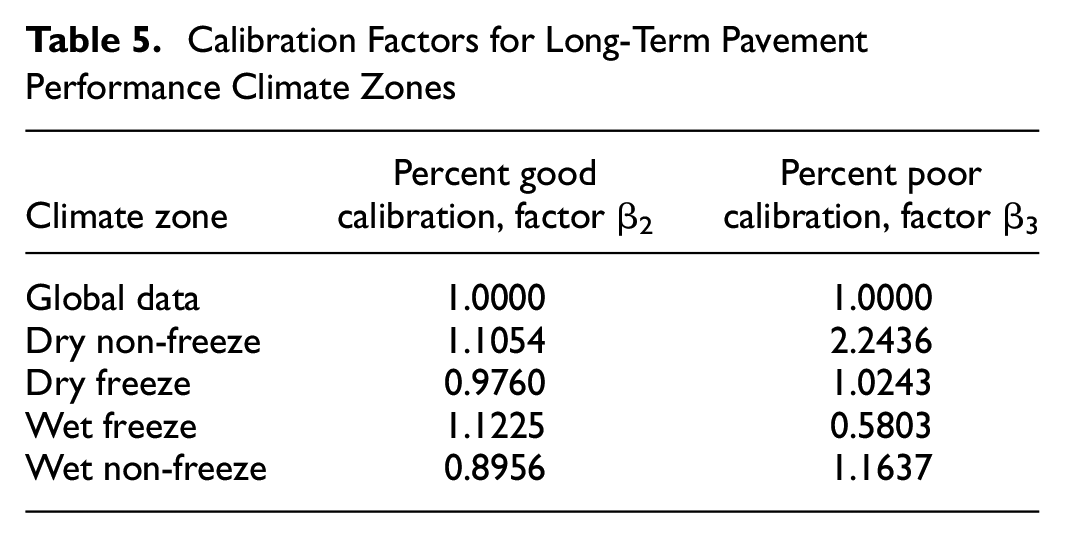
The developed calibration factors are shown in Table 5. Similar prediction models can be developed with indices, other measures, or other data used by different agencies.
Calibration Factors for Long-Term Pavement Performance Climate Zones
Many prediction models displayed a reasonably high goodness of fit that can be expected from field data. Some of the models however, showed low values of goodness of fit. There was a wide variation in the federal performance measure of percent poor for interstate pavements at low values of CCI. In addition, the fair rating was displayed by many sections at low levels of CCI for these sections. Since the data were distributed between fair and poor ratings for low CCI values, but not largely in poor ratings, the goodness of fit values were low. Similar trends were observed for percent good with JRCP. There was a wide distribution of data rated in the good and fair categories with high CCI values. Faulting was not considered in the calculation of the CCI, and pavements with high CCI values had faulting values that put them in the fair or poor category. The portion of concrete pavements in the network is small, and most of them were more than 20 years old, with faulting and IRI values placing them in the fair or poor category. Trials of several alternate model forms and different models for different ranges for the CCI and IRI are planned for further investigation to improve the goodness of fit for these models.
For easier understanding of the 3D models, one of the variables, the IRI, was kept constant to reflect the variation in percent good and percent poor with varying CCI values. Figures 8 and 9 represent these trends for interstates and primary roads.
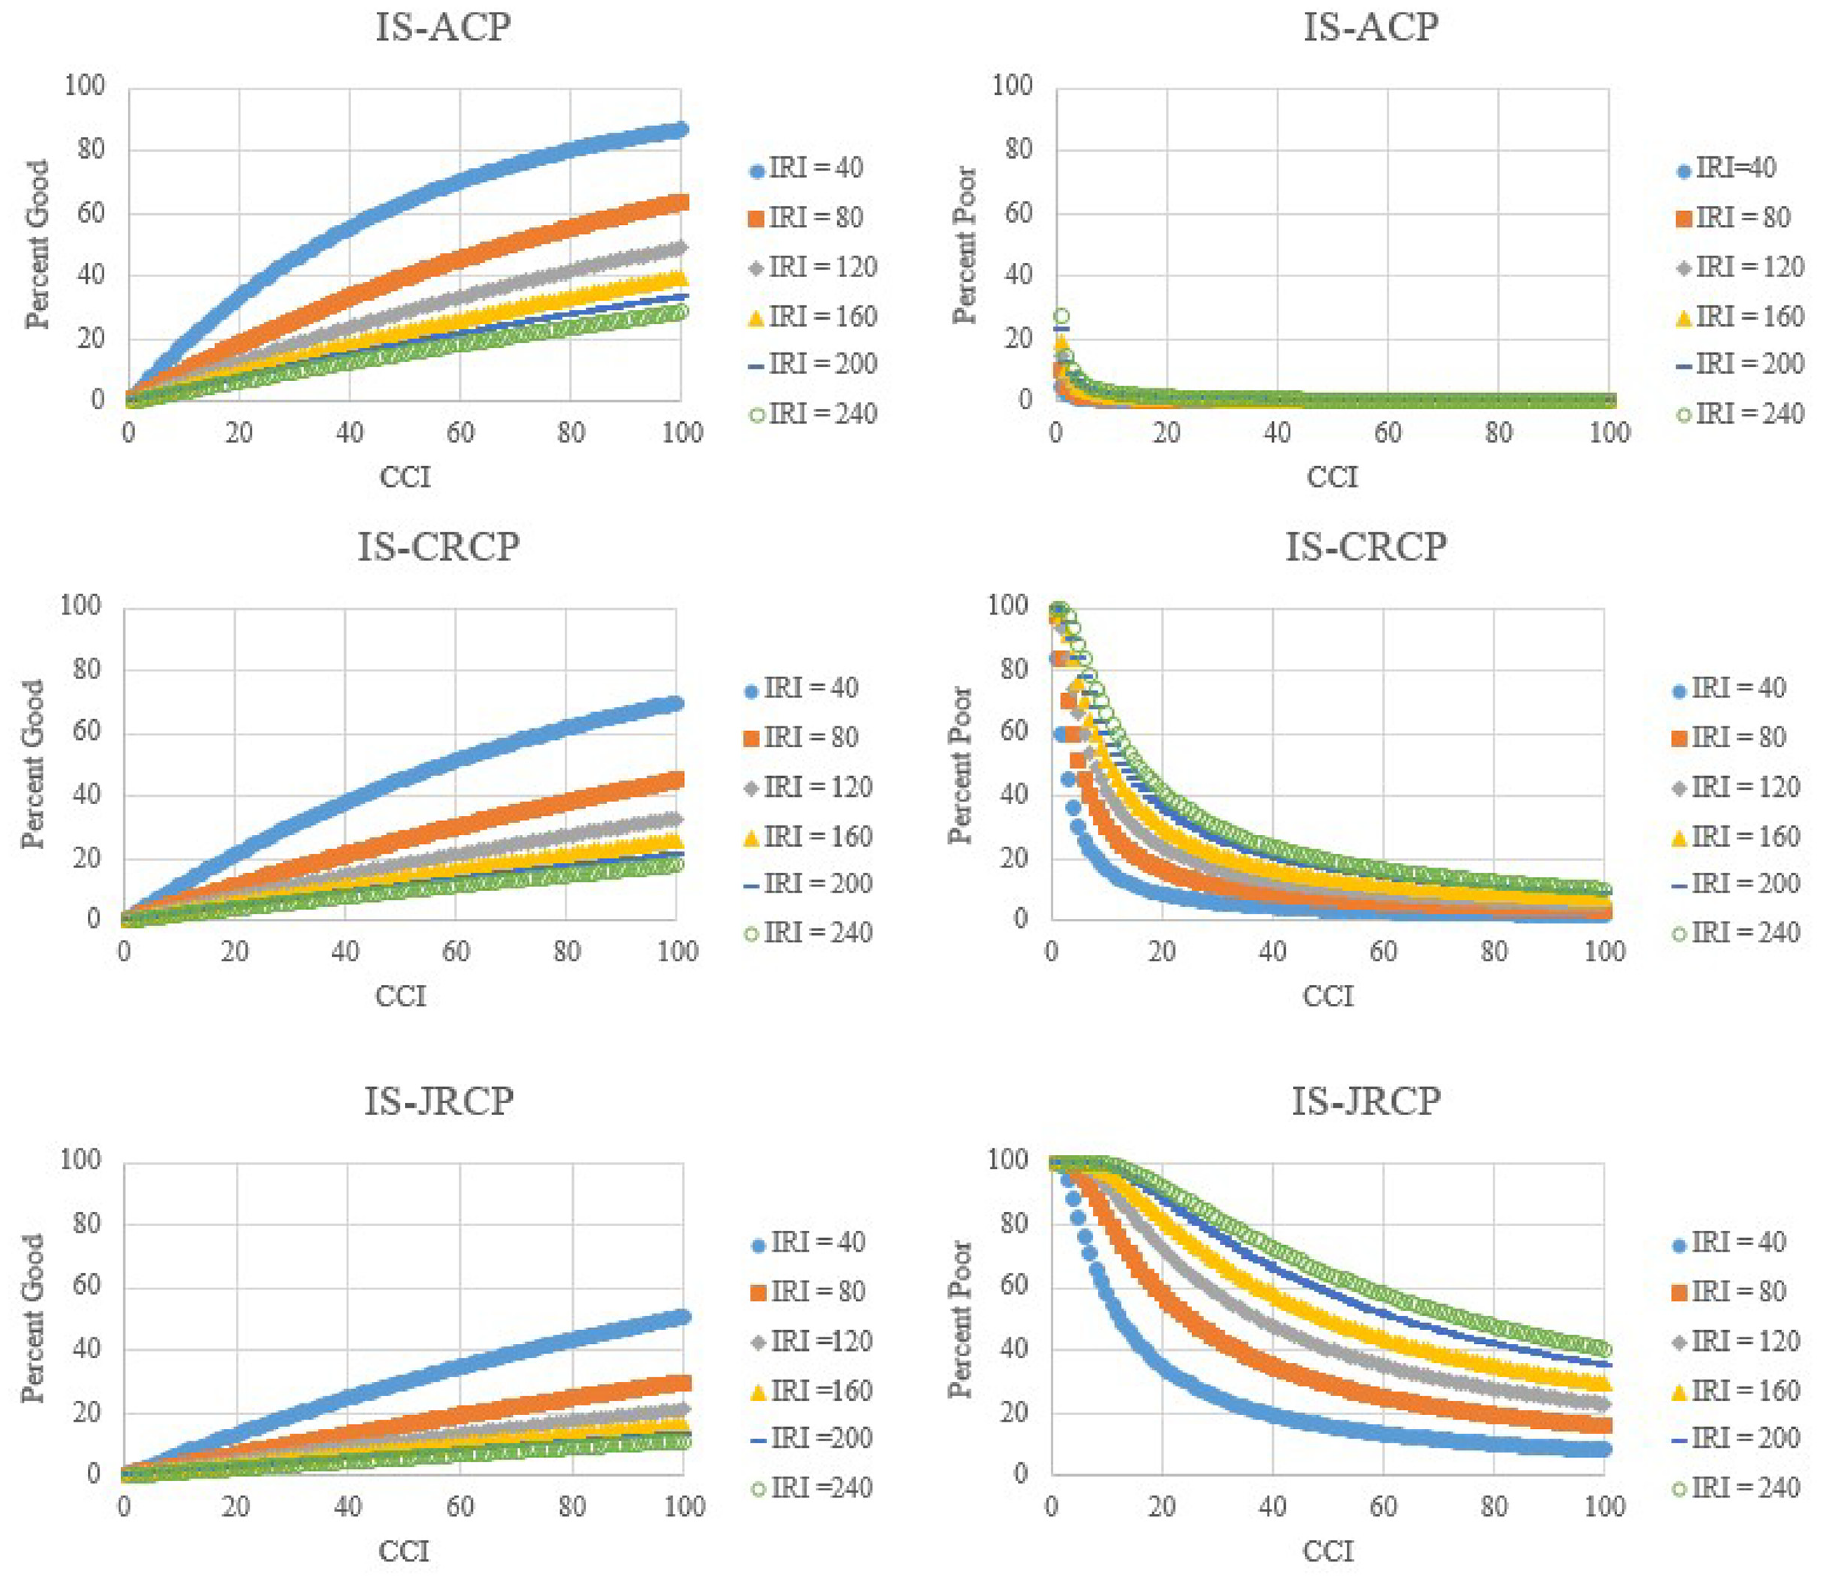
Variation in percent good and percent poor based on critical condition index for varying levels of international roughness index for interstates.
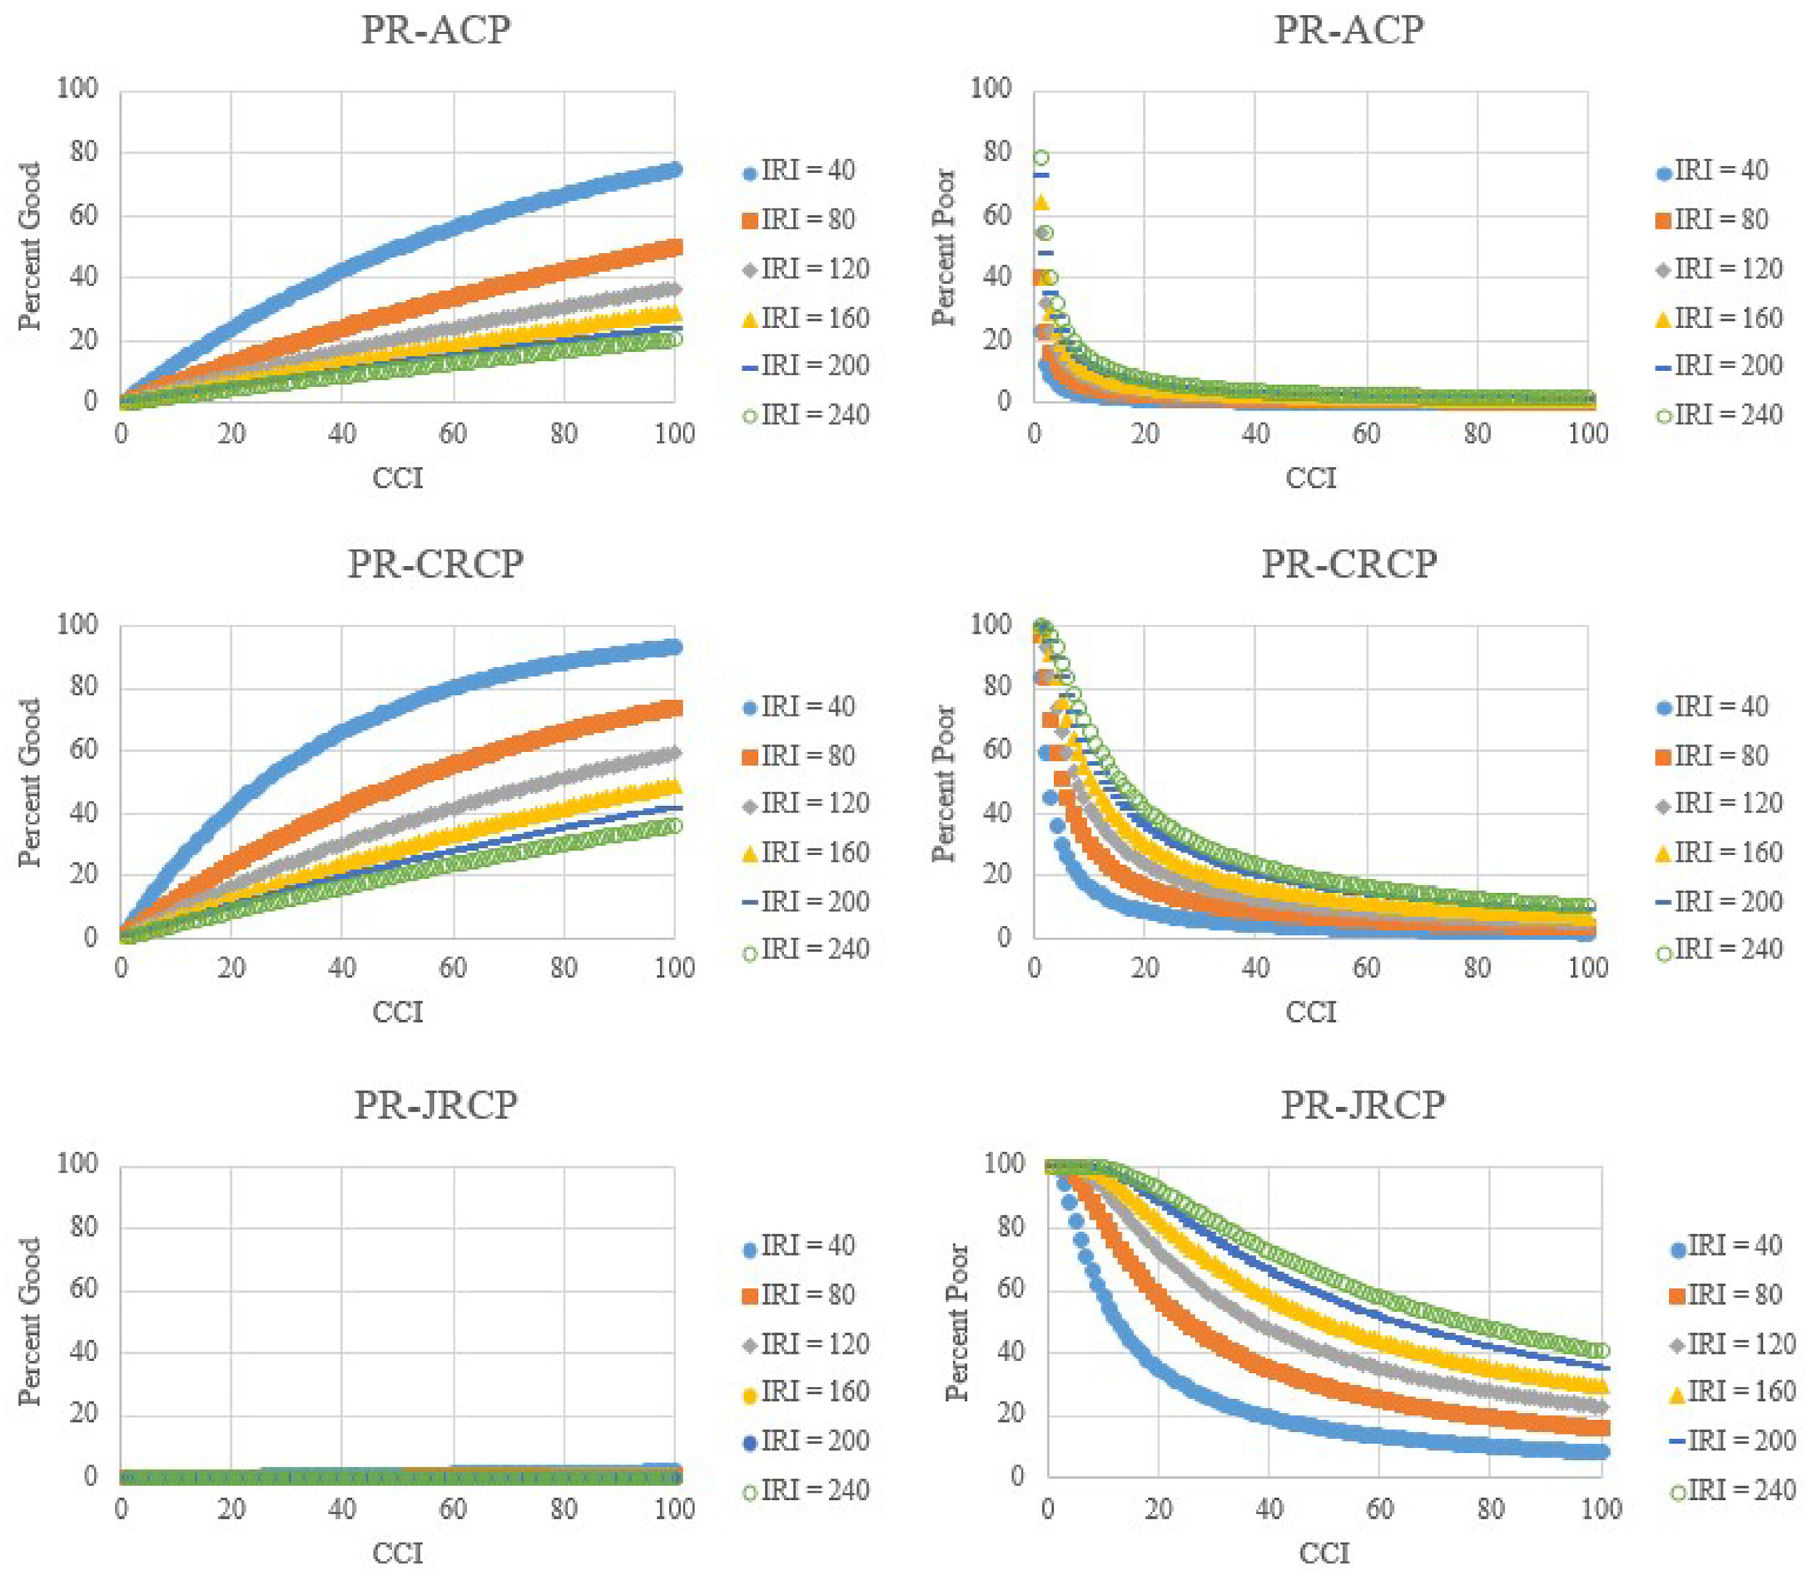
Variation in percent good and percent poor based on critical condition index for varying levels of international roughness index for primary roads.
The portion of the network that is JRCP is small, at 77 lane miles, which is 0.35% of a total network size of 21,725 lane miles of primary roads. Those in the federal good condition are less than 5% of the JRCP network. Therefore, relatively few data points were available in this category for model development. For the determination of CCI, faulting and IRI are not factors, and therefore higher faulting and IRI values do not reduce the CCI values. High faulting and IRI values will result in federal categories of fair or poor. From the database it was found that most of the JRCP sections fell into the fair or poor category. The data in the previous two years has a few pavement sections in good category because of some treatments provided to those sections. There was undue influence of zero percent good on model development from previous years’ data. Therefore, the equation for percent good for primary roads was refined with the previous two years of data. Here the maximum value of the percent good is below 20%, and this is reflected in the developed model. This model, developed with few data points, yielded low values of percent good even for pavements with high CCI and low IRI values. Overall, the percent good for JRCP does not vastly influence the network performance levels because the JRCP portion of the network is small on the primary road system.
Discussion
The VDOT database that has been in use for more than 15 years has the details of all distresses needed to determine and predict federal performance measures. To determine the M&R needs, VDOT has developed a process of using the CCI in optimization analyses. With this process, future M&R needs and their estimated costs are determined. The percent good and percent poor prediction models developed here are used to determine the federal performance levels. Ideally, the contributing factors to the federal metrics, namely, alligator cracking, rutting, IRI, and faulting, need to be predicted and used in M&R recommendations. However, the models to predict these are yet to be developed to determine their levels in 2-year and 4-year periods. Determination of contributing factors to predict alligator cracking, rutting, IRI, and faulting is planned for future research. Once these models are developed, federal performance levels of the network can be determined by straight application of the values in the federal performance criteria, as mentioned in Table 1. Another method is to use the trends in performance from legacy databases to predict performance and set targets. Extrapolation of data may also be used from the trends in historical data.
In general, based on decision trees, lighter treatments are recommended for pavements with higher CCI values and heavier treatments are recommended for pavements in worse condition, as indicated by lower CCI values. Other factors such as classification as interstates and other systems, traffic levels, pavement types, and types of existing treatment are included in decision trees for treatment recommendations. Analysis processes from other software and other indices can be used in a similar way. The pavement condition index, on a scale of 0–100, can be used in a similar way, and decision trees can be formulated to determine the treatment types. These kinds of composite indices provide an advantage of needing to develop only one prediction model as opposed to those for individual distresses. A composite index can be used in the forecast of pavement condition, optimization analyses, and decision trees. Use of these indices in decision trees can result in different recommended treatments, and each of those can have different deterioration rates. For example, a surface with preventive maintenance treatment is expected to deteriorate faster than a surface with major rehabilitation. These differences would result in different levels of percent good and percent poor in future years.
The development of similar prediction models was illustrated with the LTPP data set covering a wider geographical area. This methodology can be applied to derive prediction models with different data sets or different indices.
Conclusion
Pavement network performance can be measured in different ways. VDOT has been using the state performance measures in managing the pavement network for more than 15 years. FHWA’s Transportation Performance Management requires specified distresses to be reported to meet the federal performance measures. In addition, the expected performance over a 4-year period is monitored with the targets set for that period. A methodology developed to predict the federal performance measures utilizing expected state performance measures during the 4-year performance period is used as a basis for setting the targets.
The initial models developed 4 years ago were used in determining the expected performance and in setting targets at that time. With the availability of more data in recent years, new models were developed, and the results are presented in this paper. Several mathematical model forms were tried, and details about one particular model are presented that showed the greatest accuracy. The expected performance of the network is impacted by the decisions made and implemented for funding levels, types of treatments planned, and the year in which those treatments are applied, apart from traffic loading, climatic effects, and material properties. The models shown in this report display the right trend of either monotonically increasing or decreasing values. Determining the expected performance of the network and thereby setting targets is aided by the developed models.
Footnotes
Author Contributions
The authors confirm contribution to the paper as follows: study conception and design: A. Baranikumar, R Shekharan; data collection: A. Baranikumar, R Shekharan; analysis and interpretation of results: A. Baranikumar, R Shekharan; draft manuscript preparation: A. Baranikumar, R Shekharan. All authors reviewed the results and approved the final version of the manuscript.
Declaration of Conflicting Interests
The author(s) declared no potential conflicts of interest with respect to the research, authorship, and/or publication of this article.
Funding
The author(s) received no financial support for the research, authorship, and/or publication of this article.