
Abstract
Active transportation modes such as walking and bicycling have demonstrated several benefits for health, the environment, the economy, and road safety. However, the transportation planning process in rural areas rarely incorporates this mode of transportation. In fact, many small and rural towns lack the resources, experience, and capabilities to conduct detailed modeling of active transportation. In response, this research developed an Active Route Visualization (ARV) Tool to support planning and decision making in small cities and rural towns. By incorporating a modified three-step modeling process that used active trip rates developed from the 2017 National Household Travel Survey, the ARV Tool provided a map that highlighted the daily volumes of active travel in the community and ranked the roadway segments that had greater potential to support walking and bicycling. This research demonstrated application of the ARV Tool in the city of Atmore, AL. Implementation of the tool was valuable in this rural city as it supported a community coalition effort in partnership with the Alabama Cooperative Extension System to promote active transportation. In this process, the community coalition reviewed and discussed the ARV Tool outputs and provided invaluable local knowledge and feedback that were incorporated into the action plans. Small and rural towns can benefit from an easy-to-use, practical, and data-driven tool that provides insights to initiate discussions to identify priorities and opportunities for active transportation.
Keywords
Past research has documented the strong influence that active travel planning and improved built environments have on how frequently communities walk and bike on a daily basis ( 1 ). This is especially critical in smaller communities, where they are experiencing record levels of obesity and adverse health outcomes related to reduced physical activity ( 2 ). In fact, lack of physical activity in small cities and rural communities in the United States has become a challenge for the health sector; according to the Centers for Disease Control and Prevention, adults in nonmetropolitan (rural) areas are more likely to be obese than those in metropolitan (urban) areas ( 3 ). The linkage between transportation planning and livability in small cities and rural communities is also indicated by the level of access to everyday destinations, which might limit opportunities to travel ( 4 ), hindering social and economic development. Conversely, active modes of transportation such as walking and bicycling promote equal access opportunities to everyday, essential destinations ( 5 ), such as grocery stores, schools, and medical facilities. Active modes of transportation can simultaneously improve cardiometabolic and mental health ( 6 , 7 ), promote economic development through an increase in local tax revenue, property values, consumer spending, and employment ( 8 ), improve road safety ( 9 ), and minimize environmental impacts ( 10 ).
As such, many smaller communities are now seeking to introduce safer and more accessible walking and cycling infrastructure to their existing vehicle-oriented built environments to encourage a shift in active travel behavior. However, active transportation (AT) planning in small U.S. cities and rural towns represents a challenge for local, state, and federal agencies and remains a notable research need among practitioners and researchers alike ( 11 ). In addition, money, time, and human resources have been identified as common barriers to implementing AT policies and actions among rural communities ( 1 ). Other issues include lacking experience in implementing AT planning and incorporating AT in the local planning process ( 12 ). Similarly, the lack of understanding of the interdependence of social, economic, and health benefits with AT remains a significant barrier to policy implementation ( 12 ). To overcome these challenges, local planning could benefit from (a) the creation of partnerships among health professionals, local and state transportation planners, and local coalitions ( 13 ), (b) building on existing infrastructure to develop larger plans that minimize initial investment and financial burden ( 14 ), and (c) tailored data-driven tools to identify routes that support AT to focus time, resources, and the needs of the community (15–17).
This research describes the development and implementation of a GIS-based Active Route Visualization (ARV) Tool to support AT planning and decision making in small cities and rural towns in the United States. The objectives of this study were to (a) develop a flexible and practical three-step modeling process to support AT planning in small and rural towns, (b) package this process in an easy-to-implement GIS-based application, (c) demonstrate application of the ARV Tool with a real-world data example in Alabama, and (d) summarize the benefits and opportunities of using the ARV Tool in the planning and decision-making process. The ARV Tool can be used by small towns in urban and rural areas to generate a planning-level map highlighting the routes most likely to support walking and bicycling between residential zones and everyday destinations. This tool is intended to support local planners and coalitions as they complete the transportation planning public outreach process and identify routes that could be improved, promoted, and connected to support AT—to serve small and rural towns lacking the experience and resources to conduct advanced, detailed AT plans that require more time and financing.
The remainder of this paper is organized as follows: the literature review is followed by a description of the ARV Tool planning process. The subsequent section demonstrates application of the tool, and finally, our conclusions and the limitations of this research are presented.
Literature Review
Local transportation agencies typically rely on travel demand tools for modeling, forecasting, and decision making ( 18 ). However, these tools are mainly focused on motorized modes, and their application to nonmotorized modes can be challenging. For example, the requirements and nature of nonmotorized trips, that is, short-distance journeys with both origin and destination within the same zone, increase the difficulty of implementing traditional travel demand tools ( 19 ). Nevertheless, several studies have been conducted on nonmotorized and AT travel for different applications. The array of applications falls mostly within facility demand rather than regional modeling because of the complexity of representing nonmotorized travel ( 20 ). Examples of such applications included route choice modeling ( 21 , 22 ), destination choice modeling ( 23 ), and demand ( 24 ). However, much of this work focuses on urban areas using modeling techniques that can be difficult to implement in small cities and rural towns owing to their limited resources and expertise.
In practice, there are two main approaches to modeling nonmotorized AT trips. The first involves regression models of demand for a specific corridor. Examples of this approach include AT counts estimated using a negative binomial model for the Seattle metropolitan area ( 24 ), linear regression techniques to model daily pedestrian traffic on urban trails in response to neighborhood characteristics ( 25 ), negative binomial regression to estimate bicycle counts in New York City ( 26 ), and a generalized linear mixed model to estimate changes in bicycle volumes in Seattle ( 27 ). The second approach includes the use of logit models. For example, a logit model was developed to study mode choice modeling between cycling and not cycling ( 28 ), and route choice using two logit formulations ( 29 ). Finally, a multiclass and multicriteria bicycle trip assignment model was developed as an alternative to the traditional all-or-nothing approach ( 30 ). However, both modeling approaches assume selection of specific corridors as the starting point for any analysis and have difficulty identifying potential corridors. Furthermore, variables used in these models are based on urban traveler- and built environment characteristics, thus, such models might not be transferable to enable estimation of AT in rural areas ( 31 , 32 ).
Forecasting pedestrian and bicyclist travel consists of modeling trip volumes includes variables describing sociodemographics, policy implementation, and infrastructure ( 33 ). Literature provides several methods for forecasting pedestrian and bicyclist volumes. The most comprehensive summary of methods for demand estimation is presented by Schwartz et al.; in this publication, the authors identify five methods: comparison studies, aggregated behavior studies, sketch plan methods, discrete choice models, and regional travel models ( 34 ). Other modeling methods are classified by their purpose, however, they all estimate the demand for walking and bicycling travel. These methods included relative demand potential, supply quality analysis, and supporting tools and techniques ( 34 ). It should be noted that, overall, AT modeling can be divided into two levels of analysis: aggregated and disaggregated.
Measures of potential demand provide estimates of the number of bicycling and walking trips. This method included an hourly estimate of bicycle and pedestrian trips in Blacksburg, VA ( 35 ) and bicycle volumes in Alameda County, CA ( 36 ). In both examples, multiple variables are included in the modeling of direct demand, for example, land use and transportation. Comparison studies include before-and-after analyses to compare travel among facilities with similar characteristics.
The traditional four-step process that incorporates trip generation, trip distribution, mode choice, and trip assignment falls within the category of regional travel models, which estimate trips by purpose, mode, and origin–destination (O-D), subsequently distributing them among the zones of analysis ( 34 ). This method can combine aggregate and disaggregate characteristics. An example of the four-step modeling process is the application of a walking and bicycling model in the Chicago transportation area ( 37 ). Similarly, Clifton et al. proposed a four-step modeling process to support metropolitan planning organization (MPO) planning ( 38 ). The notable advantage of this modeling method is that walking and bicycling trips can be generated independently ( 39 ).
Despite the literature available on modeling and forecasting walking and bicycling travel for distinct applications and approaches, the challenge remains because no research has focused on modeling AT for small cities and rural towns. Only a few studies have investigated this issue, for example, Georgia Department of Transportation’s Multimodal Transportation Planning Tool, developed to facilitate bicycle planning in rural areas ( 40 ). Another such model comprised the estimation of pedestrian and bicyclist annual average daily traffic in a small rural college town in Virginia using direct estimates ( 41 ).
The lack of literature addressing walking and bicycling modeling in rural areas is a particular challenge for small cities and rural towns wanting to develop planning solutions that will promote AT. In response, the ARV Tool is a tailored application designed specifically for these communities. It has been designed following standard modeling processes but with a modification that accounts for walking and bicycling only. The following section will discuss the ARV Tool planning process in more detail.
Modeling Potential Active Travel Routes
As stated, the main objective of the ARV Tool is to generate a planning-level map that highlights the routes that are most likely to support walking and bicycling between residential zones and everyday destinations. This section describes the methodology of the modified three-step model planning process developed to forecast potential AT trips and assign them to the most likely routes. This process includes small-community-focused AT trip generation, trip distribution, and route assignment. The modeling process is intended to be completed at the census block level, meaning that potential AT trip productions and attractions will be generated for each census block, trips will be distributed between census block pairs, and AT movements will be assigned to the roadways/paths/trails connecting these census block pairs. This paper uses the terms “census block” and “zone” interchangeably.
This approach was selected owing to (a) it being familiar to many of the rural planning organizations interested in AT planning, (b) the quantitative nature of the process, which allows planners to start local outreach discussions with an impartial and equitable data-driven map, and (c) it being based on publicly available data that are easily accessible to rural planning organizations.
Trip Generation: Potential AT Trip Production
The first step of the AT modeling process—trip production—calculates the number of potential bicycle and pedestrian trips made by residents within each census block. The AT production rates used in the modeling process were estimated from travel recorded from 117,222 household records in the 2017 National Household Travel Survey (NHTS) located in nonurban core communities (i.e., suburban, second city, and town and rural respondents) to reflect the types of communities that might implement the tool. This incorporated households from communities across the United States comprising varying amounts of AT infrastructure. All households were included, even if they completed zero or more walking or cycling trips. NHTS defines a trip as “the start and end movement from location to location by any mode of transportation.” This definition also applies to any walking and bicycling trip reported in the survey, and makes no distinction based on trip length or duration.
AT trip rates were calculated using the traditional cross-classification approach and were based on two distinct variables in the 2017 NHTS to match census two-variable household demographic tables from Census Table H16 (i.e., Tenure by Household Size). Although several variables were considered, these were selected for two main reasons: first, the variables needed to have been validated by previous research as significantly influencing cycling demand. Second, data on the number of households in a census block based on the selected variables needed to be available. After comparing the variables from the NHTS and census, home ownership and household size met both requirements. Table 1 shows the combined walking/cycling trip rates for each nonurban household based on size and household ownership.
Walking/Cycling Trip Rates
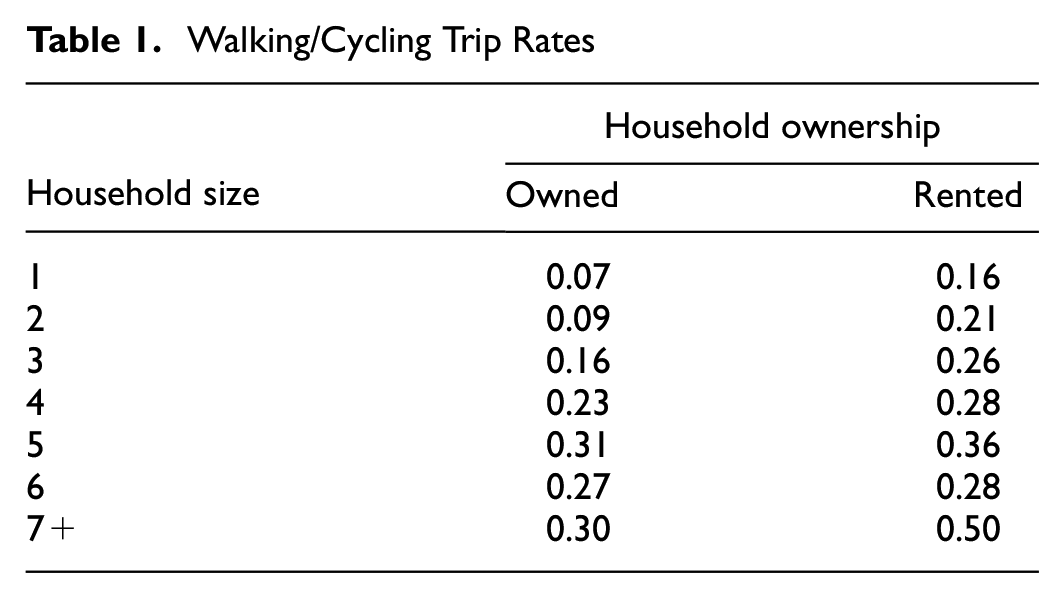
It is important to note that the trip rates in Table 1 could be updated with data from local travel or regional travel surveys. Although the 2017 NHTS may not be ideal for all modeling applications, it is the best source of data on nonurban walking/cycling trip rates in the United States.
The total AT trips produced from each zone was calculated by multiplying the number of households of each type by the corresponding production rate (Table 1) using the following equation:

where
These values were scaled up by 100 to capture the appropriate variations in relatively small trip volumes.
Trip Generation: Potential AT Trip Attractions
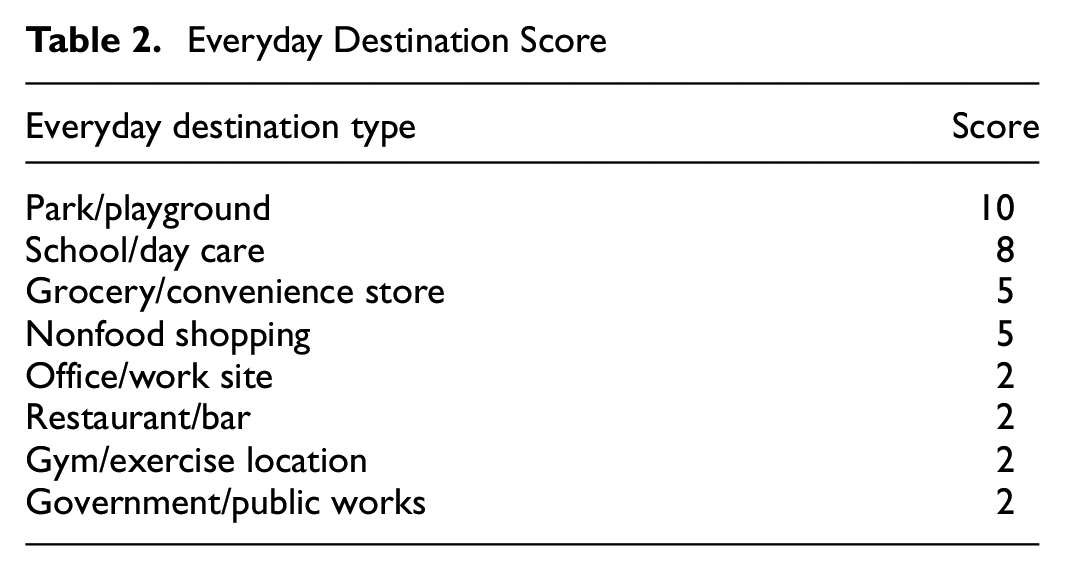
The number of potential bicycle and pedestrian trips ending within each census block, or AT trip attraction, was then calculated. Attractions were estimated based on access to everyday destinations, and focused on cycling for utilitarian purposes, including shopping, going to school or work, running errands, and so forth. Again, to sync with the available data, this measure of attractiveness was derived from two components. First, the number of different everyday destination types (e.g., schools, parks, grocery stores, government buildings, restaurants) was counted for each block. In application, it is recommended that users review Google Maps to identify all the appropriate destinations in each block, although additional tax records or land-use maps could also support this effort. Second, users defined how important connecting each everyday destination type via walking or cycling was to their community. This took the form of a table, with each everyday destination type listed with a score describing how much they would like citizens to visit the destination on a daily basis on a scale from 1 to 10 (1 representing the lowest level of interest and 10 representing the highest). For example, destinations such as parks and playgrounds received the highest scores, whereas destinations such as bars and restaurants received the lowest. This score table could be adapted to meet specific community needs. This method (a) allows the process to be tailored to the specific needs of a community, (b) supports the community outreach process by encouraging communities to come to a consensus on their every destination priorities, and (c) simplifies the data collection process into something understandable for inexperienced planners. A total “attraction score” for each block was calculated by summing up all the individual everyday destination scores multiplied by the number of that everyday destination type within that block.
The total number of attractions needs to equal the total number of productions, thus, the attractions per zone were calculated through the following two steps. First, a total community-level “weight score” (Equation 2) was calculated to determine the relative value of the unitless destination score point in the community on a given day. As all attraction score points for the community needed to match all the AT trips produced in the community, we calculated this weight score as,

where
This step was completed by calculating the total number of trips drawn to each zone (

Trip Distribution
This step of the planning process was concerned with the distribution of the AT trips between each pair of zones; it considered travel distance as a link impedance or friction factor for trip distribution calculations. The following sections describe two analyses: first, calculation of the minimum distance between every pair of zones; second, calculation of the number of trips between every pair of zones.
The first task was completed using GIS software (the ArcGIS application process used in the ARV Tool is described in the next section). Each zone was converted into a centroid, and the shortest path between every pair of zones identified along the roadway/pathway/trail network. It is important to recognize that this network may include current infrastructure/conditions or proposed future infrastructure/conditions depending on how users are conducting their planning. Shortest path calculations were based on travel times, not roadway characteristics, so that this planning exercise could identify the best potential routes that would serve the community in the future without restricting itself to the limitations of the current infrastructure. At the end of this first task, the distance traveled (miles) along the shortest path between every pair of zones was recorded.
The second task calculated the volume of AT trips between every pair of zones. This calculation was done by implementing the standard transportation planning gravity model. This model and its parameters were taken from NCHRP Report 716 “Travel Demand Forecasting: Parameter and Techniques” ( 25 ). The gravity model used in the ARV Tool is depicted in Equation 4 as,

where
Equation 4 incorporates a friction factor that follows a common mathematical form ( 25 ). The friction factor follows a gamma function with parameters a, b, and c, described in Equation 5 as

where
Route Assignment
The final step in the modified planning process assigned the AT trips that traveled between each pair of zones to the community roadway/pathway/trail network and added the total AT trips per segment of the roadway network. This way, the total volumes of potential AT trips were tallied; network segments with high volumes can either be generated from (a) a single route between a zone pair with many trips or (b) multiple routes between different zone pairs that all use the same segment. At the end of this task, the roadway segments with the highest AT trip volumes were identified as those with the greatest potential to support walking and cycling. Because this planning process was not restricted by current infrastructure, these segments could now be evaluated in relation to (a) whether existing infrastructure could support the potential demand, (b) whether there were parallel or alternate routes that would be more feasible but support the same travel needs, and (c) how these routes could equitably support the population within the community.
Creating an Easy-to-Implement GIS-Based Application
As discussed, this process was intended to be used by planners and communities with some technical skill but limited budgets and expertise. However, users should be familiar with GIS layers and data, the basic functions of ArcGIS, and have a knowledge of databases. As such, this process was packaged as the ARV Tool in an easy-to-implement ArcGIS custom toolbox, which can be loaded into any map workspace and automatically completes the entire planning process with only a few inputs and the click of the start button. This section outlines the inputs and unique toolbox functions used to automate the process and present the results.
The inputs were divided into two categories: community data and tool setup files. The first category of inputs included easy-to-collect and format GIS layers of the (a) roadway/pathway/trail network, (b) census blocks, (c) census data on block household size and tenure, and (d) user-defined everyday destination score table. Within this category, the first two files were shapefiles that contained specific geospatial information on the community; the second two files were Excel tables. The second category of inputs was additional tool files included with the toolbox file. These required files were mapping and route templates that the tool used for routing and displaying the results. For example, a route template was required to develop the final output maps. Figure 1 shows a process map to help understand use of the ARV Tool from installation to output generation.
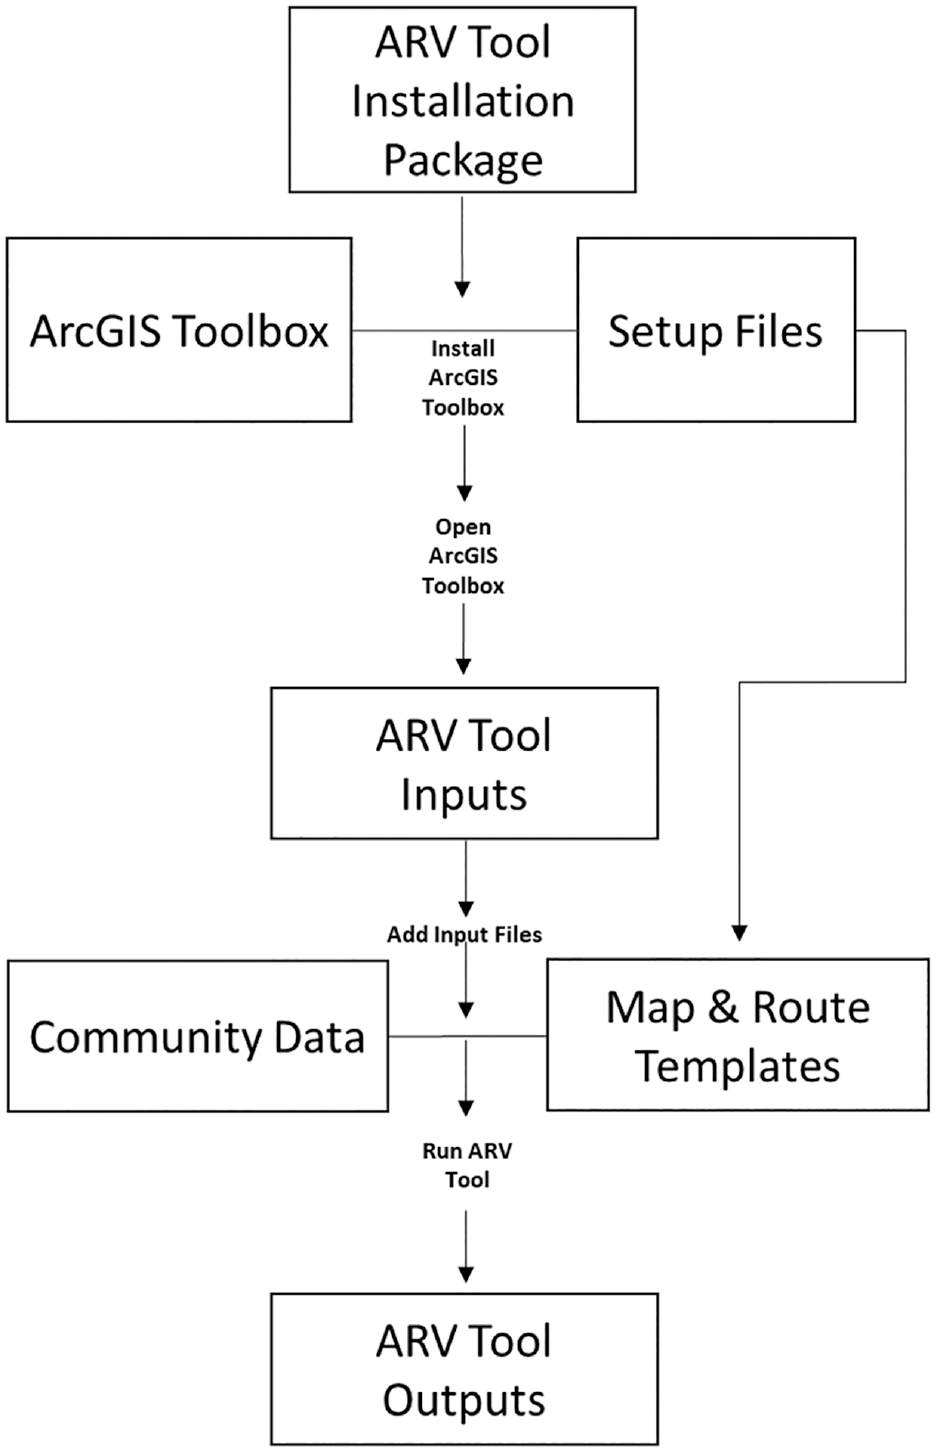
Active Route Visualization (ARV) Tool Implementation Process
The ARV Tool was designed as a custom ArcGIS toolbox (i.e., ArcToolbox). As such, it is capable of accomplishing certain geospatial analyses as part of the modeling process. Specifically, in this modeling process, we implemented the ArcGIS Network Analyst extension to find the shortest path (in miles) between every pair of zones. First, the tool created points in the centroid of each zone in the community; these points served as the location of origin (O) and destination (D) for each zone. Then, the ArcGIS “Make Closest Facility Layer” function scanned every possible route within the network and identified the shortest path for each O-D pair. In addition, for each O-D pair the segment of the network that provided the shortest path, the distance traveled (miles), and a detailed list of all the links that were traversed on the shortest path was recorded. The size of this array was equal to the square of the total number of zones in the community. Because of computational requirements and to speed up the analysis, the ARV Tool was restricted to 500 zones, which was determined to be a reasonable limit for small communities.
For the route assignment step in the planning process, the ARV Tool worked its way through each roadway segment in the community, and for each segment, it scanned the array from the previous calculations to (a) identify which O-D pairs included that segment in their shortest path and (b) assign the trips of that O-D pair to the segment. This iterative process continued until every segment of the community roadway network had been scanned and a count of trips assigned; if one segment was not used by any O-D pair, then no trips were added. In fact, there may be several segments with no volume; this indicates these segments will not support AT trips in the community based on the shortest path between two zones.
Once volumes were assigned to every network segment, the ARV Tool formatted the results to display an easy-to-interpret map. First, the tool created a layer that included the roadway segments that supported at least one AT trip—the traversed edges layer. The tool appended the segment information that included trip volumes to the corresponding segment in this layer. Then, using the required input map template, the tool used a default symbology (e.g., layer color, categories) to format the layer. Finally, a predefined symbology was applied to the traversed edges layer to highlight the hierarchy of the community roadway segment. This hierarchy was displayed as a blue-five-scale color scheme that indicated how much volume a roadway segment supported. This final weighted map was displayed in ArcGIS once the tool had completed the analysis.
Implementation Case Study
To assess the benefits of the ARV Tool application, a case study in Atmore in Escambia County, AL was undertaken. Escambia County is located in the south of Alabama, and its boundaries to the south include the state of Florida. Atmore has a population of approximately 8,391 residents, according to the U.S. Census Bureau website. Two main highways cross the city: AL-21 and US-31. Escambia County is one of 14 counties in the state of Alabama that are part of ALProHealth, an Alabama Cooperative Extension System initiative that seeks to reduce and prevent obesity employing a community-based approach ( 26 ). As part of the ALProHealth program, Escambia County and Atmore specifically were included in the implementation of the “Active Routes to Everyday Destination” program to promote AT in rural Alabama to achieve social equity, economic prosperity, and improved community health ( 42 ). Figure 2 shows the location of Escambia County and the other five counties included in the program; however, in the scope of this research paper, only Escambia County is discussed. As an observation, the ALProHealth initiative focus is counties that have historically suffered from social inequality, poverty, and high obesity rates among adults. As noted in Figure 2, some of the counties in this initiative are located in the Alabama Black Belt.
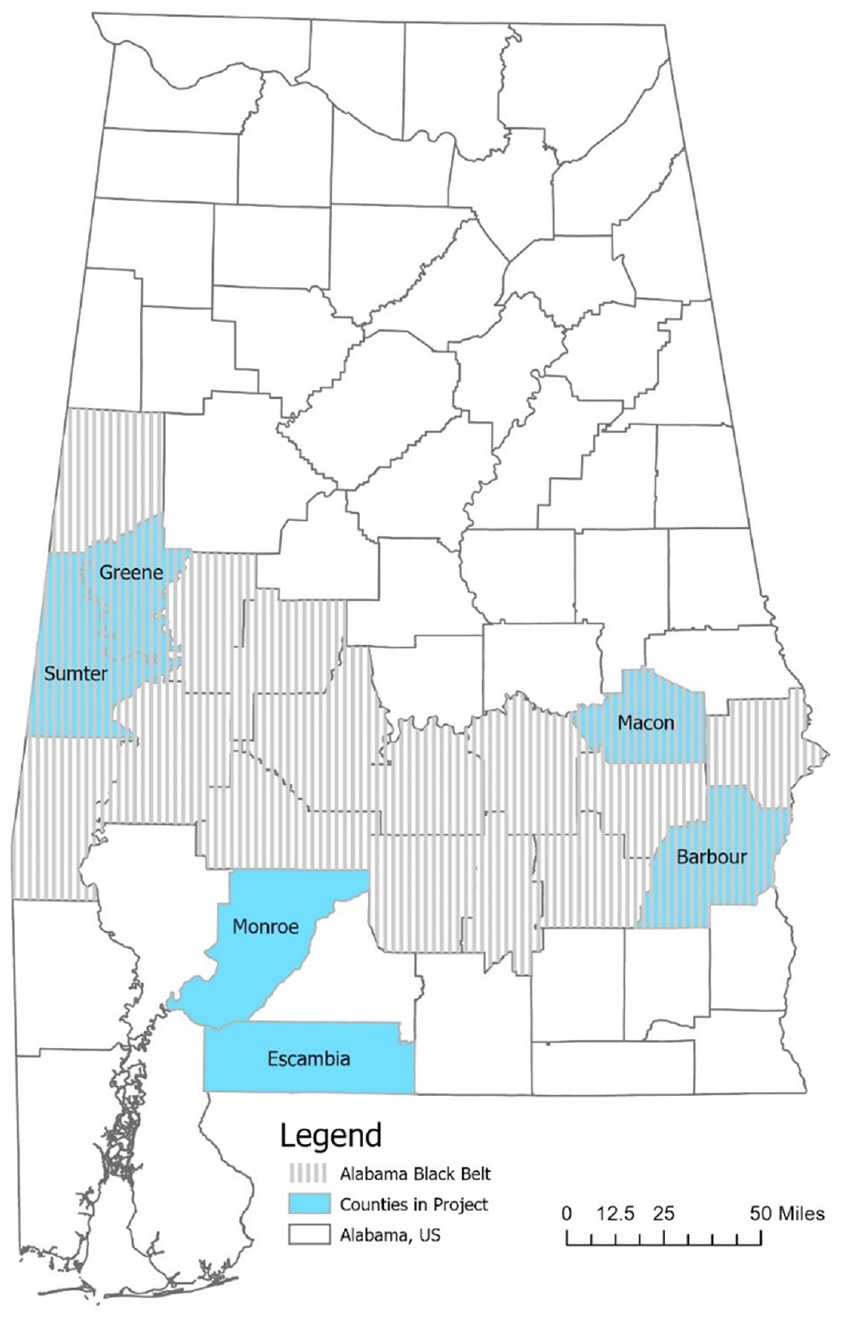
Counties Where ARV Tool was Implemented
The first step in the application of the ARV Tool in Atmore included data collection to gather information on (a) community roadway networks, (b) neighborhood boundaries, (c) neighborhood characteristics, and (d) everyday destinations. First, roadway shapefiles were retrieved from the U.S. Census Tiger/Line Shapefile archive. This file corresponds to all roads within the boundaries of the county. The road network was then trimmed to include only roads within the boundaries of the city. Second, using the same U.S. Census Tiger/Line Shapefile archive, neighborhood boundaries for the county were retrieved. These boundaries were defined at the census block level. Specifically, for Atmore, a total of 263 zones were included in the analysis—this means there were 263 O-D pairs. Third, neighborhood characteristics were retrieved from the U.S. Census website. This information was found specifically in the “H16: Tenure by Household Size” table. These data contained the number of households by tenure and household size for each zone, and it were retrieved at the census block level. They were downloaded for the entire county and then cleaned to match only the census blocks included in the boundaries of the city. A scanning process within the city boundaries was then carried out, which used Google Maps to identify the community’s everyday destinations and collate their latitude/longitude. Finally, destination scores were assigned to each location type. The score table used in this application (Table 2) was developed based on feedback from the Escambia Active Travel Community Coalition.
Everyday Destination Score
Once the community data were collected, the ARV Tool software was implemented using ArcMap version 10.7.1 (although the tool could be used with any version after 10.7). The data were then processed, and the output is shown in Figure 3. The weighted map displays the potential daily volume of AT trips produced by Atmore residents (Figure 3). The hierarchy of volume in each segment of the roadway network is illustrated by a five-blue-scale color scheme (i.e., light blue indicates roads with a low potential to accommodate AT trips, whereas dark blue indicates roads with the highest potential to support AT trips). It is important to remember that these results are the output of a modified three-step process for walking and bicycling. The daily volume of trips ranged from zero to 25 per day. The highest AT volumes were observed within Carver Ave., going from 4th St. in the city’s Northeast toward the downtown area. Not surprisingly, this corridor is within one of the densest residential zones in the city. On the other hand, because downtown comprises a range of destinations made it a highly demanded destination zone. The next road segment that experienced a high volume of AT trips was Medical Park Dr. in the city’s southeast area. This small corridor connects residents with Atmore Community Hospital and other medical facilities.
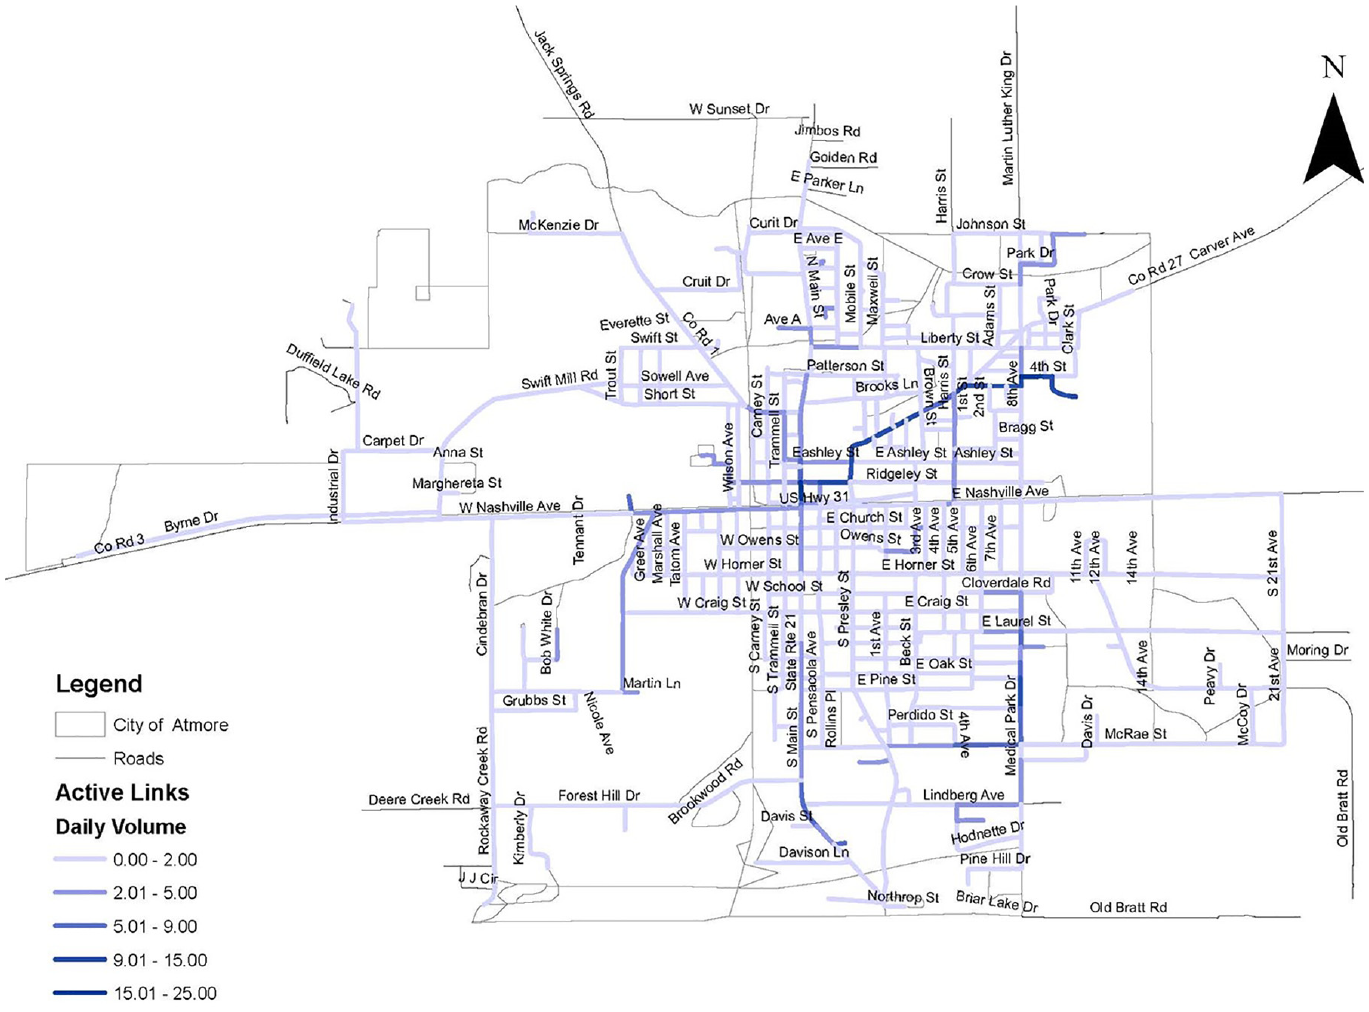
ARV Tool Output Results in Atmore, AL
The insights contained in the ARV Tool output will be a valuable resource for community coalitions to trigger conversations and discussions to support AT in their communities. The tool provides data-driven knowledge to make informed decisions (a) when prioritizing limited financial resources, (b) when seeking to incorporate short-term AT planning within long-term transportation planning, (c) when wanting to take advantage of state and federal funding opportunities that overlap both AT and traditional transportation planning, and (d) to provide communities with the initial data to expand discussions about the implementation of AT.
The map in Figure 2 was presented to the Escambia Active Travel Community Coalition in a Zoom online discussion. The objective of the discussion was to identify corridors within Atmore that the coalition wanted to (a) promote as important corridors for walking and cycling and (b) further evaluate to determine what infrastructure and/or policy changes would be needed to achieve this promotion. The map was used as a starting point to highlight areas within the community where walking and cycling would potentially be most common were they promoted. As a starting point, the researchers oriented the participants with the map and discussed important destinations across the city. The coalition then provided local knowledge and experience that cannot be captured by the tool. For example, the community coalition agreed that Carver Ave. was an important connection through their community for walking and cycling. However, as a high-volume, high-speed roadway, for safety purposes, they proposed switching focus to a parallel road to promote instead, consisting of mainly local and collector streets. Furthermore, they had not considered the importance of walking and cycling within the southeastern corner of the community, but discussions about the highlighted roadway segments confirmed that there were underrepresented and older groups living there that needed support. Here, the data-driven map helped the community to (a) quickly focus on the appropriate locations for improvement, (b) consider areas that were not immediately obvious, and (c) make prompt decisions about the opportunities, challenges, and potential alternatives. This type of feedback was invaluable in the process of drafting solutions for the promotion of AT in the community. It will also promote efficient and effective use of resources because funding will be targeted for infrastructure that is located where the needs of the community are. However, without the quick and easy-to-interpret data-driven maps generated by the ARV Tool, this kind of information might not be easily accessible.
The local feedback was incorporated into the final action plan, and Atmore was able to document several improvements focused on these specific corridors that included both low-cost/short-term improvements and high-cost/long-term infrastructure changes. These measures varied from traffic-calming infrastructure to improved safety in areas of concern to painted bike lanes and crosswalks in areas with no connection to everyday destinations, roundabouts, and sidewalks.
Conclusions
This research paper documents development of the ARV Tool to support AT in small cities and rural towns across the United States. Its development was based on a modified three-step modeling process and included the forecasting of active trip rates using data from the 2017 NHTS. The ARV Tool was designed as a custom ArcGIS toolbox, which facilitates the modeling process and geospatial analysis. The output of the tool was a weighted corridor map that showed daily volumes of AT trips; these volumes were depicted using a color scale that described the hierarchy of each roadway segment in the community in relation to its potential to support AT.
The ARV Tool could provide community coalitions, stakeholders, and city planners with data-driven knowledge to make informed choices and facilitate decision making. The tool is practical, flexible, and relies on readily available data. It is easy to use and only requires a minimum knowledge of ArcGIS. These all represent advantages for small U.S. cities and rural towns that are seeking to promote AT because of the many benefits of this mode of transportation. The ARV Tool was designed to provide communities challenged by scarce resources and capabilities the opportunity to develop a rapid, data-driven process to identify the routes that have the greatest potential to support walking and bicycling within their boundaries. The goal was to use the ARV Tool output in collaboration with local coalitions and city planners to identify and prioritize AT investment. Other benefits include the capacity to evaluate future land development and scenario planning based on the short- and long-term planning goals for locations, including new parks, land uses, and facilities. The ARV Tool will allows planners and stakeholders to study active travel impacts based on different planning scenarios.
The tool was implemented in a case study in Atmore, Escambia County, AL. This city is included in the ALProHealth initiative to promote AT in rural Alabama. The results of this application were shared with a community coalition, and the ensuing discussion provided additional local insights and feedback that was incorporated into the final planning report. This planning report contains several solutions for short- and long-term planning horizons.
Future work could consider more detailed analyses of time of day trips, mode splits, elevation changes, travel times, and intrazonal movement. Further refinement of the walking and cycling trip rates based on local data would be useful. Developing a standardized destination scoring system based on known behavior and priorities would also be beneficial for communities that are looking for guidance. Additional data validation of results would be beneficial in addition to the community review of results. For example, future research could benefit from including walking and pedestrian counts to calibrate the results. Finally, it would be useful to further consider the sensitivity of the model to destination scores and zone size. Nevertheless, the results as they stand could be valuable for an initial assessment and to initiate a more exhaustive discussion that would include the participation of local members of the community to provide inputs and feedback before making design and investment decisions.
Footnotes
Acknowledgements
The authors acknowledge the City of Atmore Coalition team for their support of the research and for their feedback during the discussion of the ARV Tool output. The authors also thank and acknowledge the Alabama Cooperative Extension System and ALProHealth team at Auburn University for their collaboration and support in this study.
Author Contributions
The authors confirm contribution to the paper as follows: study conception and design: J. LaMondia, F. Cordero; data collection: F. Cordero; analysis and interpretation of results: F. Cordero, J. LaMondia; draft manuscript preparation: F. Cordero, J. LaMondia. All authors reviewed the results and approved the final version of the manuscript.
Declaration of Conflicting Interests
The authors declared no potential conflicts of interest with respect to the research, authorship, and/or publication of this article.
Funding
The authors disclosed receipt of the following financial support for the research, authorship, and/or publication of this article: Funding for this research came from the Centers for Disease Control High Obesity Program.