
Abstract
The advent of transportation network companies (TNCs), also known as commercial ridesharing providers, has disrupted transportation systems leading to new facility designs. Dedicated pickup/dropoff areas can facilitate the future shift to autonomous vehicles. In this study, angled stalls and parallel curbside parking, along with signage and education, were investigated using pedestrian and wheelchair simulators. Human behavior was examined with regard to safety, efficiency, and accessibility. Microsimulation and Surrogate Safety Assessment Model were used to examine the effect of increased demand on design capacity and number of conflicts. In simulations, both stall and curbside designs performed comparably in crosswalk usage, but the stall design was safer when passengers waited longer for vehicle arrival. It is preferable to wait to approach the loading area until the TNC vehicle arrives. Stall design was more accessible but curbside design had greater efficiency because of shorter vehicle waiting time (−7.31 s [p < 0.01]). Signage and education were found to be effective in increasing sidewalk usage, decreasing deviations from the crosswalk, and reducing vehicle waiting time. Post-simulator surveys showed similar ratings for safety (80.65%), with stall design scoring higher in accessibility (90% versus 52%) and curbside design slightly higher in efficiency (77% versus 68%). Participants reported almost equal preference for stall or curbside designs (48% versus 52%), and over 90% found the signage and education effective. Microsimulation indicated that stall design had higher capacity (500 vehicles per hour) than curbside design (350 vehicles per hour) within 180 linear feet, and fewer overall conflicts at 300 loadings.
Keywords
The popularity of transportation network company (TNC) services among travelers has increased considerably in recent years. TNCs, also known as commercial ridesharing providers, such as Uber and Lyft, have grown rapidly. According to a survey conducted by Pew Research Center, in fall 2018 ( 1 ), 36% of adults in the United States had used TNC services, compared with just 15% in 2015. As technology advances and TNCs implement new business models, like subscription plans, TNC service is expected to continue expanding.
Concurrently, autonomous vehicles (AVs) are gaining more support for statutory approval for testing ( 2 ). TNCs are expected to adopt AVs for service. It is estimated that within 10 years of regulatory approval, 95% of all passenger miles traveled will be completed by AV fleets ( 3 ), and most travelers will simply be picked up at the origin of their trip and dropped off at their destination. Therefore, a new and safe design of pickup/dropoff areas fitting this new transportation mode with higher capacity and efficiency is demanded. The objective of this paper is to assess and compare a newly designed angled stall parking design with the traditional curbside parking design via pedestrian and wheelchair simulators, along with a post-simulator survey and microsimulation in VISSIM. The simulator study focuses on assessing human behavior and its results are thus limited because it relies on the use of individual human subjects. The microsimulation seeks to investigate issues dealing with capacity by modeling multiple pickups and dropoffs in an hour.
Energy is another aspect to be significantly affected by AVs and TNCs because the future fleets are expected to be dominated by electric vehicles (EVs). According to the 2017 National Household Travel Survey (NHTS) conducted by the U.S. Federal Highway Administration (FHWA), there has been a 63,000% increase in alternative-fuel vehicle ownership since 2009 ( 4 ). This number is expected to continue increasing as EVs become more affordable and practical, and autonomous EVs (AEVs) for fleet will comprise approximately 60% of all vehicles on the road ( 3 ).
With the increasing demand for TNC services and the expected shift to AVs, in particular AEVs, a safe and effective design of pickup/dropoff areas is of high importance. Airport terminals are one of the places where pickup/dropoff areas are highly utilized, with terminal curb space being very expensive and limited. Primary airports, such as Kansas City International (MCI), strictly regulate pickup/dropoff areas and how travelers wait at curbside to be picked up ( 5 ). Airports seek to reduce terminal curbside congestion by applying different prices and directing private vehicle pickup/dropoff traffic to different parking areas ( 6 ). The International Transport Forum ( 7 ) recommended planning for curb use, shifting from car parking to passenger pickup and dropoff, and facilitate AV TNC service with strategic priorities. Other types of TNC pickup/dropoff area optimization include distributing traffic flow evenly, maximizing passenger arrival probability ( 8 ), and optimizing airport shuttle routing and scheduling using heuristics algorithms ( 9 ).
Previous literature focused on congestion reduction, airport policies and regulations, efficiency ( 10 ), and safety ( 11 ), but gives little guidance on the physical design of pickup/dropoff areas for high-demand or autonomous TNC services. Human behavior with respect to different physical designs has not been investigated in a quantitative manner. This paper addresses this research gap by contrasting the effectiveness of two physical designs, angled stalls versus parallel curbside, along with signage and education, through passenger behavior assessment in pedestrian and wheelchair simulators. The tradeoffs in the two types of designs include capacity, accessibility, user preference, wait time, crosswalk usage, sequential conflicts, and merging conflicts.
The reasons for utilizing simulator study are to provide a safe and controlled environment ( 12 ), and to eliminate potential risk or ethical dilemmas imposed by field studies ( 13 , 14 ). More importantly, simulators offer the capability of testing innovations that may not be physically developed yet, which is a perfect fit for the new physical designs in this study.
There are three major parts in this study: one is the design, including physical designs and signage and education package; the second part is the simulator study, using pedestrian and wheelchair simulators, along with a post-simulator survey; the third part is the microsimulation in VISSIM, along with the Surrogate Safety Assessment Model (SSAM).
Methodology
Physical Designs, Signage, and Education Package
Pickup/dropoff areas, such as high-demand college campus areas or airport terminal curbsides, are utilized by thousands of passengers per hour during peak periods using various modes of ground transportation such as private vehicles, taxis, TNC vehicles, buses, and shuttles. These areas are designated for short-term pickup/dropoff within minutes. The Americans with Disabilities Act (ADA) requires at least one van accessible space every 25 parking spaces, and at least one passenger loading zone in every 100 ft of loading zone space ( 15 ). The designs in this study follow all ADA standards ( 16 ) and ensure accessibility. Federal ( 17 ) and local parking design standards, including St. Louis ( 18 ), Kansas City ( 19 ), and Columbia ( 20 ), Missouri, were used for developing the physical designs.
The physical designs in this study are for a campus area but were based on two common airport terminal curb designs: angled stalls and traditional parallel curbside parking. Both designs share three similar features: a passenger waiting area, a passenger loading area, and a through lane separating the waiting and loading areas. In both designs, the waiting and loading areas are connected by a crosswalk spanning the through lane in the center of the area. The summary of design features is shown in Table 1.
Summary of Physical Design Features
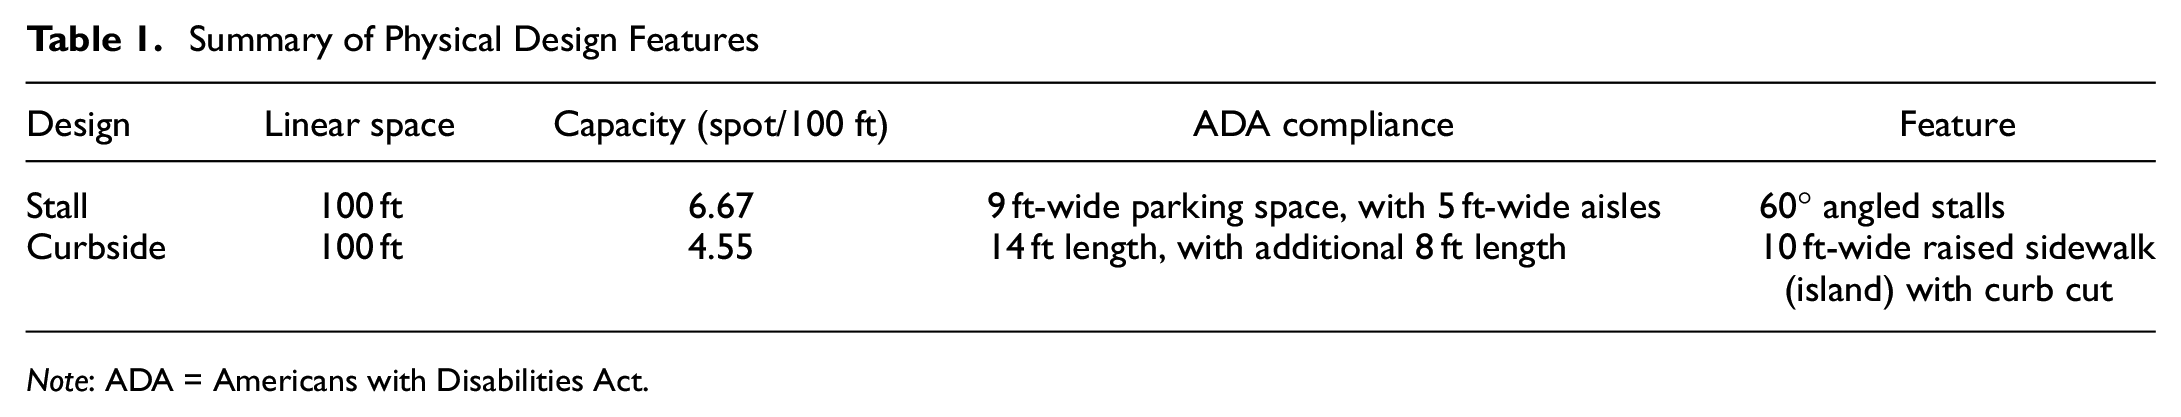
Note: ADA = Americans with Disabilities Act.
The angled stall design is utilized in major airports, such as St. Louis Lambert Airport (STL). Based on the current geometry of STL, the design was adjusted as shown in Figure 1. The new design features a loading area that allows vehicles to exit the main road by diverging from the main traffic flow into a maneuvering lane before pulling into clearly defined angled parking stalls. On loading/unloading, the vehicles can pull forward into the through lane to exit without backing up, to avoid additional conflict and improve efficiency during periods of high demand. Vehicles follow this exit lane until it ends, then merge back into traffic on the main road. In addition to the crosswalk connecting the waiting and loading areas, another crosswalk parallel to the through lane and spanning the length of the loading area is located in front of the parking spaces, giving pedestrians the right-of-way throughout the loading area.
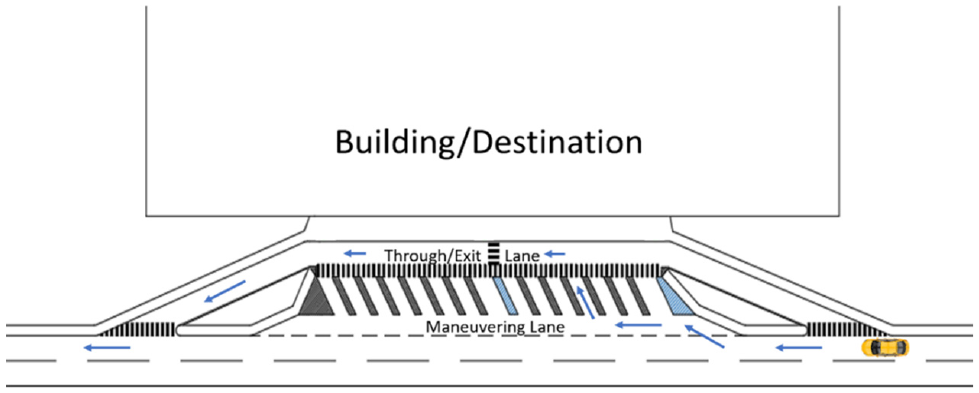
Pickup/dropoff area with angled parking stalls.
Parking design standards from three Missouri cities and the United States Department of Transportation (U.S. DOT) allow for a variety of stall angles. To balance ease of maneuvering with capacity in the area, the stalls were oriented at a 60° angle, allowing vehicles to enter and exit the stalls easily. Standard angled stalls are 9 ft wide, while ADA requires additional 5 ft-wide access aisles. In this design, all spaces are accessible, resulting in a capacity of 6.67 parking spaces per 100 linear feet of curb. The capacity could be enlarged by reducing the number of van accessible stalls. Therefore, the maximum capacity of the loading area would depend on the number of parking spaces that are required to be van accessible, which varies based on local ordinances.
In traditional curbside design (Figure 2), the loading area features a 10 ft-wide raised sidewalk with curb cut that acts as an island between the through lane and the parking lane. Passengers use this island for loading and unloading. Vehicles enter the area via the maneuvering lane, then pull into the parking lane, parallel to the loading island. Once loaded or unloaded, the vehicles pull back into the maneuvering lane before re-entering traffic on the main road. In this design, the through lane acts as an alternative route for through traffic during peak hours.
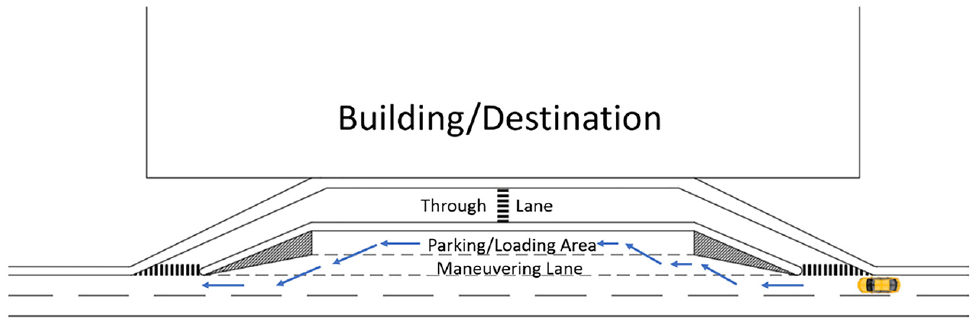
Pickup/dropoff area with traditional curbside.
In this design, the parking lane is 14 ft wide, which accommodates most types of vehicles and complies with all design standards. While the length of a parking space for parking parallel to the curb varied by the municipalities examined, the largest minimum required length was found to be 22 ft for ADA standards. Using this length, the capacity of this design is 4.55 vehicles per 100 linear feet of curb. The capacity could be higher when less accessible space is needed.
A safety concern with both designs is that passengers would focus on walking straight to the TNC vehicle without properly using the crosswalk. To improve passenger behavior, a signage package compliant with the Manual on Uniform Traffic Control Devices (MUTCD) ( 21 ) was developed. The signage, including a MUTCD-standard “No Crossing” sign with a “Use Crosswalk” placard (Figure 3), was directed at pedestrians in the waiting area, located every 50 ft on either side of the crosswalk, indicating the location of the crosswalk. The intent of this signage is to inform pedestrians to cross the through lane using the crosswalk, while helping them to locate and navigate to the crosswalk.
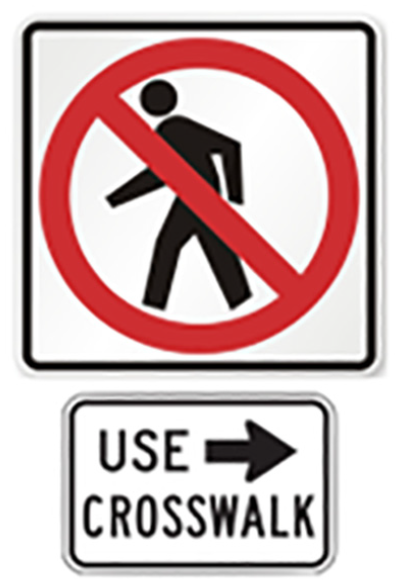
“No Crossing” sign with “Use Crosswalk” placard.
Additionally, a sign that indicates pedestrians should not cross into the loading area until their ride has arrived (Figure 4) was placed at the beginning of the crosswalk. This sign aims to limit the number of pedestrian crossings, and limit the time pedestrians spend dwelling in the loading area to minimize pedestrian congestion and potential pedestrian–vehicle conflicts. This sign was developed using guidelines from MUTCD ( 21 ). The sign is regulatory, therefore, the shape (rectangular) and colors (white base with black border and lettering) of the sign were selected using Tables 2A-4 and 2A-5 from the MUTCD, and the dimensions were selected based on sign R9-2 found in Table 2B-1 for the similar purpose of informing pedestrians of crossing procedures. The dimensions are 18 in. high by 12 in. wide. All font and spacing used were compliant with MUTCD.
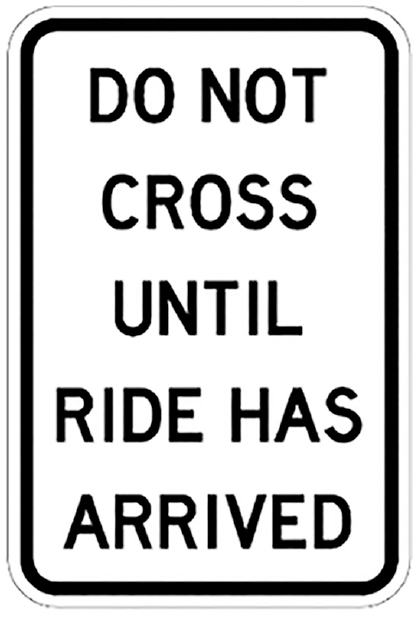
Proposed sign, compliant with Manual on Uniform Traffic Control Devices (MUTCD).
As designated TNC pickup/dropoff areas are not common outside the airport setting, it was assumed that passengers would be unfamiliar with the procedures for using the areas in the campus setting on implementation. An education package was designed to provide clear and concise steps so that users could easily understand and follow the instruction. The education script narrated was: Please wait on the sidewalk connected to the building until your ride has arrived in the loading area. Upon notification that your ride has arrived, locate your ride and begin navigating to it. Be sure to first navigate to the crosswalk provided in the center of the pickup area and use it to cross safely into the loading area.
Simulator Study
The designs were tested using ZouSim transportation simulators, a multi-modal simulator suite developed by the University of Missouri. ZouSim consists of six transportation modes: car, truck, pedestrian, bicycle, wheelchair, and e-scooter, and the six modes are federated via a server. In this study, the ZouPed pedestrian simulator and ZouWheel wheelchair simulator were utilized. ZouPed utilized triple 120 in. screens providing a 180° field of view, while ZouWheel used two 120 in. screens providing a 120° horizontal and a 40° vertical field of view.
ZouPed is based on a curved manual treadmill, which is motorless and allows human subjects to walk freely in the simulator. It is equipped with a motion capture mechanism that is attached to a human subject’s lower back, recording their motion. This mechanism features an MPU-9250 nine-axis motion tracking multi-chip module (MCM) connected to a computer via USB. The MPU-9250 MCM consists of three sensors: a three-axis accelerometer, a three-axis gyroscope, and a three-axis magnetometer. The accelerometer captures forward walking (translational) motion, while the gyroscope and magnetometer capture rotational motion. The gyroscope reports rotation relative to the previous orientation of the device, while the magnetometer reports the orientation of the device relative to the earth’s magnetic field and true north. Figure 5 shows the ZouPed setup as an example of the experiment scenario including the motion capture mechanism on the lower back of the human subject.
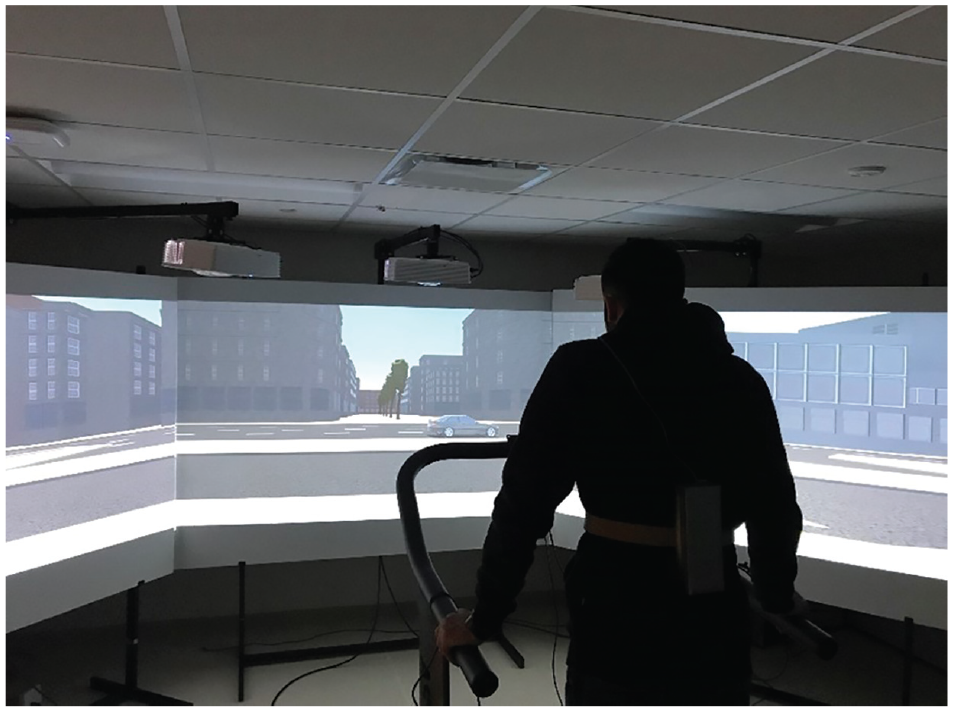
ZouPed pedestrian simulator.
The base of the ZouWheel wheelchair simulator is a motorized wheelchair, with the motor disabled and wheels locked in place. The original wheelchair controls were removed and replaced with a joystick connected to a computer, allowing human subjects to navigate throughout the virtual environment. Figure 6 shows the ZouWheel setup and an example of the experiment scenario.
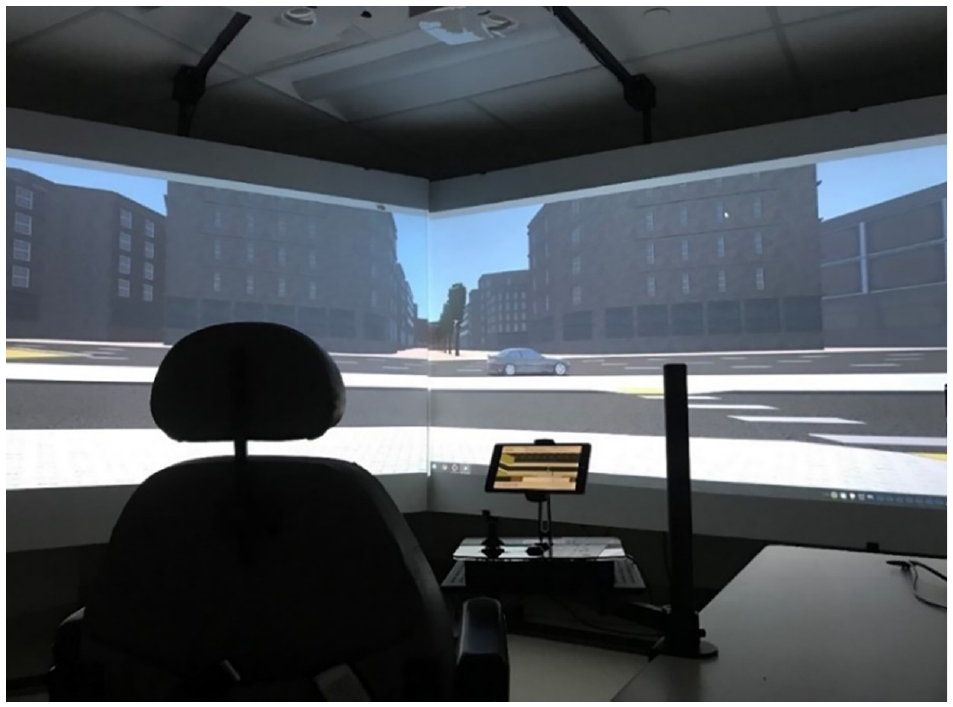
ZouWheel wheelchair simulator scenario.
The human subject experiment was designed as a college campus environment using the virtual reality engine, Unity 3D. The pickup/dropoff areas were created in AutoCAD and polished in Sketchup, then imported to Unity. In the scenarios, one vehicle was used to simulate the subject’s ride while other vehicles were created as background traffic. For the ride vehicle, a sedan was used in ZouPed scenarios and a van was used in ZouWheel to replicate an accessible van, as shown in Figure 7. The color of the vehicles varied by scenario so that the participants in this study would not grow accustomed to the vehicle picking them up. A TNC mobile app, called ZouRide, was utilized during the test to provide the participants with notifications of arrival status, and to display vehicle information, including vehicle type and color, to help them identify their ride, as is common in TNC apps.
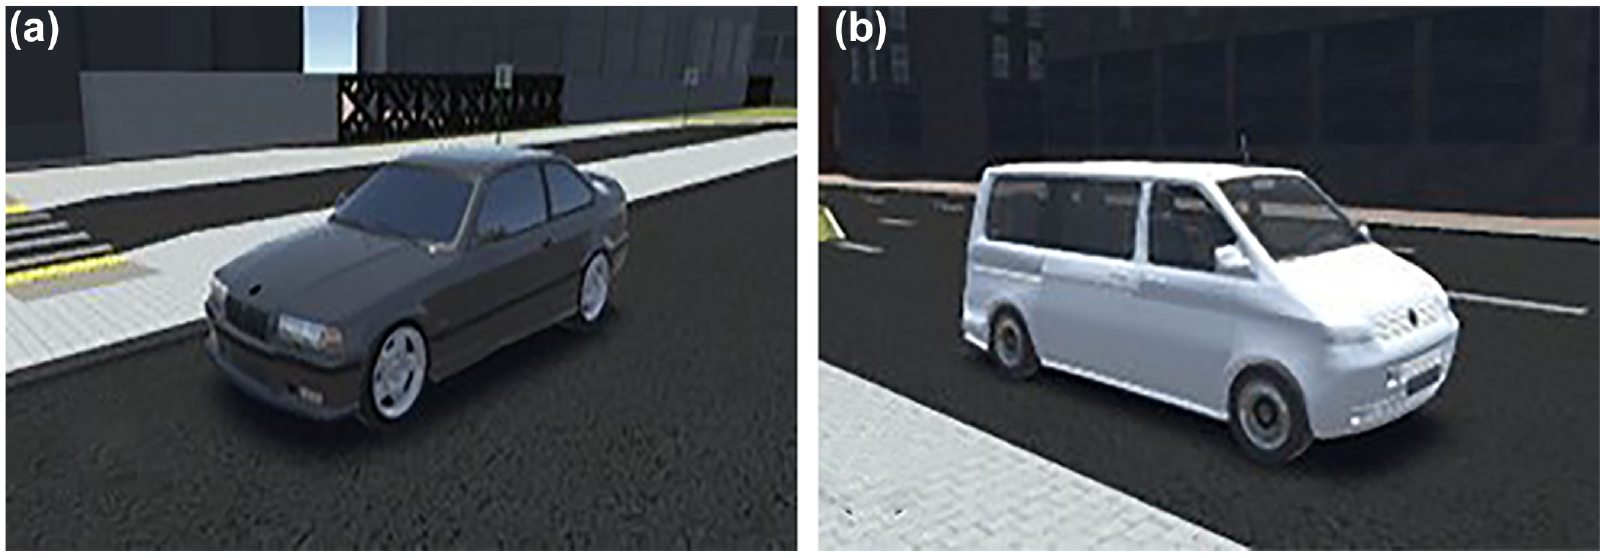
Vehicle models used in scenarios: (a) sedan model, and (b) van model.
Participants were recruited for the pedestrian and wheelchair simulator experiments. Recruitment was open to the public and focused on the 18 to 29 age demographic representative of a college campus, as research indicates that TNC service usage is more common among this age group ( 1 ). To ensure the statistical significance of the simulator study results ( 22 ), 31 people were recruited. Each experienced all 12 different simulator scenarios, as listed in Table 2. All 12 scenarios were set in the same virtual campus environment, but varied in the physical design of the pickup/dropoff area, signage, and education. The order of tests was randomized within each set to reduce sequence bias ( 23 ). Additionally, the final parking location of the ride was randomized at either one-quarter or three-quarters of the distance from the beginning of the pickup/dropoff area so that participants would not be able to predict the location of the ride before arrival. The participants were educated in the use of the crosswalk, and instructed to wait until the arrival of their ride before crossing, on completion of the first set of scenarios. An eye tracker was utilized to track the participants’ eye movements to determine where they were looking during the simulator trials.
Simulator Scenarios
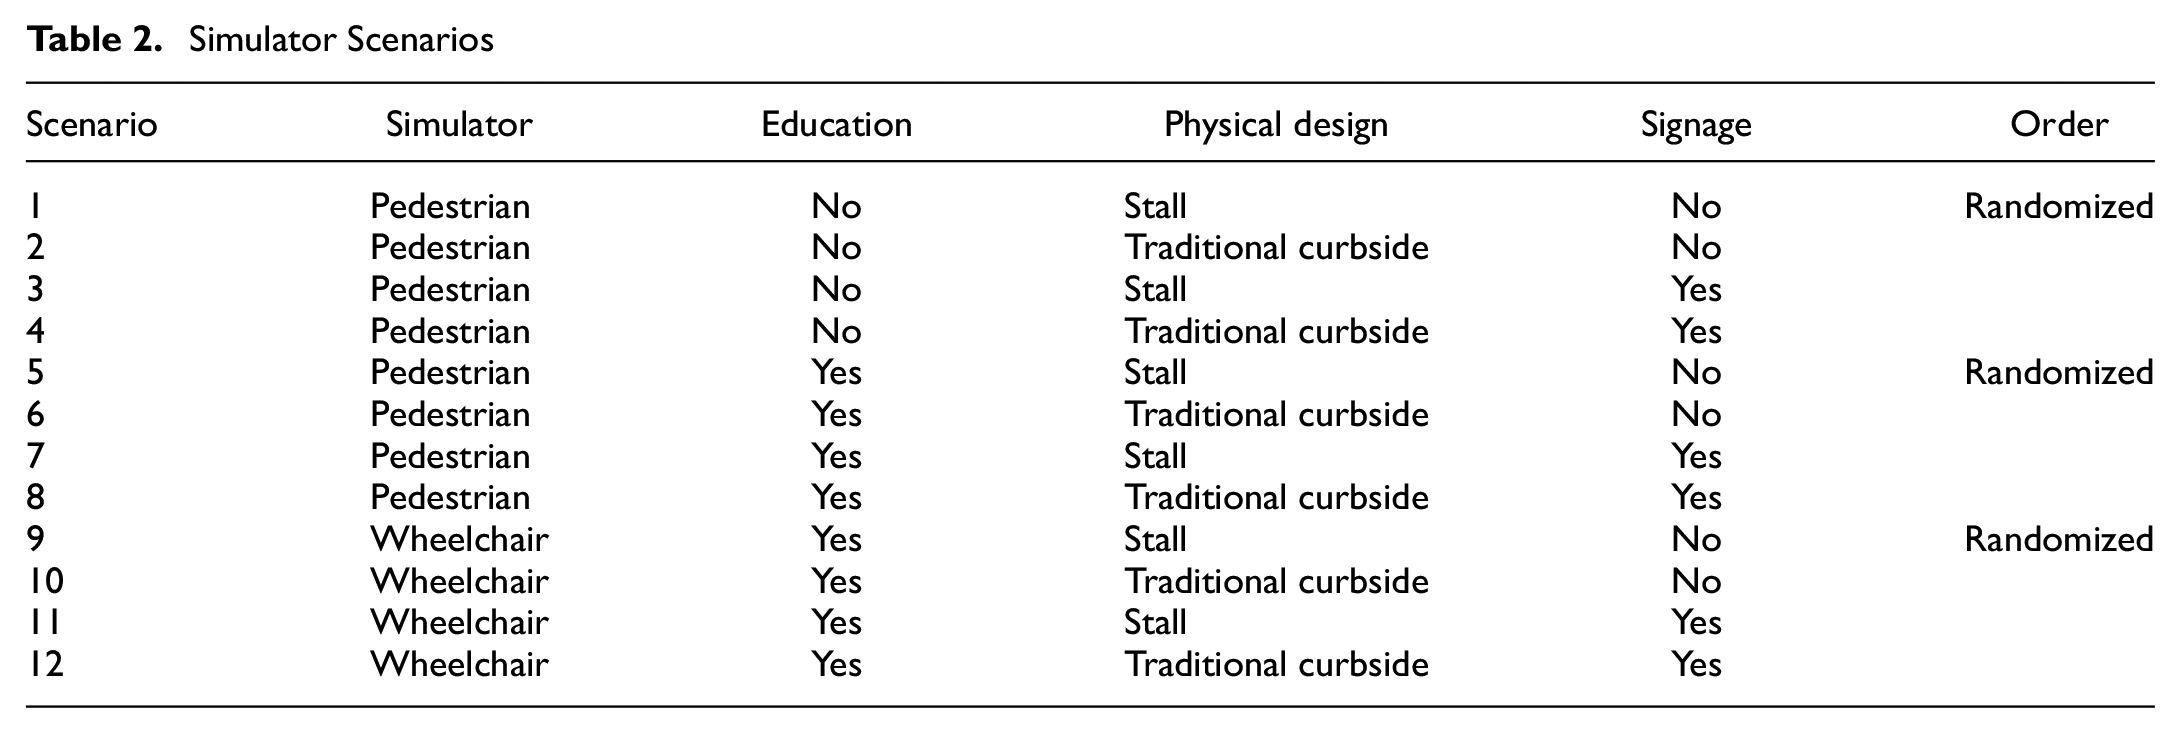
In the simulation, the participants started from the building, and were expected to stay at the passenger waiting area until their ride arrived. When the vehicle arrived, participants would walk over the crosswalk to meet their ride at the waiting area to be picked up. During the waiting period, participants would receive notification from the app twice: once estimating time to arrival at the pickup location and the other notifying the arrival of the ride.
During the simulator trials, measures of effectiveness (MOEs) were recorded, including videos of the participants’ actions and the eye-tracker view. Four MOEs were captured to assess the safety, efficiency, and accessibility of the designs: time of crossing (seconds), vehicle waiting time (seconds), deviation from crosswalk (feet), and the percentage of participants that used the crosswalk. The time of crossing was recorded as the time at which a participant entered the crosswalk or street to cross from the waiting area into the loading area. It is preferrable for passengers to wait for the pickup vehicle to arrive first before they cross into the loading area. The vehicle waiting time was determined by subtracting the predetermined time at which the vehicle parked in the loading area from the observed time at which the participant arrived at the vehicle. Deviation from the crosswalk was the distance from the crosswalk that participants crossed when entering the loading area if they did not use the crosswalk. Finally, whether each participant used the provided crosswalk or not was recorded and the total percentage of participants that used the crosswalk was determined.
Post-Simulator Survey
A post-simulator survey was conducted to obtain stated preference and qualitative feedback. The 21-question survey asked the participants about their frequency and habits of TNC usage, rating of feature effectiveness, rating and preference of designs, simulator fidelity, desirability of AVs or/and EVs, and demographic information, followed by a standard simulator sickness questionnaire (SSQ) ( 24 ).
Microsimulation
The simulator study focused on human behavior and the design of TNC pickup/dropoff areas from the perspective of pedestrian and wheelchair users. To control the environment and isolate the effect of each testing factor, there were no other pedestrians in the virtual environment, and the participant was the only passenger in the scenarios. In reality, human behavior could be influenced by the presence of other passengers and TNC vehicles in the area. When demand increases, safety and capacity features may change in response to high traffic volume; thus, a follow-up microsimulation study was conducted to analyze the designs as a function of capacity and demand.
PTV VISSIM software was used to model the designs and simulate different traffic conditions under various volumes. The network implementation involved network design, route decision making, and vehicle inputs. Within the 180 linear feet of parking length, the 60° angled stalls had 13 parking spots, with one entrance and one exit. The curbside design had eight parking spots and had one entrance and one exit. Vehicle waiting time, main lane speed, and through lane speed were examined in 4,500 s of simulation, with the first 900 s being the warm-up period and data from within this period were discarded.
Trajectory files generated from VISSIM were analyzed by the SSAM software developed by the FHWA ( 25 ). SSAM analyzes interactions among vehicles and identifies conflict events. Conflict events are categorized based on safety measures such as time to collision, declaration rate, and speed. The results were displayed in conflict maps and vehicle trajectory curves.
Results
Simulator Results
The mean of the MOEs were calculated for all participants, along with the differences between the means for different designs. Student t-test was used to examine differences between means, and Cohen’s d was used to indicate effect size. Cohen’s d value between 0.2 and 0.5 indicates a small effect size, a value between 0.5 and 0.8 indicates medium effect size, and a value greater than 0.8 indicates a large effect size ( 26 ).
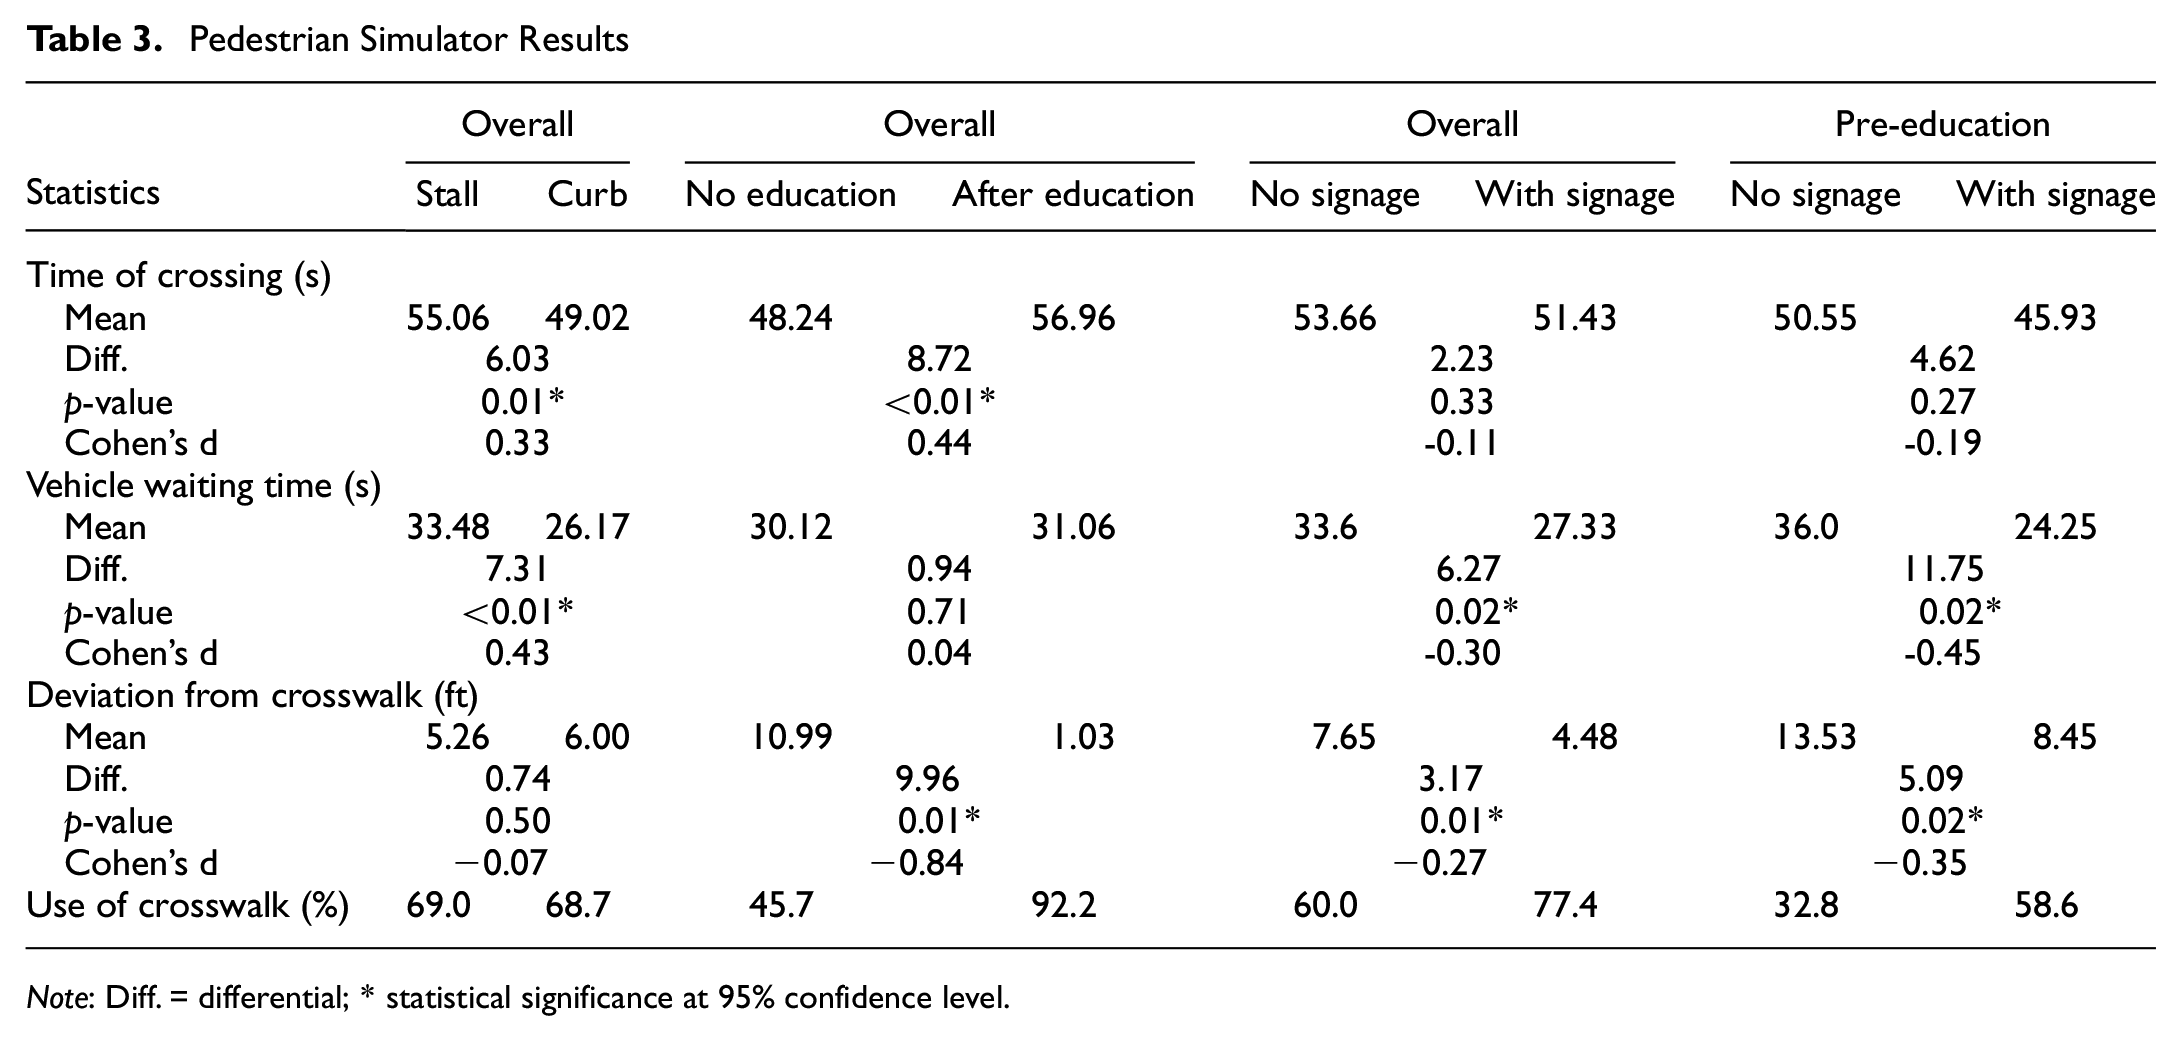
Table 3 shows the results of ZouPed simulator trials. The mean crossing time for angled stalls was longer (later) than for traditional curbside design, with a 6.03 s difference (p = 0.01) being a small effect size. It appears that the curbside area is more inviting for passengers to wait even before a vehicle has arrived. Vehicle waiting time for stall design was longer as well, with a 7.31 s difference (p < 0.01) being a small effect size. These two results are possibly correlated since a later crossing would result in arriving at the vehicle later. However, the physical designs did not result in a significant difference in crosswalk usage, as both deviation from crosswalk and percentage of participants using crosswalk were similar. The stall design was safer as a later crossing may reduce pedestrian congestion at the loading area and decrease the risk of vehicle–pedestrian crashes. The curbside design was more efficient as vehicle waiting time was shorter; however, the result was based on the simulator scenario involving only one TNC vehicle and one passenger, and the efficiency would change if demand were to increase. Higher demand scenarios were examined using microsimulation.
Pedestrian Simulator Results
Note: Diff. = differential; * statistical significance at 95% confidence level.
Education significantly delayed the participants’ crossing time (8.72 s delay), and significantly improved the usage of the crosswalk (from 45.7% to 92.2%), which resulted in significant safety improvements. The education script asked passengers to wait for the arrival of the ride before crossing and to use the crosswalk. The signage had significant impacts on both safety and efficiency, as signage significantly increased the usage of crosswalk and reduced vehicle waiting time, even when education was not delivered. Therefore, signage and education are highly recommended as part of TNC pickup/dropoff area operations.
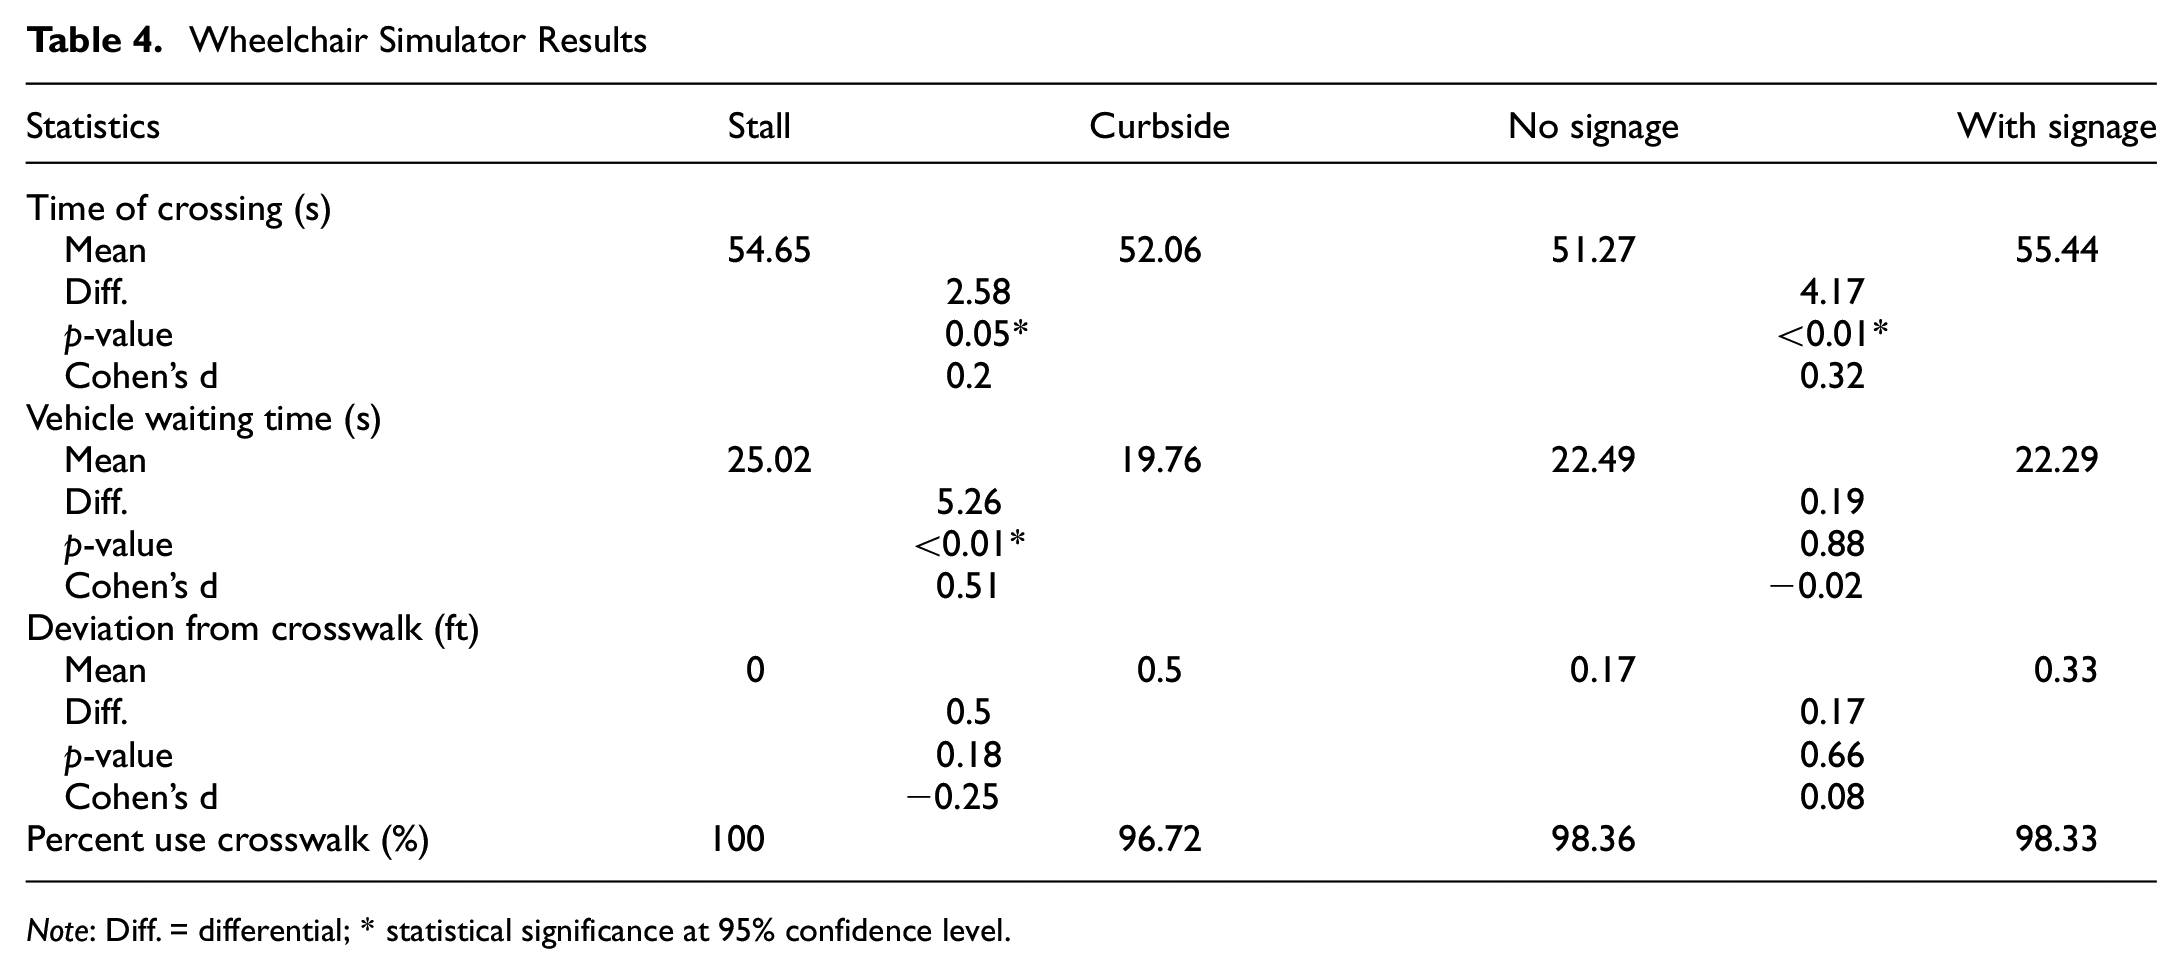
The wheelchair simulator was used to rate the accessibility of the pickup/dropoff areas. As indicated in Table 4, stall design had 2.58 s later time of crossing (p = 0.05) than curbside design, with small effect size. The vehicle waiting time for the stall design was 5.26 s longer than curbside (p < 0.01, medium effect size). There is no statistically significant difference in deviation from crosswalk and percentage using crosswalk between the two designs.
Wheelchair Simulator Results
Note: Diff. = differential; * statistical significance at 95% confidence level.
The signage delayed the participants’ crossing by 4.17 s (p = 0.01, small effect size), indicating a potential decrease in passenger–vehicle conflict and an enhancement in safety. For other MOEs, no statistical significance was seen.
The time of crossing and vehicle waiting time of the two physical designs in ZouWheel scenarios was consistent with ZouPed results. Crosswalk usage in the two physical designs and impacts of signage were not consistent, as all ZouWheel scenarios were completed after education was provided. Throughout all the scenarios in ZouWheel, crosswalk usage was consistently high, as those scenarios were completed after education. Signage was a physical manifestation of the education, and its own effects may have been affected by the education.
In addition to data collected by ZouPed and ZouWheel simulator tests, eye tracking data were obtained during the trials, recording the number of times each participant looked or glanced at the mobile app and the signage. Physiological differences and use of eyeglasses among the participants meant that errors occurred, and eye tracking data from only 15 participants was valid.
Eye tracking data were used to compare the two physical designs. If participants looked at the app or signage more frequently for one design, it could be an indication of performance concerns. For example, more frequent glances at signage could indicate that the procedures for that design were less clear. Further, more frequent glances at the mobile app in one design could be an indicator that it was more difficult for the participant to identify their ride in that design.
Eye tracking results are listed in Table 5. Glance frequencies at app and signage were similar for stall and curbside, indicating that stall and curbside designs were similarly understandable. Education did not appear to have significant impacts on the number of glances made at either the mobile app or signage. On average, participants glanced at the mobile app 6.55 times during each scenario, and only 3.55 times at the signage when it was present. More frequent glances were related to later crossing time and longer vehicle waiting time for both app and signage. However, fewer glances were related to a higher percentage of crosswalk usage. It may be that participants who glanced at signage more frequently did so because they did not understand the signage, while more glances at the app was related to higher percentage of crosswalk usage that occurred because of careful reading and better understanding of the app information.
Eye Tracking Results

Note: Diff. = differential.
Post-Simulator Survey Results
The demographics of the participants were: over 80% being 18 to 25 years old and 87.1% being urban residents; the sample was representative of the target campus population. Gender was approximately balanced between male (54.8%) and female (45.2%). Their reported experience of TNC service was: 25.8% using TNC weekly, 67.7% using it occasionally (monthly or less), and 6.5% never using TNC. The low frequency of TNC usage compared with larger metropolitan areas was because Columbia is a small urban area with a population of approximately 120,000 and with relatively low density. Over 83.8% of the participants commonly met their rides at street curbside, and only 9.7% indicated that they typically met TNC rides at designated pickup/dropoff areas. Around 77.4% had experience with using designated pickup/dropoff areas, and around 45.2% had experienced it for TNC service.
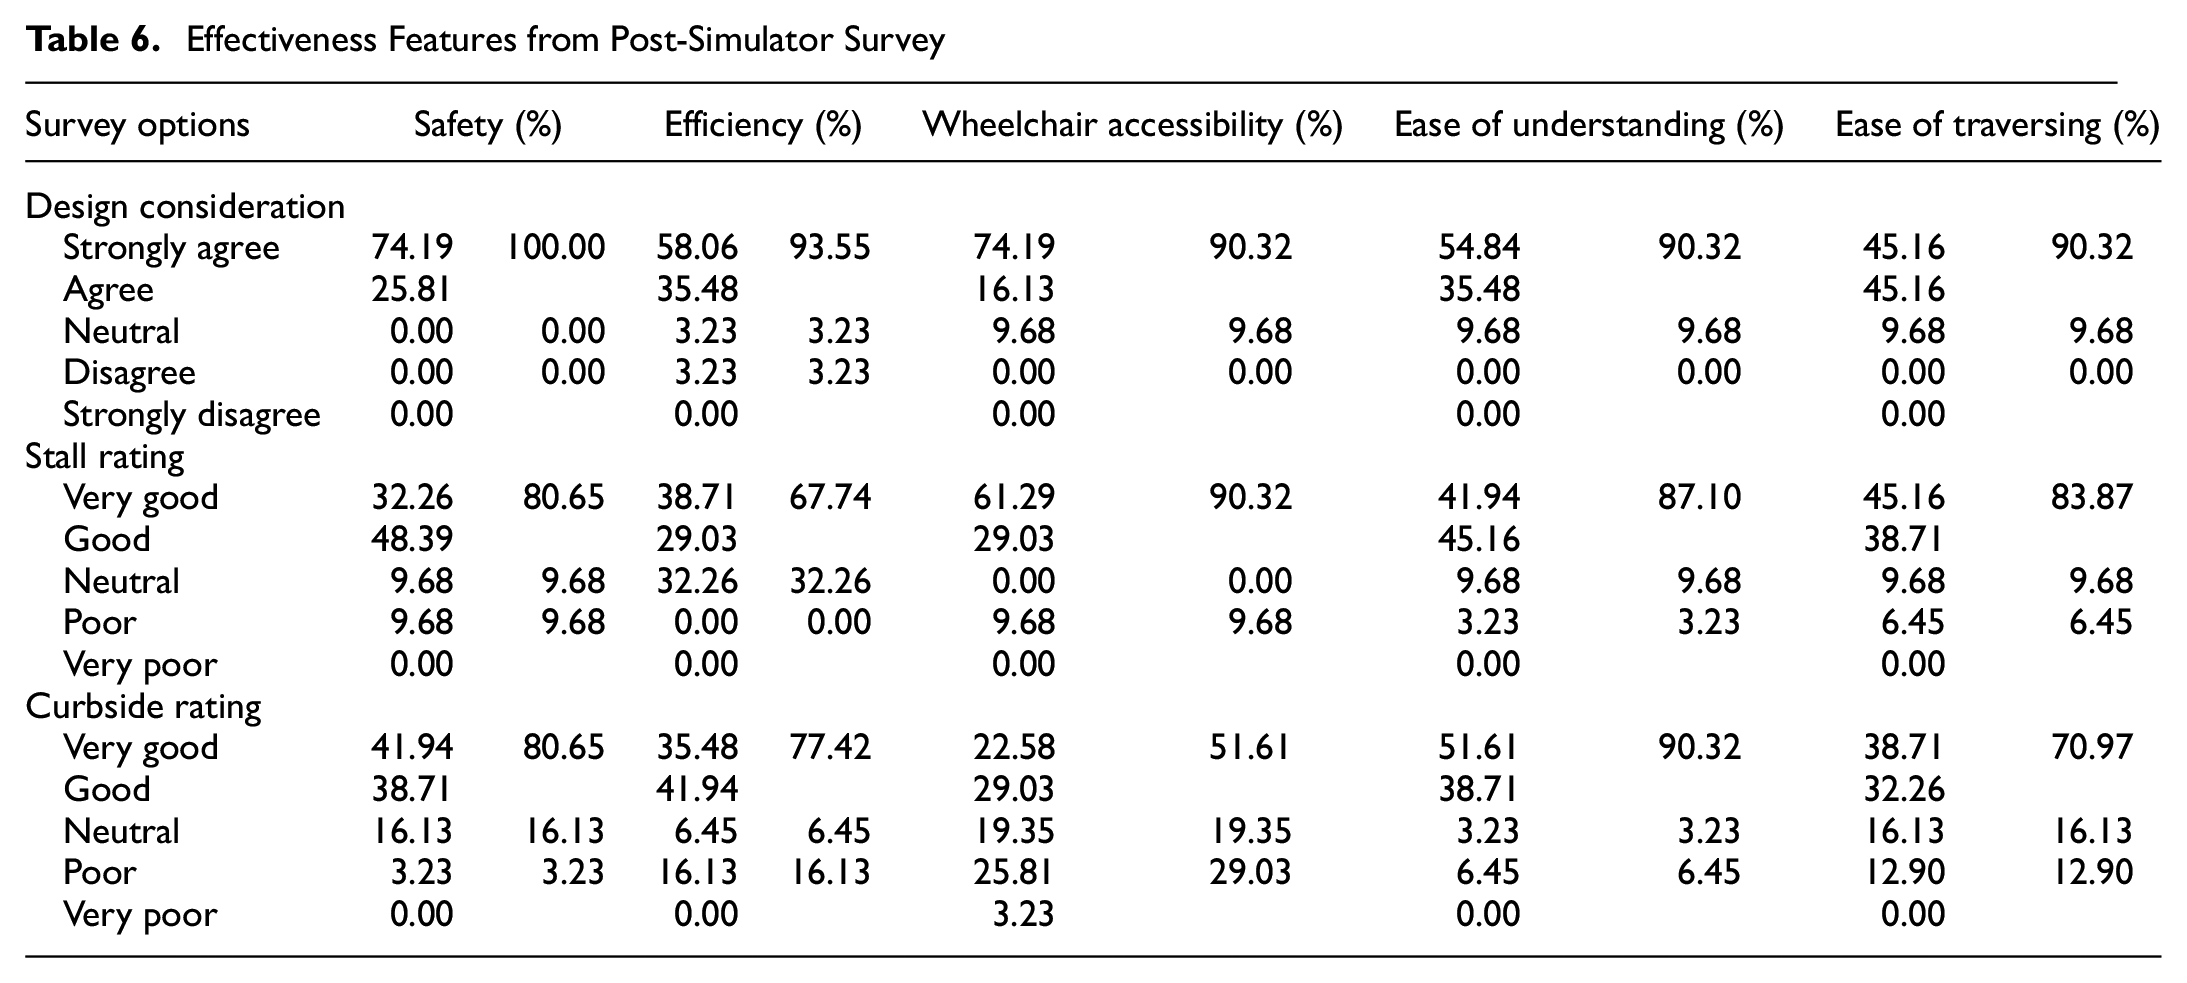
The participants were asked about the effectiveness of the stall versus the curbside design using several measures. As shown in Table 6, a large majority agreed that safety, efficiency, wheelchair accessibility, ease of understanding, and ease of traversing should be taken into consideration in design. Safety was rated similarly for both stall and curbside, as 80.7% rated both as good or very good. For efficiency, more participants rated curbside design (77.4%) as good or very good, compared with stall design (67.7%). Stall design had much higher rating in wheelchair accessibility, with over 90.3% rating it as good or very good, while only 51.6% rated curbside design as accessible. The good or very good ratings for ease of understanding were similar, with 87.1% for stall and 90.3% for curbside. For ease of traversing, 83.9% of participants rated stall as easy compared with 71.0% for curbside. In summary, safety and ease of understanding were similar for both designs. Stall was more accessible and easier to traverse, while curbside was more efficient and easier to understand. The preferences of the participants were similar, with 48.4% preferring stall and 51.6% preferring curbside design. Most of the participants agreed that signage (93.6%) and education (90.3%) were effective.
Effectiveness Features from Post-Simulator Survey
Additionally, participants were asked about their likelihood of using a TNC service if AVs or EVs were to replace current vehicle types. Only 29.0% stated that they would be more likely to use a TNC service if current vehicle types were replaced by AVs, and 41.9% stated “less likely,” which could be an indicator of a lack of understanding or acceptance of AVs. Participants were in favor of EVs, however, as 64.5% claimed that they would be more likely to use TNCs if EVs were used, which indicates that sustainable vehicles are preferred. Over 77.4% of participants agreed on the fidelity of the simulator and that they were able to move freely in the virtual environment. Most participants (over 90%) did not experience symptoms of simulator sickness, according to results from the SSQ.
Microsimulation Results
The microsimulation results indicated that stall design had the higher capacity, at 500 vehicles per hour, whereas the curbside design had capacity for 350 vehicles per hour. Pedestrian demand corresponds to the vehicular demand as each rider is linked to a vehicle. Under saturated loading conditions, the stall design had less variance than curbside design, as shown in Figure 8.
Capacities of designs: (a) stall design, and (b) curbside design.
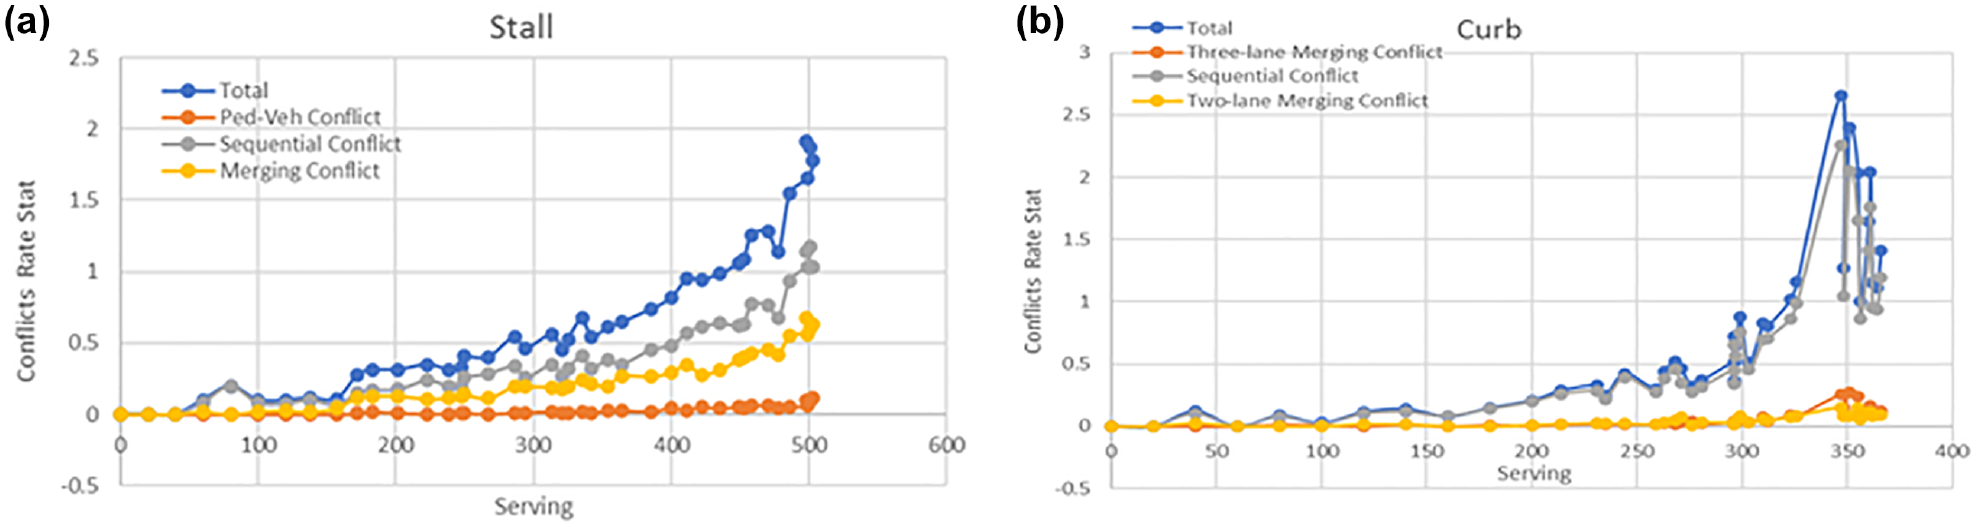
With regard to safety, both designs had similar conflict rates when demand was low. SSAM results are shown in Figure 9. Sequential conflicts refer to the forward conflicts when vehicles were following each other without changing lanes, while merging conflicts refer to the conflicts caused by lane change. At 300 loads (i.e., rides), the curbside design had more sequential conflicts and a large variance. Stall design generally had more merging conflicts, and the trend slope became steeper after around 450 loads. Overall, curbside design had more total conflicts after 300 loads, with a faster rate of increase.
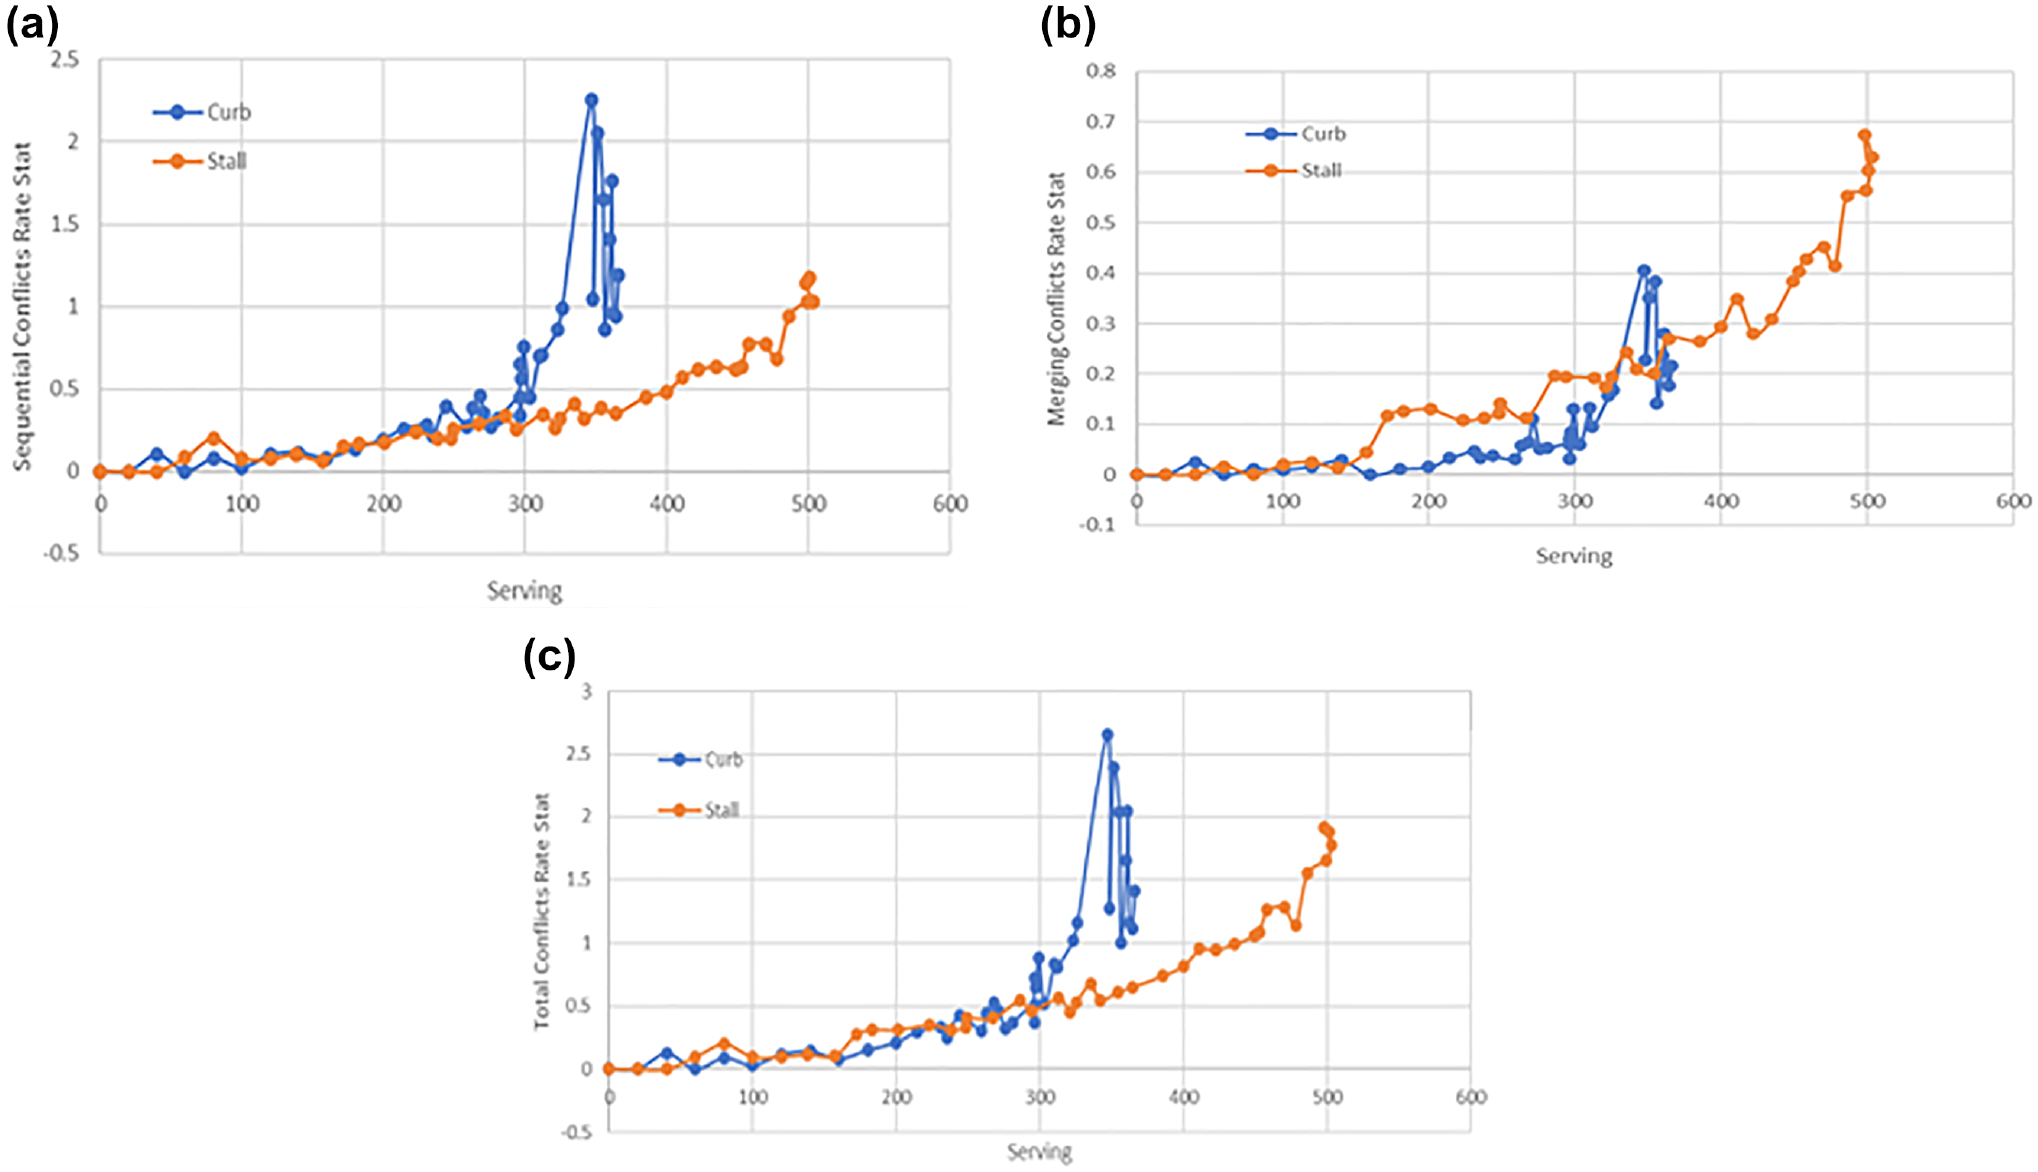
Conflict status of designs: (a) sequential conflicts, (b) merging conflicts, and (c) total conflicts.
In summary, the microsimulation results show that when the parking demand is low (fewer than 300 vehicles per hour), both stall and curbside design are comparable. When the demand is higher than 300 loads, stall design has higher efficiency and better safety. Note that an assumption was made for the curbside design to provide the maximum length for all spaces even though this length could vary by jurisdiction and by the number of desired accessible spaces.
Discussion and Conclusion
This study addressed the implementation of TNC pickup/dropoff areas, as the population of users continues to grow ( 1 ). In the post-simulator survey, 64% of participants indicated that they would be more likely to use TNC services if EVs were utilized exclusively, matching with literature on the rapid growth of EV usage ( 1 , 3 ). This will result in a shift in transportation mode choice, which will need to be facilitated through infrastructure changes such as implementing designated pickup/dropoff areas.
Based on U.S. federal and local standards, an angled stall and traditional curbside pickup/dropoff areas were designed, and were assessed via simulator and microsimulation studies. The safety, efficiency, accessibility, and capacity of the designs were analyzed from human behavioral and/or vehicle dynamics perspectives. The results from the simulator study indicate that both angled stall design and traditional curbside design are viable for ridesharing pickup/dropoff areas, with neither option appearing to be clearly superior. Both designs performed similarly on safety. The apparent tradeoffs between the two designs are that the stall design appeared to be more easily traversed and more accessible for disabled users, while the curbside design was found to be slightly more efficient than the stall design when there was only one passenger and one TNC vehicle. However, microsimulation analysis of design characteristics indicated that the stall design was more efficient because it had higher capacity (500 vehicles per hour) than the curbside design (350 vehicles per hour). Under high demand (over 300 loads), the stall had fewer conflicts and better safety, but the safety characteristics were similar under lower demands. In summary, the simulator and microsimulation results imply that the stall design is safer under high demand, more efficient under high demand, easier to traverse, and more easily accessible. Under low demand, the designs were comparable in safety and efficiency, although the individual simulator scenario showed earlier crossing times for the curbside design. The less time pedestrians spend in the loading area, the less pedestrian congestion and less exposure to vehicles occur.
The results of this study also indicate that implementing additional design components of signage and education can improve safety and efficiency for both physical designs. Educating users of the area was effective in improving safety. Education is a low-cost solution compared with using channelization to restrict pedestrian movements. Instructional signage in the pickup/dropoff areas proved to be effective in improving both safety and efficiency, even before education was provided, leading to the conclusion that signage is an important component of the overall design and should be included in any TNC pickup/dropoff area design.
Only four factors were investigated in this study: mode, geometric design, education, and signage. There are many other possible issues that could be investigated in future studies. One is to investigate other geometric design configurations, including the addition of more crosswalks to reduce delay while maintaining safety. Another is to investigate the use of traffic calming devices. A third issue is to investigate the additional functionality of TNC apps such as displaying the stall number where the TNC vehicle will be parked for pickup.
Footnotes
Acknowledgements
The authors appreciate Zhu Qing for his help with experiment development, and Ali Alhassar, Aimee Cobb, Nicholas Cunningham, Joe Reneker, and Qingzhong Zeng, for their assistance in simulator trial hosting, data processing, and/or report preparation.
Author Contributions
The authors confirm contribution to the paper as follows: study conception and design: J. Kaltenbronn, P. Jin, X. Shu, C. Sun, S. Zhang; data collection: J. Kaltenbronn, P. Jin, X. Shu; analysis and interpretation of results: J. Kaltenbronn, P. Jin, X. Shu, C. Sun, S. Zhang; draft manuscript preparation: J. Kaltenbronn, C. Sun, S. Zhang. All authors reviewed the results and approved the final version of the manuscript.
Declaration of Conflicting Interests
The author(s) declared no potential conflicts of interest with respect to the research, authorship, and/or publication of this article.
Funding
The author(s) received no financial support for the research, authorship, and/or publication of this article.