
Abstract
Automatic speed-enforcement cameras are considered a highly reliable technology that produces returns on investment through reduced social and economic costs associated with traffic crashes. Drawing from open data and behavioral theory, we test whether fixed speed cameras in urban areas, while reducing traffic crashes, induce compensatory behaviors such as speeding downstream—referred to as the kangaroo effect. We use a quasi-experimental research design that compares intervention and control segments before and after installing 90 fixed speed cameras in selected arterial road segments of Bogotá, followed by a confirmatory spatial statistical analysis. Our statistical tests strongly suggest that fixed speed cameras induce compensatory behaviors, noticeably reducing the overall effect of these investments. Despite this finding, fixed speed cameras in Bogotá have satisfactory results for reducing fatal and non-fatal injuries overall, and more so for pedestrians and motorcyclists.
Personal injuries and human fatalities resulting from traffic collisions are among the most significant public health problems in the modern world. According to the World Health Organization, approximately 1.3 million people die yearly from road traffic crashes, and often more than 20 million suffer severe injuries ( 1 ). More than 90% of road traffic deaths occur in low- and middle-income countries ( 1 ). The figures are particularly problematic in low-income countries with increasingly high urbanization and private motorization rates, including a rapid increase in motorcycle use during the past decade, exacerbating the traffic-related injuries and death epidemic in rapidly growing cities in the global South.
Excessive speed is one of the primary risk factors for fatal and non-fatal road collisions. Higher speeds beget a greater risk of crashing and more severe injuries for automobile occupants and vulnerable road users such as pedestrians, cyclists and motorcyclists. The overwhelming consensus on the potential of smart sensors and information technologies to modify road users’ behavior coincides with the United Nations General Assembly’s ambitious target of halving the global number of deaths and injuries from traffic crashes by 2030. Bogotá responded to the challenge by including in its road safety plan a speed-management program with provisions to invest in sensor technologies that automate traffic law enforcement.
Bogotá’s speed-management program aims to help reach the city’s goal of reducing the number of road crash victims by 3.5% annually ( 2 ). The program started in October 2019 by installing automated speed-enforcement cameras at 40 fixed points critical for traffic collisions. By May 2020, 90 fixed speed cameras were operating on selected arterial roads. Between October 2019 and May 2020, offenders were given non-punitive informative notices. As of May 25, 2020, the imposition of sanctioning subpoenas began. The speed limit in the arterial corridors was also reduced from 60 to 50 km/h, except for four corridors that temporarily maintained a 60 km/h limit while the signage process was underway.
As in other parts of the world, the installation of speed cameras in Bogotá has not been exempted from controversy. Because national law mandates local authorities to inform road users about the proximity of cameras, roadway warning signs need to be installed, potentially reducing the overall policy intervention effectiveness ( 3 ). Furthermore, there has been little general awareness of the importance of lowering speeds to proper limits, and popular opinions tend to focus on how speed cameras are “unnecessarily” punitive, a source of revenue for a few business makers, and unconstitutional because the de facto infractor is the vehicle’s owner, regardless of who is driving ( 4 ). In this urban policy context, this paper addresses one fundamental question: Do speed-enforcement cameras reduce serious road traffic crashes, injuries, and deaths?
This paper uses Bogotá’s road safety program to test whether installing automated speed-enforcement fixed cameras reduces crash-related non-fatal and fatal injuries in urban areas. Our work draws from open data, behavioral theory, and a differences-in-differences quasi-experimental research design. Our study also contributes to the academic literature on transportation technology and public health by assessing whether risk compensation or offsetting behaviors are associated with speed-detection cameras and, by doing so, contributes to the academic and policy debate around the extent to which these technologies save lives. The paper closes with policy recommendations to maximize the effectiveness of investments in automated-enforcement speed cameras in cities.
Literature Review
A large and growing body of literature suggests that speed-enforcement cameras effectively reduce vehicle speeds and related traffic crashes and injuries. A systematic review of 35 peer-reviewed academic articles concluded that the impact of speed cameras on traffic-related crashes could be between 8% and 49% ( 5 ). Such an ample range in speed-enforcement cameras’ potential to improve traffic safety is often attributed to at least three factors: type of crash included in the analysis, temporal and spatial dimension of the analysis, and policy context and road typology in which cameras are installed.
Evidence on the effects of speed-enforcement cameras on traffic safety records indicates that the magnitude of their impact is associated with the severity of injuries and pre-intervention crash incidence. A study of the average effects of 28 fixed speed cameras installed on arterial roads in Ankara, Turkey, concluded that such interventions led to a 27% decrease in traffic-related non-fatal injuries and a 50% decrease in fatal injuries within the cameras’ area of influence ( 6 ). Another study about the impact of fixed speed cameras installed on urban arterial roads in Canada found a consistent decrease in all types and severity of crashes of between 14% and 20%, with a higher reduction for more severe crashes ( 7 ). The authors found a higher reduction in segments with more collisions before the implementation of speed cameras, with a decrease ranging from 26% to 31% in those corridors with higher crash rates.
Speed cameras’ effectiveness in reducing traffic-related deaths and injuries has also been associated with road typology and speed limits. In Norway, researchers found a higher decrease in killed and seriously injured than in crashes with no seriously injured victims ( 8 ). Another study of eight speed cameras installed in 22 road segments in Barcelona’s beltway estimated that the measure contributed to a 27% decrease in traffic-related injuries ( 9 ). However, in a follow-up study that assessed the impact of speed cameras on the same beltway and arterial roads in the city, researchers found fewer severe crashes in the beltway but not on arterial roads, with a lower speed limit ( 10 ). In contrast, a study on Belgium’s speed cameras found that locations with a speed limit of 50 km/h outperformed those in segments with a 90 km/h speed limit.
Some studies have also reported on how the effects of speed cameras change over time. Researchers in 2008 investigated the impact of mobile speed cameras installed on highways serving Charlotte, North Carolina ( 11 ). The authors found a 10% decrease on average in treated corridors. This impact was reduced in the second year of pilot implementation. A follow-up piece of research found a significant decline of 15% to 17% in all crashes after the speed cameras pilot from 2004 to 2006 ( 12 ). Researchers also found a 17% to 21% decrease in crashes after 23 months of the pilot implementation and forecasted a slow return to the original crash rate levels.
Empirical evidence also indicates that speed cameras’ efficacy is modified by distance from the intervention sites. The consensus is that as the distance from cameras increases, the size of the effect on speeding and traffic-related crashes decreases—a spillover effect referred to as the halo effect in the literature. For instance, a study that estimates the impacts of fixed automatic speed-enforcement cameras installed in the UK concludes that the cameras’ maximum impact is captured within a 200 m buffer from the device ( 13 ). Speed cameras were installed in various administrative district areas across the UK, including London. The authors found that the impact on the number of personal injury collisions decreased from 28% within a 200 m area of influence to 26% within 500 m and 19% within a 1 km buffer.
The previous evidence is consistent with a study examining the effects of fixed speed cameras installed on highways in Flanders, Belgium, concluding that the reduction of severe crashes is 27% within 250 m of the camera—in comparison, the reduction is 23% for 250 to 500 m ( 14 ). Authors of a study in Cali, Colombia, concluded that fixed speed cameras in the city, besides reducing traffic-related crashes within interventions’ area of influence, also generated positive spillovers captured in control sites ( 3 ). Positive spillovers are consistent with the distance halo-effect hypothesis, which may induce control-site contamination, potentially resulting in underestimating overall policy effectiveness.
In contrast, other scholars’ work suggests motorists may increase their speed downstream of intervention sites, which is linked to an unexpected increase in traffic-related crashes in some road segments. This negative spillover suggests a potential spatiotemporal compensatory behavior called the kangaroo effect. For instance, a study on fixed speed cameras installed on high-speed motorways in Belgium indicates that drivers speed up after passing a speed camera ( 15 ). Nevertheless, a meta-analysis of 15 fixed speed camera studies found that kangaroo driving behaviors are not associated with increased crashes in sections before or after camera sites ( 16 ).
In sum, automated-enforcement speed cameras can potentially reduce traffic crashes. However, the extent to which this is true is also associated with multiple factors. Furthermore, despite the growing interest from urban policymakers and transportation scholars in speed-enforcement cameras, empirical evidence examining how these interventions modify dangerous driving behaviors across space and time is surprisingly limited. This paper contributes to the academic body of literature by estimating the effects of fixed speed-enforcement cameras on traffic-related crashes in Bogotá, Colombia. To the best of our knowledge, this is the first study that focuses on potential compensatory behaviors and time halo effects in urban contexts by road users in a global South city, where motorcycle ownership is growing fast, and digital technologies and Smart City ideals lead traffic management policy.
Methods
We estimated the effects of speed cameras on traffic-related crashes with non-fatal and fatal injuries using a differences-in-differences (diff-in-diff) quasi-experimental research design that emphasized the spatial and temporal dimensions of the outcome studied. Differences-in-differences methods are simple panel-data methods applied to sets of groups, road segments in our case when specific segments are exposed to policy intervention or treatment (e.g., installing speed cameras) and others are not ( 17 ).
Differences-in-differences is a well-established impact-evaluation method, widely used in labor economics, epidemiology, and public policy, that exploits variation in the timing of policies across different locations. Because differences-in-differences-type strategies use repeated observations to control for unobserved omitted factors, it is implied that the estimated effect is unbiased. The underlying assumption here is that unobserved factors, such as changes in the economy or the changes induced by the COVID-19 pandemic, equally affect treatment- and control-group segments.
Data on speed camera fixed locations, traffic-related collisions, and the road network were used for the analyses. Data on speed camera locations and traffic-related collisions were obtained from Bogotá’s Open Data portal from 2015 to 2021 ( 18 ). Crash data contain information on the date and time of the collision, the type of road users involved, crash severity, and location. Road-segment data from Bogotá’s planning department consisted of 513 segments and 560 km. Only data on arterial roads 28 m wide or more, typically two-lane and two-carriageways or broader, were included, as speed cameras were installed on these roads exclusively.
Using spatial data analytic tools, crash data with reported victims were joined to arterial road segments. Of 37,357 reported crash victims reported in the periods mentioned, 21,700 occurred on arterial corridors. Information on cameras and speed limits was also passed to the road segments. The number of non-fatal injuries and deaths resulting from traffic crashes was normalized by the length of each road segment. Thus, the outcome of interest consists of the number of victims per kilometer in each segment.
Crash data by road segment were further categorized into pre- and post-intervention analysis periods. Crashes from June to September 2015 to 2018 are our pre-intervention analysis period or baseline. Collisions between June and September 2020 fall within our first post-intervention period, and those registered between June and September 2021 fall within our second post-intervention period of analysis. No speed-management measure (speed cameras or speed-limit reduction) was implemented during the 4 months of study in the years considered.
Road segments were further categorized into five groups that allow for other policy interventions as part of the city’s traffic management program. To that end, group segments were defined to capture the differences in magnitudes of changes in victims of traffic crashes in segments where the city intervened with some speed-management measure, with a comparison group (Table 1 and Figure 1). Drawing from the method tested by Lopez et al. ( 19 ) with the same dataset, a 500 m buffer from the cameras is defined for the control segments adjacent to cameras both downstream and upstream because all speed cameras work both ways according to the data collected officially. Summary statistics for traffic victims in each group segment are presented in Appendix 1.
Groups of Road Segments Defined for the Analysis
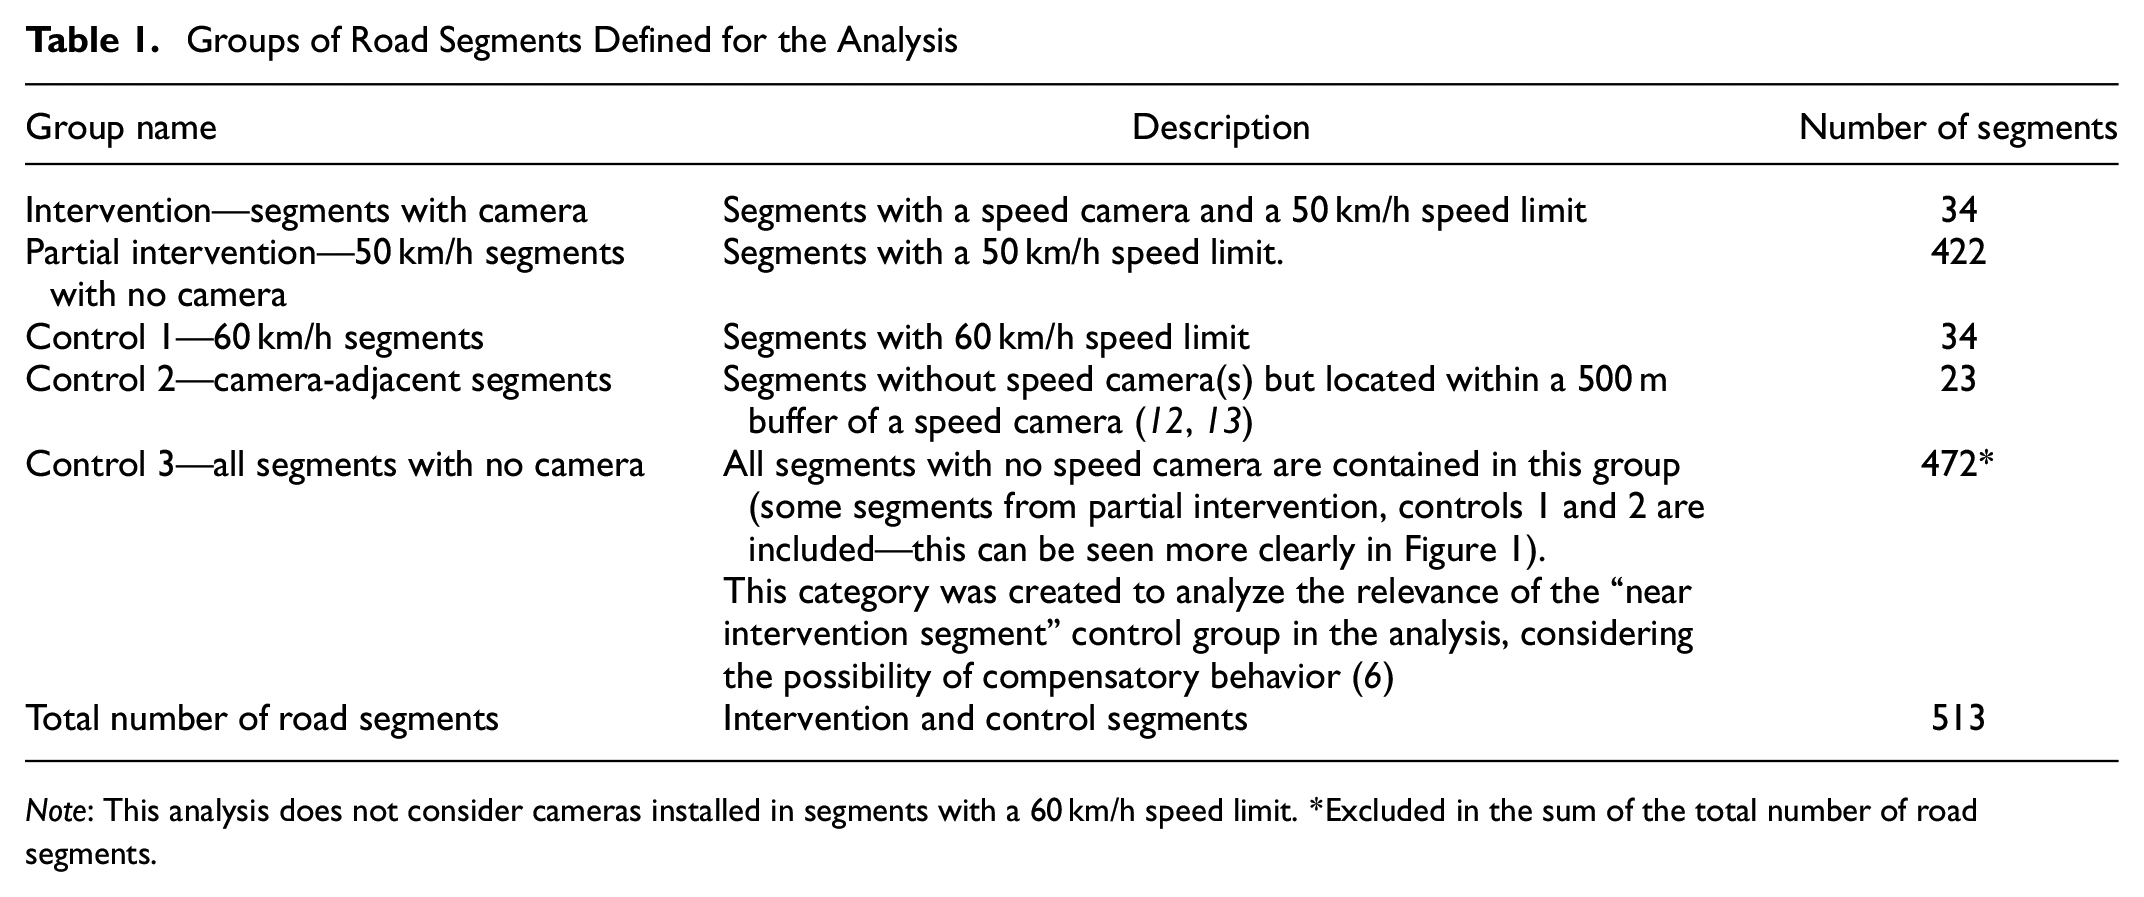
Note: This analysis does not consider cameras installed in segments with a 60 km/h speed limit. *Excluded in the sum of the total number of road segments.
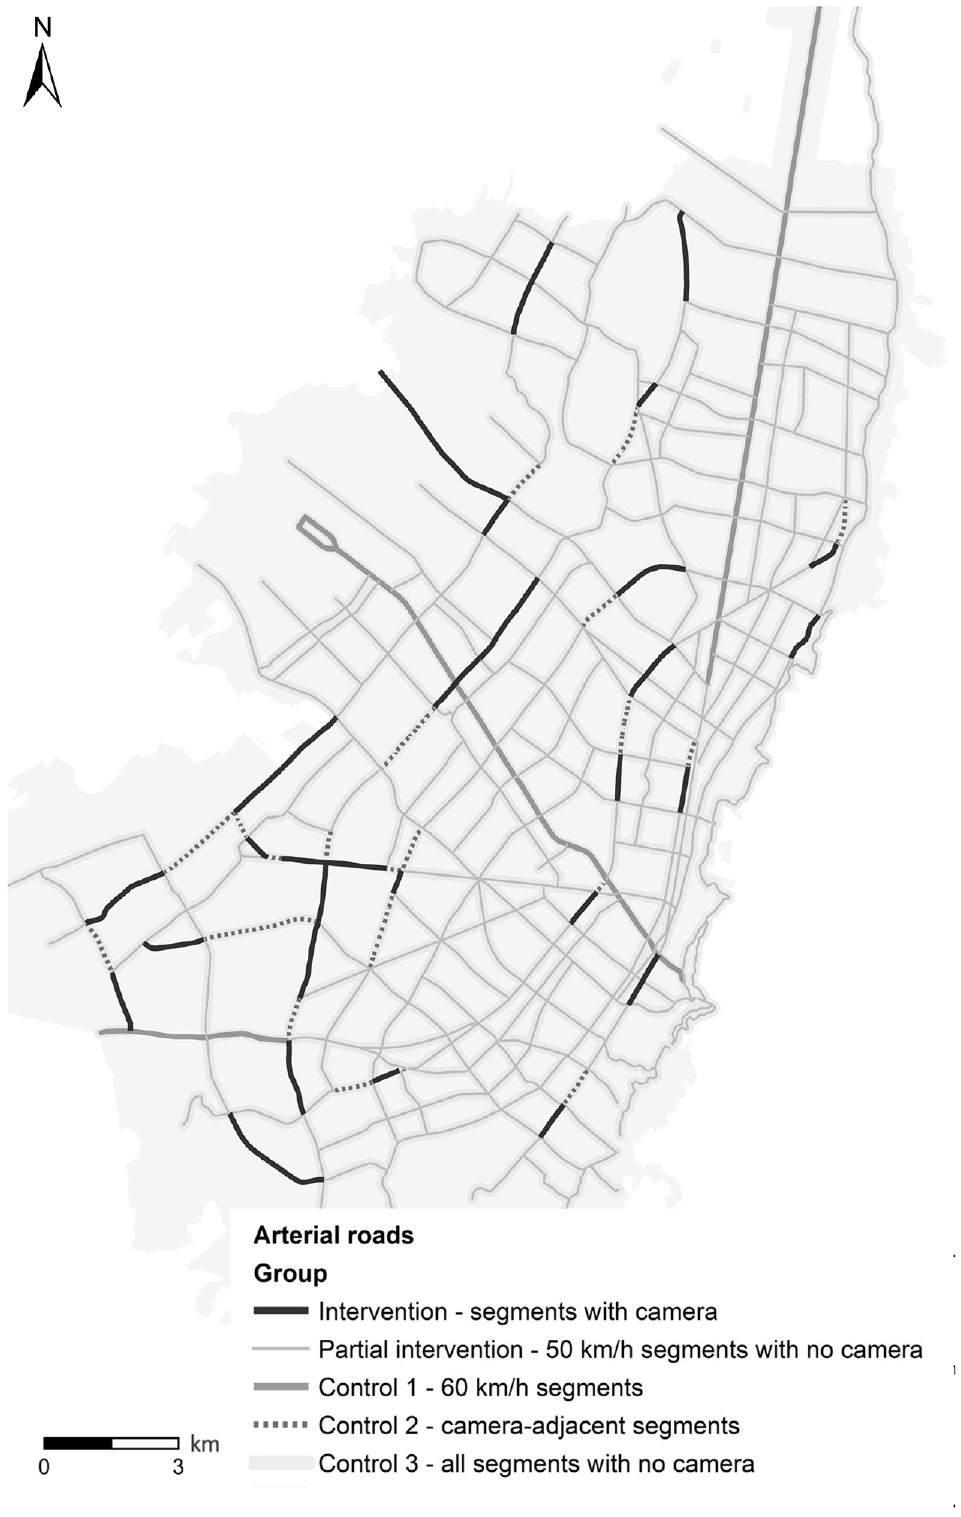
Segment groups and speed cameras considered in the analysis.
Differences in rates between the periods analyzed were tested for statistical significance, as were differences in rates between the intervention and control groups. Because the outcome of interest is a count variable, our hypothesis tests assumed a Poisson distribution.
A confirmatory analysis of changes in crashes was further conducted using a Hot Spot (Getis-Ord Gi*) Analysis using ArcGIS ( 20 , 21 ). This technique is often used in research to test whether clusters of spatial phenomena exist within a degree of certainty, which in our case consists of the existence of spatial clusters of high incidences of crashes with victims and the possible spatial association of such clusters with the installation of fixed speed cameras.
Findings and Discussion
Impacts are shown as overall changes in the number of victims per kilometer in each segment. Changes in traffic crashes with injuries and fatalities per kilometer are analyzed by considering: (i) all users (pedestrians, cyclists, motorcyclists, passengers, and car drivers), (ii) pedestrians, and (iii) motorcyclists. Statistical tests are followed by a spatial data analysis that identifies hotspots for motorcyclists only, as no hot spots were identified for other road users.
Changes in the Number of Victims from Traffic Crashes
Changes in the rate of crash fatalities per kilometer decreased in all segment groups between the baseline and 2020 (Figure 2, left). The largest decline is in segments with cameras installed (intervention). When comparing the 2021 data with the baseline, the rate increased by 0.3 victims per kilometer in segments belonging to control group 2 (adjacent camera segments). We found no evidence in 2021 that crash fatalities per kilometer changed in the remaining segments when not accounting for victims by transportation mode.
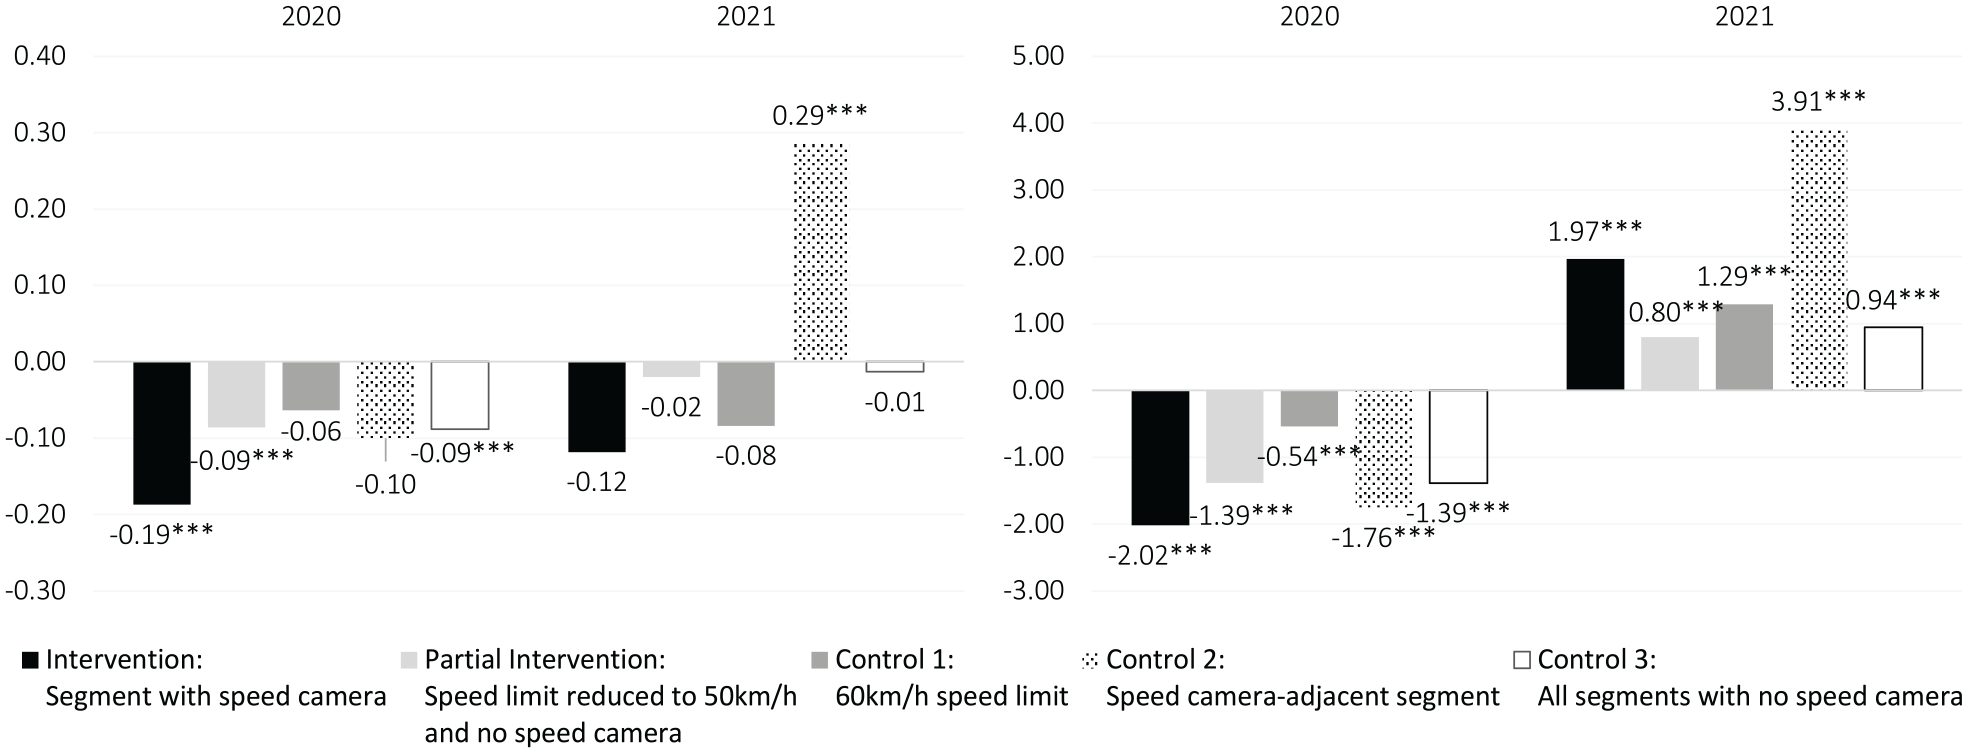
Average change in fatalities (left) and injuries (right) per kilometer for all users in September 2020 and 2021 compared with September 2015–2018.
The non-fatal injuries per kilometer rate decreased for all road segments in 2020 (Figure 2, right). The most significant decline was observed in segments with cameras installed (intervention), followed by segments within a 500 m buffer of a speed camera (control 2—camera-adjacent segments), and segments where mandated speed limits were reduced from 60 to 50 km/h (partial intervention—50 km/h segments with no camera).
Changes in non-fatal injuries between the baseline and 2021 exhibit the opposite trends observed in 2020. The rate of crashes per kilometer that resulted in non-fatal injuries increased consistently across all road-segment groups. The highest increase was identified in road segments within a 500 m buffer of a speed camera (control 2—camera-adjacent segments), followed by segments with intervention (segments with camera).
Findings are counterintuitive as they mask different trends uncovered once analyses are segmented by transportation mode. Furthermore, the contrasting picture Figure 2 paints can also be attributed to the effects the COVID-19 pandemic brought to travel behavior, more prominently, mode choice. By the end of 2020, after lockdowns were enacted in Bogotá, registered motorcycles increased compared with the baseline analysis period ( 22 ). This trend also indicates a higher use of the motorcycle in Bogotá in 2021, with rising exposure to road collisions. As discussed later in the paper, a substantial increase in motorcyclists’ exposure might help explain the higher number of fatality and injury crashes observed for 2021.
Table 2 summarizes the potential effects of the intervention by comparing it with the different control groups considered. Differences in reductions in fatalities between the intervention (segments with camera) and control 3 (all segments with no camera) between 2015 and 2018 and 2020 were statistically significant at the 90% confidence level, as were also the differences in reductions in fatalities between the intervention and partial intervention groups (50 km/h segments with no camera) in 2020. We found no evidence indicating speed cameras in Bogotá reduced traffic-related injuries. Our findings are consistent with scholarship indicating that speed cameras are particularly effective in reducing higher-severity crashes, adding confirmatory empirical evidence from an urban area in the global South.
Differences-in-Differences for Injuries and Fatalities of All Users in September 2020 and 2021 Compared with September 2015–2018
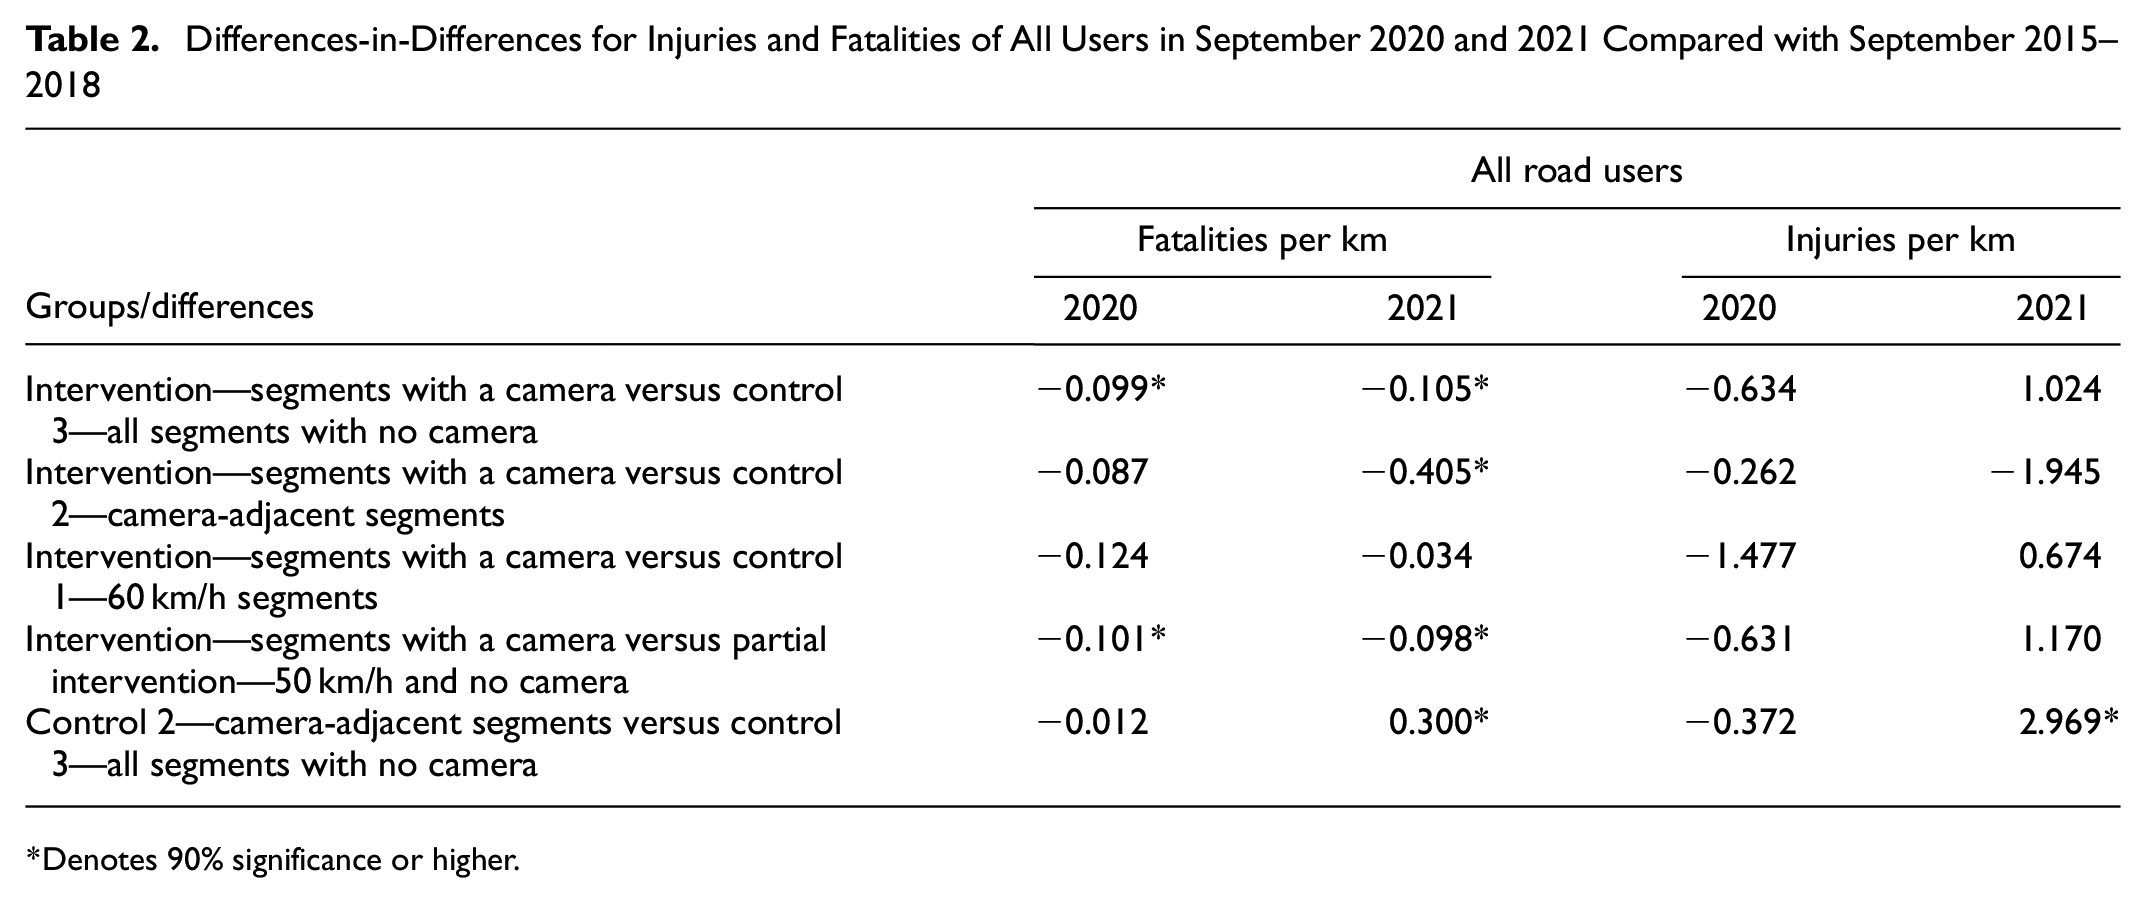
Denotes 90% significance or higher.
Furthermore, our differences-in-differences test comparing intervention between the intervention (segments with camera) and control 3 (all segments with no camera) between 2015 and 2018 continued to be statistically significant in 2021. However, it is unclear whether the effects diminished over time. In addition, the differences in rate changes from 2015–2018 to 2021 between the intervention and control group 2 (camera-adjacent segments) became statistically significant. This latter finding may be associated with some road users’ compensating behavior either up- or downstream of camera sites.
Changes in the Number of Pedestrian Victims from Traffic Crashes
For pedestrians, the number of traffic crashes per kilometer that involved fatalities decreased across all segment groups in 2020 (Figure 3). Segments with speed cameras (intervention) exhibited the most considerable reductions, followed by camera-adjacent segments (control 2). The decline in the rates of crashes with fatalities in segments with speed cameras is of similar magnitude in 2021 but not statistically significant for camera-adjacent road segments (control 2) or segments with a speed limit reduced to 50 km/h but with no speed camera (partial intervention).
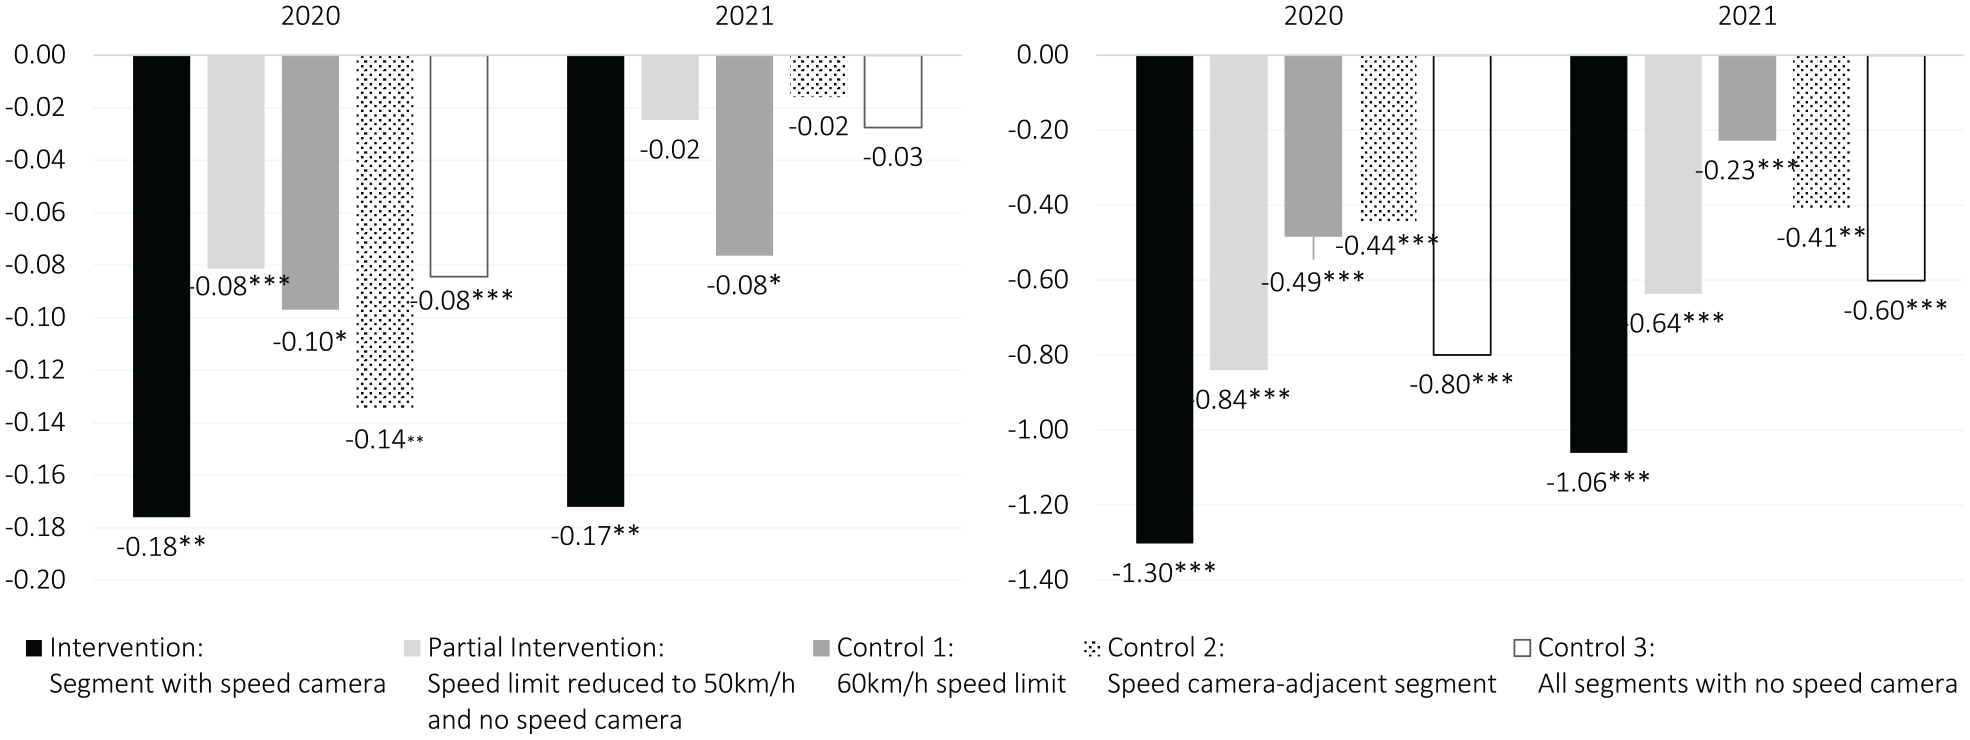
Average change in fatalities (left) and injuries (right) per kilometer for pedestrians in June–September 2020 and 2021 compared with June–September 2015–2018.
Traffic crashes that resulted in pedestrians with non-fatal injuries also decreased in 2020 and 2021 (Figure 3). This trend is also governed by large declines in segments with cameras (intervention) and segments with speed limit reduced to 50 km/h but with no speed camera (partial intervention) in both post-intervention analysis periods.
Table 3 shows the results from the differences-in-differences tests for pedestrians. Differences between reductions in pedestrian fatalities are statistically significant when comparing segments with speed cameras (intervention) with all segments with no camera (control 3) and the segments with the speed limit reduced to 50 km/h but with no speed camera (partial intervention) for both periods of analysis. For pedestrian injuries, all differences are statistically significant except when comparing camera-adjacent segments with all segments with no camera in 2021. These differences-in-differences suggest that speed cameras successfully decreased pedestrian fatalities and injuries. Our statistical analyses also indicate that traffic-related crashes involving pedestrians are not linked to or affected by compensating behaviors (or kangaroo effect).
Differences-in-Differences for Injuries and Fatalities of Pedestrians in 2020 and 2021
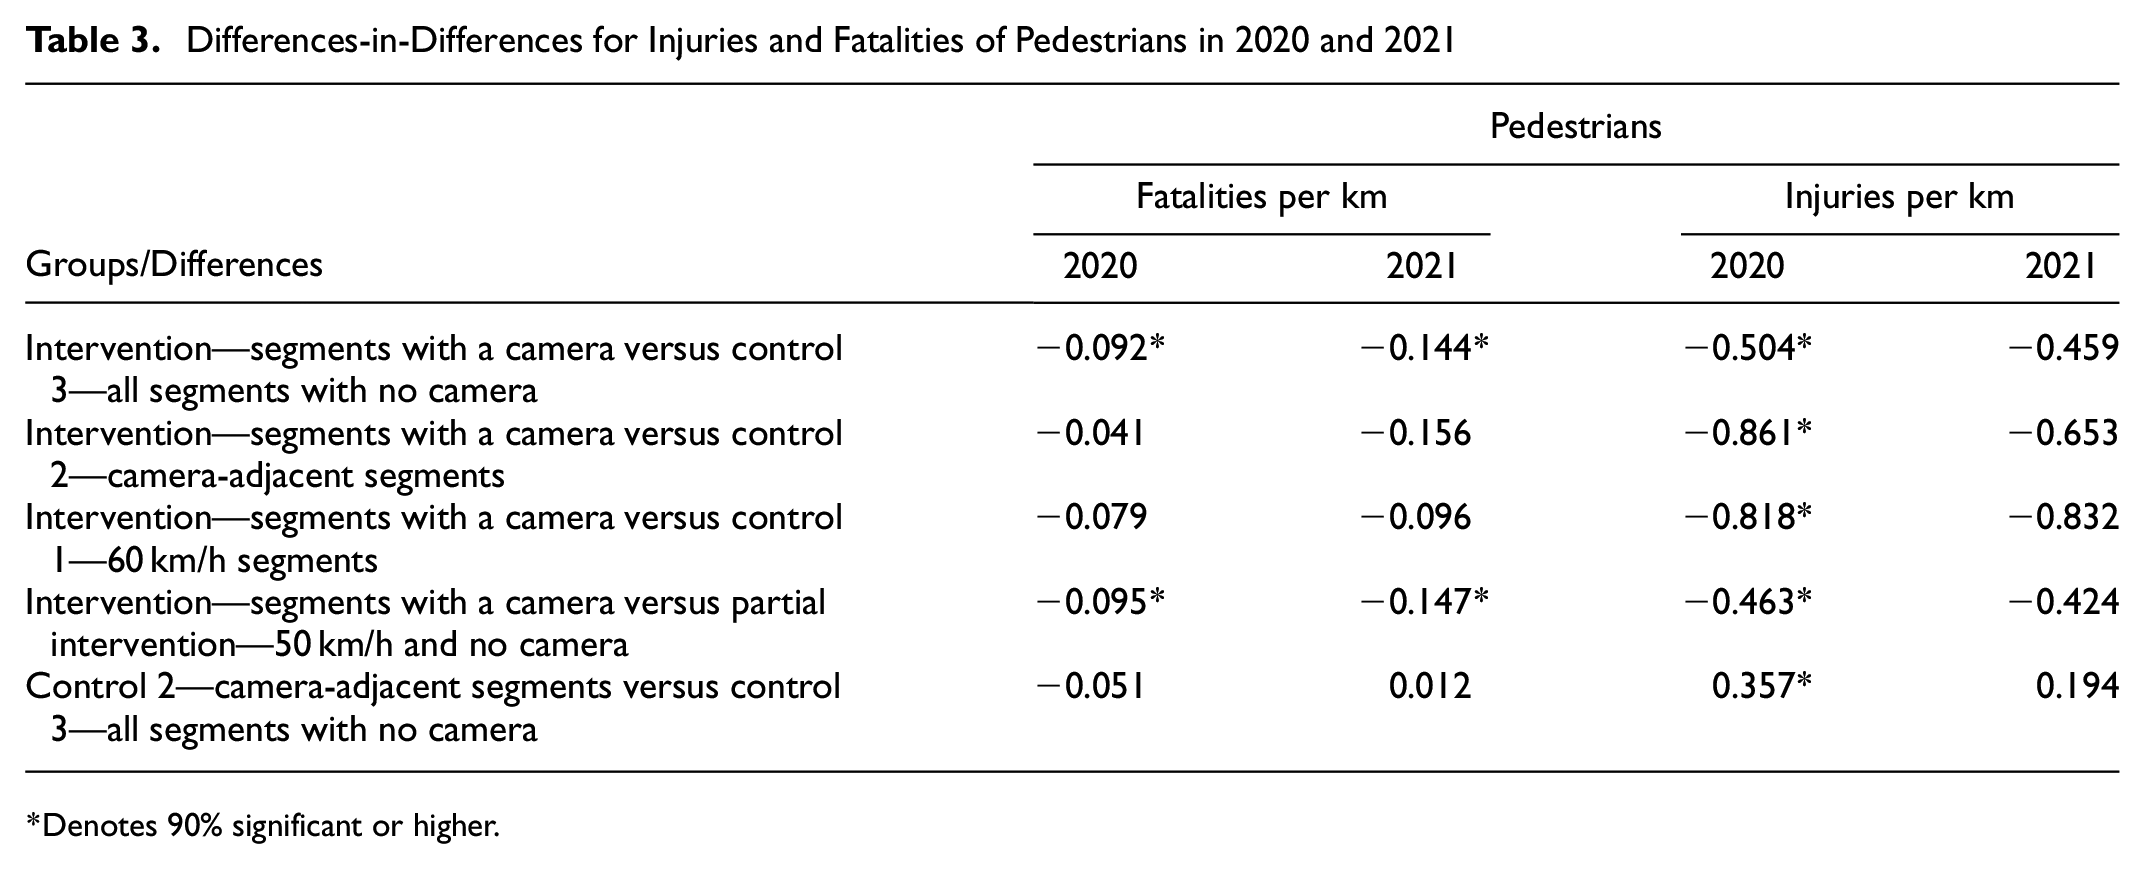
Denotes 90% significant or higher.
Changes in the Number of Motorcyclist Victims from Traffic Crashes
The number of crashes involving motorcyclists with fatal injuries by kilometer decreased in 2020 in segments with speed cameras (intervention) more than in any other segment (Figure 4). Our data analysis also uncovers a sharp increase in fatalities involving motorcyclists in camera-adjacent segments (control 2) in 2021. Similarly, the rate of crashes involving motorcyclists with non-fatal injuries decreased in 2020 in segments with speed cameras (intervention) more than in any other segment (Figure 4). However, the number of motorcyclist crashes that resulted in non-fatal injuries per kilometer increased across all the group segments. This latter finding can be explained by motorcyclists’ increased exposure because of growth in motorcycle ownership during the COVID-19 pandemic, particularly after mobility restrictions in the city were relaxed. The largest increase in 2021 was in camera-adjacent segments (control 2).
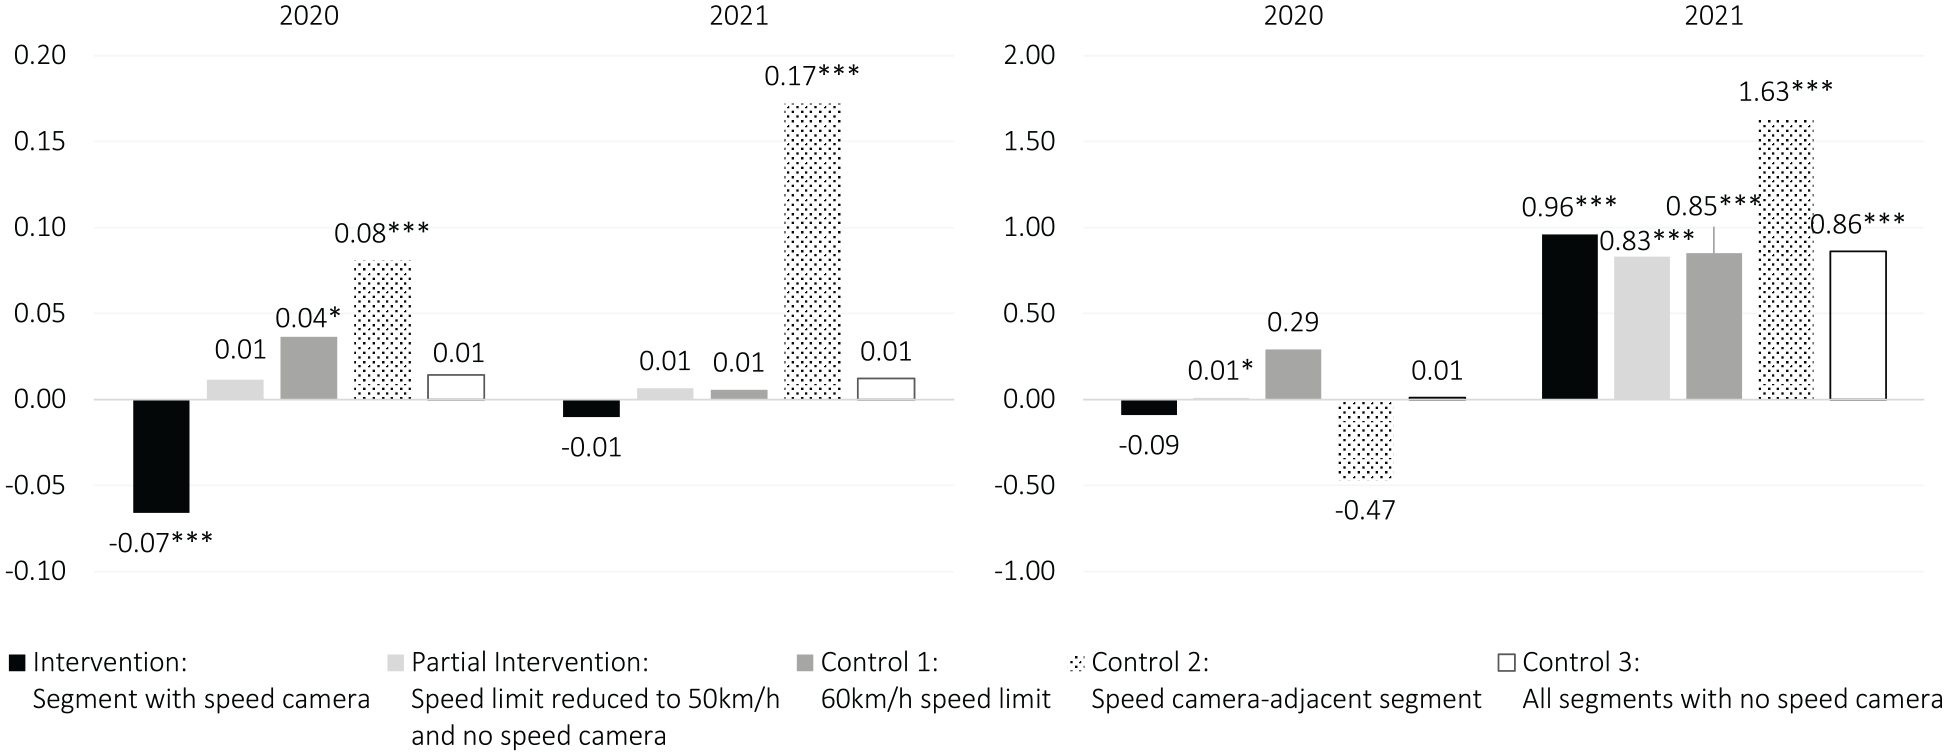
Average change in fatalities (left) and injuries (right) per kilometer for motorcyclists in June–September 2020 and 2021 compared with June–September 2015–2018.
Table 4 shows the results from the differences-in-differences tests for motorcyclists. Differences in changes in motorcyclist fatalities in 2020 are statistically significant between the intervention segments and all other groups, as well as for the difference between camera-adjacent segments (control 2) and segments with no camera (control 3). For 2021, only the differences between camera-adjacent segments (control 2) with intervention segments and those with no camera (control 3) are statistically significant. Only the difference between control 2 (adjacent camera segments) and control 3 (all segments with no camera) is statistically significant for traffic-related injuries.
Differences-in-Differences for Injuries and Fatalities of Motorcyclists in June–September 2020 and 2021
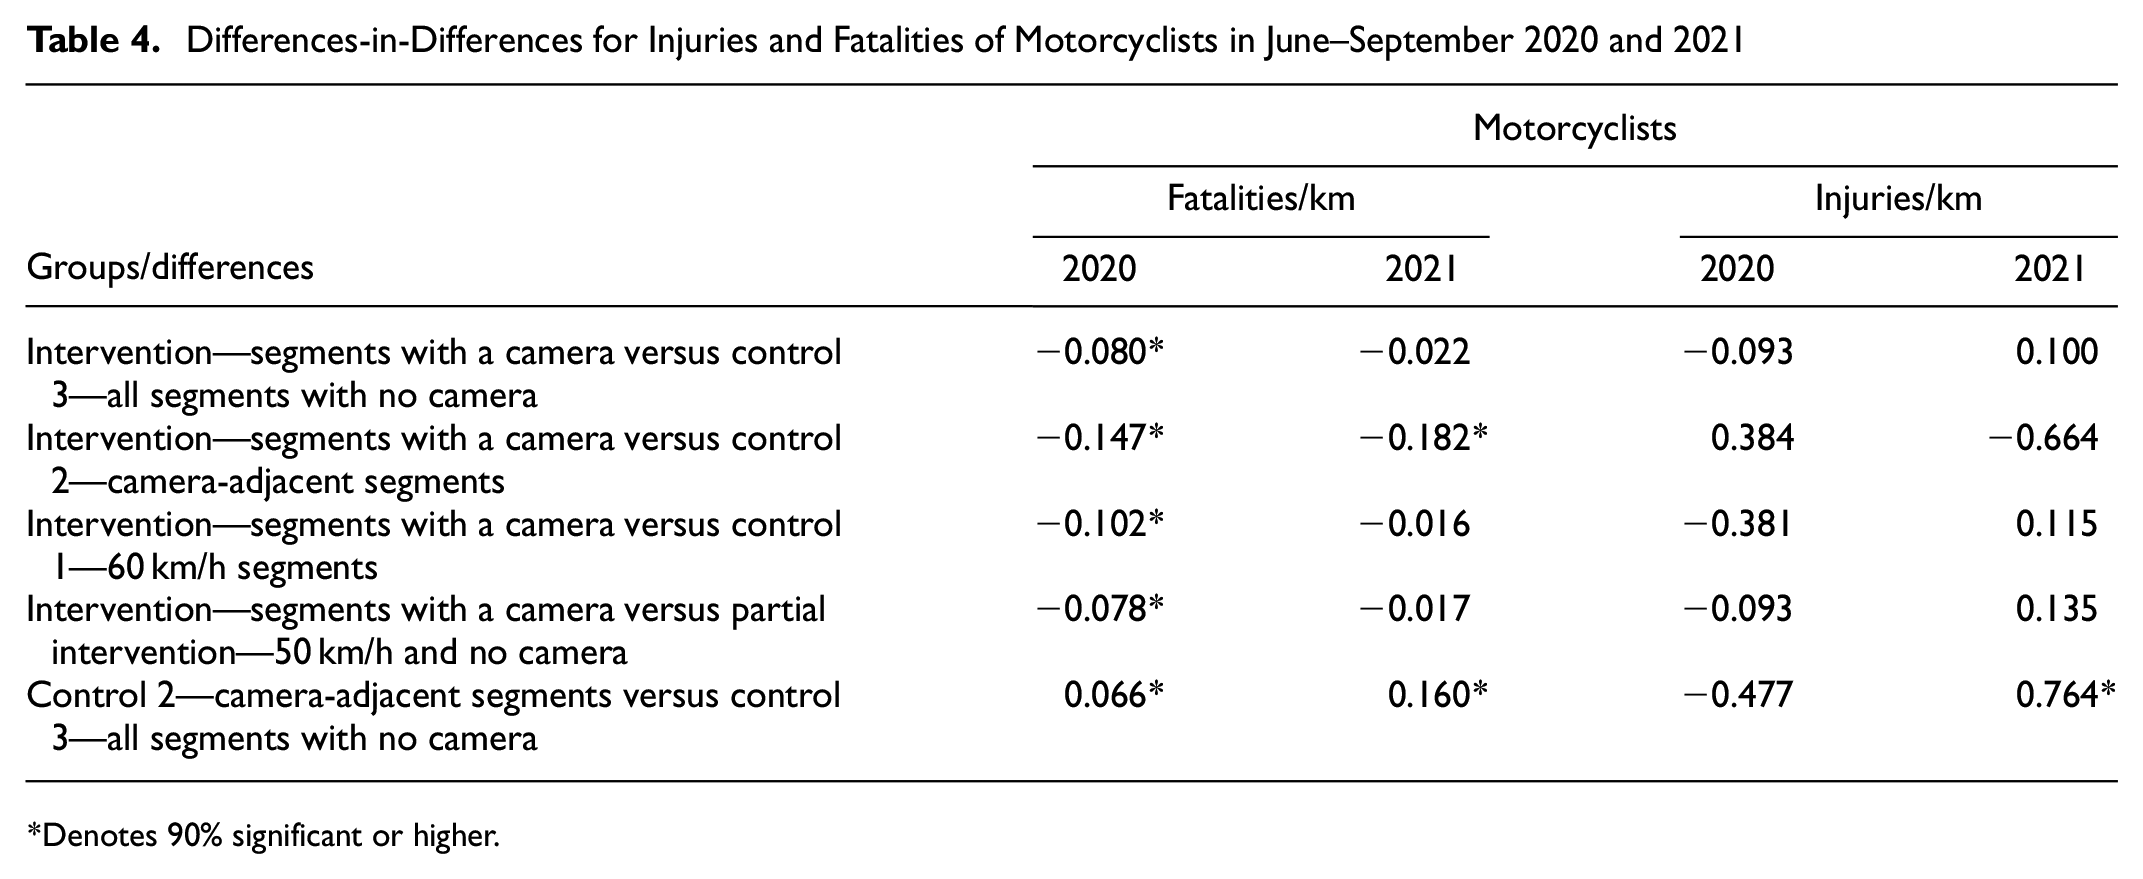
Denotes 90% significant or higher.
Fixed speed cameras may induce a compensatory behavior known as the kangaroo effect, reducing the overall benefits urban areas may gain from this innovative traffic control measure. Such a claim is substantiated by our analyses of differences in traffic-related crashes involving motorcyclists at various points in time and for different segments. Despite such a kangaroo effect, installing fixed speed cameras in Bogotá reduced overall fatal and non-fatal injuries among motorcyclists and more so for pedestrians. However, our data analyses comparing motorcyclists’ fatalities in segments with a camera versus control 3—all segments with no camera—also suggests the policy efficiency shrinks over time.
Confirmatory Spatial Cluster Analysis
The spatial cluster analysis corroborates our conjectures on compensatory effects on motorcyclists. Statistically significant hotspots for 2015–2018, 2020, and 2021 are shown in Figure 5. Statistically significant changes can be observed on two arterial roads (Avenida Americas and Avenida Boyacá) where previous hotspots seemed to have been relocated after installing speed cameras. Other hotspots emerged in 2021 where there were no cameras or speed-limit changes or close to a speed camera.
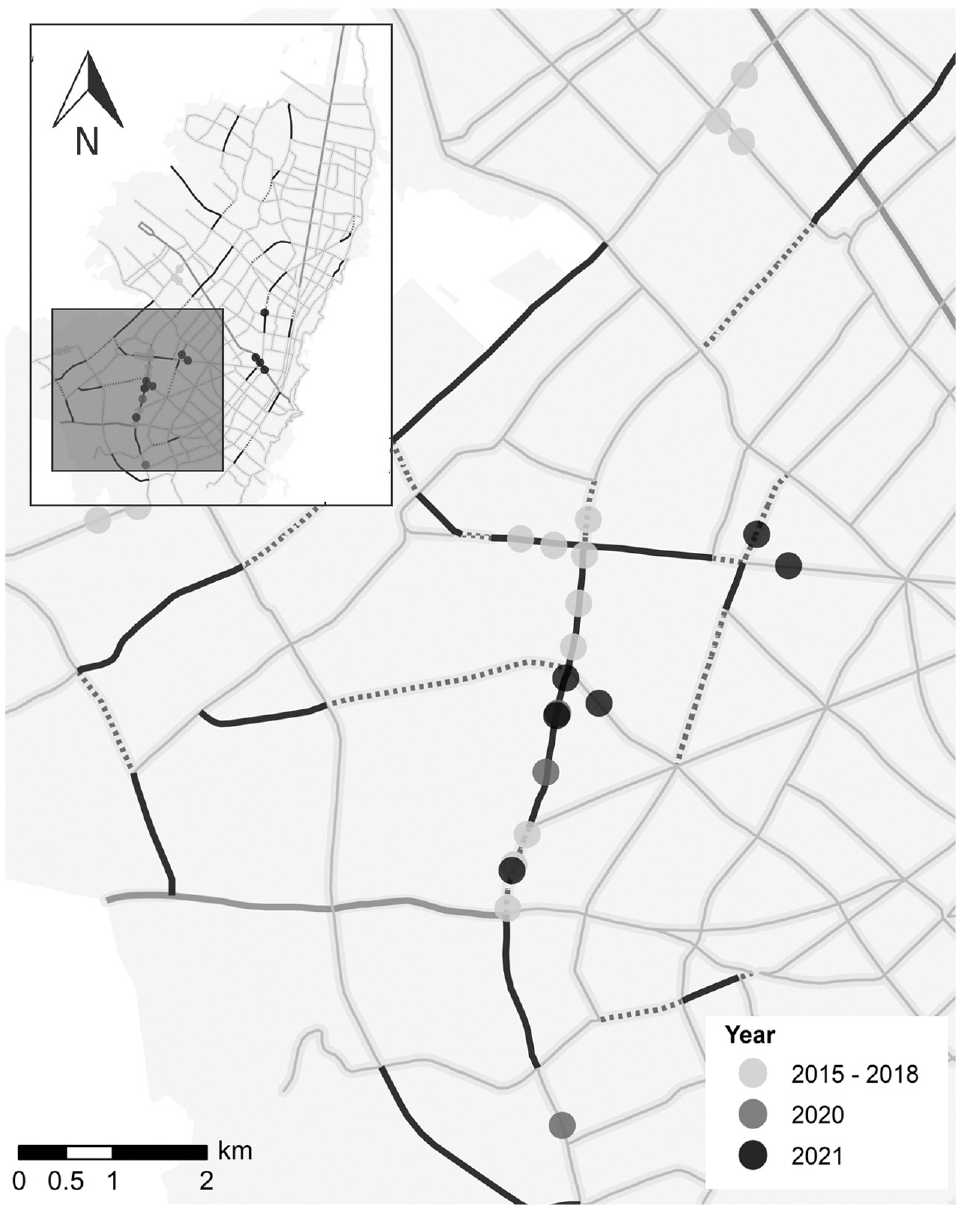
Motorcyclist hotspots analysis.
In short, our data analyses from Bogotá strongly indicate fixed speed cameras induced speed compensation. Our findings also highlight the importance of simultaneously capturing geographical and temporal dimensions in methodologies for evaluating these measures and saving even more lives.
Conclusions
Speed-management measures in Bogotá have improved traffic safety records overall. Our analysis suggests that traffic-related fatalities and non-fatal injuries decreased the most in locations where speed cameras were implemented. The average impact of speed cameras on traffic safety could be up to 13 fewer fatalities annually. This figure is based on the difference in the change between segments where cameras were installed and segments with no camera, which is about 0.1 deaths less per kilometer for both post-intervention periods (2020 and 2021). The decline in the rates for traffic-related fatalities ads up to 21% in the cameras’ locations and 3% citywide. This result is consistent with the potential impact such measures had in other places in the world. It adds new empirical evidence from a speed-enforcement camera program implemented in a global South city where motorcycle ownership continues to grow.
Our findings also indicate the impact of the installation of fixed speed cameras on traffic safety is governed by a drastic reduction in pedestrians injured or killed in traffic-related crashes. This is particularly important as pedestrians’ hotspots are in low-income neighborhoods, so the reduction is also contributing to advancing social equity goals in the city. The measure’s effectiveness among motorcyclists was reduced a combination of factors, so it had little, if any, impact on the overall effects of traffic-related fatalities and non-fatal injuries.
Our differences-in-differences tests, combined with the results from our spatial statistical analyses, also suggest there is a compensatory behavior associated with crashes involving motorcyclists. This finding underscores the importance of considering multiple types of controls or comparison groups that account for compensatory behaviors. Results in camera-adjacent segments differ significantly from all other road-segment types we used as controls. Because there is no information on who or what is at fault in the crash report employed, our study provides no conclusive evidence on the extent to which motorcyclists are to blame, despite the high rates of traffic-related injuries and deaths among these road users.
Enforcing corridor-level average speed limits using automated speed-detection technology is recommended in arterial corridors, where traffic calming or police intervention is often not feasible. Average speed enforcement involves installing cameras at two or more locations along a road section. These automated enforcement devices calculate a vehicle’s average speed between two distant points on the road, ranging from 200 m to several hundred meters along a road segment with uniform characteristics. Average speed enforcement has proven a successful technological solution to reduce any compensatory effects associated with fixed speed cameras in various European countries ( 23 ). Other measures could include placing safe level crossings instead of pedestrian bridges, speed bumps, and other interventions depending on the context and specificities of the road infrastructure, based on citywide and integrated speed management and transportation planning ( 19 ).
Changing the general perceptions of speed cameras from punitive to necessary enforcement measures that can save human lives is also essential. Education is particularly important because, even in policy contexts where local authorities do not have to provide information on cameras’ locations, mobile navigation applications have made it possible for drivers to know the location of speed cameras, potentially conditioning geographic speeding behaviors. While more research is needed on the role of crowdsourced information technologies in such policy contexts, increasing the number and spatial coverage of speed cameras that consider potential compensatory behavior could reasonably result in more effective interventions than only focusing on a limited number of hot spots.
As motorcycle use and ownership grow exponentially in Latin American and East Asian cities, local authorities should continue investing in measures complementary to automated speed-enforcement cameras that promote safer modes like public transport ( 24 ). We recommend future research also examine the role of infrastructure elements, demographic characteristics, and human behavior when studying the role of automated speed-enforcement cameras in reducing traffic crashes. Doing so would provide a more nuanced understanding of the technology that is the subject of this study and the potential impacts of complementary policies to mitigate the public health crisis associated with traffic-related injuries and deaths across the globe.
Supplemental Material
sj-docx-1-trr-10.1177_03611981231182419 – Supplemental material for On Speed Management, Public Health, and Risky Behaviors: Examining the Side Effects of Automated Speed-Enforcement Cameras on Traffic Crashes in Bogotá, Colombia
Supplemental material, sj-docx-1-trr-10.1177_03611981231182419 for On Speed Management, Public Health, and Risky Behaviors: Examining the Side Effects of Automated Speed-Enforcement Cameras on Traffic Crashes in Bogotá, Colombia by Segundo Lopez Valderrama, Manuel Santana Palacios, Valentina Perdomo Botello, David Perez-Barbosa, Juliana Vega Arrieta, Jessica Kisner and Claudia Adriazola-Steil in Transportation Research Record
Footnotes
Acknowledgements
We thank Diego Vargas from Vital Strategies for collecting the data. We are also grateful to the Secretariat of Mobility of Bogotá, Nathaly Torregroza, Head of the Road Safety Office, and the anonymous reviewers whose valuable comments and suggestions contributed to this piece’s improvement.
Author Contributions
The authors confirm contribution to the paper as follows: study conception and design: Manuel Santana Palacios, Segundo Lopez Valderrama, Valentina Perdomo Botello, David Perez-Barbosa, and Juliana Vega Arrieta; data collection: Segundo Lopez Valderrama, Valentina Perdomo Botello, and Juliana Vega Arrieta; analysis and interpretation of results: Manuel Santana Palacios, Segundo Lopez Valderrama, Valentina Perdomo Botello, and Juliana Vega Arrieta; draft manuscript preparation: Manuel Santana Palacios, Segundo Lopez Valderrama, Valentina Perdomo Botello, David Perez-Barbosa, Juliana Vega Arrieta, Jessica Kisner, and Claudia Adriazola-Steil. All authors reviewed the results and approved the final version of the manuscript.
Declaration of Conflicting Interests
The author(s) declared no potential conflicts of interest with respect to the research, authorship, and/or publication of this article.
Funding
The author(s) disclosed receipt of the following financial support for the research, authorship, and/or publication of this article: Bloomberg Philanthropies funded this research under the Bloomberg Initiative for Global Road Safety.
Supplemental Material
Supplemental material for this article is available online.
References
Supplementary Material
Please find the following supplemental material available below.
For Open Access articles published under a Creative Commons License, all supplemental material carries the same license as the article it is associated with.
For non-Open Access articles published, all supplemental material carries a non-exclusive license, and permission requests for re-use of supplemental material or any part of supplemental material shall be sent directly to the copyright owner as specified in the copyright notice associated with the article.