
Abstract
Pedestrians account for 65% of all traffic fatalities worldwide. A sub-category of pedestrians is vehicle-to-vehicle vendors, who pose a concern in countries with rapid motorization. For example, 70% of traffic fatalities in Nigeria involve general pedestrians and vendors. Previous studies have highlighted vendors’ heterogeneous road crossing and car-following behaviors. Furthermore, they create a nuisance for general pedestrians. This study contrasts the risk perception of vehicle-to-vehicle vendors and general pedestrians and analyzes grouped and ungrouped illegal crossings of vendors. A questionnaire survey was developed, based on a literature review and expert knowledge, to identify variables associated with risk perception. Interviews based on a questionnaire were conducted in various locations in Dhaka, Bangladesh, which collected 1,019 responses containing information on the respondents’ demographic attributes, risk perception, aggressive behavior, near-crash experiences, and accepted yielding distances. Next, ordinal logit/probit and complementary log-log models were employed to analyze the data. The findings revealed that vehicle-to-vehicle vendors had a lower risk perception than general pedestrians. It also indicated that vendors would take a higher risk than general pedestrians. Furthermore, vendors jaywalking alone had a significantly lower perception of risk. Finally, gender, age, education, accepted yielding distance, and aggressive behavior were the most prominent factors affecting vendors’ risk perception. Gradually separating vendors from the traffic system by shifting them to proper street markets could be a critical solution.
Unpredictable behavior is a major cause of pedestrian crashes ( 1 ). Previous research regarded pedestrians as vulnerable road users ( 2 , 3 ). Pedestrians are fast to respond to and difficult to supervise via regulations ( 4 , 5 ). A significant portion of pedestrians prefer not to abide by traffic rules ( 6 ). As a result, pedestrians comprise 65% of global road fatalities ( 7 ). In the U.S., pedestrian deaths have seen a 46% rise in the past decade ( 8 ). Bangladesh, a developing country, experienced 5,431 and 6,284 fatalities from road crashes in 2020 and 2021, respectively, which cost the country Bangladeshi Taka (BDT) 96,310 million as a loss of human resources ( 9 ). A significant portion of these fatalities involve pedestrians, resulting in a burden on the national economy.
Vehicle-to-vehicle vendors are a specific group of pedestrians, locally termed “hawkers,” who sell merchandise by navigating the streets and interacting with the traffic system, unlike roadside sellers who sell goods on their stationary carts or wagons ( 10 – 14 ). Vehicle-to-vehicle vendors typically walk to their activity zone with their merchandise and then walk or sprint toward the vehicles to offer their items. While they sell items in the activity zone, they do not use any vehicles. Findings exhibit that hawkers’ heterogeneous road crossing and car-following behavior, instigated by the intrinsic desire to fiercely compete with other hawkers to sell items to potential customers, make hawking in traffic a risky act ( 12 ). In some countries, such as Ghana and Nigeria, hawking primarily involves female and juvenile hawkers ( 12 , 15 , 16 ).
Hawkers are an unwanted but integral part of Bangladesh’s traffic system. They encroach on the right of way, discouraging pedestrians from using road crossing facilities and forcing pedestrians to jaywalk ( 13 , 17 , 18 ). This forces unsuccessful jaywalking attempts, increasing the risk of a potential crash ( 19 ). Additionally, hawkers are also victims of traffic crashes in Bangladesh ( 20 , 21 ). Hawkers as pedestrians are a cause of road safety concern in Bangladesh and other developing countries with burgeoning economic and infrastructure development. For example, 84% of hawkers in Nigeria were injured by automobiles, 70% of road crashes involved pedestrians and hawkers, 33.7% suffered from femoral shaft injuries, and 4.1% experienced head injuries ( 10 , 16 ).
Previously, numerous studies addressed pedestrians’ safety, behavior, and crashes, but few evaluated vendors’ risk perception and grouped or scattered movements ( 18 , 22 ). This study aims to compare, contrast, and unveil the risk perceptions of vehicle-to-vehicle vendors (hawkers) and general pedestrians, and analyzes vendors grouped and ungrouped illegal crossing in the context of a developing country. The data for the study was collected through a questionnaire survey conducted in Dhaka, Bangladesh, which collected 1,019 samples and employed ordinal logit, ordinal probit, and complementary log-log models for the analysis to fulfill its objectives.
Literature Review
Vendors
Previous studies explored vendors’ perspectives on and experiences of various traffic incidents. For example, Sam et al. examined vendors’ perspectives on road traffic dangers using thematic descriptive data analysis and found gender and age to be the possible arbitrators of their risk perceptions ( 12 ). A similar study observed female vendors’ experiences of potential danger and abuse on the street based on their age, educational status, religion, and so forth ( 15 ). There, around 90% of respondents were aware of the dangers associated with vending and 47% reported road crashes as the major risk. Another non-empirical literature-review-based study examined injuries in child vendors, and poverty was the underlying factor; inattentively alighting buses, chasing vehicles in motion, and hanging on moving vehicles were their risky behaviors ( 10 ). Though these studies present important findings about vendors’ perspectives and experiences, they are often limited by demography, for example, gender and age group ( 10 , 15 ). Moreover, analyzing the vendors’ risk perceptions and heterogenous movement was overlooked. Furthermore, a limited sample size, partial variable space, and judgment-based non-empirical methodological approach limit their transferability to different demographic and socio-economic conditions.
Pedestrians
Numerous studies have been conducted over the years addressing various aspects of pedestrian safety. For example, boarding and alighting frequency were used to assess pedestrian safety at bus stops, concluding that the bus stop vicinity has a noticeable impact on pedestrian safety ( 23 ). However, it overlooked road geometry and commuting workers’ walking trips. Another study analyzed pedestrian safety at locations with high roadside activity using the Poisson and negative binomial models; the number of bus stops, volume of pedestrian crossing, and variation in traffic flow speed were significant variables associated with pedestrian crashes ( 24 ). However, the study ignored demographic variables. A substantial number of studies have addressed pedestrian safety at intersections and unmarked roadways using regression models ( 6 , 22 , 25 ). Controlled intersections improved pedestrian safety, and crossing group size, median width, vehicle flow, age, and so forth, were significant variables. However, the studies used video data and overlooked socio-economic aspects, such as profession, income level, dwelling condition.
Logistic models were used for observing pedestrians’ crossing behavior. Koh et al. examined pedestrians’ crossing behaviors at signalized crossings and found that people crossing with a companion were 246% less likely to take a risk than those crossing alone ( 26 ). Similar studies used multiple linear regression and binary logistic models for assessing pedestrian behavior at signalized and unsignalized intersections ( 27 – 29 ). Education, occupation, crosswalk length, and so forth, affected crossing behavior; grouped crossing was riskier than individual crossing, and pedestrians were less cautious while crossing at signalized intersections. However, these studies focused on the revealed behavior of the pedestrians and did not consider exposure (traffic volume), pedestrians’ risk perception, and the complete demographic and socio-economic spectrum.
Several studies addressed pedestrians’ jaywalking behavior using Bayesian networks, artificial neural networks, and multiple linear regression models ( 18 , 19 , 30 ). Findings demonstrated that waiting time, age, income, education, location of traffic attraction, vehicle volume, being in a hurry, group size, and crossing point (curb or median) affected their illegal crossing behavior. Moreover, middle-aged male pedestrians are predominantly found engaged in illegal crossing, and female pedestrians encountered more near-miss events than males and preferred jaywalking in groups. One of the shortcomings of these studies was that they did not consider variables such as gender, age, trip purpose, gap acceptance, and weather. A Bayesian measurement errors model was used to model pedestrian crashes at signalized intersections ( 31 ). Findings suggested that pedestrian crossing numbers, count of vehicles passing, and so forth, positively affected pedestrian crashes. The study did not consider various risk factors such as vehicle speeds and demographic attributes of pedestrians.
Although Dhaka is densely populated and urbanized, there have been limited studies on pedestrians here. One of the studies inspected pedestrians’ perception of road crossing facilities in Dhaka using a Likert scale ranking system and found that pedestrians preferred underpasses over footbridges and were discouraged from using road crossing facilities because of the presence of vendors ( 17 ). The study made inferences based on descriptive statistics derived from demographic variables. Zafri et al. examined pedestrian safety by analyzing their risky rolling-gap road crossing strategy by employing binary logistic regression ( 22 ). Crossing group size was a significant variable, as pedestrians crossing in pairs were 3.5 times less likely to demonstrate rolling-gap crossing than those crossing alone. Furthermore, median width, vehicle flow, and age group were significant variables. Nevertheless, the study overlooked major socio-economic variables, such as profession, income level, and dwelling condition.
Risk Perception
Perceived risks reflect individuals’ subjective assessments and assumptions concerning losses, negative repercussions, and the nature and severity of risk ( 32 ). Risk perception motivates individuals to take protective measures. If adopted measures are believed to be effective, they lower their perceived risk, and risk behavior is fully explained by risk perceptions ( 33 ).
Several studies assessed pedestrians’ risk perceptions, behavior, and safety issues using Bayesian networks and structural equation modeling ( 13 , 34 ). Gender, waiting time, activities of jaywalkers, and so forth, were found to affect risky jaywalking, and ungrouped jaywalking had a greater risk than grouped jaywalking. Moreover, higher risk perception resulted in safer pedestrian behavior, and non-traffic risk perception was a critical predictor of traffic risk perception. Nevertheless, the studies did not capture jaywalkers’ perception of the road crossing facilities and the reasons for not using them.
Pedestrian risk perceptions were analyzed using negative binomial models and ordered logit models at urban signalized intersections ( 35 ). Findings suggested that the lack of a pedestrian signal head increased pedestrians’ risk perception by 1.2 times, and the inadequacy of proper sight distance by 2.3 times. However, the study did not consider the state of the pedestrians’ crossing and carrying weight. Other shortcomings of the study were the smaller sample size and focus limited within an urban setup. Although being an extremely vulnerable group, very few studies have considered the risk perception of vendors and investigated if they are different from that of general pedestrians. Despite numerous studies addressing pedestrian safety, behavior, and crashes, there is room for studies considering vendors and their associated risk with grouped and ungrouped crossing.
The Data
Questionnaire Development
The questionnaire survey was designed and developed based on a literature review, expert knowledge, and engineering judgment. Because of a lack of studies into vendors’ risk perception, studies addressing pedestrians were primarily considered the base for variable selection. The questionnaire included the following segments.
Demographic and Socio-Economic Information
Participants were asked about their gender, age, education, monthly income, and dwelling condition in this segment, as well as whether they were general pedestrians or vendors.
Risk Perception
Data associated with risk perception was collected on the following criteria: 1) boarding and alighting and 2) crossing, and were merged into a single variable as risk perception. The new variable, “risk perception” contained 17 questions. The questions were on a Likert-type scale ranging from “always” to “never” with middle categories of “often,”“sometimes,” and “rarely” ( 17 ). Perception on boarding and alighting was extracted using six questions. Scenario-specific questions included factors like recklessly boarding or alighting a running bus, carrying extra weight, and the presence of bus stops ( 10 , 19 , 26 , 29 , 31 ). Perceived risk concerning crossing included 12 questions. Except “type of jaywalking,” which was a binary response, all the other questions were on a Likert-type scale. The segment captured the following parameters: grouped or ungrouped jaywalking and crossing decisions for medians, barriers, and partially broken barriers; scenario-specific questions addressed the presence of road crossing facilities, being in a hurry—forget to look before crossing, and traffic flow type ( 13 , 17 , 19 , 22 , 26 , 28 , 30 , 31 , 36 ).
Accepted Yielding
Accepted yielding distances of pedestrians and vendors were observed for no median facility on the road, median facility on the road, and crossing from median to sidewalk, on a categorical scale following literature using three questions and passively addressing the gap acceptance of the two participant groups ( 17 , 18 , 22 ).
Aggressive Behavior
The exemplification of aggressive behavior toward drivers or other road users was examined on a Likert-type scale using three questions, and observed target groups’ annoyance and angry behavior. This part of the questionnaire was developed following a pedestrian behavior questionnaire validation study ( 36 ). The study also influenced variable selection in risk perception and crash history.
Crash History
This part of the questionnaire included two questions. First, pedestrians and vendors were asked about their previous history of near-crash experiences on a binary scale of “yes” or “no” and then the occurrence of those events ( 18 , 36 ). If the answer to the first question was “no,” the occurrence was assumed to be zero for the second question.
Sample Size
More than 150,000 vendors operate in Dhaka in a non-lane-based heterogeneous traffic environment ( 18 , 37 ). The data were collected from various locations in Dhaka City to capture a diversified population to minimize selection bias. A pilot test was undertaken before the survey to determine whether participants had problems comprehending the questions. Participants were sampled randomly via short interviews with expert surveyors. A total of 1,236 samples was collected, which included both pedestrians and vendors. Data filtering was performed to eliminate missing, incomplete, and disengaged replies. Finally, 1,019 valid samples were used for this study.
Descriptive Statistics
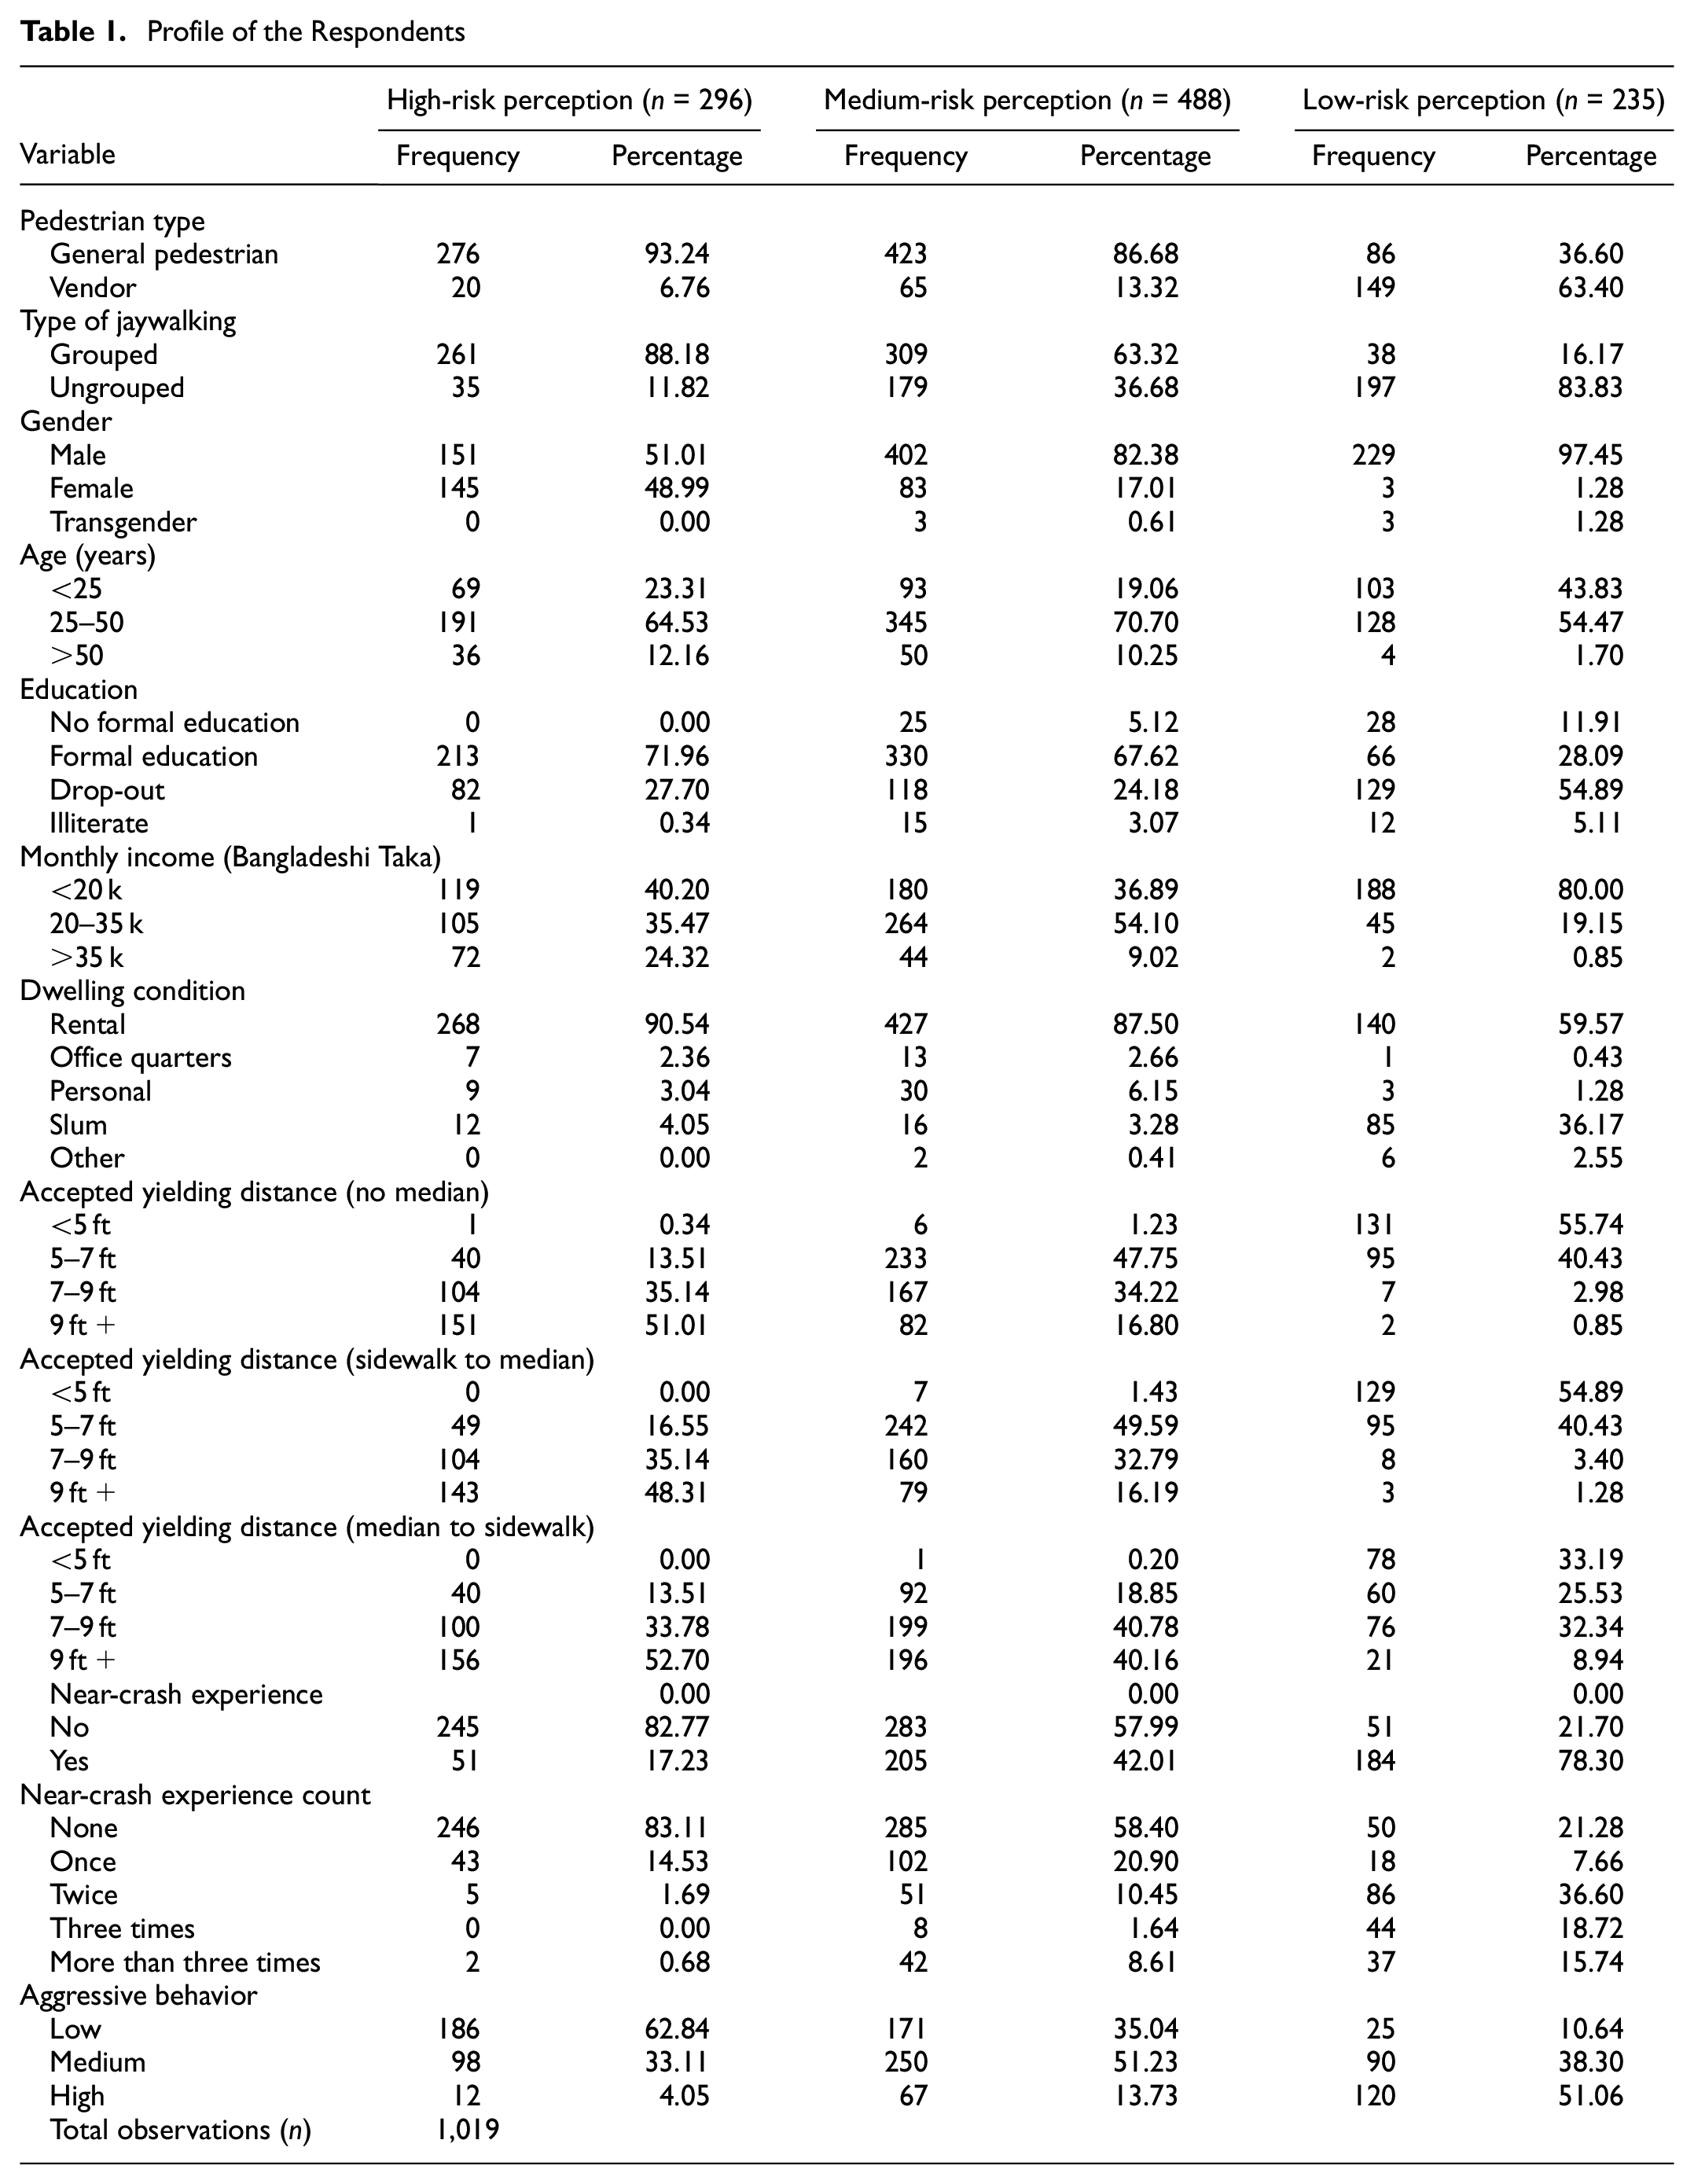
The responses to “risk perception” were numerically ordered from 1 to 5 (e.g., never = 1, rarely = 2, sometimes = 3, often = 4, always = 5). Afterward, the variable was classified into three groups according to the total scores (85): high-risk perception (lower quartile: <29), medium-risk perception (middle quartile: 29–45), and low-risk perception (upper quartile: >45). Visual representation of the classification is in Figure 1, and Table 1 demonstrates the relevant variable statistics.
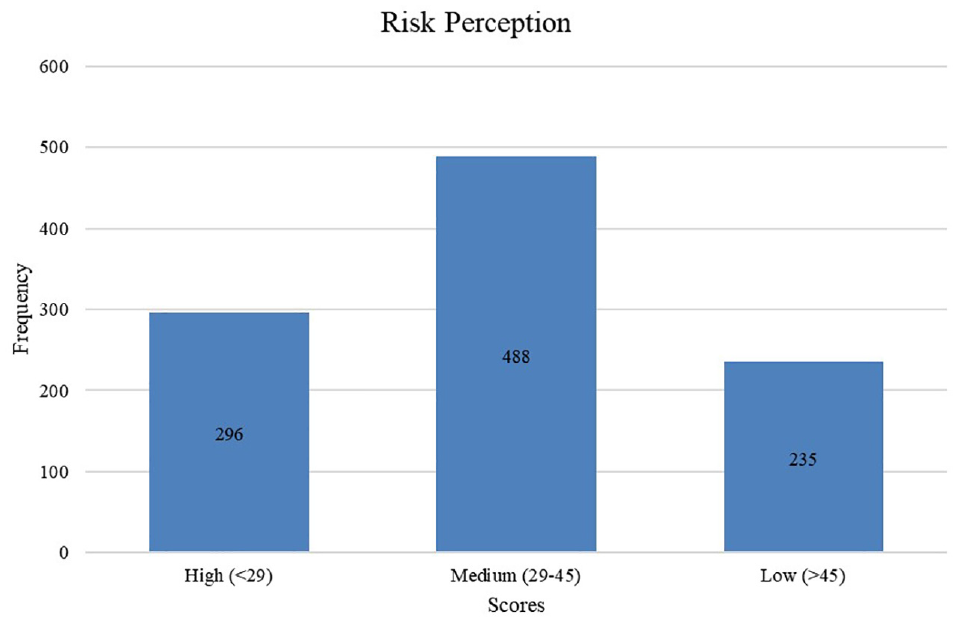
Risk perception histogram.
Profile of the Respondents
Since previous literature has employed quartiles for classifying pedestrian lane-changing behavior and developing the walkability index, this was utilized for categorizing the risk perception variable ( 38 , 39 ). Furthermore, quartiles were also used for categorizing drivers’ behavior and their driving and braking performance ( 40 , 41 ).
The vendors in the low-risk perception group were 63%; in contrast, more than 85% of pedestrians perceived risk in high-to-medium categories. Additionally, the tendency of grouped jaywalking was comparatively less in the category of low-risk perception. Age and monthly income groups were clustered into three classifications each based on the distribution. Middle-aged (25–50 years), young (<25 years), and respondents with lower monthly income (<20 k BDT) were associated with lower risk perception. Moreover, the risk perception of pedestrians who had received formal education was comparatively higher in high-risk perception.
A pilot survey and expert advice created categories of accepted yielding distances. Respondents accepting smaller gaps (<5 ft) demonstrated a risk perception. Interestingly, participants without previous near-crash experiences perceived risk as higher than the ones with previous near-crash experiences. Classification of aggressive behavior was done similarly to that of “risk perception,” classified based on total scores (15): low (lower quartile: <4), medium (middle quartile: 4–6), and high (upper quartile: >6). Again, respondents with high and medium aggressive behaviors had more than 35% lower risk perception.
Methodology
Overall Approach
Figure 2 illustrates the self-explanatory workflow adopted in this research. The following sections briefly discuss the modeling methods employed in this study. Based on descriptive statistics and the model outcomes, a discussion is presented, a conclusion drawn, and appropriate policies are suggested.
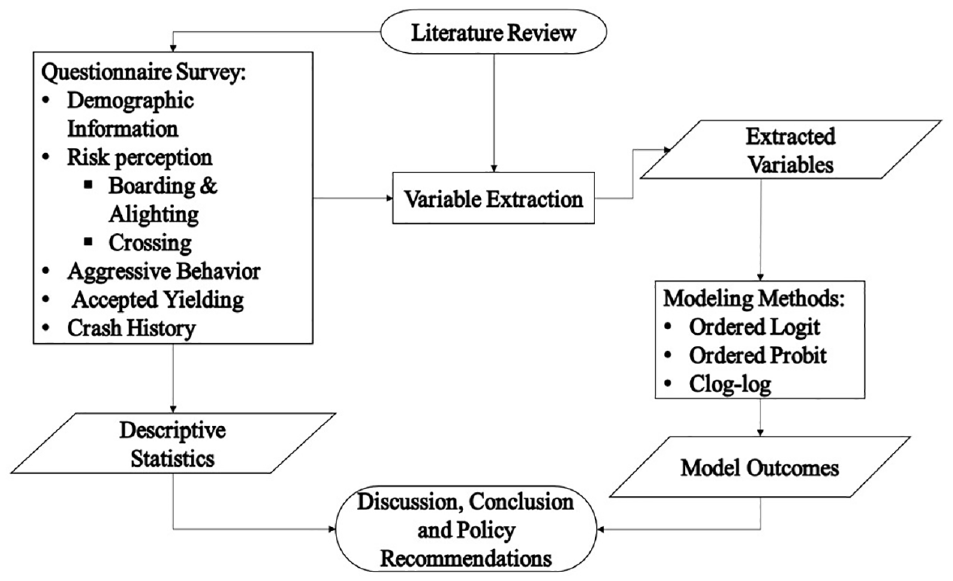
Work-flow illustration.
Ordered Logit and Probit Models
As the dependent variable “risk perception” was developed on an ordinal scale, ordinal logit/probit models were used for the analysis. Ordered logit/probit assumes that the computed coefficients of the parameters are equal and persistent across all risk levels, which is called the proportional line or proportional odds assumption ( 42 ). The model can be written as Equation 1 ( 43 ):

where
The latent variable

The probability function for a particular ordinal outcome is (Equation 3):
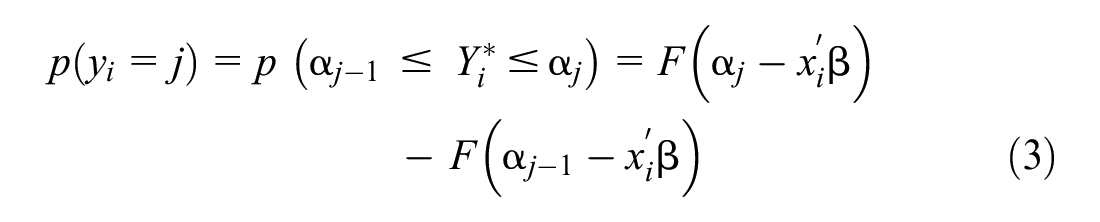
where
or ordinal logistic regression, F = logistic cdf
for ordinal probit regression, F = standard normal cdf F = Φ(.).
Complementary Log-Log (Clog-Log) Model
Complementary log-log models are typically applied when an occurrence’s likelihood is minimal or very high and, in contrast to logit and probit, the complimentary log-log function is asymmetrical ( 44 ). The complementary log-log transformation is like the logit model for low values, but the transformation tends to approach infinity slower than the probit or logit when the likelihood rises ( 45 ). According to complementary log-log, the log-likelihood function is (Equation 4) ( 44 ):

where
The analysis was performed using Python 3.9.10 compiler in Jupyter Notebook. The maximum likelihood method was used for estimating the model outcome (Equation 5). Explanatory variables having a p-value <0.10 were kept in the final models (Table 3, Supplemental Table A1 and A2).

where
Model Comparison
To evaluate the performance of the order logit, order probit, and clog-log model, Akaike information criterion (AIC) and Bayesian information criterion (BIC) were used. AIC and BIC evaluate the potential models by examining their ability to approximate reality and reduce the loss of information ( 46 ). The distinction between the two is that BIC penalizes parameter count severely along with sample size, but AIC penalizes parameter count alone ( 46 – 48 ). Either one or both can be used for model comparison since neither has a considerable advantage over the other because AIC and BIC aim at different issues ( 48 , 49 ). Nevertheless, AIC ignores the sampling variability of the approximated parameters and is inconsistent, which is why BIC is employed alongside AIC as an alternative model selection criterion ( 49 ).
AIC (Equation 6), and BIC (Equation 7) equations are as follows ( 50 – 52 ):


where
N = number of observations.
AIC and BIC values compare the model fits and complexity by neutralizing the criterion for the number of independent variables included in the model. Additionally, the goodness of fit of the models was evaluated using the log-likelihood model using Equation 8:

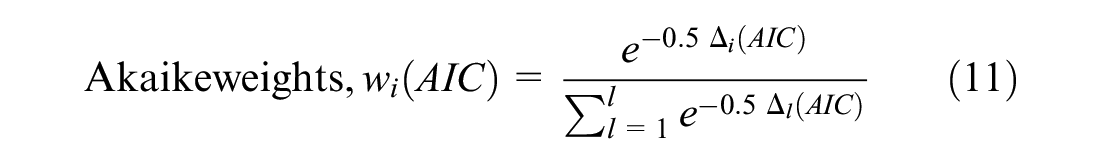
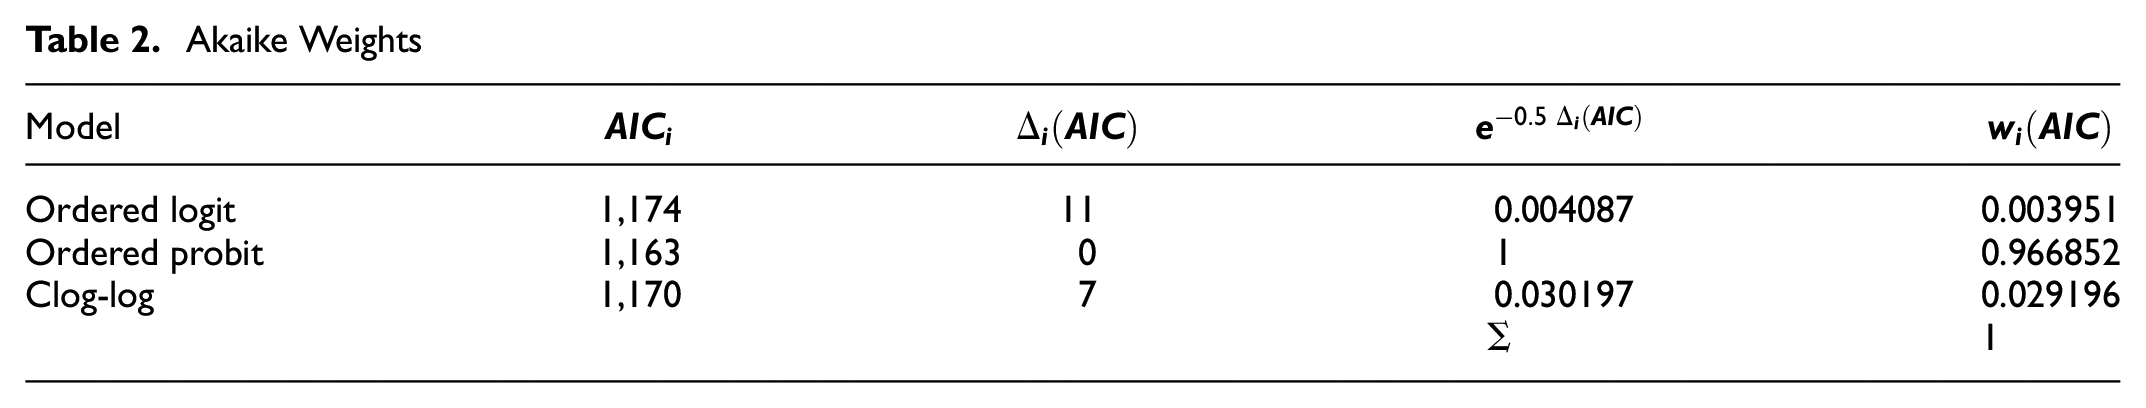
In the case of minor differences in AIC values, there is a possibility of an inaccurate conclusion, as raw AIC is not capable of explaining the weight of evidence for the contending models ( 49 ). To address this phenomenon, a third metric “Akaike weight” was employed for model comparison. Akaike weight is utilized for examining the strength of evidence for the contending models and is approximated by normalizing the apparent likelihoods ( 46 ). Lastly, the ratio of the Akaike weights demonstrates the acceptability of the contending models.
The Akaike weight was estimated following Equations 9, 10, and 11 below ( 49 ):
Computing the AIC differences with respect to the best model (minimum AIC):

Using the AIC differences, relative likelihood of the models is then calculated:

Finally,
where
Analysis and Results
All three models developed in this study were fitted using the same dataset, and the model with the least AIC and BIC values was selected to explain the results (
53
). Figure 3 illustrates the AIC and BIC values for the models, and the ordered probit was the best fitting with the least AIC (1,163) and BIC (1,326) values. The log-likelihood values for ordered logit, ordered probit, and clog-log models were: −552.2, −548.6, and −554.01, respectively, demonstrating the statistical superiority of the ordered probit models over the other two, as the ordered probit had the lowest log-likelihood values. Eventually, the ordered probit model is
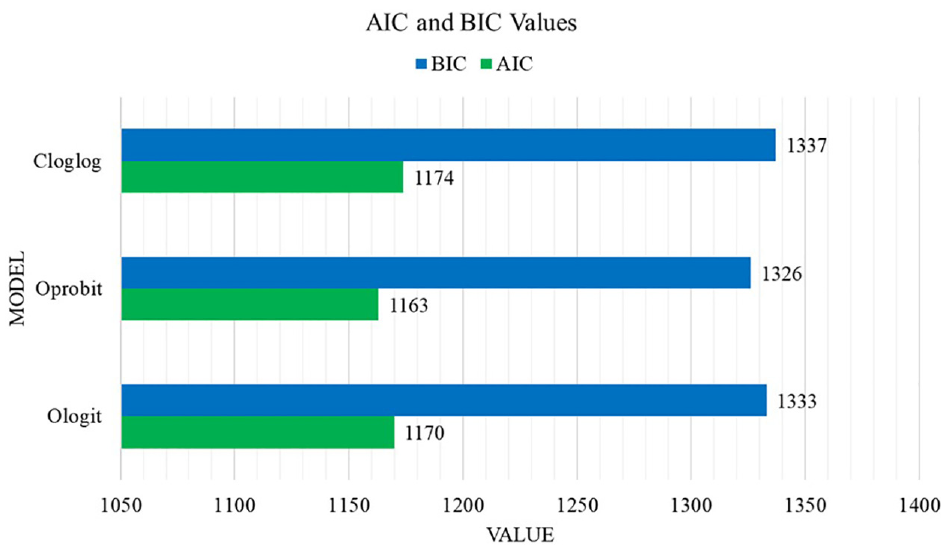
Akaike information criterion (AIC) and Bayesian information criterion (BIC) values for the models.
Akaike Weights
Model Outcome
The outcomes of the ordered probit model are presented in Table 3. (For interested readers, the output of the order logit and clog-log model are reported in the Appendix. According to the estimated results of the ordered probit model in Table 3, “pedestrian type_vendor” was significant and positively associated with the model outcome, indicating that vendors have a lower risk perception than the baseline category, “general pedestrians.” As high-risk perceptions result in safer and protective behavior, vendors are likely to exhibit riskier behavior than general pedestrians ( 33 , 34 ). This may be because of vendors’ chaotic and careless road crossing and car-following movements in heterogeneous traffic flow conditions ( 12 ). Furthermore, vendors’ high-risk-taking mindset may be correlated to a lack of authorized bus stop facilities and damaged median barriers ( 17 ).
Results of Ordered Probit Model
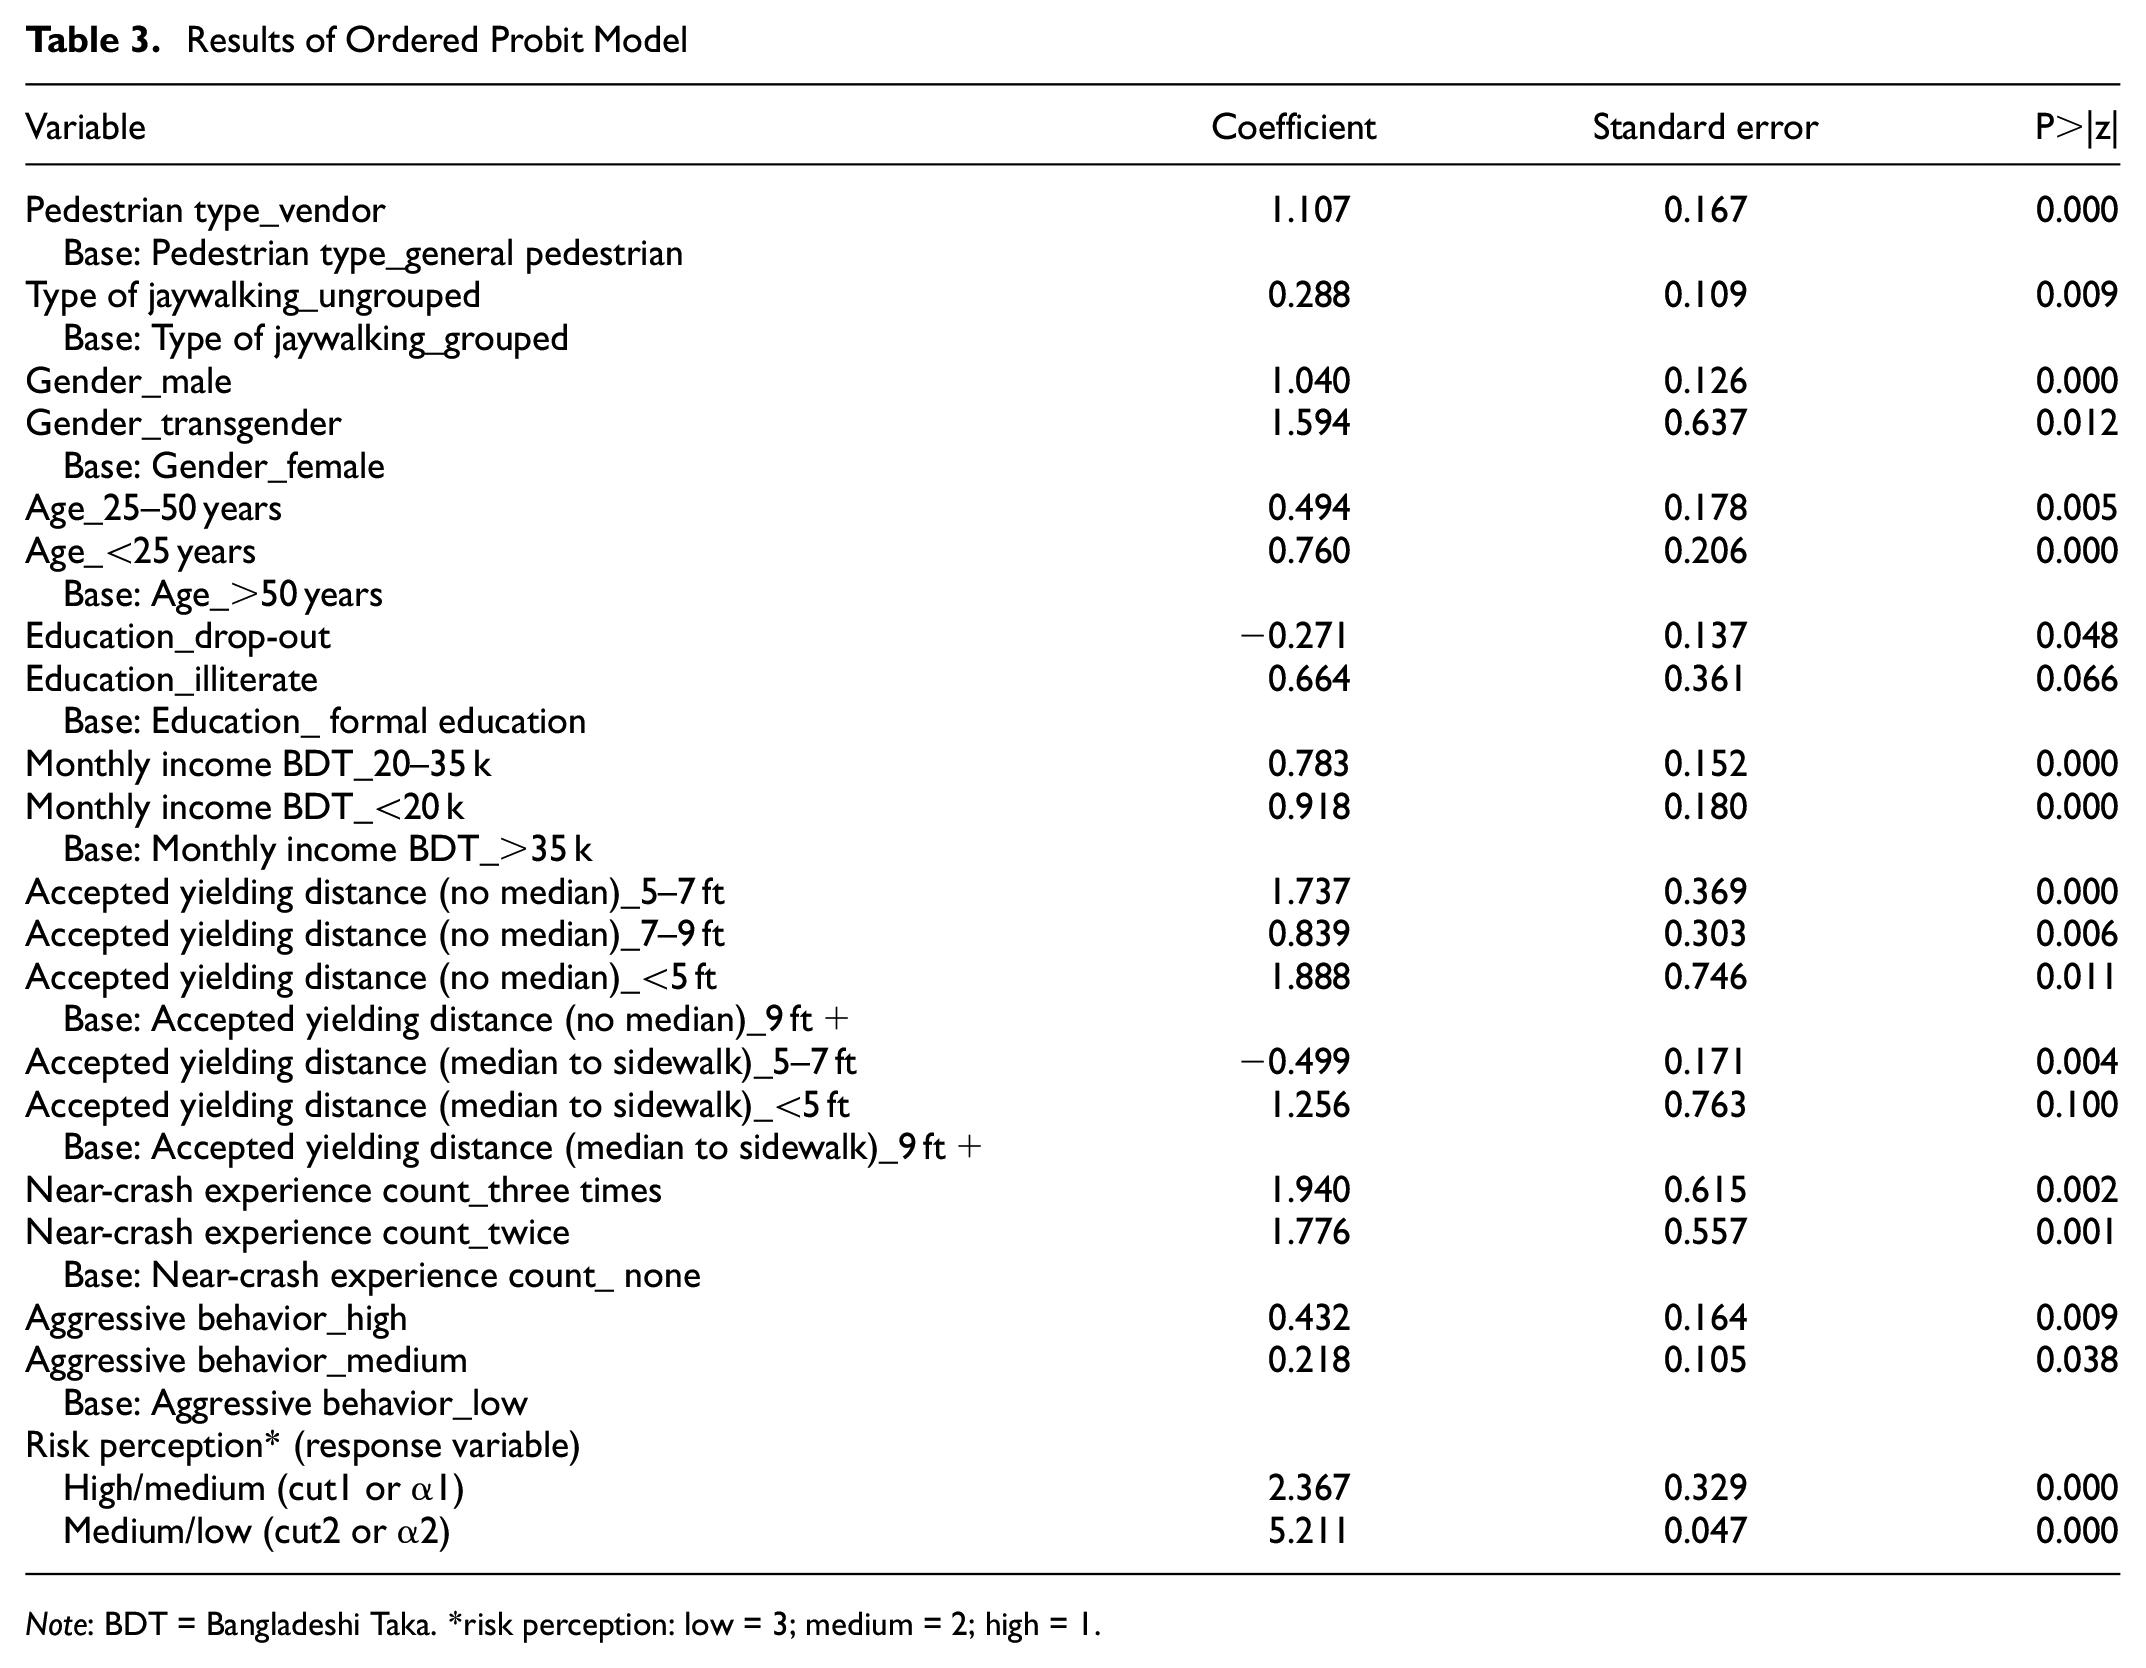
Note: BDT = Bangladeshi Taka. *risk perception: low = 3; medium = 2; high = 1.
Ungrouped jaywalking was significant, meaning crossing alone or in a herd is associated with perceived risk, which supports previous studies ( 13 , 18 , 19 , 22 , 29–31). The positive coefficient value indicates that pedestrians crossing alone had a lower risk perception. This finding matched the literature, which states that crossing alone is riskier than crossing in a herd ( 13 , 22 , 26 ). However, a study conducted with data from Iran had a contrasting result suggesting that grouped jaywalking was riskier than ungrouped jaywalking ( 29 ). Such disparity may be because of the different associations of social and cultural factors to walking behavior. As “pedestrian type_vendor” and “type of jaywalking_ungrouped” both positively correlated the model outcome and tended toward lower risk perception, vendors jaywalking alone should also take a higher risk than any other pedestrian type who are illegally crossing in a group, considering all the other factors in the model are kept constant.
Accepted yielding distances (no median) coefficients (positive) gradually decreased from <5 ft to 5–7 ft to 7–9 ft for the base 9 ft+ (Table 3). Therefore, the respondents who chose to yield to the lower gaps were prone to crashes and had a lower risk perception. Thus, accepting more considerable yielding distances for crossing was a protective measure (high-risk perception). Similarly, accepted yielding distances from the median to the sidewalk gradually decreased from shorter distances to longer.
Interestingly, respondents with previous near-crash history (two and three times) had a low perception of risk (Table 3). The probable reason could be that the count of near-crash experiences makes them more careless as they survived those events in the past and accept such risks as part of their life. Participants with a previous near-crash count of two or three times are more likely to be vendors, as vendors had a lower risk perception than pedestrians. Compared with base category low aggressive behavior, medium and high aggressive behaviors meant participants would take high-risk as their perception of risk was lower (Table 3). The probable reasons might be high emotional stress, involvement with alcohol, victimization through violence in the past, and so forth.
Gender, age, income level, and education were found to be statistically significant (Table 3) ( 12 , 13 , 22 , 30 ). Male and transgender people had a lower risk perception than the base category. Thus, male vendors and general male pedestrians exhibit higher-risk-taking behavior than females ( 26 ). Young and middle-aged vendors and general pedestrians showed a lower perception of risk than the elderly ( 19 , 22 , 29 ). The possible cause could be that the young have a higher-risk-taking tendency; they are less concerned about consequences and enjoy the exhilaration that comes with taking risk. For middle-aged people, it can be their obligation to arrive on time (general pedestrians) or maximize their income (vendors) or other social or cultural factors.
Compared with pedestrians who have received formal education, drop-out respondents had a greater chance of taking high-risk (low-risk perception). The potential reason could be that pedestrians without any form of formal education have more constraints in life to take more risk and they may not judge risk levels more carefully. On the contrary illiterates were showing high risk perception, but the variable was not significant at 5% level of significance. Pedestrians (general and vendor) with low (<20 k BDT) and medium (20–35 k BDT) level of monthly income would perform more risky pedestrian maneuvers, as suggested by the positive variable coefficients, than those belonging to the high-income group. The underlying reason could be related to the level of education as it influences income ( 13 , 30 ).
The data employed in this study vividly suggests that vehicle-to-vehicle vendors perceive risk differently than general pedestrians. This disparity in risk perception could be associated primarily to vendors’ day-to-day economic struggle and low income level ( 54 ). As a result, they constantly rush, face intense rivalry over selling items, and engage in risky crossings, movements, and maneuvers in critical traffic situations ( 12 ). Furthermore, vendors’ lower level of education might be correlated to their risk perception, if it hinders judging risk levels and making rational decisions ( 55 ). Moreover, the frequency of facing and surviving multiple past near-crash events and higher aggressive behavior might have made vendors reckless. In addition, the higher aggression led them to take more risks, as there is a strong positive association between increased risk-taking and elevated levels of aggression ( 56 ). Finally, other unobserved factors associated with risk perception may include environmental conditions, characteristics of the built environment, traffic conditions, and various road segments ( 57 ).
Policy Recommendations and Conclusions
This study aimed to compare the risk perceptions of vehicle-to-vehicle vendors and general pedestrians, and to evaluate vendors who jaywalked in groups and alone, in a developing country, here, Bangladesh. For that, a questionnaire survey was used to collect data of general pedestrians and vendors concerning their risk perception, type of jaywalking, demographic information, accepted yielding distance, aggressive behavior, and near-crash experiences. Ordered logit/probit models and complementary log-log models were implemented for the analysis, and ordered probit was used for interpreting the results as it outperformed the other models.
From the analysis of 1,019 responses, the study’s conclusions were drawn. The most important factors are: pedestrian type, type of jaywalking, gender, age, education, monthly income, accepted yielding distance (no median), accepted yielding distance (median to sidewalk), near-crash experience count, and aggressive behavior. It was discovered that vendors perceived risk differently from other pedestrians. In addition, vendors who crossed the street alone sensed less risk than those who did so in a group. Therefore, solo vendors that jaywalk presumably take a greater risk. The lowest risk perception was also demonstrated by youthful vendors, middle-aged vendors, illiterate vendors, and moderate-to-low-income vendors who exhibited medium-to-high aggressive behavior. It is indeed interesting that vendors with prior near-crash experience had low risk perceptions.
The findings from this study could be utilized for taking policy measures for enhancing pedestrian and vendor safety. Jaywalking vendors are part of reality in many societies and this cannot be changed overnight. Introducing awareness campaigns to educate vendors about road traffic dangers can help to change their perception ( 18 , 22 , 29 ). Fixing broken barriers to separate vendors’ movement from traffic flow can reduce their tendency to jaywalk ( 17 ). Creating pedestrian refuge islands and turning uncontrolled intersections into controlled ones can reduce vendors’ ungrouped illegal crossing ( 22 , 29 ). Designated bus stops would reduce vendors’ risky boarding and alighting ( 18 ). However, these measures are temporary and eventually there should be policy in place to gradually segregating vendors from the traffic system by rehabilitating them to proper street markets such as night markets in Shanghai, China, or Sunday markets in Kashmir, India, and Perlis, Malaysia ( 58 – 60 ).
This study filled several gaps in the previous research targeting vendors. Even though this research identified the significant variables, it did not observe the underlying causal relationships between the variables. Furthermore, some variables had an underrepresentation in particular categories. The analysis did not include other factors such as walking speed, clothing, weather, trip purpose (for general pedestrians), familiarity with the environment, and so forth, which may have influence on exhibited pedestrian behavior. There might be a possibility of violating the parallel line/partial odds assumption for the ordered probit model; therefore, future studies can employ the proportional odds tests for verification or apply other suitable methodological approaches. Future research can analyze vendors’ risk-taking tendencies by observing their behavior and movements. Moreover, investigating drivers’ perceptions of vehicle-to-vehicle vendors can reveal other crucial factors. Lastly, future research can employ principal component analysis for categorizing risk perception variables rather than using quartiles.
Supplemental Material
sj-docx-1-trr-10.1177_03611981231182927 – Supplemental material for Risk Perception of Vehicle-to-Vehicle Vendors and General Pedestrians: A Comparative Study
Supplemental material, sj-docx-1-trr-10.1177_03611981231182927 for Risk Perception of Vehicle-to-Vehicle Vendors and General Pedestrians: A Comparative Study by Farhan Anjum Badhon, Shoumic Shahid Chowdhury, Tashdid Haque, Saifur Rahman, Md Asif Raihan, Moinul Hossain and Md. Abdullah Al Mamun in Transportation Research Record
Footnotes
Author Contributions
The authors confirm contribution to the paper as follows: study conception and design: M. Raihan, M. Hossain; data collection: A. Al Mamun, M. Hossain; analysis and interpretation of results: F. Badhon, S. Chowdhury, T. Haque, M. Raihan, M. Hossain; draft manuscript preparation: F. Badhon, S. Chowdhury, T. Haque, S. Rahman, M. Raiha, M. Hossain. All authors reviewed the results and approved the final version of the manuscript.
Declaration of Conflicting Interests
The author(s) declared no potential conflicts of interest with respect to the research, authorship, and/or publication of this article.
Funding
The author(s) received no financial support for the research, authorship, and/or publication of this article.
Supplemental Material
Supplemental material for this article is available online.
References
Supplementary Material
Please find the following supplemental material available below.
For Open Access articles published under a Creative Commons License, all supplemental material carries the same license as the article it is associated with.
For non-Open Access articles published, all supplemental material carries a non-exclusive license, and permission requests for re-use of supplemental material or any part of supplemental material shall be sent directly to the copyright owner as specified in the copyright notice associated with the article.