
Abstract
As a critical application in intelligent transportation systems, traffic state prediction still faces various challenges, such as unsatisfactory capability of utilizing multi-source data and modeling spatiotemporal network relevancies. Therefore, we propose a trajectory-based multi-task multi-graph convolutional network (Tr-MTMGN), a novel spatiotemporal deep learning framework for traffic state prediction on a citywide scale. This method firstly mines the underlying information from vehicle trajectories and designs a multi-graph convolution block to investigate spatial correlations. Sequentially, the multi-head self-attention layer is integrated into the multi-task learning framework to capture the temporal dependencies of the traffic state. The proposed model was evaluated on field data collected in Zhangzhou, China, and demonstrated superior performance when compared with existing state-of-the-art baselines.
Keywords
Traffic state prediction is a process of mining traffic patterns and predicting traffic trends. As an important component of the intelligent transportation system, accurate results of traffic state prediction can efficiently ease congestion, provide decision-making support for traffic managers, and aid drivers to make an appropriate travel planning.
Predicting the future traffic state is a challenging task owing to the complex spatiotemporal correlation of traffic state data. A great deal of research adopts deep learning methods to solve this task. The latest works often apply the graph convolutional network (GCN) model to heterogeneous spatial correlations and exploit sequence modeling for capturing non-linear temporal dependence ( 1 – 3 ). Although significant progress has been made toward improving the predictive accuracy, the following issues have not been fully resolved.
First, most existing methods consider spatial distance correlation only and ignore trajectories when modeling spatial features. Trajectories can instructively provide knowledge about the diffusion of traffic flow and behavioral driving choices. An example is illustrated in Figure 1. Detectors C and E are more relevant to Detector A compared with Detector D because of the large volume of traffic passing through them (the arrows indicate the direction of traffic flow, and thicker lines indicate greater flow). Moreover, previous methods generally predicted only one type of traffic state parameter, ignoring the interaction between different traffic state parameters.
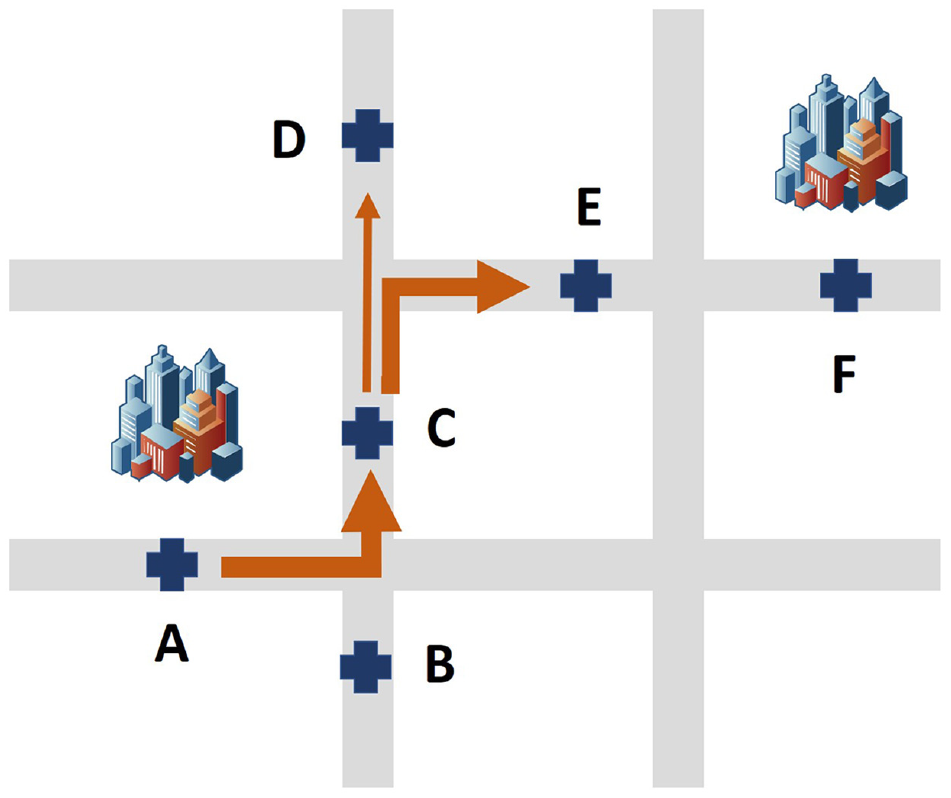
An example of different spatial correlations among loop detectors.
To address the above shortfalls, this study proposes a trajectory-based multi-task multi-graph convolutional network (Tr-MTMGN) to predict traffic speed and volume simultaneously for arterial networks in both short-term and long-term. The main contributions of this paper are summarized as follows:
Using the skip-gram model, a trajectory transition relevance matrix is constructed by investigating the transition patterns of the trajectory and traffic flow diffusion among loop detectors.
A multi-graph convolution block is designed to fuse various relevance graphs and model the spatial correlations of the traffic state.
A multi-head self-attention layer is integrated into the multi-task learning framework to capture the temporal dependencies of the traffic state.
Accordingly, extensive experiments were conducted to evaluate the performance of the proposed model on a field-collected dataset in Zhangzhou, China, and a significant improvement was found compared with other state-of-the-art baselines.
Literature Review
Traffic state prediction has been developed for many years domestically and abroad and can be divided into model-driven and data-driven methods.
The model-driven approach begins with the relationship between traffic volume, speed, and density, and includes the queuing-theory model, the cell transmission model, and the micro basic graph model ( 4 – 6 ). However, these traffic state prediction models must be established based on detailed prior knowledge. Otherwise, it is difficult to describe the complex traffic state data features.
The data-driven method predicts and evaluates the traffic state based on the statistical regularity of data, and is divided into parametric and non-parametric models. Parametric models include linear regression models and Kalman filtering models ( 7 – 10 ). These models have a simple algorithm and convenient calculation because they presuppose a regression function the parameters of which are determined using the original data. However, owing to their static dependence on a singular assumption, it is difficult for these models to fit the dynamic non-linear trend of the traffic state. Non-parametric models overcome this limitation effectively and learn the statistical regularity by adaptively fitting a function using sufficient historical data. Examples of non-parametric models include K-nearest neighbor models, support vector regression models, fuzzy logic models, and Bayesian network models ( 11 – 16 ). Unlike the traditional parametric model, these models do not rely on a static hypothesis and can thus capture the dynamic non-linear characteristics of traffic data. However, these methods are only applicable for predicting the traffic state on a single road or small-scale experimental area, and it is therefore difficult for them to perform effectively around a complex urban road network.
In recent years, deep learning models have attracted considerable attention because of their good predictive performance and strong data fitting ability. Research on traffic state prediction methods based on deep learning has mainly focused on the design of deep learning models for the extraction of spatiotemporal characteristics from traffic data. Early traffic prediction methods based on deep learning mostly combined convolutional neural networks (CNNs) and recurrent neural networks (RNNs) to model the spatial and temporal correlations of the traffic state ( 17 – 19 ). These studies usually divide the experimental area into grids, which cannot reflect the connectivity of road sections and the topology of the road network.
Therefore, some researchers proposed graph neural networks (GNNs) as alternatives to CNNs to extract the features of non-Euclidean data. Yu et al. proposed a spatiotemporal graph convolution network (STGCN) to extract spatiotemporal features from traffic data by stacking a spatiotemporal convolution block (ST-Conv block) composed of a GCN and a gated CNN ( 20 ). Guo et al. proposed an attention-based spatial-temporal graph convolutional network (ASTGCN) that integrates the attention mechanism ( 21 ). Geng et al. predicted the demand for ride-hailing in urban areas and proposed a spatiotemporal multi-graph convolutional network (ST-MGCN) ( 22 ). Lv et al. proposed a deep learning framework for traffic flow prediction, known as temporal multi-graph convolutional network (T-MGCN), by identifying several semantic correlations between roads and coding them into multiple graphs ( 23 ). Chen et al. proposed multi-range attentive bicomponent GCN (MRA-BGCN), which constructs a node graph and an edge graph based on the distance between nodes and the interaction patterns of different edges, respectively ( 24 ). Lu et al. proposed a spatiotemporal adaptive gated graph convolution neural network (STAGCN) to selectively extract spatial correlations in multilayer GCNs and correct the information bias caused by predefined spatial correlation ( 2 ). Zhang et al. proposed a deep-learning model: dynamic spatial-temporal convolutional network (DSTCN), which can generate dynamic graphs based on data to represent dynamic spatial relationships between road segments ( 25 ). Li et al. designed the fusion graph to extract various spatial correlations between different regions by fusing spatial graph, semantic graph, and spatial-semantic graph ( 26 ). Li et al. designed the dynamic adjacency matrix generated from a hyper-network to describe the dynamic characteristics of road networks more effectively ( 27 ).
The above methods attempt to accurately describe the spatial dependence of the traffic state. However, only a few studies have considered the trajectory information of vehicles. Trajectories imply the patterns of traffic flow transition and diffusion, which are of great reference value for the prediction of traffic state.
Methods
This section elaborates on the proposed Tr-MTMGN model. The architecture of Tr-MTMGN comprises four modules: an input layer, a multi-graph convolution layer, a multi-task multi-head self-attention layer, and an output layer, as shown in Figure 2. The input layer aggregates the traffic speed and volume data of each loop detector. The multi-graph convolution layer captures multiple spatial dependencies based on historical trajectories. The multi-task multi-head self-attention layer, based on a soft-parameter sharing strategy, extracts temporal patterns of speed and volume. The output layer produces multiple time steps in the prediction results for speed and volume. These modules are described in detail below.
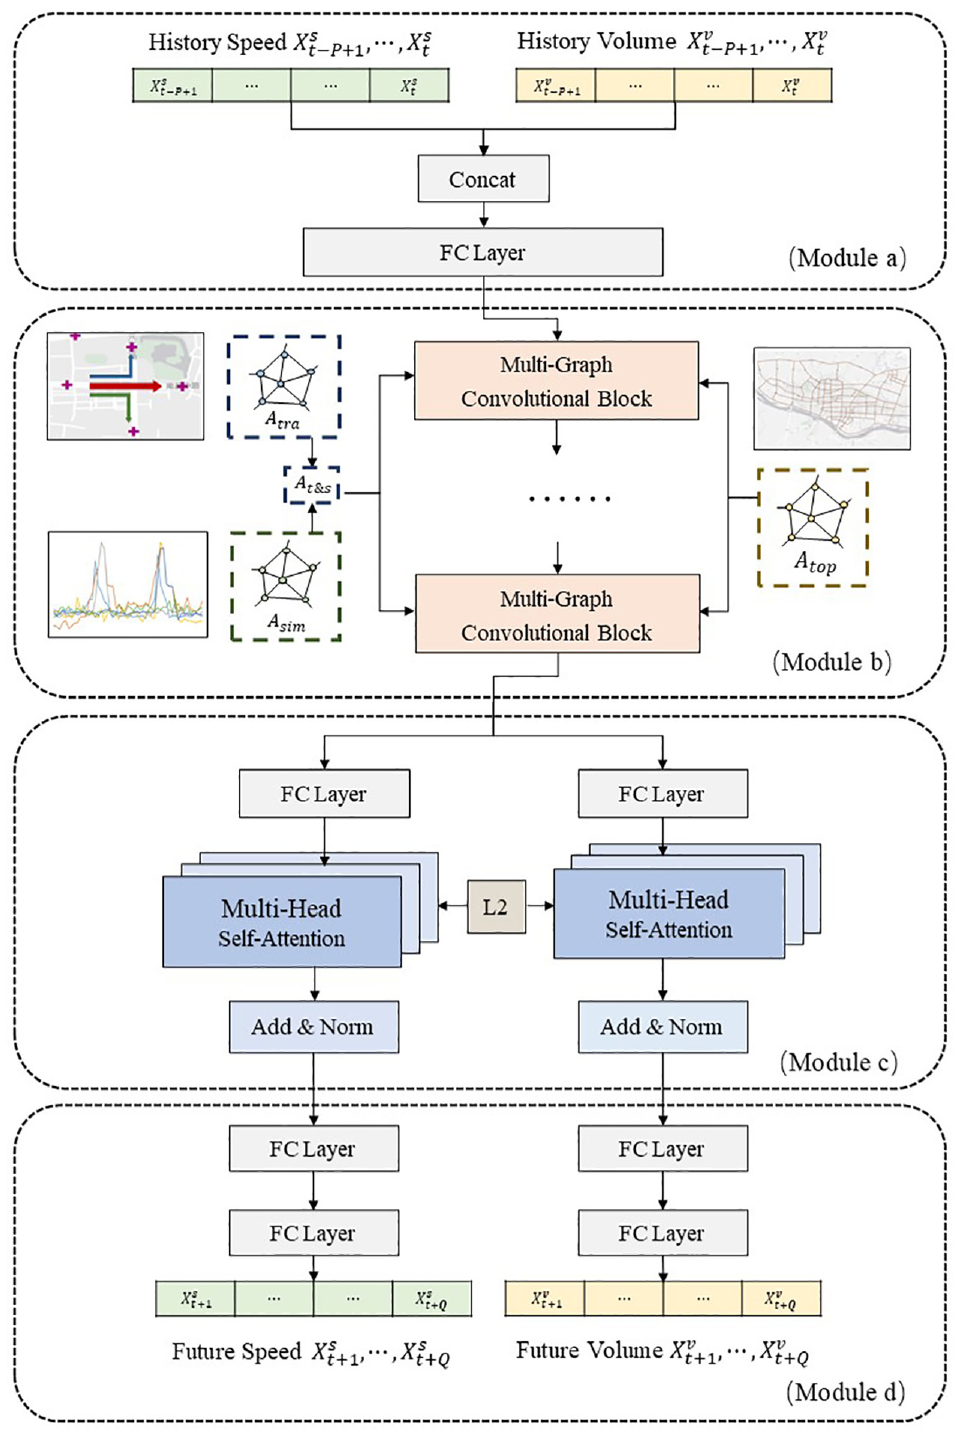
The architecture of trajectory-based multi-task multi-graph convolutional network (Tr-MTMGN).
Preliminaries
Definition 1 (loop detectors network graph): In this paper, we define the loop detector network on a graph
Definition 2 (traffic state): The traffic state is measured by the average speed of one timestep (5 min) of the loop detector (hereinafter referred to as the speed) and the number of vehicles passing through the loop detector (hereinafter referred to as the volume). The speed and volume are defined as
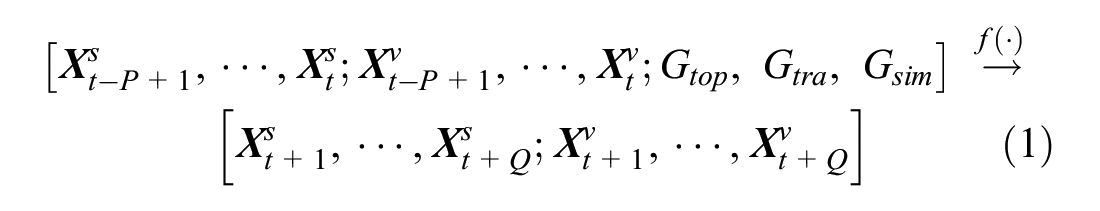
Problem (traffic state prediction): The traffic state prediction problem can be regarded as finding a function f (·) to map the
Construction of Multiple Loop Detector Graphs
We modeled three types of correlation among loop detectors graphically as follows: 1) weight topological graph
Trajectory transition graph
In an urban road network, the traffic state of a road segment has a strong correlation with the upstream and downstream road segments. For example, the congestion of a road section may be caused by its upstream section, where numerous vehicles moving downstream could appear. Trajectories provide information about vehicles’ origin and destination (O-D), as well as drivers’ choices of routes, which implies the dependence on upstream and downstream flows. Thus, we plan to study trajectory information to infer the laws of traffic flow transition and diffusion.
Node2vec is a widely used graph embedding method. It is based on a random walk strategy and obtains a series of node sequences by adjusting the parameters of breadth-first search and depth-first search ( 28 ). The skip-gram model or Continuous Bag-of-Words Model (CBOW) model is then employed to obtain the embedding vector of each node. Moreover, some traffic state prediction studies adopt node2vec in position embedding ( 29 ). However, sequences based on random walk cannot reflect real traffic situations. Therefore, inspired by node2vec, we used the skip-gram model to capture the patterns of trajectory transition and traffic flow diffusion based on real trajectories instead of random walks.
First, we used the Hidden Markov Model (HHM) map-matching method to match the GPS trajectories to the road section and generate the vehicle paths ( 30 ). Next, the paths were converted into sequences of loop detectors according to the loop-link correspondence table. Analogous to the text corpus data in natural language processing, a sequence of loop detectors can be regarded as a piece of text and each loop detector as a word that makes up the text. We then input these loop-detector sequences into the skip-gram model and train it ( 31 ). The sliding window size in the hyperparameters was used to control the order of the neighbors. We exploited a negative sampling strategy to reduce the computational complexity ( 32 ). Finally, for each loop detector, we obtained the corresponding embedding vector that encodes the trajectory transition information from the trained hidden layer parameters. Figure 3 demonstrates the process of generating the embedding vectors of the trajectory transition features.
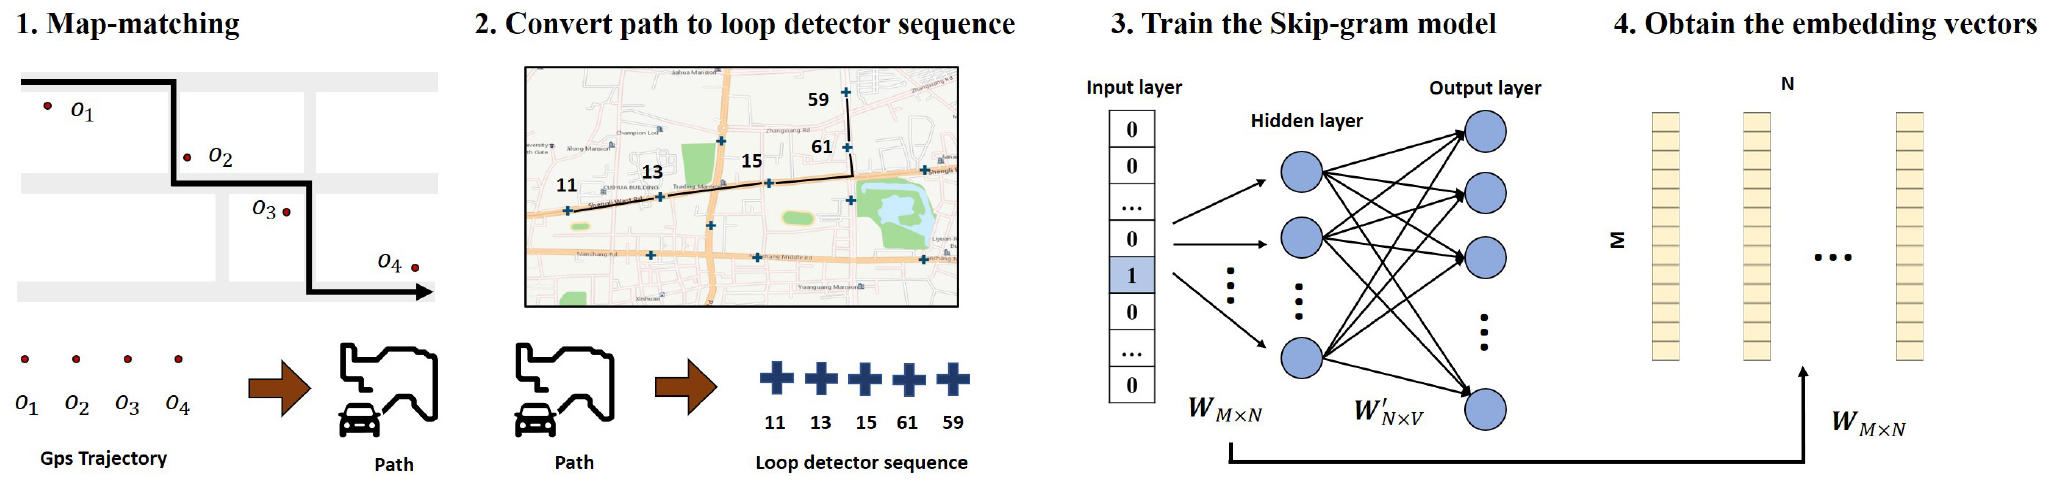
The process of capturing the patterns of trajectory transition.
In this study, cosine similarity was adopted to construct the trajectory transition adjacency matrix. The greater the similarity of the embedding vectors of the two nodes, the greater the number of vehicles on the road between them, which indicates that the two nodes are upstream and downstream, and the traffic states of the two nodes have a strong correlation. The process of constructing the trajectory transition adjacency matrix can be formulated as Equation 2:
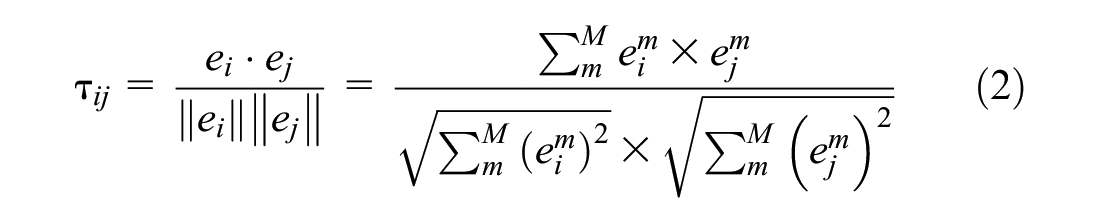
where
2. Weighted topological graph
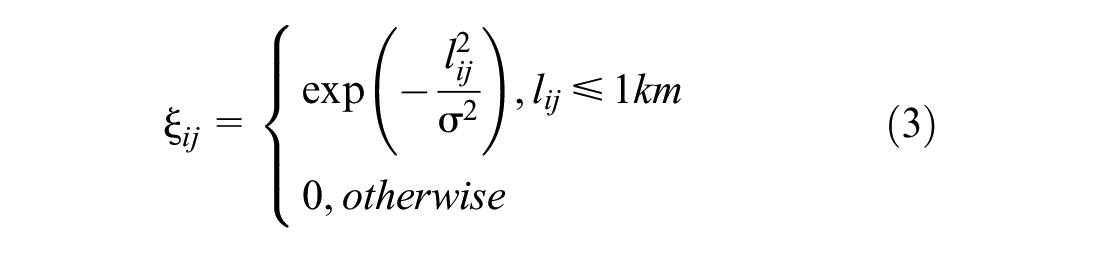
We believe that the closer the loop detectors are to each other, the greater the correlation between them. The weighted topological structure of a road network can be represented as a directed graph
3. Pattern similarity graph
The regularity of the traffic flow diffusion and the transition between loop detectors vary dynamically according to the real-time traffic state. This study extracts the real-time non-linear change pattern of the traffic state to study the dynamic change regularity of the correlation between loop detectors. We designed a different approach to model the nonlinear patterns of traffic and account for dynamic correlations among loop detectors, which consists of two steps.
First, the traffic state tensor

where
Second, the obtained high-dimensional vectors are used to calculate the pairwise dot-product similarity between each node. We used Softmax to normalize the similarity and obtain the elements of the pattern similarity adjacency matrix
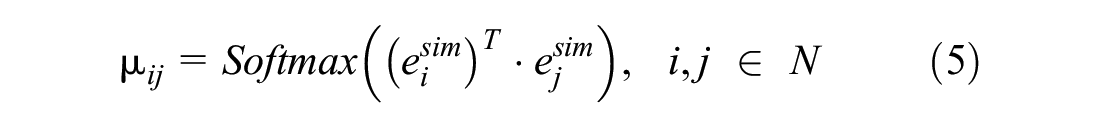
where
It is noteworthy that the parameters of two fully connected layers are co-trained with Tr-MTMGN. The pattern similarity graph is a dynamic graph that adaptively changes with the input data. In this study, it will be used to adjust the weight of the adjacency matrix of trajectory transition graph.
Trajectory-Based Multi-Task Multi-Graph Convolutional Network (Tr-MTMGN)
Module a: Input Layer
The goal of the input layer is to aggregate the speed and volume data of each loop detector. We aggregate the speed tensor
Module b: Multi-Graph Convolutional Layer
GCN is an efficient operation to extract node features through the graph’s structural information. Kipf and Welling proposed a GCN that simplifies ChebNet by a first-order approximation (Equation 6) as follows ( 33 , 34 ):

where
To fuse the spatial correlations of the weighted topological graph
It is difficult to use the trajectory transition graph whose adjacency matrix is fixed to describe the dynamic characteristics of the regularity of the traffic state diffusion and transition. To adjust the adjacency matrix of the trajectory transition graph dynamically, we fuse the pattern similarity graph updated in real time to generate compound adjacency matrix

where
The weighted topology graph adjacency matrix and compound adjacency matrix are then input into different GCNs networks. The outputs of the two GCNs networks are aggregated as the final result of the multi-graph convolution block. The aggregation function includes sum, average, max-pooling, and concatenation. We select concatenation because it can prevent information from disappearing (
2
). The structure of
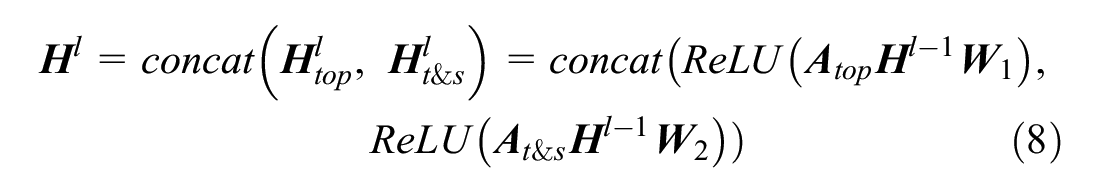
where
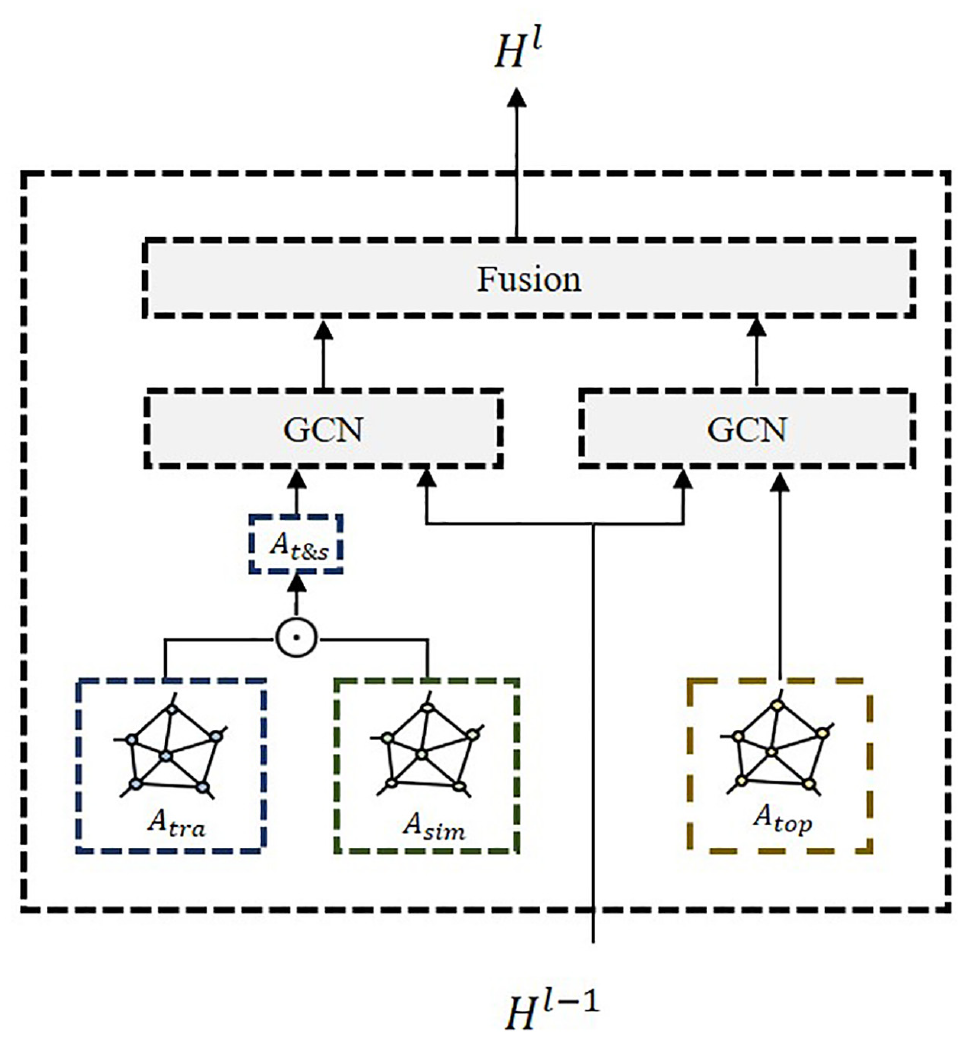
The structure of multi-graph convolution block.
After fusion, we obtain
Module c: Multi-Task Multi-Head Self-Attention Layer
Given the different variation patterns of speed and volume in the temporal dimension, we introduce a multi-task learning framework based on the soft-parameters sharing approach to capture the temporal dependencies of speed and volume. Although long short-term memory (LSTM) and gated recurrent unit (GRU) have been widely used in time-series prediction tasks, RNN-based models still have several limitations, such as time-consuming training and unstable gradients. Meanwhile, the attention mechanism has achieved outstanding results in time-series prediction. Therefore, we utilize a multi-head self-attention mechanism to extract the features in the temporal dimension, as shown in Figure 5 ( 35 ).
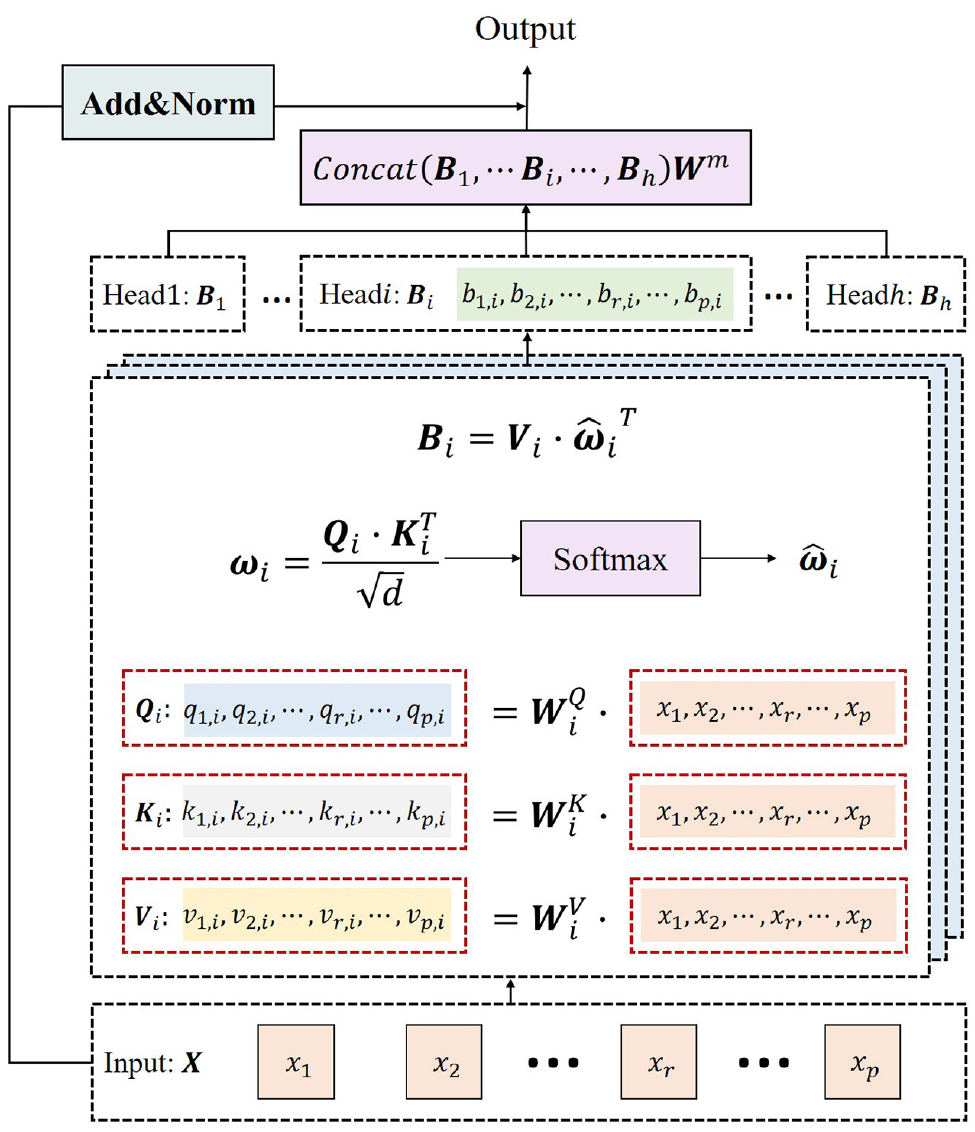
The structure of multi-head self-attention mechanism.
First, we feed the output of the multi-graph convolution layer,
Second, for head

Third, we use scaled dot-product attention to calculate the attention score
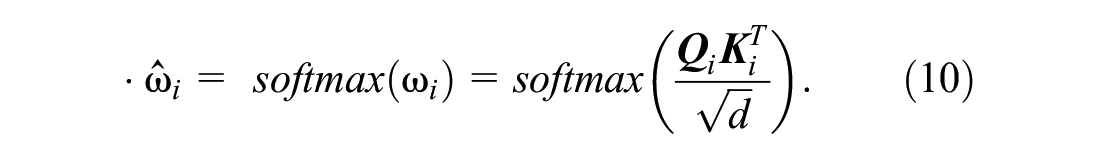
Fourth, we derive

Finally, we concatenate all outputs of each head and project again to obtain the final values, as formulated in Equation 12:

Module d: Output Layer
When we obtain the high-dimensional spatiotemporal features of speed and volume, we make a multi-step prediction from two distinct fully connected layers that have two hidden layers for two tasks. We set the output-channel number of the last fully connected layer as the length
Loss Function of Multi-Task Learning Mode
We aim to minimize the prediction error with regard to the speed and volume. In the multi-task framework (multi-head self-attention layer), we utilize the L2 norm of two network parameters as a constraint to encourage parameter similarity. The loss function is defined by Equation 13:
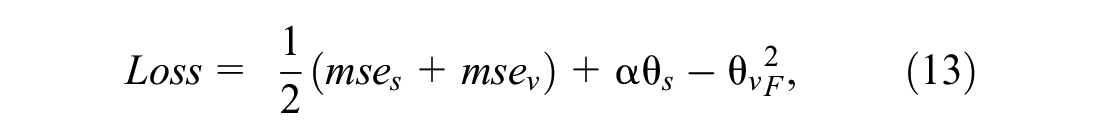
where
Datasets
In this section, we evaluate the performance of the proposed Tr-MTMGN, on the comprehensive urban traffic dataset of Zhangzhou, China. The dataset includes traffic state data from loop detectors and trajectory data from floating vehicles. The road map and the distribution of loop detectors are presented in Figure 6.
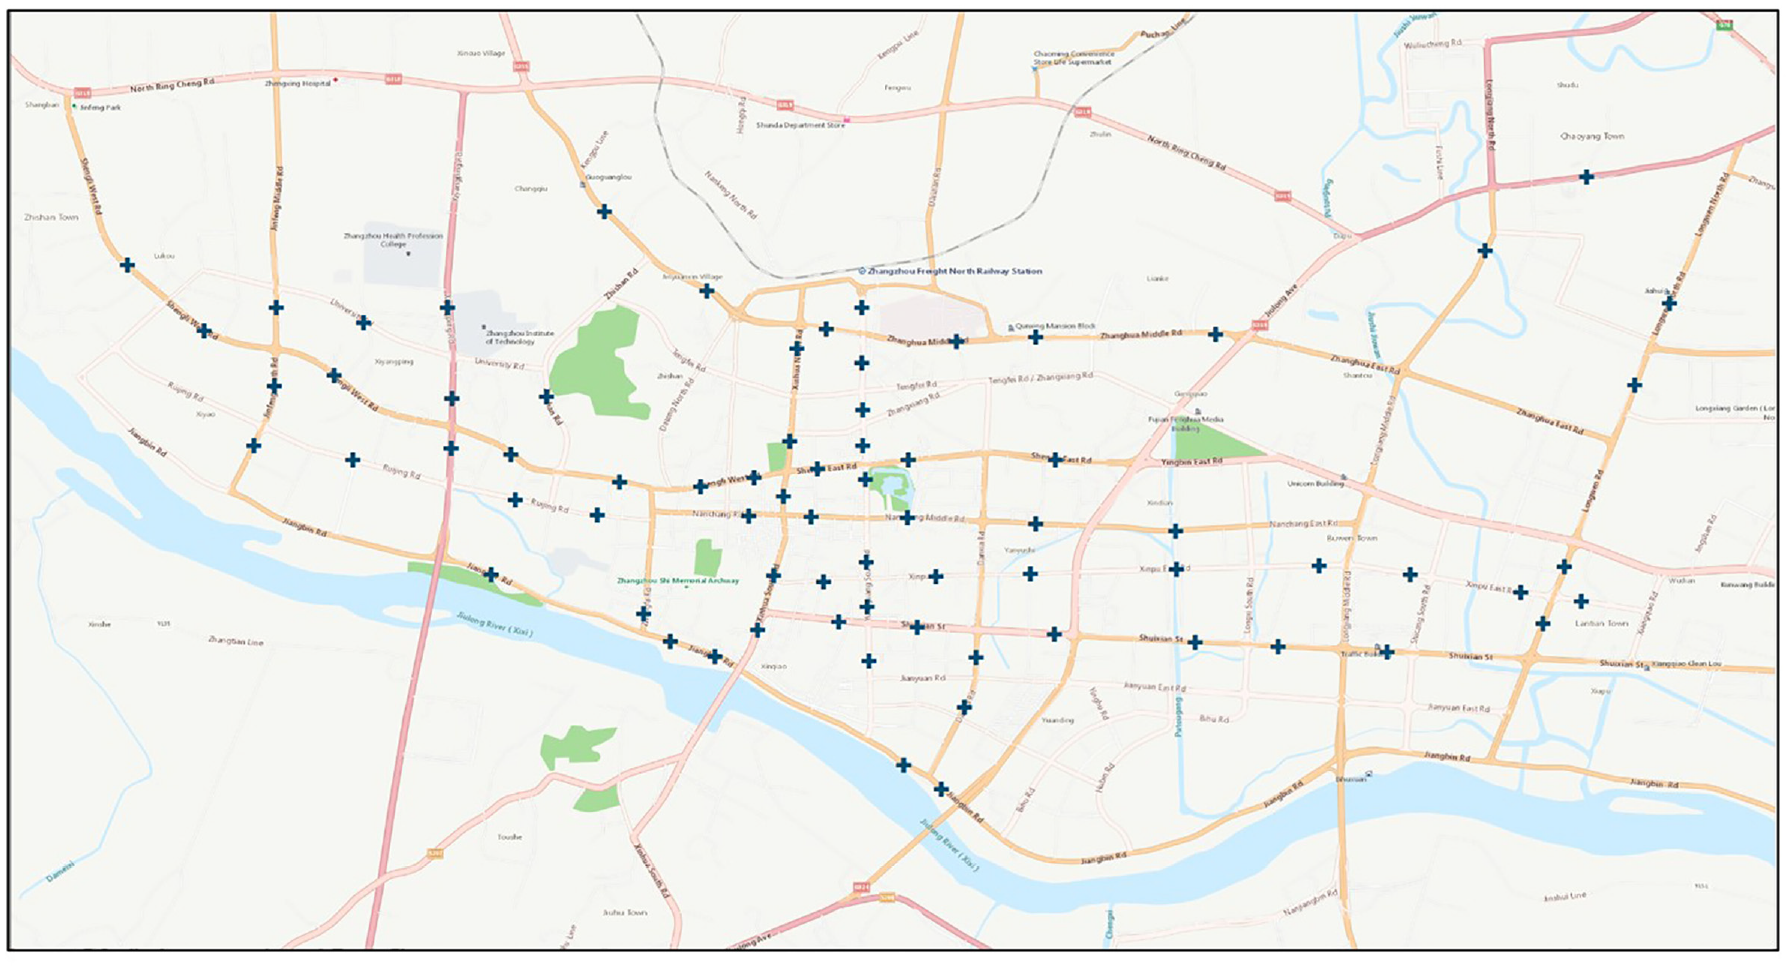
The distribution of selected loop detectors on Zhangzhou dataset.
Experimental Results And Comparison
Experiment Setting
Z-score normalization was applied for data preprocessing. Of the traffic state data, 70% are used for training, 20% for testing, and the remaining 10% for validation (
29
). We implemented our model using the PyTorch deep learning framework. During the training phase, the batch size was set to 32, the epoch was set to 100, and the learning rate was set to 0.001. An ADAM optimizer was adopted to train the model. The state data from the previous hour (
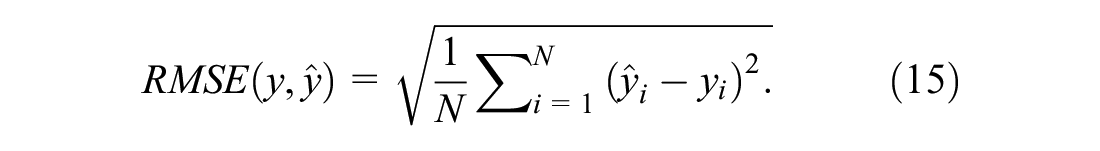
MAE:

RMSE:
Comparison with Baseline
Several studies have proven that deep learning approaches outperform traditional time series methods and machine learning models. Thus, we compared Tr-MTMGN with the following models, (the configuration of the baseline models is shown in Table 1):
FNN: feed-forward neural network with two hidden layers
LSTM: long short-term memory neural network with one layer
CNN: convolutional neural network with two layers
GCN: graph convolutional neural network with two layers
CNN-LSTM: a combined model composed of CNN and LSTM
GCN-LSTM: a combined model composed of GCN and LSTM
STAGCN: spatiotemporal adaptive gated graph convolution network ( 2 )
We independently repeated the experiments three times and reported the average results. Table 2 shows the comparison of different approaches for 10, 30, and 60 min speed and volume prediction. The results reveal the following:
1) The spatiotemporal combined models (CNN-LSTM, GCN-LSTM, STAGCN, and Tr-MTMGN) are better than the single models (LSTM, CNN, and GCN) because the combined models can capture features of the traffic state from both the spatial and temporal dimensions.
2) Tr-MTMGN outperforms all baselines in both tasks, meaning the proposed multi-graph convolution layer based on trajectories and multi-task multi-head self-attention layer in the Tr-MTMGN model can accurately mine the complex spatiotemporal features of the traffic state.
3) The accuracy of speed prediction is higher than that of volume prediction because the trend of speed change is smoother on urban roads. Traffic volume is influenced by intersection signal timing, traffic congestion, and other factors, resulting in greater fluctuations in data, which makes it more difficult to predict.
The Configuration of the Deep Learning Baselines on Zhangzhou Datasets
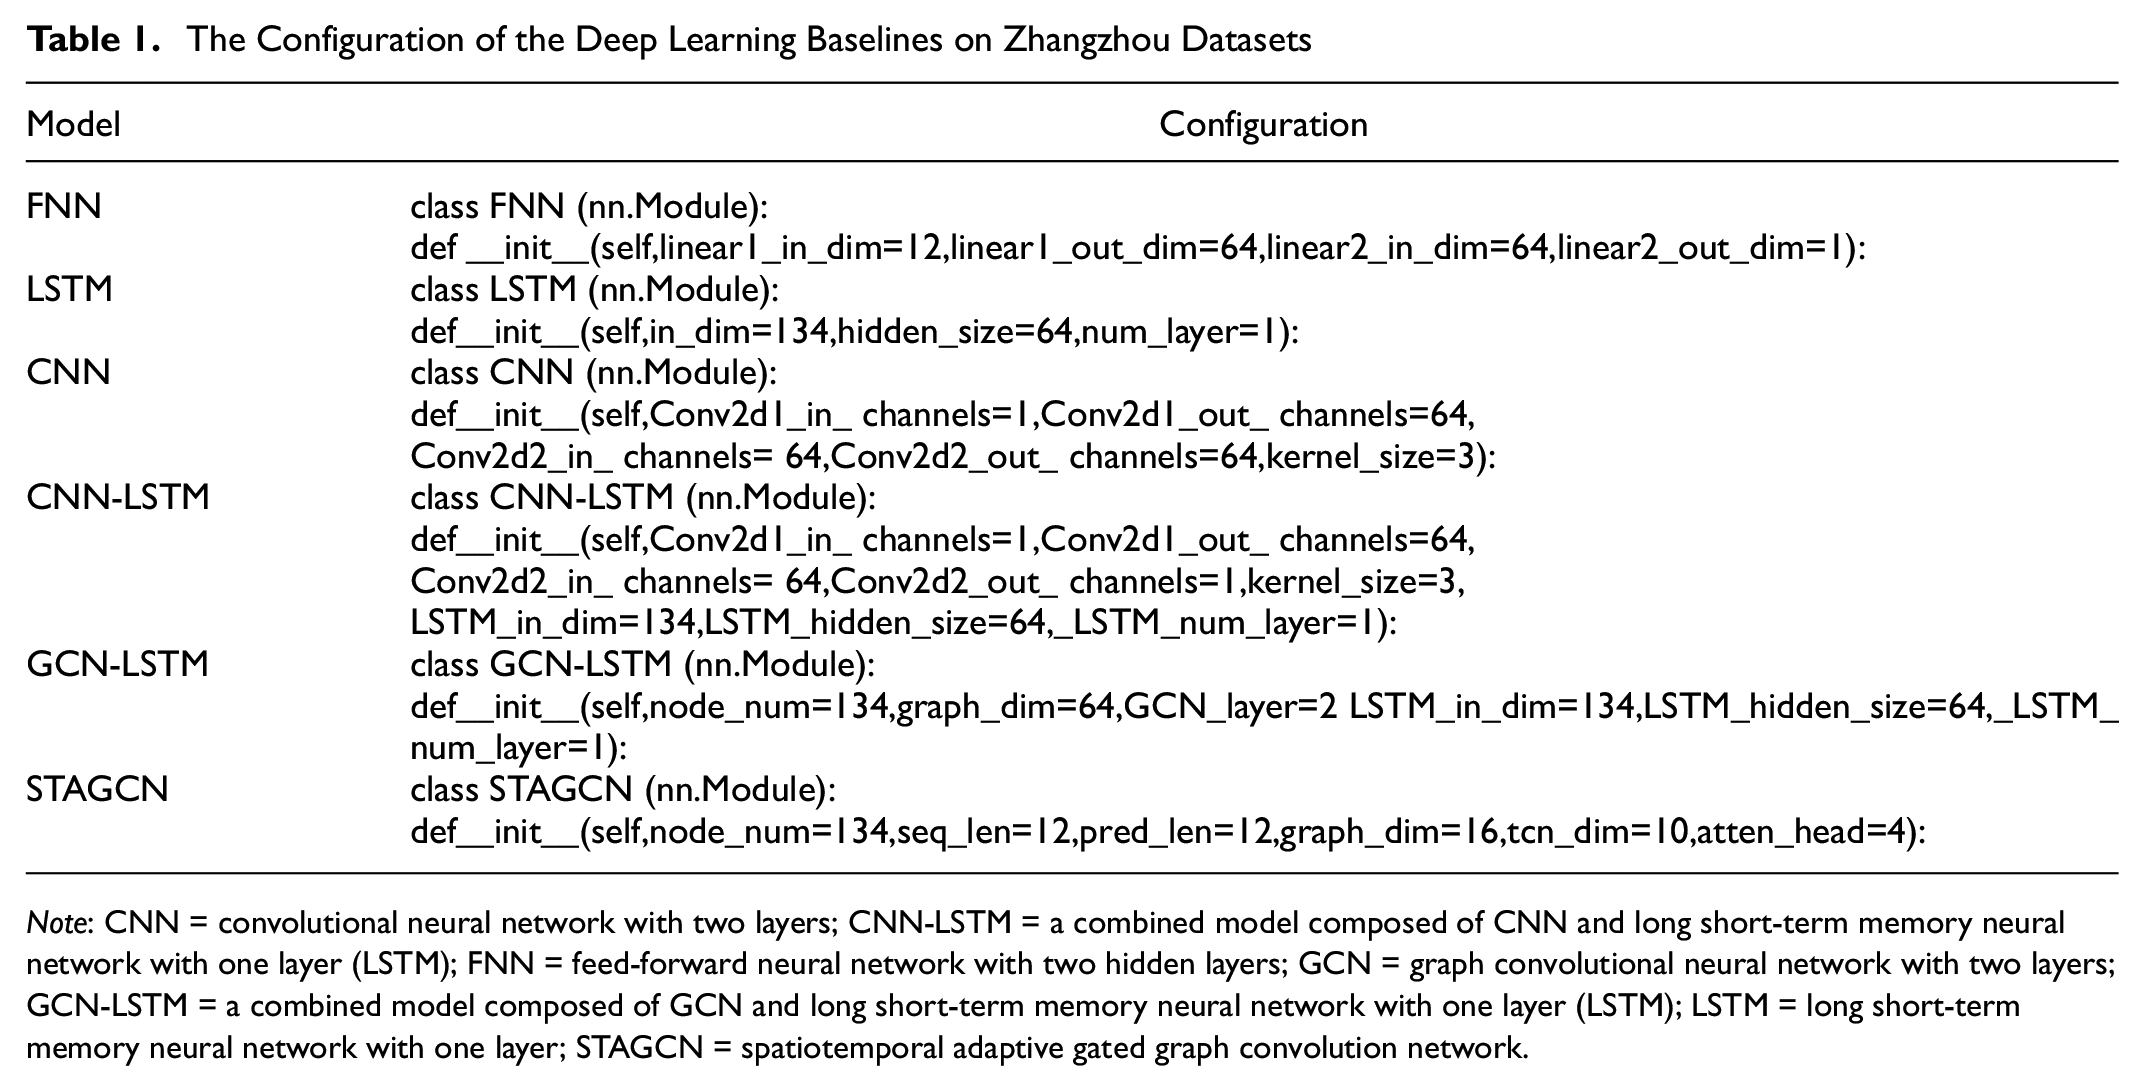
Note: CNN = convolutional neural network with two layers; CNN-LSTM = a combined model composed of CNN and long short-term memory neural network with one layer (LSTM); FNN = feed-forward neural network with two hidden layers; GCN = graph convolutional neural network with two layers; GCN-LSTM = a combined model composed of GCN and long short-term memory neural network with one layer (LSTM); LSTM = long short-term memory neural network with one layer; STAGCN = spatiotemporal adaptive gated graph convolution network.
Prediction Performance of Trajectory-Based Multi-Task Multi-Graph Convolutional Network (Tr-MTMGN) and Other Baselines
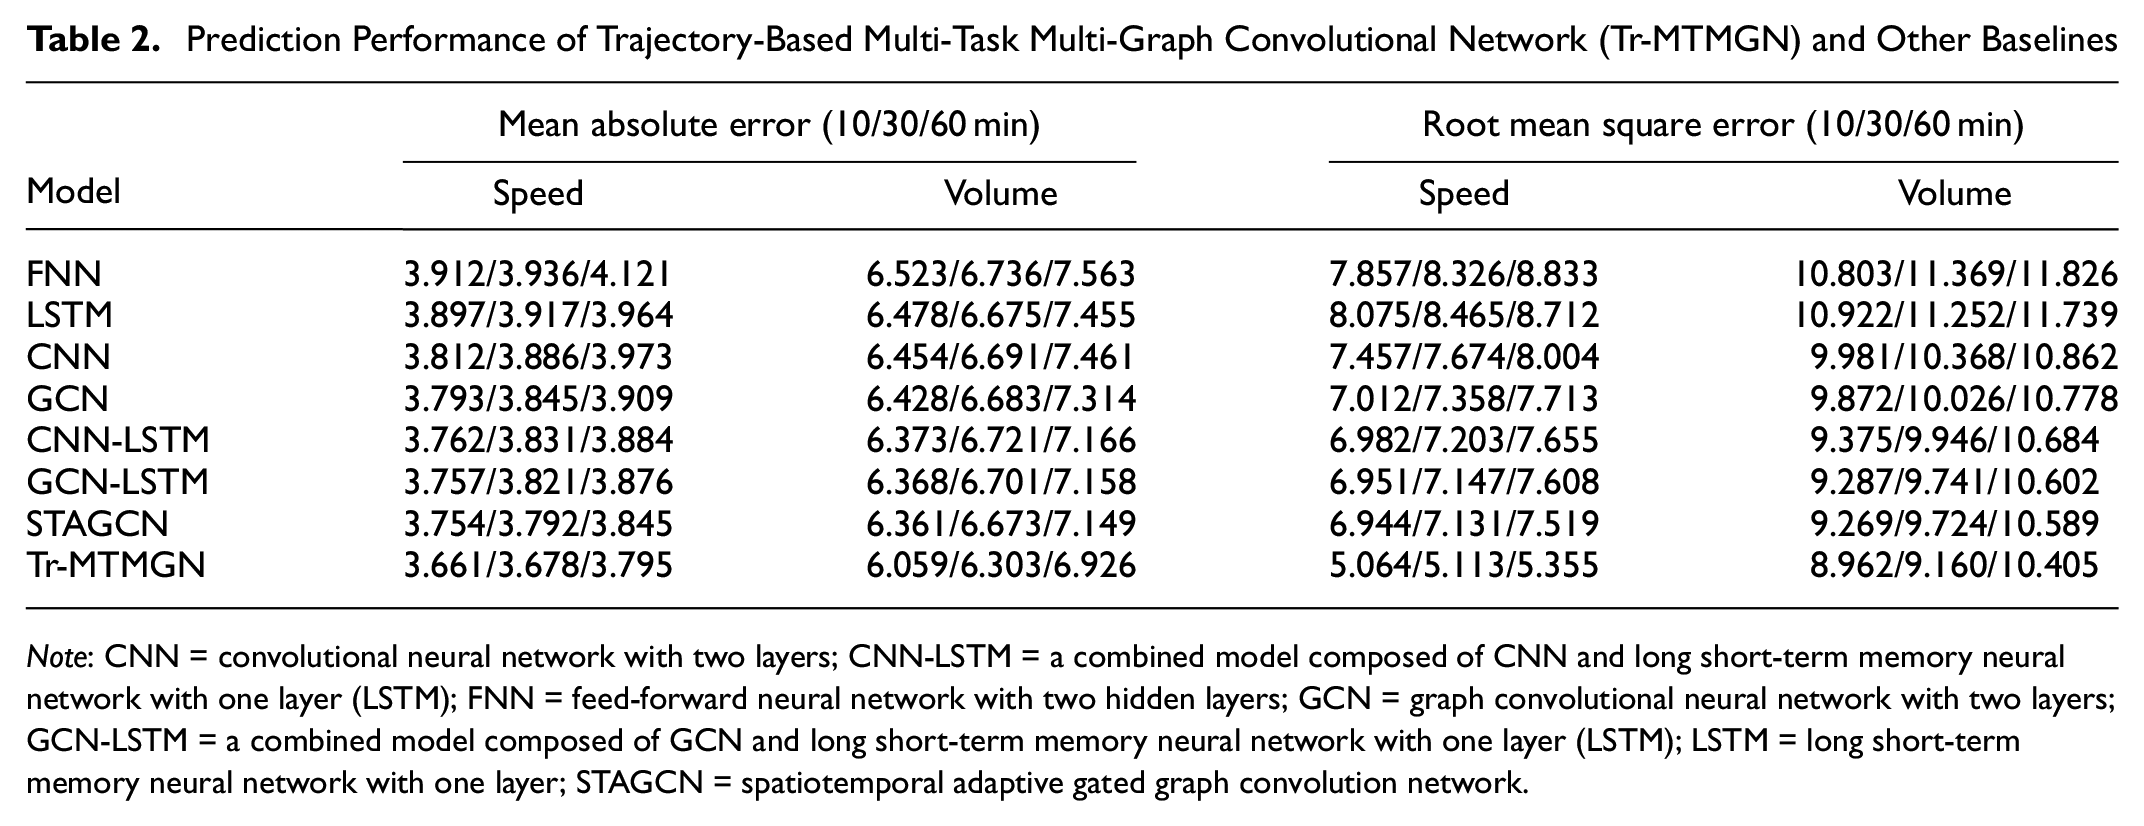
Note: CNN = convolutional neural network with two layers; CNN-LSTM = a combined model composed of CNN and long short-term memory neural network with one layer (LSTM); FNN = feed-forward neural network with two hidden layers; GCN = graph convolutional neural network with two layers; GCN-LSTM = a combined model composed of GCN and long short-term memory neural network with one layer (LSTM); LSTM = long short-term memory neural network with one layer; STAGCN = spatiotemporal adaptive gated graph convolution network.
Effect of Components
To further investigate the effect of spatial and temporal dependence modeling, we evaluated the variants of Tr-MTMGN by removing or replacing the components from the model.
First, to investigate the effect of the multi-graph structure, we evaluated Tr-MTMGN with different adjacency matrix settings, described as follows:
Topology-GN: The graph convolution operation is performed using only the topology graph.
Transition-GN: The graph convolution operation is performed using only the interaction graph.
Similarity-GN: The graph convolution operation is performed using only the similarity graph.
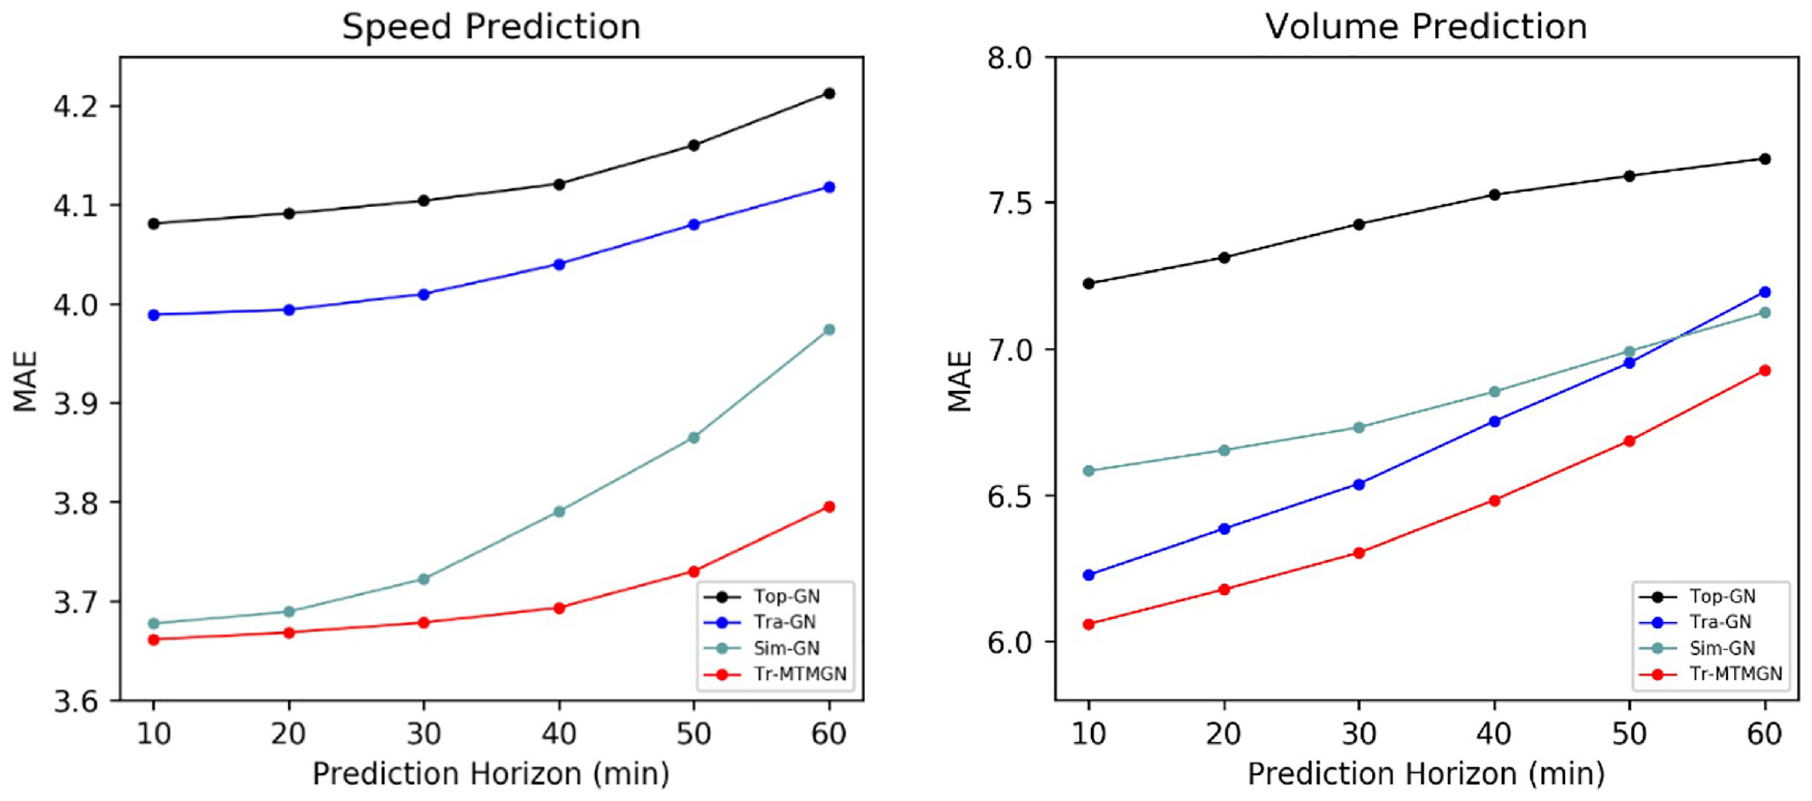
The comparative MAE of the above variants above is shown in Figure 7. The following phenomena can be observed:
1) Tr-MTMGN outperforms all variants in the two tasks. It means that the weighted topological graph, trajectory transition graph, and state similarity graph constructed in our study can fully mine the spatial correlations of the traffic state from multiple perspectives.
2) Topology-GN is performs poorly in both tasks, indicating that the spatial correlation of the traffic state is not strongly correlated with the topological distance of the road network.
3) Transition-GN has a greater MAE compared with that of Similarity-GN for speed prediction tasks, whereas the volume prediction results are the opposite. This phenomenon indicates that the trajectory transition graph obtained by the floating vehicle trajectories implies the traffic flow transfer law in the urban road network, such that the trajectory transition graph can play a more important role in the volume prediction task. The state similarity graph depicts the similarity of the changing trend of traffic states between different locations. Thus, it is more advantageous for capturing the correlation of traffic speed.
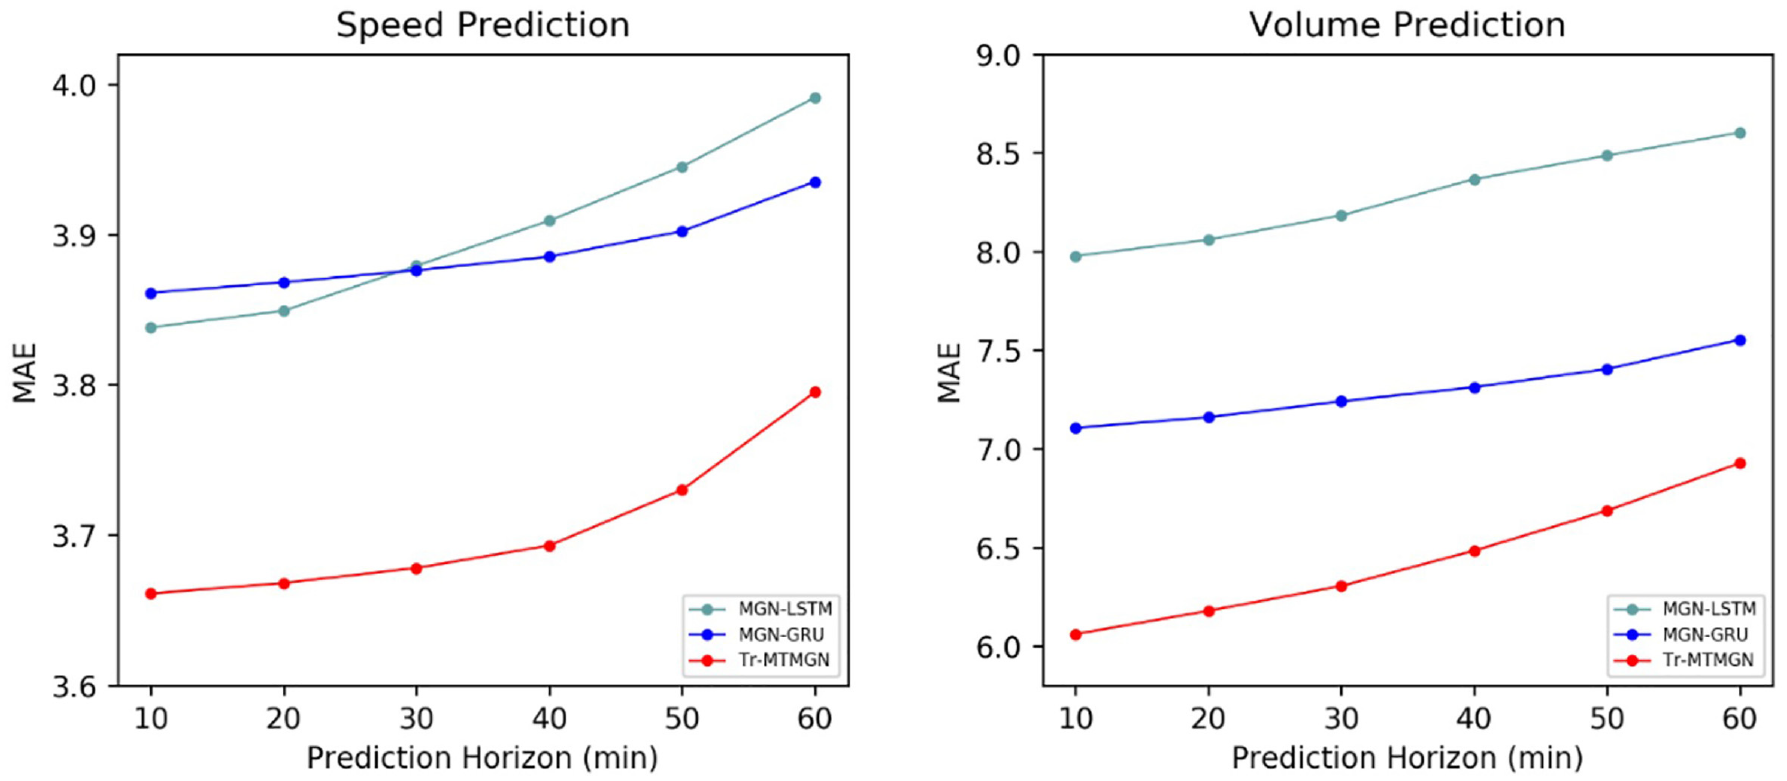
We then compared Tr-MTMGN with the following variants to demonstrate the effect of the multi-head self-attention mechanism:
MGN-LSTM: The self-attention mechanism is replaced with LSTM.
MGN-GRU: The self-attention mechanism is replaced with GRU.
The results of these models are shown in Figure 8. We can see that:
1) Tr-MTMGN is still the best at speed and volume prediction tasks, which shows that it can effectively capture the temporal correlation, since the multi-head self-attention mechanism introduced in this study can adaptively assign different weights to the traffic state at different time steps in the input data.
2) MGN-GRU is only slightly better at long-term prediction of speed and is considerably better than MGN-LSTM at volume prediction. This may be because GRU has fewer parameters compared with LSTM and is, therefore, easier to train to obtain better results.
The mean absolute error (MAE) of speed prediction (left) and volume prediction (right) under different configurations of adjacency matrix.
The mean absolute error (MAE) of speed prediction (left) and volume prediction (right) under different configurations of adjacency under different temporal feature capturing models.
Effect of Multi-Task Learning
To test whether multi-task learning can improve the performance of each task, we compared Tr-MTMGN with the following variants:
Tr-MGN: It is the single-task version of Tr-MTMGN. Tr-MGN consists of a multi-graph convolutional network and a multi-head self-attention mechanism, which is similar to the structure of Tr-MTMGN.
Tr-MTMGN(HS): It uses the hard parameter sharing mechanism in both the spatial and the temporal feature capturing layer, as shown in Figure 9a.
Tr-MTMGN(SS): It uses the soft parameter sharing mechanism in both the spatial and the temporal feature capturing layer, as shown in Figure 9b.
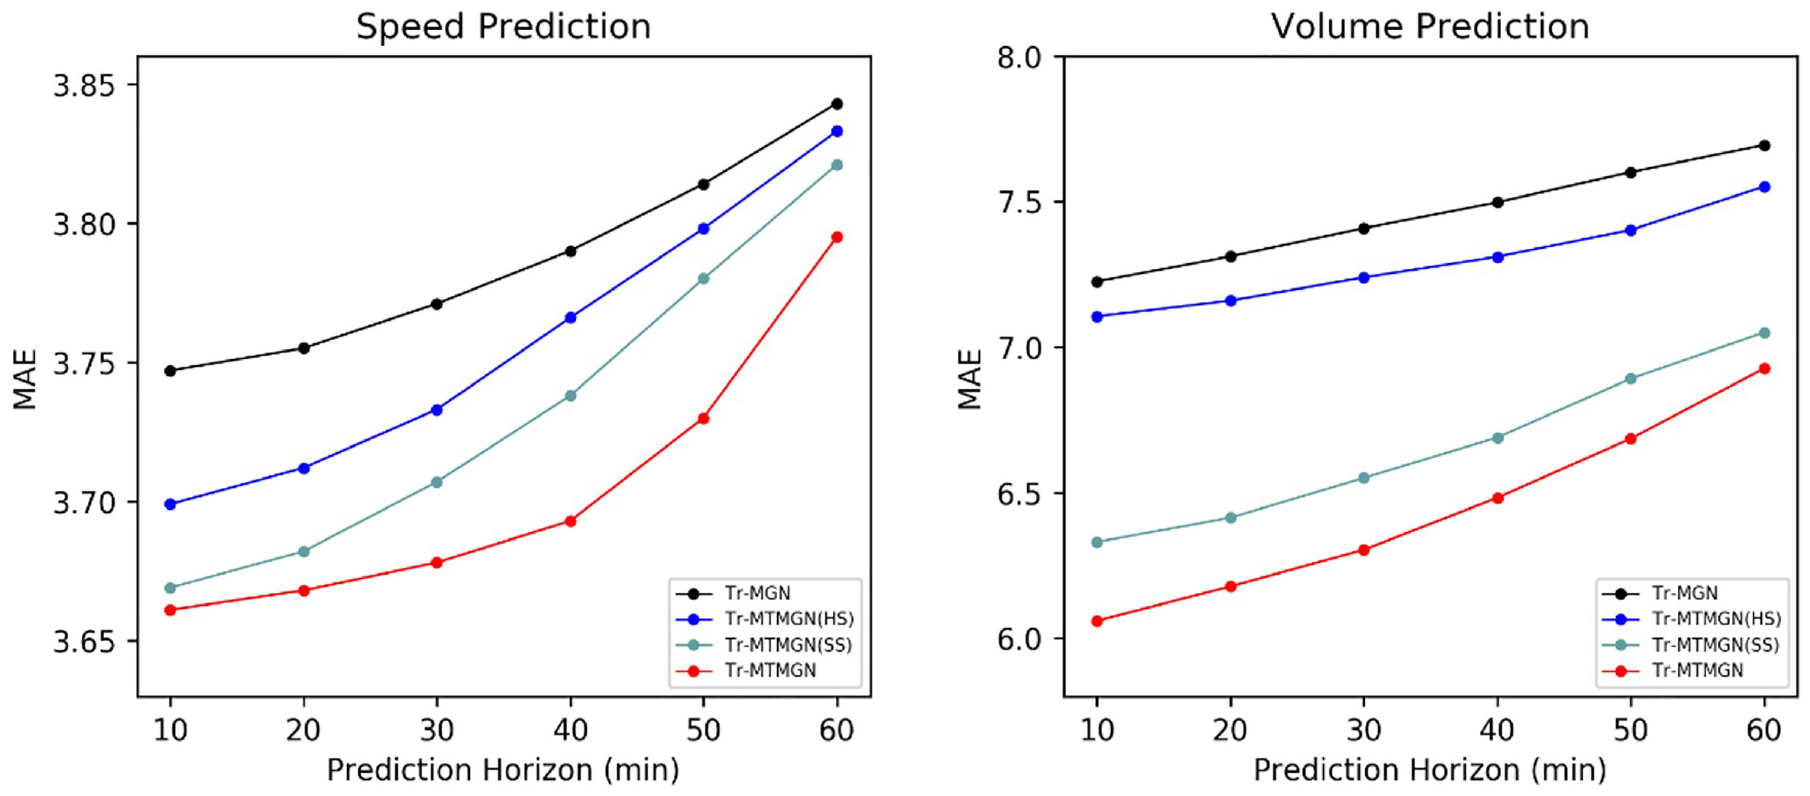
The results of the models above are displayed in Figure 10. Accordingly, the following conclusions can be drawn:
1) The single-task variant is the weakest at predicting both speed and volume because the model cannot correlate the latent correlation among different types of data.
2) MTMGN(SS) outperforms MTMGN(HS) because the former distinguishes the temporal and spatial features between speed and volume using a soft-parameter sharing strategy. However, an increase in the number of parameters can lead to an increase in training difficulty.
3) Tr-MTMGN achieves the best results for both tasks because the simultaneous inputs of speed and volume data are correlated, thereby improving the performance of the model. Moreover, we used only the soft-parameter sharing strategy in the multi-head self-attention layer. Further, Tr-MTMGN is better than MTMGN(HS) in that it captures the temporal features of speed and volume and reduces the number of parameters compared with MTMGN(SS). The results prove the effectiveness and innovation of the multi-task learning framework proposed in this study.
We compare the computation time of Tr-MGN, Tr-MTMGN(HS), Tr-MTMGN(SS), and Tr-MTMGN. The results are shown in Table 3. We can observe that:
1) Although the computation time of Tr-MGN is the shortest, it has the highest error of all methods.
2) The computation time of Tr-MTMGN(SS) is longest as the model possesses lots of parameters and needs more computational costs.
3) The proposed Tr-MTMGN demonstrate a moderate time consumption, inferior to Tr-MTMGN(HS) and slightly higher than Tr-MTMGN(SS). Whereas, the model has the optimal prediction accuracy as shown in Figure 10. To obtain a better prediction accuracy, a slight sacrifice of computing time is acceptable.
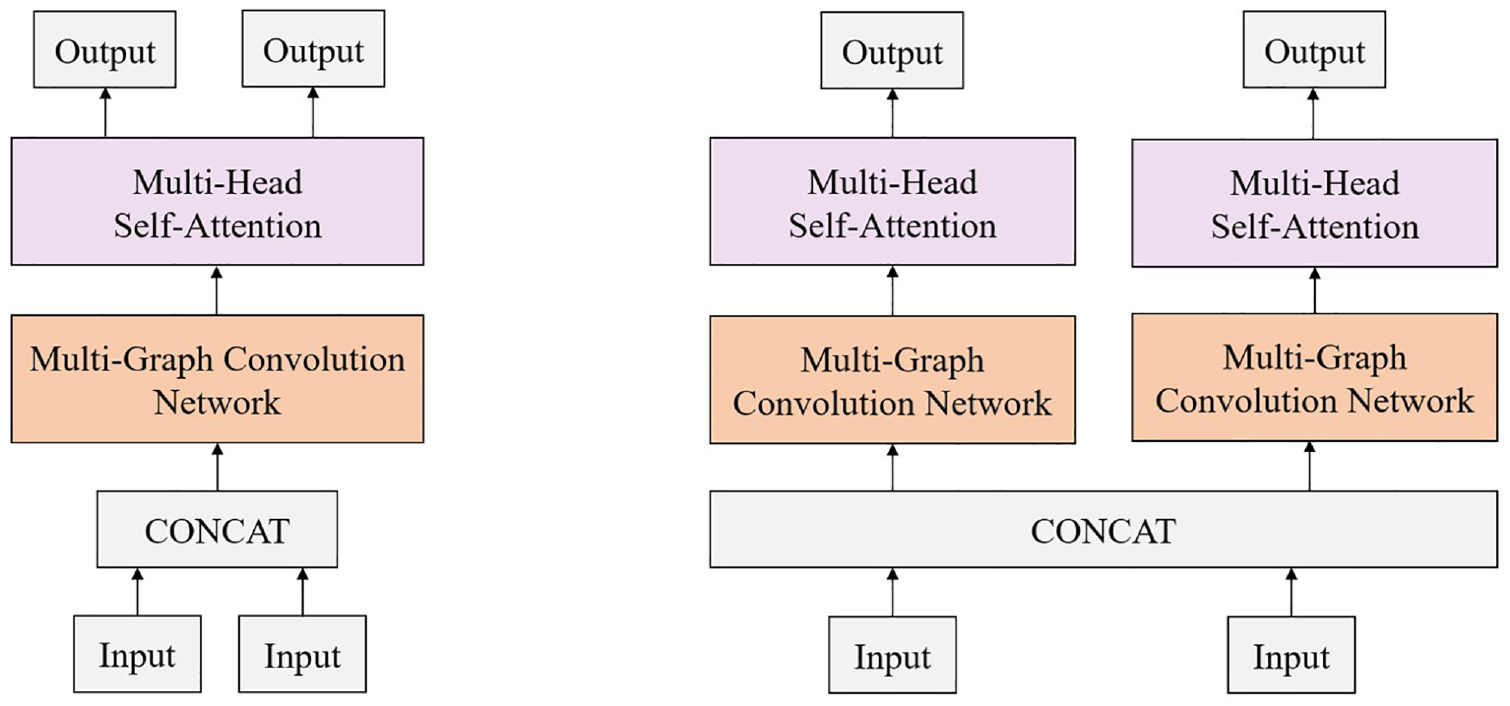
The multi-task learning variants based on different parameter sharing mechanisms: a version of Tr-MTMGN using the hard parameter sharing mechanism in both the spatial and the temporal feature capturing layer (Tr-MTMGN[HS]) (left) and a version of Tr-MTMGN using the soft parameter sharing mechanism in both the spatial and the temporal feature capturing layer (Tr-MTMGN[SS]) (right).
The mean absolute error (MAE) of speed prediction (left) and volume prediction (right) under different multi-task learning variants.
The Computation Time of Different Multi-Task Learning Variants
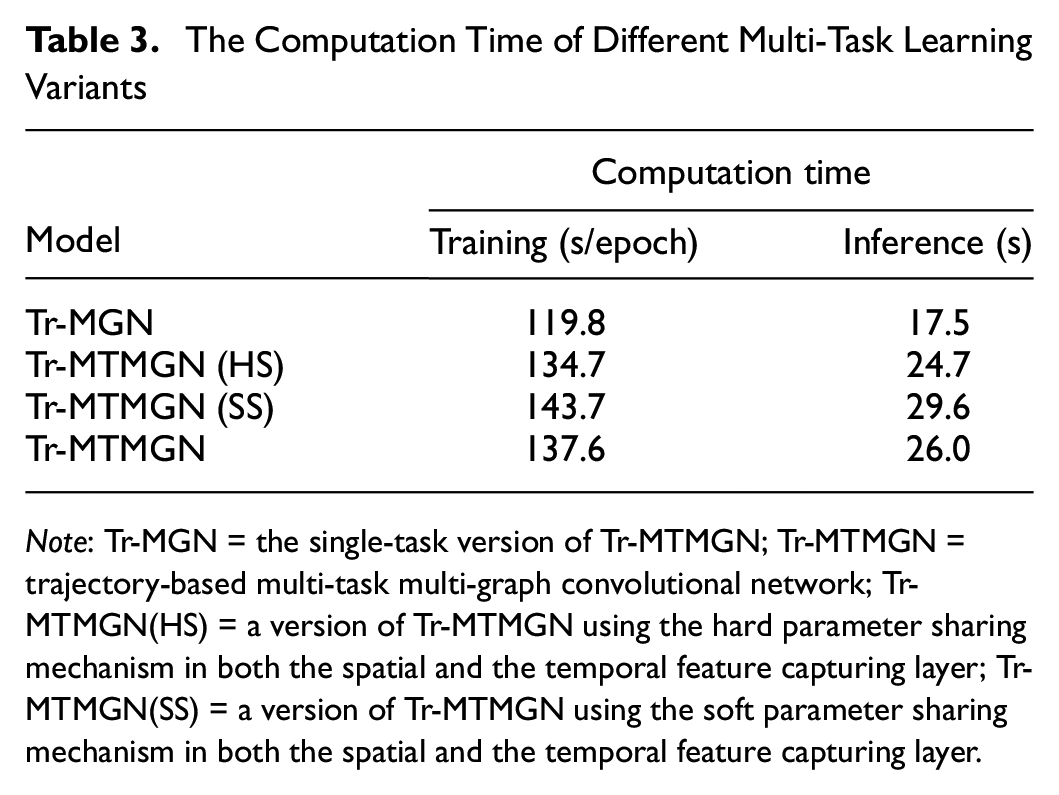
Note: Tr-MGN = the single-task version of Tr-MTMGN; Tr-MTMGN = trajectory-based multi-task multi-graph convolutional network; Tr-MTMGN(HS) = a version of Tr-MTMGN using the hard parameter sharing mechanism in both the spatial and the temporal feature capturing layer; Tr-MTMGN(SS) = a version of Tr-MTMGN using the soft parameter sharing mechanism in both the spatial and the temporal feature capturing layer.
Result Visualization
We attempted to visualize the results to intuitively illustrate the performance of Tr-MTMGN. Figure 11 shows a heat map of the 10 min prediction and the ground truth of all the nodes on May 25, 2017.
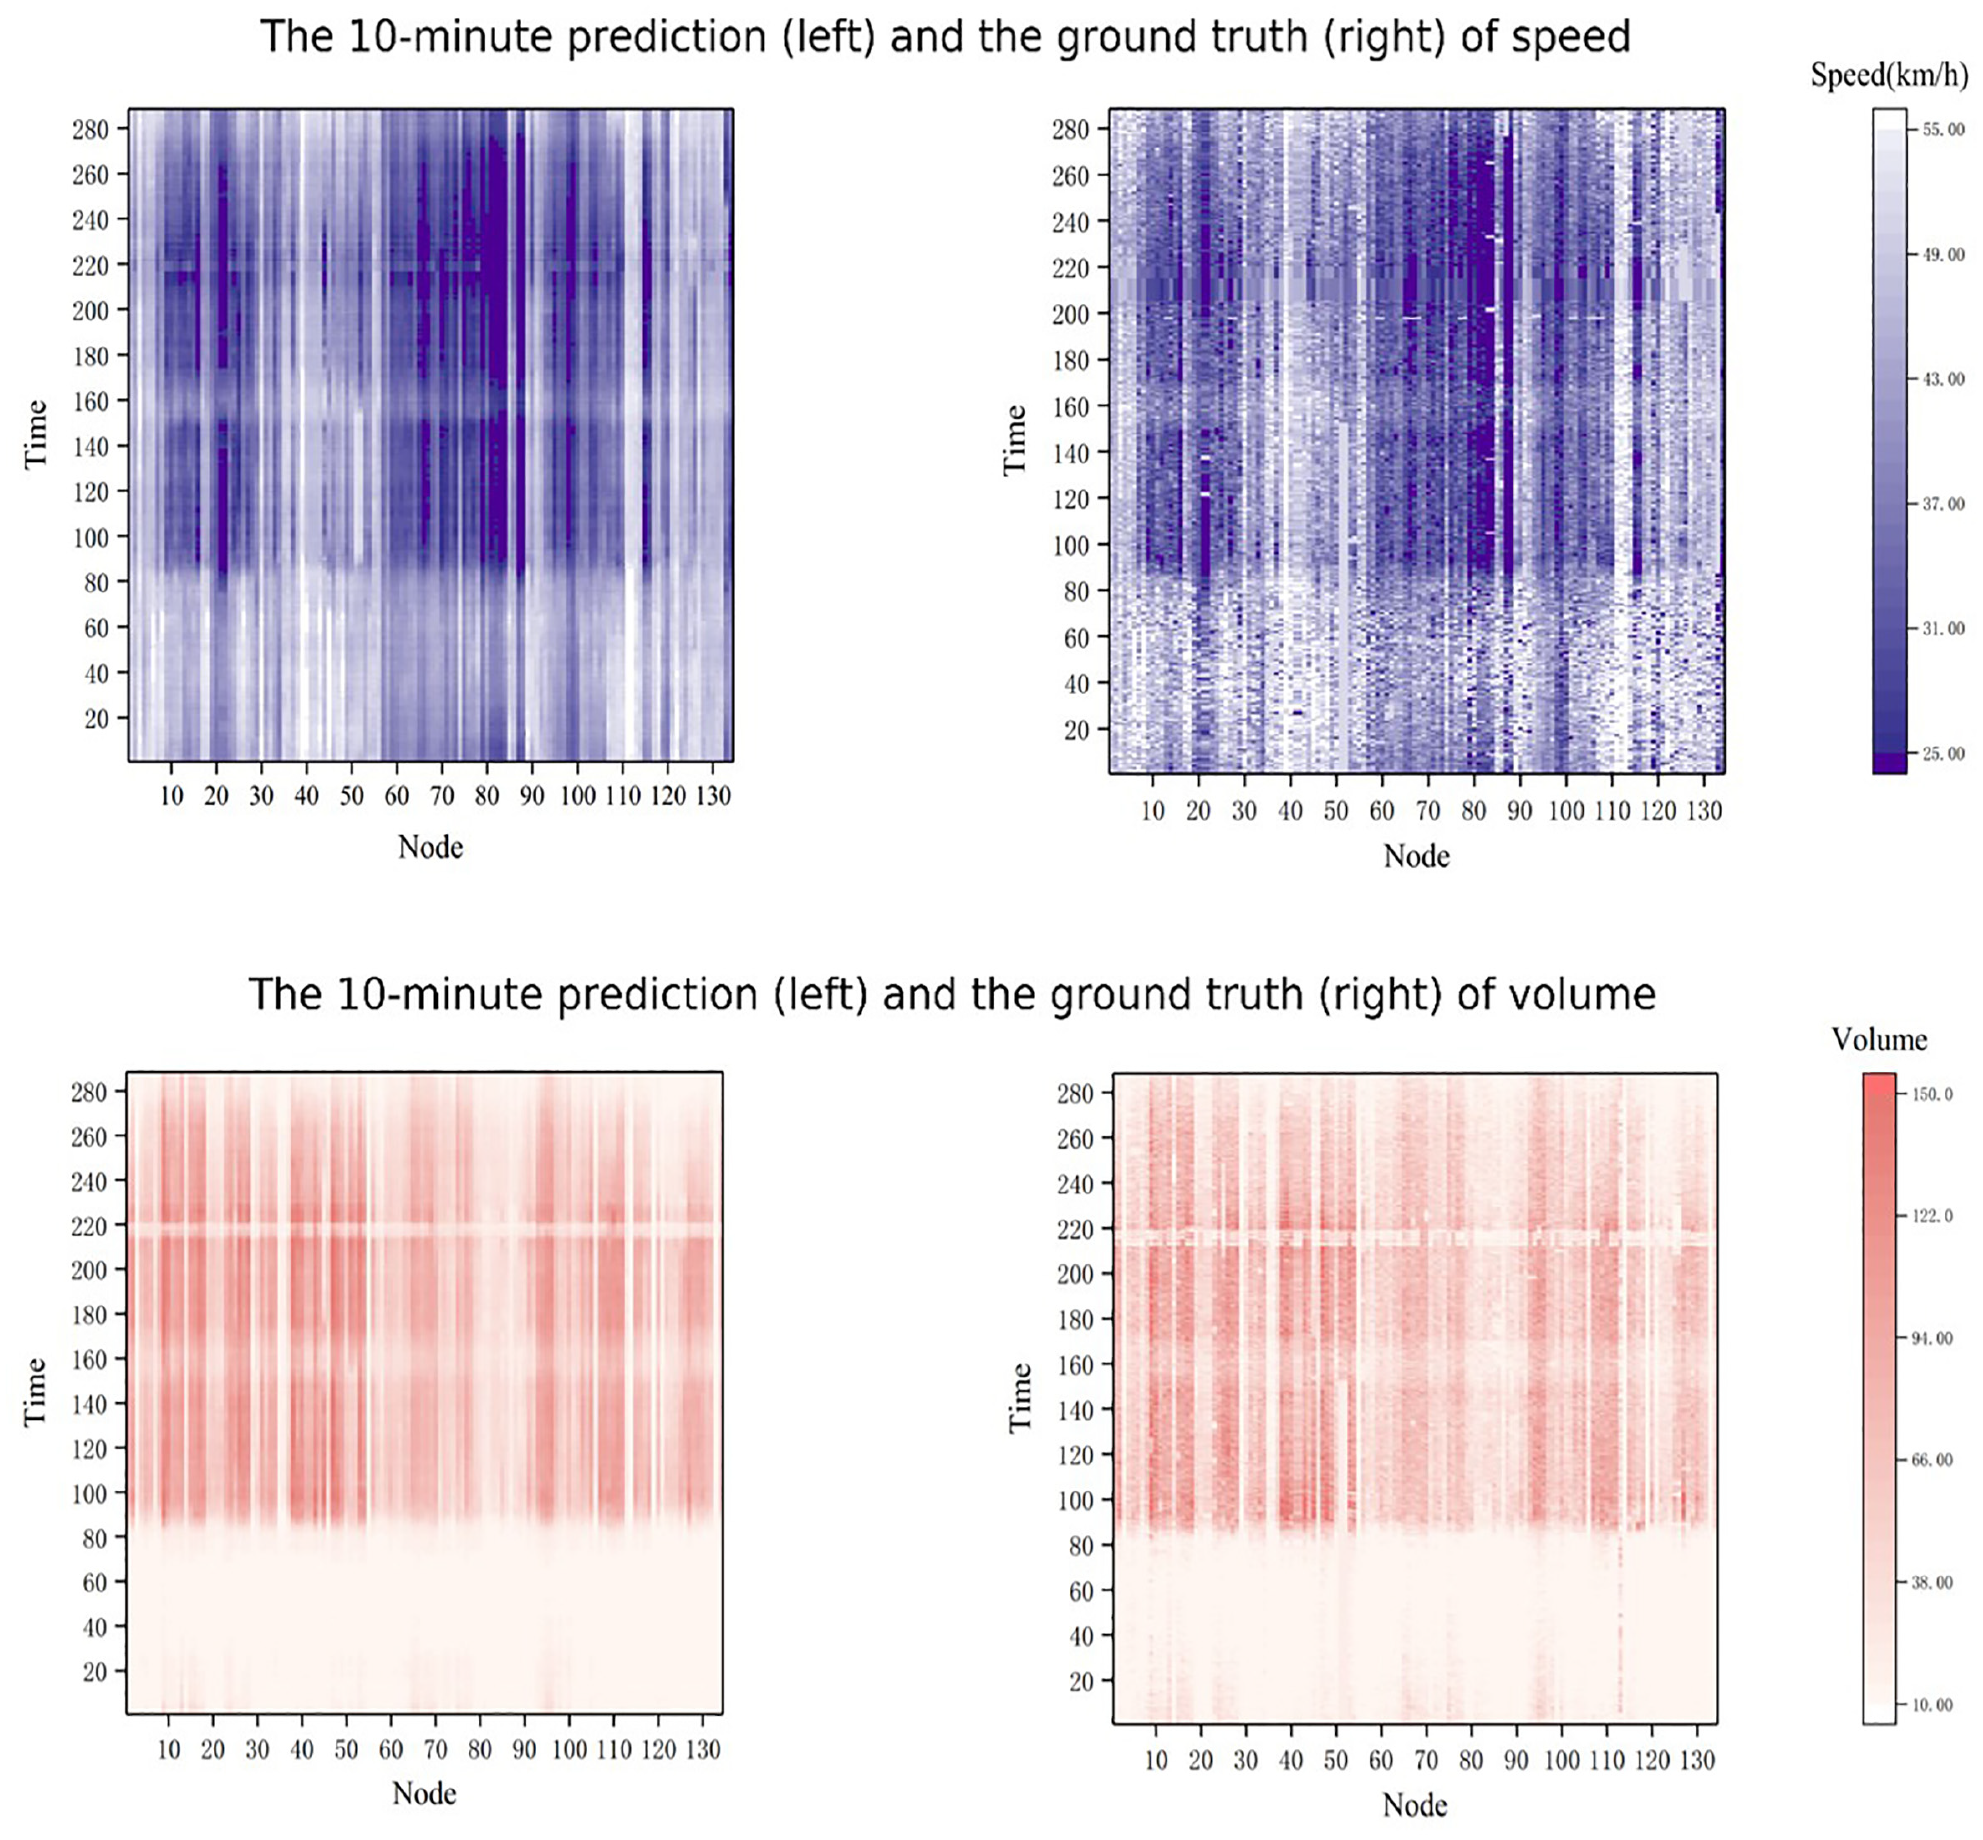
The heat map for next 10 min prediction and ground truth.
To further illustrate the performance of our model, we randomly selected the No. 95 loop detector and plotted the multi-step predictions and ground truth, as shown in Figure 12. As expected, our model accurately reflected the spatiotemporal distribution of future traffic states.
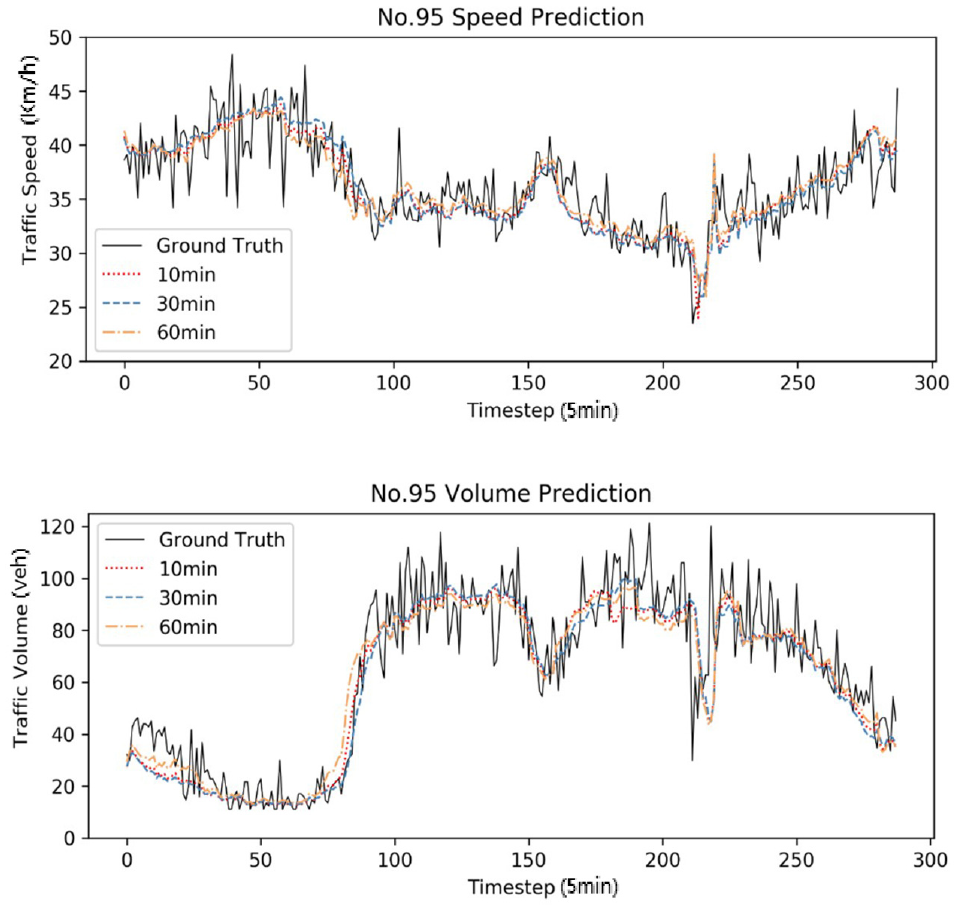
The visualization of traffic state prediction results of No. 95 node.
This paper proposes a novel spatiotemporal deep learning framework, Tr-MTMGN, for traffic state prediction on a citywide scale. Specifically, this approach deeply mines trajectory information when constructing multiple spatial graphs and designs a multi-graph convolution block using the GCN. A multi-head self-attention layer then builds on the multi-task learning framework based on a soft-parameter sharing strategy to capture the temporal dependencies of speed and volume. Experiments on a real traffic dataset in Zhangzhou, China, verified that our proposed framework outperforms existing state-of-the-art solutions. However, there are two existing limitations in our model. Firstly, although our model can be expended to accommodate different scenarios, it still needs to retrain a new set of parameters. Secondly, our model has achieved a commendable result, but the parameter sharing mechanisms and the loop detectors graph proposed in this study can be promoted more efficiently. In the future, we would design more intelligent parameter sharing mechanisms and optimize loss functions for balancing the predicational accuracy and the computational cost. Furthermore, exploiting the underlying spatial-temporal relevancies from real-time GPS data or high-resolution connected vehicle trajectory data might assist in capturing the spatiotemporal features of the traffic state more accurately and improve prediction precision.
Footnotes
Author Contributions
The authors confirm contribution to the paper as follows: study conception and design: J. Fang, M. Xu, W. Chen; data collection: J. Fang, W. Chen, M. Xu; analysis and interpretation of results: J. Fang, W. Chen, M. Xu; draft manuscript preparation: J. Fang, W. Chen, M. Xu, Y. Liu, T. Bi. All authors reviewed the results and approved the final version of the manuscript.
Declaration of Conflicting Interests
The author(s) declared no potential conflicts of interest with respect to the research, authorship, and/or publication of this article.
Funding
The author(s) disclosed receipt of the following financial support for the research, authorship, and/or publication of this article: This work was supported by the National Natural Science Foundation of China (grant entitled “Connected vehicle big data driven expressway multi-objective coordinated control fusing deep learning and traffic flow model,” award number 71901070).