
Abstract
The objective of this study was to develop a comprehensive balanced mix design (BMD) protocol for a state highway agency (SHA) using one of the four approaches presented by both the National Asphalt Pavement Association (NAPA) and the American Association of State Highway and Transportation Officials (AASHTO). This comprehensive BMD was to ensure that a mixture design continues to be balanced from the mixture design phase to the production quality assurance (QA) phase. While existing publications by NAPA, AASHTO, and others provide a good initial framework for developing a BMD protocol, many important questions arise that are left for each SHA to answer when developing a comprehensive BMD protocol. This paper outlines these questions and how each of them was addressed. Also, a new approach for developing a pass/fail criterion for bottom-up fatigue cracking using AASHTOWare® pavement mechanistic-empirical design (PMED) predictive models is presented. Twenty-one SHA-approved plant-produced mixtures were obtained and tested to aid in the development of this pass/fail criterion. A similar approach as presented in this paper can be used by other SHAs. A comprehensive BMD protocol is presented at the end of this paper along with recommendations for future studies needed for further refinement.
Keywords
Balanced mix design (BMD) has been defined by the National Asphalt Pavement Association (NAPA) and the American Association of State Highway and Transportation Officials (AASHTO) as an “Asphalt mix design using performance tests on appropriately conditioned specimens that address multiple modes of distress taking into consideration mix aging, traffic, climate, and location within the pavement structure ( 1 , 2 ).” Both entities have developed reference materials to help transportation agencies develop a BMD protocol that considers these variables and their own materials. NAPA has a resource guide ( 1 ) while AASHTO provides both a standard practice (AASHTO PP 105-20 “Balanced Design of Asphalt Mixtures”) and a specification (AASHTO MP 46-20 “Balanced Mix Design”) ( 2 ). These reference materials present a framework for a BMD and outline how to evaluate materials used in a BMD. Each also describes four alternate BMD approaches:
Approach A—Volumetric design with performance verification
Approach B—Volumetric design with performance optimization
Approach C—Performance-modified volumetric mix design
Approach D—Performance design
Each BMD approach will now be briefly described. A more complete description with accompanying flow charts is provided by NAPA and AASHTO ( 1 , 2 ). It is noted that all four approaches require that the final mix design pass a selected moisture damage test.
For BMD Approach A, a volumetric mixture design is completed first. The optimum binder content (OBC) of a mixture is determined based on volumetrics using an existing design method such as Superpave, Marshall, or Hveem. The mixture must meet all volumetric requirements; otherwise, it must be redesigned. If it meets them, then the mixture is tested for both rutting and cracking performance using tests selected by the state highway agency (SHA). If it does not meet all the passing criteria for these tests, then the mixture must be redesigned.
BMD Approach B is similar to Approach A. It starts with determining a preliminary OBC based on volumetrics obtained using an existing design method such as Superpave, Marshall, or Hveem. The mixture must meet all volumetric requirements; otherwise, it must be redesigned. If it meets them, then the mixture is tested for both rutting and cracking performance at the preliminary OBC but also at additional binder contents ranging from ±0.3% to ±0.6% from the preliminary OBC to try to optimize mixture performance based on binder content. A final OBC is determined from these tests; however, volumetrics only need to be met for the preliminary OBC. If none of the binder contents meet all passing criteria for the performance tests, then the mixture must be redesigned.
BMD Approach C has flexibility which allows an SHA to relax or eliminate some of the volumetric requirements based on the rutting and cracking performance tests. It also starts with determining a preliminary OBC based on volumetrics obtained using an existing design method such as Superpave, Marshall, or Hveem. The mixture must then meet the passing criteria for the rutting and cracking performance tests. If it meets them, the mixture is acceptable. If it does not meet them, the mixture can then be modified by changing the binder content or by making other mixture design modifications until the passing criteria are met. Some of the volumetric requirements can be relaxed or eliminated, which means that the SHA has to choose if they want to relax or eliminate them.
BMD Approach D establishes the mixture OBC based on rutting and cracking performance tests with no requirements for volumetrics. ( 1 , 2 ) Typically, an initial aggregate gradation is selected, and mixture rutting and cracking performance is tested using three binder contents at intervals of 0.3% to 0.5%. If the mixture fails any performance criteria, other mixture design modifications are then tried until the passing criteria are met. Once the performance criteria are met, the SHA has the option to check volumetrics, but it is not required.
Any of these BMD approaches is suitable to address the perceived shortcomings of designing a mixture based solely on volumetrics. For example, volumetric designs alone generally will not ensure the performance of a mixture when new constituents are used. During the last two decades, there have been many changes to the constituents in an asphalt mixture as a result of the goal to design more sustainable and environmentally friendly mixtures. These constituent changes include the use of bio-binders, fibers, rejuvenators, warm mix asphalt, and the inclusion of more recycled materials such as reclaimed asphalt pavements (RAP), recycled asphalt shingles (RAS), plastics, and ground tire rubber (GTR). Since volumetric design methods do not generally account for these types of constituent change, the response from SHAs has been to develop either a performance-related or a performance-based specification to measure and predict the performance of asphalt mixtures with these constituents ( 3 ). Moreover, many SHAs have gone further and developed BMD protocols that include mixture performance testing to help ensure that acceptable performance is achieved ( 4 – 7 ). One agency that is in the process of developing a BMD protocol is the Massachusetts Department of Transportation (MassDOT).
The study documented in this paper was conducted to develop a comprehensive BMD protocol for MassDOT using one of the above four approaches. A “comprehensive BMD” refers to a mixture design that stays balanced from the design phase to the production quality assurance (QA) phase. While the aforementioned NAPA and AASHTO references ( 1 , 2 ) provide a good initial framework for developing a BMD protocol, many significant questions arise that are left for each SHA to answer when developing a comprehensive BMD protocol. These questions include:
Which BMD approach to use: A, B, C, or D?
Which pavement distresses should be included?
Which performance tests should be used to address the selected pavement distresses?
What mixture aging protocols should be used for performance testing both during mix design and during production QA?
Does a BMD remain balanced within the specified production tolerances and what if the source of asphalt binder, but not the performance grade (PG), changes?
How can pass/fail criteria for the selected performance tests be determined?
Scope of Work
This paper will first outline how each of the first five questions had already been addressed when developing a BMD protocol for the SHA, in this case MassDOT. Question 1 will be addressed by selecting the approach that the SHA has interest in implementing or that has the greatest long-term viability in meeting their needs. Questions 2 to 5 were addressed using the findings of several recently published research studies ( 8 – 11 ) performed for the SHA.
Question 6 on how to develop pass/fail criteria for mixture performance tests to be included in a BMD protocol was addressed in this paper by introducing a new approach for developing pass/fail criteria for bottom-up fatigue cracking using AASHTOWare® pavement mechanistic-empirical design (PMED) predictive models. Several SHA approved plant-produced mixtures were obtained and tested for this purpose.
Overall, the outcome from addressing all six questions presented a comprehensive BMD protocol developed for the SHA. This study also added to the knowledge base of the existing BMD frameworks presented in the cited references ( 1 , 2 ) and could aid other SHAs in establishing or refining their BMDs.
Objectives
The overall objective was to develop a comprehensive BMD protocol for the SHA using one of the four approaches presented by both NAPA and AASHTO ( 1 , 2 ). The BMD protocol was to address all six questions listed above in sequential order, just as any SHA would have to do when developing a BMD protocol.
Approach, Results, and Findings
Question #1: Which BMD Approach to Use?
The first question was which BMD approach should be used. For this study, a conventional dense-graded mixture was the type of mixture that was considered. Currently, the SHA volumetrically designs its dense-graded asphalt mixtures in accordance with the procedures outlined in AASHTO R 35 “Superpave Volumetric Design for Asphalt Mixtures” and AASHTO M 323 “Superpave Volumetric Mix Design” ( 2 , 12 ). The volumetric parameters determined during mixture design are percent air voids (Va), voids in mineral aggregates (VMA), voids filled with asphalt (VFA), and fines to effective asphalt ratio (P0.075/Pbe). The SHA uses volumetrics for mixture design approval and for production QA because their experience has shown that these parameters have an effect on pavement performance.
Air voids are small pockets of air that exist between the coated aggregate particles in a final compacted mixture. Excessive or reduced air voids can negatively affect the performance of an asphalt mixture. High air voids will provide passageways for air and water to circulate through a mixture which can make it susceptible to raveling and oxidation ( 13 , 14 ). Low air voids can lead to rutting, shoving, and bleeding.
VMA is the space that is available to accommodate the asphalt binder and the target air voids in an asphalt mixture. Lower VMAs indicate that the intergranular space available for an asphalt binder is low. This reduces the amount of effective asphalt binder that can be used in a mixture, which in turn leads to lower binder film thicknesses around the aggregate particles. Reduced film thickness is linked to poorer mixture durability. To proactively ensure that a low VMA will not occur, the SHA requires a 1% increase in the VMA listed in AASHTO M 323. This was based on discussions with asphalt mixture producers within the state who commented that Superpave mixtures are “dry” and achieving the required field density is difficult.
VFA is the percentage within the VMA that is filled with asphalt. If the VFA is too low, the required asphalt binder to provide good durability is insufficient ( 13 , 14 ).
P0.075/Pbe is the ratio of the aggregates passing the 0.075 mm sieve (#200 sieve) to the effective binder content (Pbe). A mixture with a high P0.075/Pbe will often exhibit a multitude of small stress cracks during the compaction process, called check-cracking ( 14 ). A mixture with low P0.075/Pbe will often lack cohesion and is difficult to compact in the field ( 14 ).
All of this information demonstrates, as the SHA has learned, that the volumetrics of an asphalt mixture are related to its performance. Thus, the SHA decided to keep volumetric requirements in their BMD protocol with the already established volumetric thresholds. This eliminated BMD Approach D that relies solely on performance testing. Approach B might potentially be used by the SHA but a separate study would have to be done to determine their confidence in accepting whatever volumetric properties are provided when the preliminary binder content is adjusted up or down. Approach C would also require a separate study to determine new allowable volumetrics, which was beyond the scope of this study. Therefore, BMD Approach A was selected to be incorporated in the comprehensive BMD protocol. Approach A was also the approach the SHA had greatest interest in implementing.
Question #2: Which Distresses Should be Included in a BMD Protocol?
The second question is which distresses should be included in the BMD protocol. The NAPA resource guide ( 1 ) and AASHTO specifications ( 2 ) specifically evaluate rutting and cracking performance for each of the four approaches, along with a check for moisture damage. It is critical for any BMD protocol that any selected performance test correlates to observed pavement distresses. For this study, the distresses were selected based on the SHA’s observed distresses and prior experience in mitigating them.
A survey in 2019 was developed and distributed to the New England state transportation agencies to ascertain information related to observed pavement distress ( 15 ). The SHA indicated that bottom-up fatigue cracking at intermediate temperatures was the predominate distress observed. Thus, this distress was selected to fulfill the cracking performance requirement.
For the rutting distress requirement, the SHA had already implemented a performance test to evaluate rutting. The test was the Hamburg Wheel Tracking Test (HWTT) performed in accordance with AASHTO T 324 “Hamburg Wheel-Track Testing of Compacted Asphalt Mixtures” ( 2 ). This test was implemented by them to make sure that their increased VMA requirement of 1% above the AASHTO M 323 recommended minimum, which increases the volume of effective binder in a mixture, would not lead to rutting and shoving in the field. Because of the SHA’s experience with this rutting test, it was added to the BMD protocol to fulfill the rutting performance requirement. The SHA does not typically use any other laboratory rutting test. It is noteworthy that the HWTT test also concurrently serves as a performance test for moisture damage for the SHA.
In conclusion, the comprehensive BMD protocol was to include a test to evaluate a mixture’s susceptibility to bottom-up fatigue cracking along with the existing HWTT rutting test. It is noted that the distresses to be included in a BMD protocol are to be based on an SHA’s experience and observed field distresses.
Question #3: Which Performance Tests Should Be Used to Address the Selected Pavement Distresses?
With the distresses properly identified, which for this SHA were bottom-up fatigue cracking at intermediate temperatures and rutting, the question now shifted to which specific laboratory performance tests should be used. The performance test for rutting was already identified when answering Question #2.
For bottom-up fatigue cracking, a variety of performance tests are available. Under NCHRP Project 9-57, “Experimental Design for Field Validation of Laboratory Tests to Assess Cracking Resistance of Asphalt Mixtures,” a panel of experts identified several intermediate temperature cracking tests that met their test selection criteria ( 16 ). These tests, shown in Table 1, included the Indirect Tensile Cracking test (IDEAL-CT) used to determine a cracking tolerance index (CTIndex), Illinois Flexibility Index test (I-FIT), Louisiana Semi-Circular Bending test (Jc parameter), Texas Overlay test, Flexural Beam Fatigue, Direct Tension Cyclic Fatigue test measured using an Asphalt Mixture Performance Tester (AMPT), and the Indirect Tensile test (IDT) Energy Ratio developed by the University of Florida (UF).
Candidate Fatigue Cracking Performance Tests and Their General Information Adapted from Reference 4
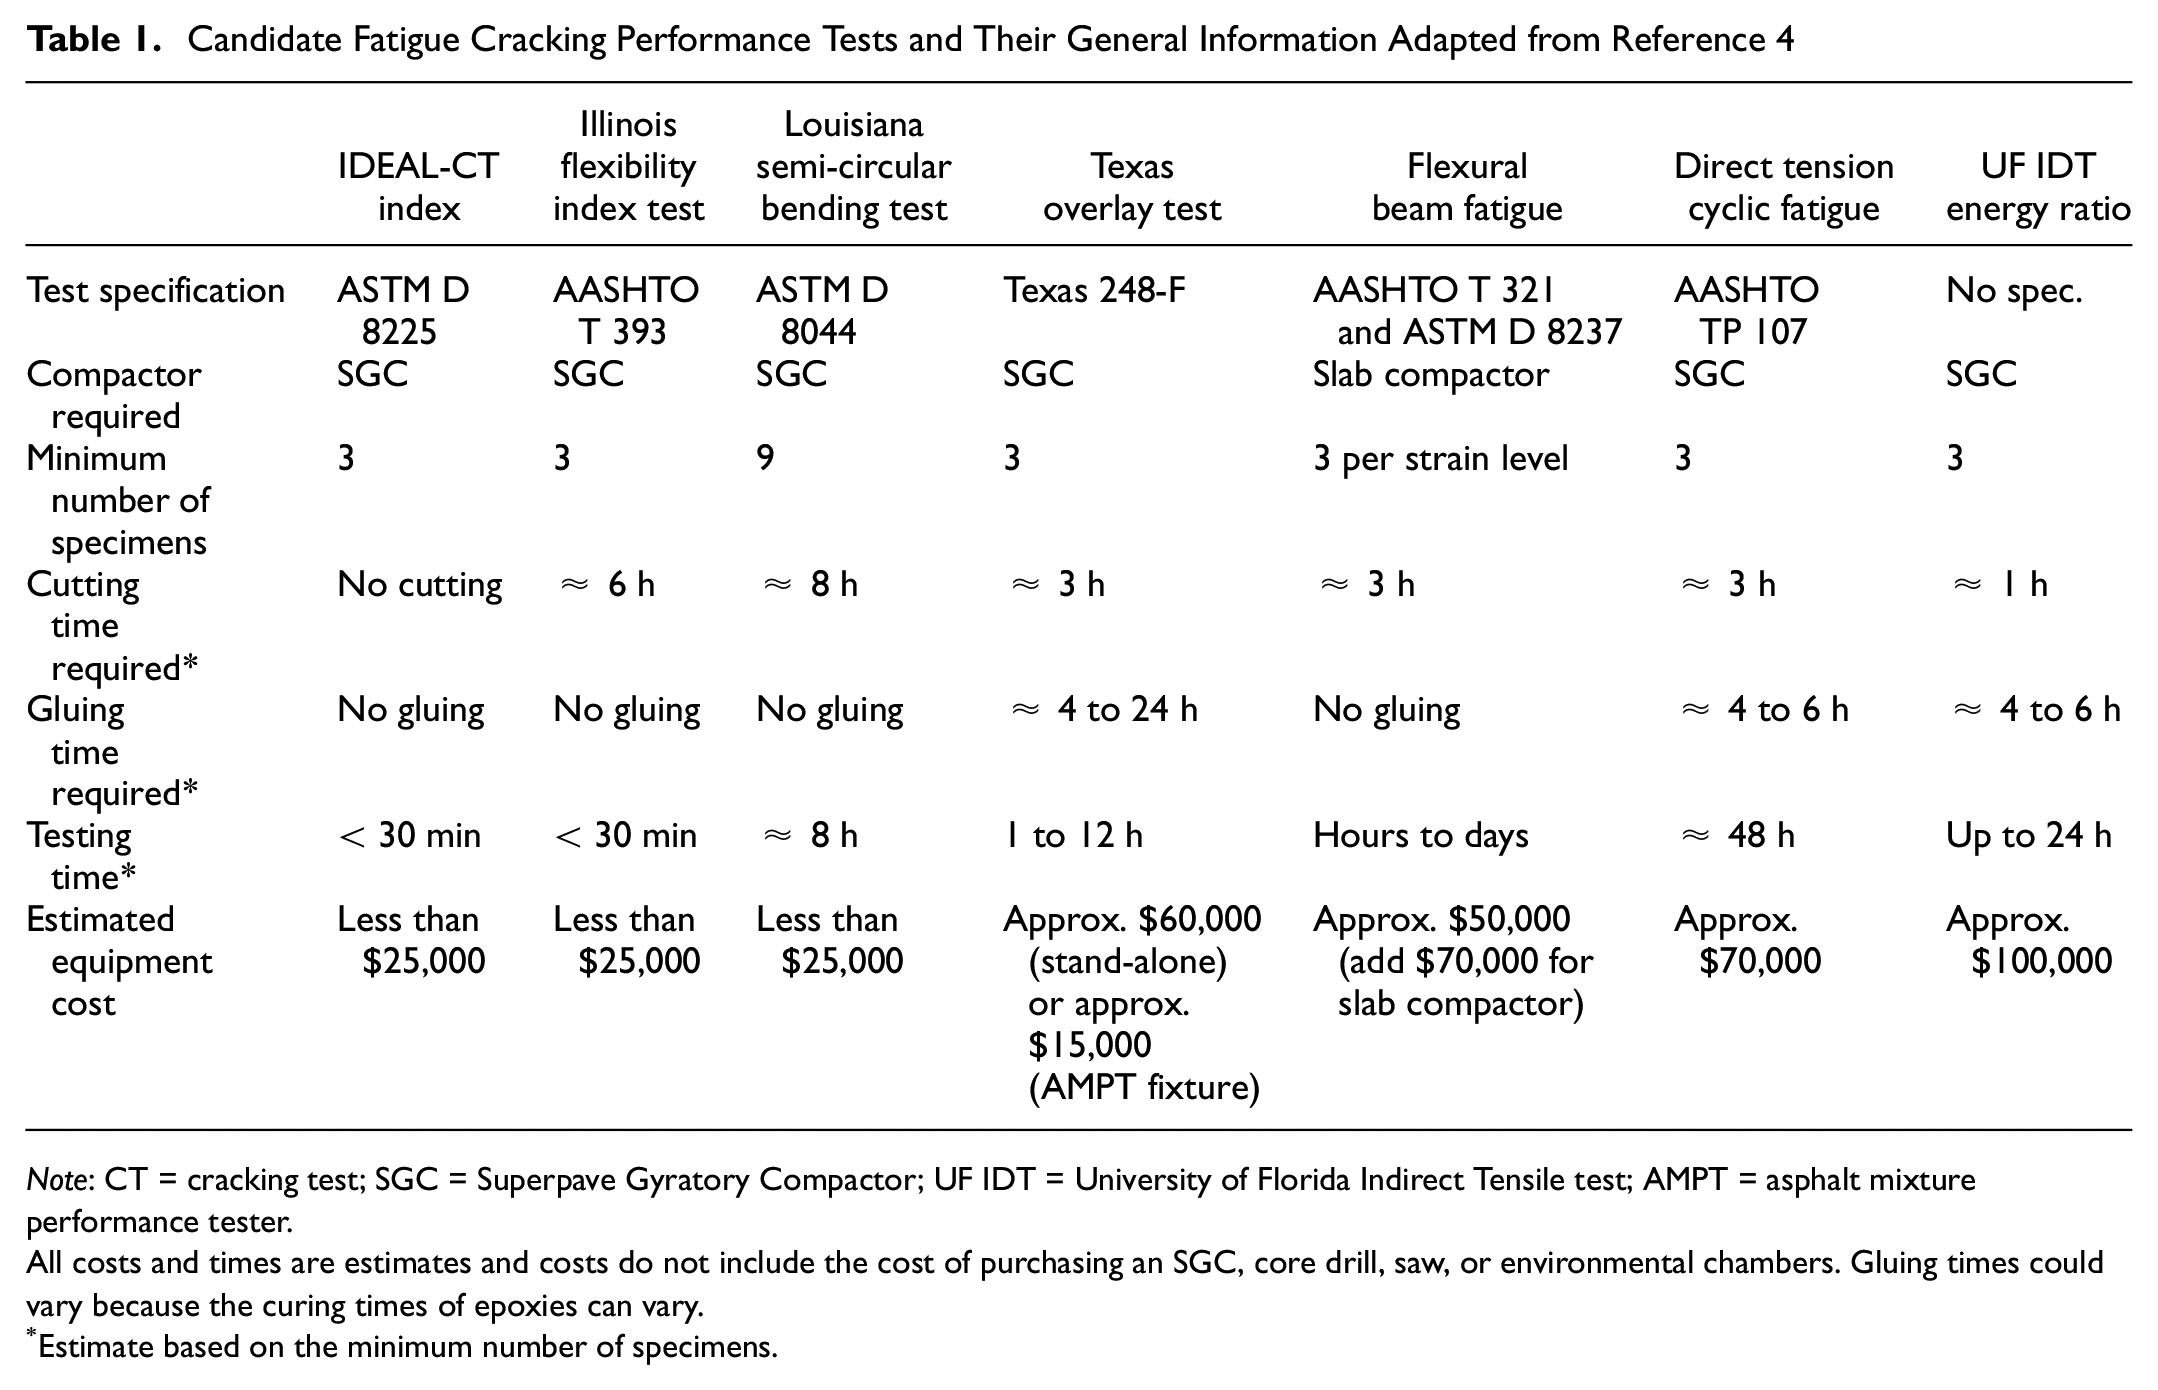
Note: CT = cracking test; SGC = Superpave Gyratory Compactor; UF IDT = University of Florida Indirect Tensile test; AMPT = asphalt mixture performance tester.
All costs and times are estimates and costs do not include the cost of purchasing an SGC, core drill, saw, or environmental chambers. Gluing times could vary because the curing times of epoxies can vary.
Estimate based on the minimum number of specimens.
Table 1 lists information about conducting each test including the relevant specification, the compactor used for specimen fabrication, test time, and cost. The NCHRP Project 9-57 criteria for selecting a test also included availability, simplicity, variability of the test results, sensitivity to mixture properties, complexity of testing and analysis, and lab-to-field correlations. All of these criteria were used in this study as a guide to select a bottom-up fatigue cracking test, although the process was refined by prioritizing the following:
1) The test should have an established standard specification either AASHTO or ASTM.
2) Test specimens can be prepared using the Superpave Gyratory Compactor (SGC) which was the compactor available to the SHA and all contractors in the state.
3) Cost to perform the test.
4) Test specimen preparation is simple and requires little to no cutting or gluing.
5) Overall time to complete the test is low.
6) Analysis of test data is not highly complex.
The Texas Overlay test and the UF IDT Energy Ratio were eliminated because they lack an AASHTO or ASTM standard. The flexural beam fatigue test was eliminated because it requires a slab compactor as opposed to an SGC to fabricate specimens and it was also the most expensive test to implement. Because of both its high cost and longer time required for testing, the direct tension cyclic fatigue was eliminated. The least expensive tests to implement were the IDEAL-CT, Illinois Flexibility Index, and Louisiana Semi-Circular Bending test. Of these, the IDEAL-CT is the fastest test to conduct because no cutting and gluing are required as in the other two tests. Another advantage of the IDEAL-CT is that the specimen size is identical to the specimen size used for the HWTT, which was the selected rutting test. This would save considerable time in trying to determine the proper weight of mixture needed to achieve the target specimen air voids. Based on all of these factors, the IDEAL-CT was selected to be incorporated in the comprehensive BMD protocol. It is noted that a similar decision process would have been conducted for the rutting test selection if it had not already been previously established by the SHA for other reasons.
The process just illustrated for bottom-up fatigue cracking performance can be used as guide for narrowing down the number of tests when many performance tests are available. Since other SHAs may have different priorities for their test selection process, each test should be carefully evaluated before making a final selection. Another important factor that SHAs should address is that they are confident that the test results actually capture the true pavement performance of their mixture and that their performance criteria are valid for all of them.
Question #4: What Mixture Aging Protocols should be used for Performance Testing both during Mix Design and Production QA?
After selecting the performance tests, it is important to address the appropriate mixture aging method to be used. As noted in the definition of a BMD provided by NAPA and AASHTO, performance testing is to be conducted on “appropriately conditioned specimens” ( 1 , 2 ) where being conditioned refers to aging.
Asphalt mixtures are exposed to air and relatively high temperatures during production, transport, placement, and compaction. This exposure will cause the asphalt binder to age and concurrently the mixture itself will experience this aging. This type of aging is generally called short-term aging (STA). After compaction, an asphalt mixture will continue to be exposed to air at ambient temperatures during the service life of a pavement. This type of aging is generally called long-term aging (LTA). Aging can have a negative impact on the cracking resistance of an asphalt mixture ( 10 ). While rutting often occurs early in the service life of a pavement, bottom-up fatigue cracking generally occurs after the pavement has been in service for many years. Therefore, it is imperative that LTA be considered in a BMD protocol because evaluating a mixture’s resistance to cracking using the wrong amount of aging will yield inaccurate measures of performance and ultimately undermine the goals of the BMD process.
SHAs and the paving industry have been using STA when evaluating the volumetric properties and the rutting resistances of asphalt mixtures. Industry guidance for STA to mimic field aging has been to follow AASHTO R 30 “Mixture Conditioning of Hot-mix asphalt,” ( 2 ) which specifies that a loose mixture is to be conditioned in a forced-draft oven for 4 h at 135°C and then brought to the temperature that will be employed for compaction. Because of the long industry track record with using AASHTO R 30 and its widespread acceptance by SHAs, it was selected for inclusion in the comprehensive BMD protocol for volumetric property determination and for the HWTT rutting performance test.
Several protocols have been developed by researchers and practitioners for LTA ( 10 ). The most comprehensive study with regard to LTA is NCHRP Project 09-54 “Long-Term Aging of Asphalt Mixtures for Performance Testing and Prediction” ( 17 ). In this NCHRP project, a laboratory aging procedure was developed that simulates the long-term aged state of an asphalt mixture in a pavement with respect to the depth of the mixture in a pavement structure and climate. NCHRP 9-54 suggested aging a loose mixture at 95°C at a duration ranging from one to more than 20 days to match the amount of field aging based on depth and geographic locations. NCHRP 9-54 provided a series of laboratory aging duration maps to match 4, 8, and 16 years of field aging at depths of 6 mm, 20 mm, and 50 mm below the pavement surface. For asphalt pavements, they are often designed for a service life of 15 to 20 years, while bottom-up fatigue cracking will generally be seen at about two thirds into the service life of a pavement, which is approximately 12 years ( 18 – 20 ). The 50-mm pavement depth was selected because there is not much aging gradient at a depth of 50 mm below pavement surface, although huge aging gradient exists in the top 50 mm asphalt layer(s). For Massachusetts, the NCHRP aging duration maps indicated that LTA aging would be 3 days at 95°C for 12 years of field aging and at a depth of 50 mm.
While the maps published by the NCHRP study provide valuable guidance, it is not reasonable for an SHA or a producer to age their mixtures for three days before compaction. One reason for this is that during the mixture design phase producers are generally designing numerous asphalt mixtures simultaneously and they likely do not have the extra time or the laboratory equipment needed, such as ovens, to do three days of LTA for all mixtures. The time requirement of three days means that more than half one work week is needed for aging alone. Additionally, during production QA under a BMD protocol, a SHA will need to have rapid test results on the quality of their mixtures in meeting targeted mixture performance. Waiting three days, followed by the additional time needed to fabricate, cool, prepare, and test specimens is simply not realistic when trying to accept or reject a mixture or implement corrective actions.
In search of a more reasonable but still reliable LTA protocol, Zhou et al. ( 10 ) conducted a study that used mixtures from Massachusetts and Texas to estimate an aging temperature using a time of 20 h that would be equivalent to the three days at 95°C suggested by the NCHRP project. Zhou et al. ( 10 ) chose 20 h because it was considered to be a reasonable amount of time to implement an aging protocol within a typical work week. A 20-h map developed using 12 years as the field service life which was roughly based on two-thirds of a 20-year pavement design life is shown in Figure 1. For Massachusetts, the map indicated that aging loose asphalt mixtures at 110°C for 20 h would be equivalent to the three-day aging at 95°C. Because of this, Zhou et al. suggested that this new LTA procedure be used in a comprehensive BMD protocol for fatigue cracking performance testing.
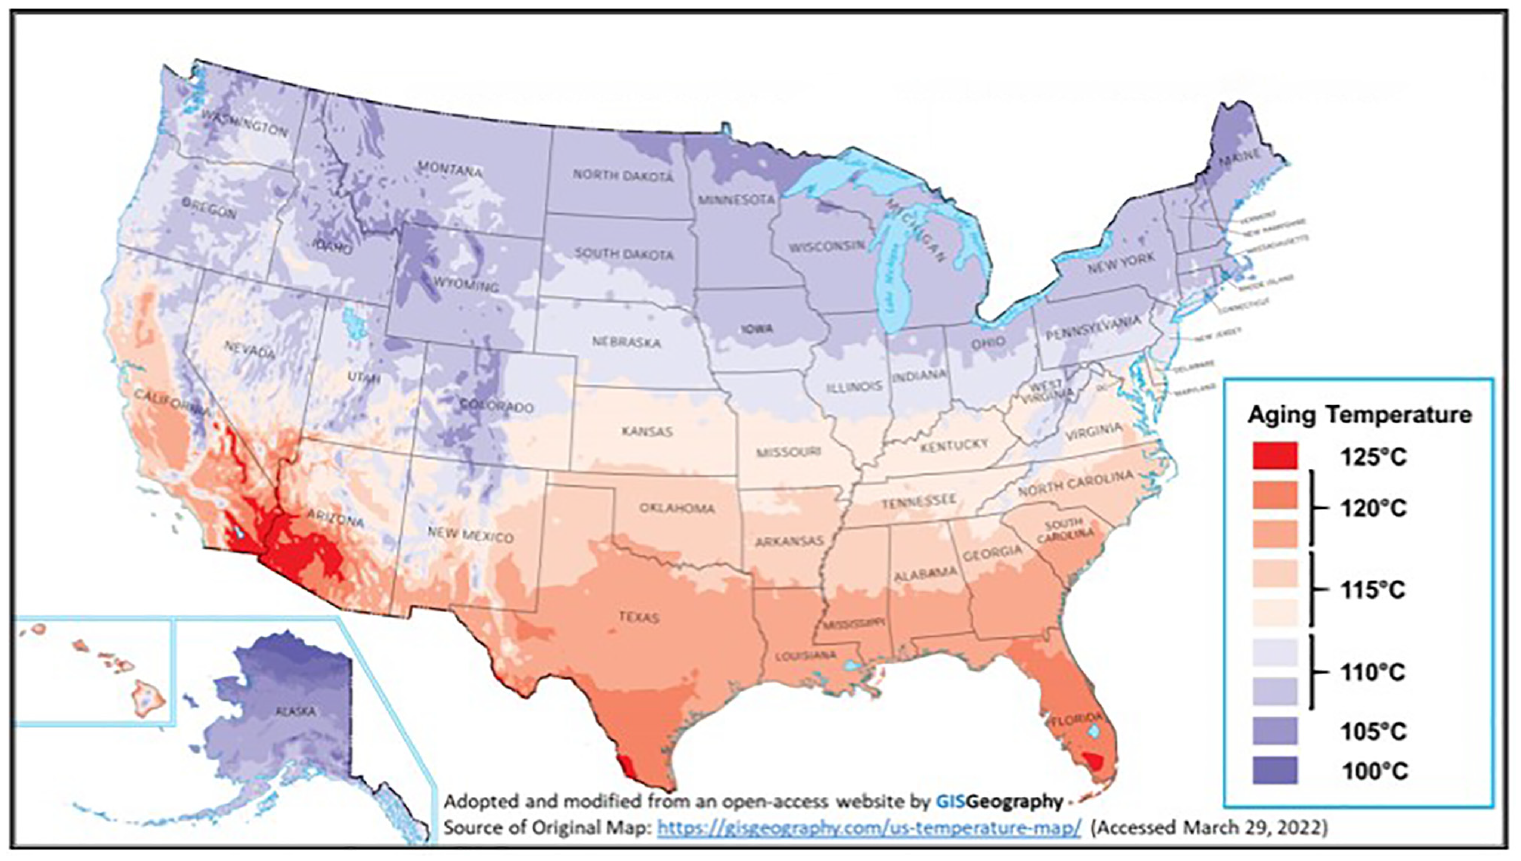
Proposed oven aging temperatures for a duration of 20 h to match 12 years of field aging at 50 mm below pavement surface (°C) ( 10 ).
In conclusion, an SHA must carefully select STA and LTA procedures that they have confidence will adequately simulate actual aging. They must also be able to complete these procedures under the time and resource constraints during mixture design and production QA. In the case of the SHA in this study, the STA procedure was selected based on it being an industry accepted method. The LTA procedure shown in Figure 1 was selected based on the latest available national research work related to pavement aging simulation ( 10 ). Other SHAs may use other STA or LTA procedures, or selection methodologies, when developing their BMD protocols.
Question #5: Does a BMD Remain Balanced within the Specified Production Tolerances and what if the Source of Asphalt Binder, but not the Performance Grade (PG), changes?
The next question relates to production tolerances and the source of the asphalt binder. A comprehensive BMD using Approach A provides a job mix formula (JMF) that meets Superpave or other volumetric design requirements, followed by tests indicating acceptable performance in rutting and cracking using the selected performance tests. During production, any mixture design must meet the JMF within the allowable production tolerances, usually binder content and aggregate gradation. For the SHA in this study, the asphalt binder content production tolerance was ±0.3% of the OBC determined during the mixture design. The production tolerances for the aggregate gradations are shown in Table 2 ( 12 ). Under a BMD, variations in these parameters might influence whether the BMD remains balanced in both volumetrics and performance during production.
Production Tolerance Limits for Combined Aggregate Gradation
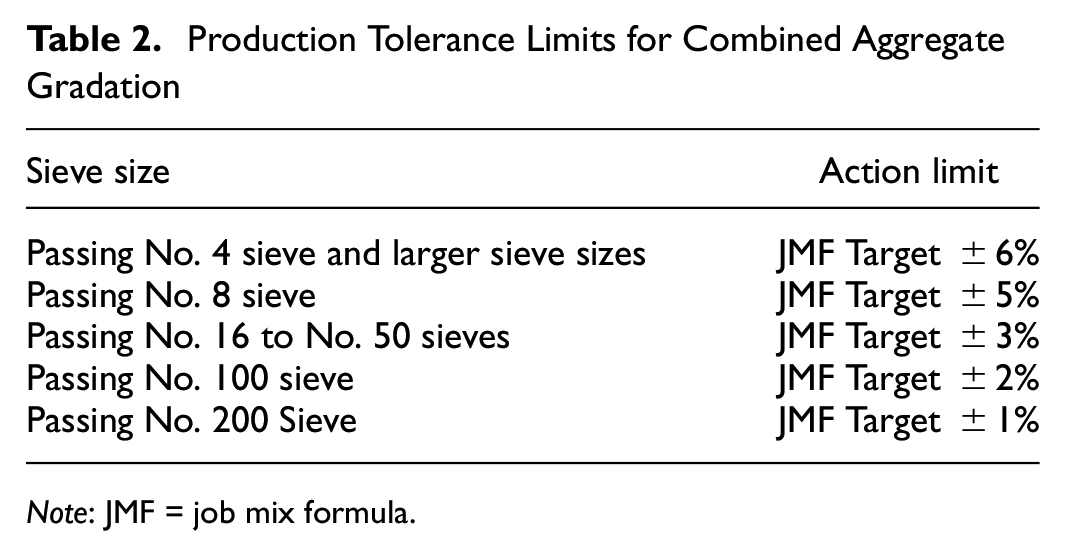
Note: JMF = job mix formula.
Mogawer et al. ( 9 ) conducted a study to determine whether a BMD could become unbalanced during production because of the OBC tolerance and the aggregate gradation tolerances. The study also investigated the effect of a change in binder source that can occur during production. Although the specified PG of an asphalt binder does not change during production, the asphalt binder source might change as a result of seasonal demand.
The study findings indicated that a BMD can become unbalanced during production given production tolerances. Fatigue cracking performance using the IDEAL-CT showed that some mixtures produced at the lower limit of the OBC production tolerance, with or without changes in the production tolerances of the aggregate gradation, were more susceptible to fatigue cracking.
The study also indicated that a BMD can become unbalanced during production as a result of a change in the source of the asphalt binder. The study evaluated two PG 64-28 binders obtained from two different sources. Although these two binder sources had the same PG, and nearly equivalent continuous PGs, they had significantly different relaxation properties as measured by Delta Tc (ΔTc). ΔTc is a parameter that is used to measure a binder’s loss of relaxation caused by aging, which increases the risk of non-load associated cracking ( 21 , 22 ). It is calculated from bending beam rheometer (BBR) measurements at low temperatures using binders that have been aged in the rolling thin film oven (RTFO) followed by the pressure aging vessel (PAV). For each BBR beam, two critical low temperatures are measured. One temperature corresponds to a creep stiffness, S, of 300 MPa and the other to an m-value of 0.300. The difference between these two temperatures, Tc(S) minus Tc(m), is ΔTc. A minimum ΔTc of −5.0°C has been suggested as a preliminary criterion. Therefore, binders with a ΔTc of −5.0°C or more negative are considered unacceptable because they may be susceptible to non-load associated cracking ( 22 ). One source of binder passed this preliminary criterion while the other source failed. Mixture performance testing for cracking using the IDEAL-CT showed that the mixture fabricated with the binder source which passed provided higher, or better, CTIndex values than the mixture fabricated with the binder source which failed. It was concluded that binder source might lead to a BMD becoming unbalanced during production.
In conclusion, the results of this previous study ( 9 ) indicated that production tolerances and binder source should be taken into account when developing a comprehensive BMD protocol. It is suggested that a mixture’s resistance to rutting be evaluated at the upper production tolerance limit for OBC and cracking at: 1) the lower production tolerance limit for the OBC; 2) the lower production tolerance limit for OBC combined with the upper aggregate gradation production tolerance limits; and 3) the lower production tolerance limit for OBC combined with the lower aggregate gradation production tolerance limits. Additionally, it was decided to include a parameter that can evaluate asphalt binder quality if the binder source changes during the production phase. The chosen binder parameter was ΔTc which should be checked for conformance during both the mixture design and the production QA phases.
Question #6: How to Determine the Pass/Fail Criteria for the Selected Performance Tests?
Introduction
Question 6 was primarily answered by the research part of this paper which will now be presented. As previously stated, rutting and fatigue cracking were the two distresses selected to be included in the BMD protocol and the two performance tests were the HWTT and the IDEAL-CT. Based on years of research, the SHA had established performance criteria for the HWTT which it has been using since 2018. Their criteria are a maximum rut depth of 12.5 mm after 20,000 passes and no stripping inflection point (SIP) before 15,000 passes, both at a test temperature of 45°C. The SIP provides an indication of an asphalt mixture resistance to moisture-induced damage. Because of the SHA’s documented experience with this test and its criteria, it was incorporated in the BMD protocol without modification. Therefore, the focus of the remainder of this section was on how to develop a pass/fail criterion for the IDEAL-CT.
In 2021, NAPA published a BMD resource guide to assist SHAs in their efforts to develop and implement a BMD protocol ( 23 ). This guide presents steps that an SHA can use when establishing criteria for performance tests under a BMD protocol. NAPA recommended first performing a statewide benchmarking experiment with the objective of testing existing mixture designs being designed and produced in the state with known field performance. The purpose of the benchmarking experiment is to help the SHA determine the distribution of the performance test results. For the bottom-up fatigue cracking test selected in this study, this would be the distribution of the IDEAL-CT results. Another component of the benchmarking experiment provided by NAPA was testing both laboratory-mixed, laboratory-compacted specimens used for mixture design and plant-mixed, laboratory-compacted specimens used for production QC to determine any factors that may contribute to differences in these test results. NAPA concluded, based on the analysis of all the benchmarking experiment results, that preliminary criteria can be developed ( 23 ). NAPA suggested that they be developed so mixture designs with known field distresses fail.
Beyond conducting a benchmarking study to determine performance test criteria, NAPA suggested that SHAs conduct well-designed and well-constructed field experiments and also consider building one or more long-term pavement performance (LTPP) field experiments in their own state to help establish appropriate performance criteria. However, these would require mixtures to be in service for several years before obtaining any meaningful LTPP data. Another process suggested by the NAPA is to also perform shadow projects. The NAPA guidance defines a shadow project as an existing project that only uses the SHA’s current acceptance tests such as asphalt content, gradation, and VMA, but where additional plant-produced mixture samples are collected throughout the project to be used for mixture performance testing ( 23 ). One objective of these shadow projects is for an SHA to add to its database of test results from their benchmarking experiment. Moreover, the shadow projects can also be used to collect field performance data that can be used to verify the preliminary performance test criteria and make appropriate adjustments if needed.
Performance Test Criterion Selection Methodology
In the research part of this study, a benchmarking experiment was conducted to develop a preliminary performance criterion for the IDEAL-CT. This benchmarking experiment consisted of testing 21 plant-produced mixtures approved by the SHA using the IDEAL-CT at 25°C. All mixtures were Superpave dense-graded mixtures with a nominal maximum aggregate size (NMAS) of 12.5 mm, which is one of the most widely produced and placed mixtures in Massachusetts based on the tonnage produced each year. These 21 mixtures were produced by various contractors at different locations throughout Massachusetts between 2018 and 2022 and they represented the state’s materials, climate, traffic, and construction practices including their aggregate gradations which represented the variety of gradations being used statewide for a 12.5-mm mixture. All mixtures were designed using a PG 64S-28 asphalt binder which is the asphalt binder typically specified used by the SHA.
All IDEAL-CT results from this benchmarking experiment were analyzed statistically using the IBM® SPSS® Statistics software to determine the descriptive statistics of the collected data, which describe the characteristics of a data set in central tendency and variability. Measures of central tendency included the mean, median, and the 50th, 60th, and 70th, percentiles. These three percentiles represent the percent of measurements below a certain value. The outcomes of these statistical analyses were used to initially estimate a preliminary pass/fail criterion for the CTIndex.
A reliable performance criterion must be based on good agreement between laboratory results and field performance so that mixtures with unsatisfactory field performance will fail. Although many of the mixtures used in the benchmarking experiment had also been produced and placed for many years before 2018 with little variation in their individual aggregate gradations and binder contents, the history of their performances does not actually guarantee that these mixtures will continue to perform as they have historically performed because the sources of the asphalt binders used to produce these mixtures have likely changed over the years. Previous studies have illustrated that binder source has an impact on the performance of asphalt mixtures in cracking evaluated using the IDEAL-CT ( 9 ). Therefore, when establishing the performance criterion for the IDEAL-CT, instead of relying on potentially inaccurate past historical performance data or solely on statistics whose relationship to field performance is uncertain, the resistances to bottom-up fatigue cracking of some of the benchmarking mixtures were predicted using the AASHTOWare® pavement mechanistic-empirical design (PMED). This process will be illustrated in the following sections.
Mixture Design Verifications
Samples of the plant-produced mixtures were reheated to the compaction temperature needed for compaction by the SGC. Since these mixtures were STA through production, no additional STA was performed. Each mixture was compacted using the design gyration levels of either 75 or 100 to verify that it met the SHA targeted volumetrics. All mixtures met them which were percent air voids, VMA, VFA, and fines to effective asphalt ratio (P0.075/Pbe). The OBC for all mixtures was between 4.8% and 5.5%.
Benchmarking Experiment for Rutting and Moisture Damage Performance using the HWTT
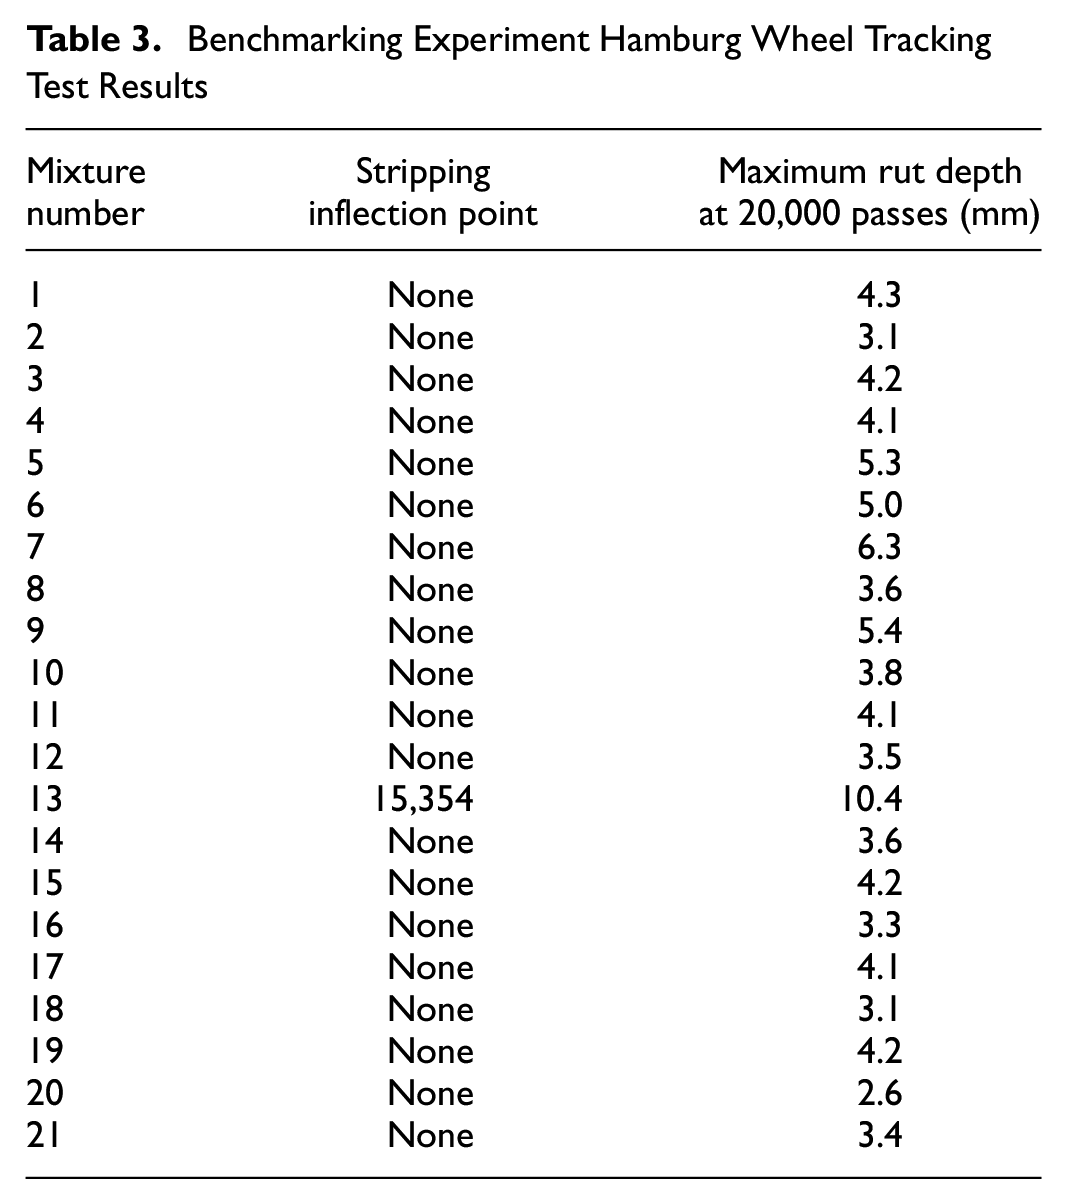
As previously noted, the SHA has used the HWTT performed in accordance with AASHTO T 324 “Standard Method of Test for Hamburg Wheel-Track Testing of Compacted Asphalt Mixtures” ( 2 ) to evaluate a mixture’s resistance to rutting and moisture damage. The SHA requires a test temperature of 45°C. All HWTT results were compared with the SHA specification criteria for the test, which was a maximum rut depth of 12.5 mm after 20,000 passes combined with no SIP before 15,000 passes.
Specimens were fabricated using the plant-produced mixtures heated to the compaction temperature and then compacted in the SGC to an air-void level of 7.0% ± 0.5% Since these mixtures were STA through production, no additional STA was performed. A minimum of two replicates were tested per mixture. After cooling and then subsequently trimming the specimens, they were placed in the HWTT and submerged in heated water at 45°C. Repeated loading was applied to the specimens with a 705N steel wheel. During the test, the rut depths in each specimen were recorded. Additionally, from this rut depth data, the SIP, if any, can be determined, which provides an indication of the onset of moisture damage. Before the SIP, or in the absence of an SIP, the rut depth provides an indication of rutting performance.
As shown in Table 3, all 21 benchmarking mixtures passed the SHA criteria. As noted previously, NAPA guidance suggests that preliminary performance criteria should be selected so that mixture designs with known field distress issues fail. Because the SHA does not generally have roads exhibiting rutting failure for these types of mixtures, it was decided to make no modifications to the rutting criterion.
Benchmarking Experiment Hamburg Wheel Tracking Test Results
Benchmarking Experiment for Fatigue Cracking Performance Using the IDEAL-CT
The benchmarking experiment for fatigue cracking was completed using the IDEAL-CT performed in accordance with ASTM D8225 “Standard Test Method for Determination of Cracking Tolerance Index of Asphalt Mixture Using the Indirect Tensile Cracking Test at Intermediate Temperature” ( 24 ). A minimum of four specimens were fabricated for each of the 21 mixtures. Each mixture was heated up to its compaction temperature and then compacted in the SGC to obtain a specimen height of 62 mm. Since these mixtures were plant-produced, they were considered STA aged, which meant that no additional STA aging was conducted. Also, no LTA was conducted because the criterion would be applied during the mixture design phase and production QA phase where the same amount of aging must be used but where there are significant limitations on the time available to perform testing especially during the production QA. Even so, the use of LTA is addressed in the comprehensive BMD that will be presented at the end of this paper. The IDEAL-CT specimens had the same dimensions—150 mm in diameter and 62 mm in height—as the specimens tested by the HWTT and the same target air voids of 7% ± 0.5%.
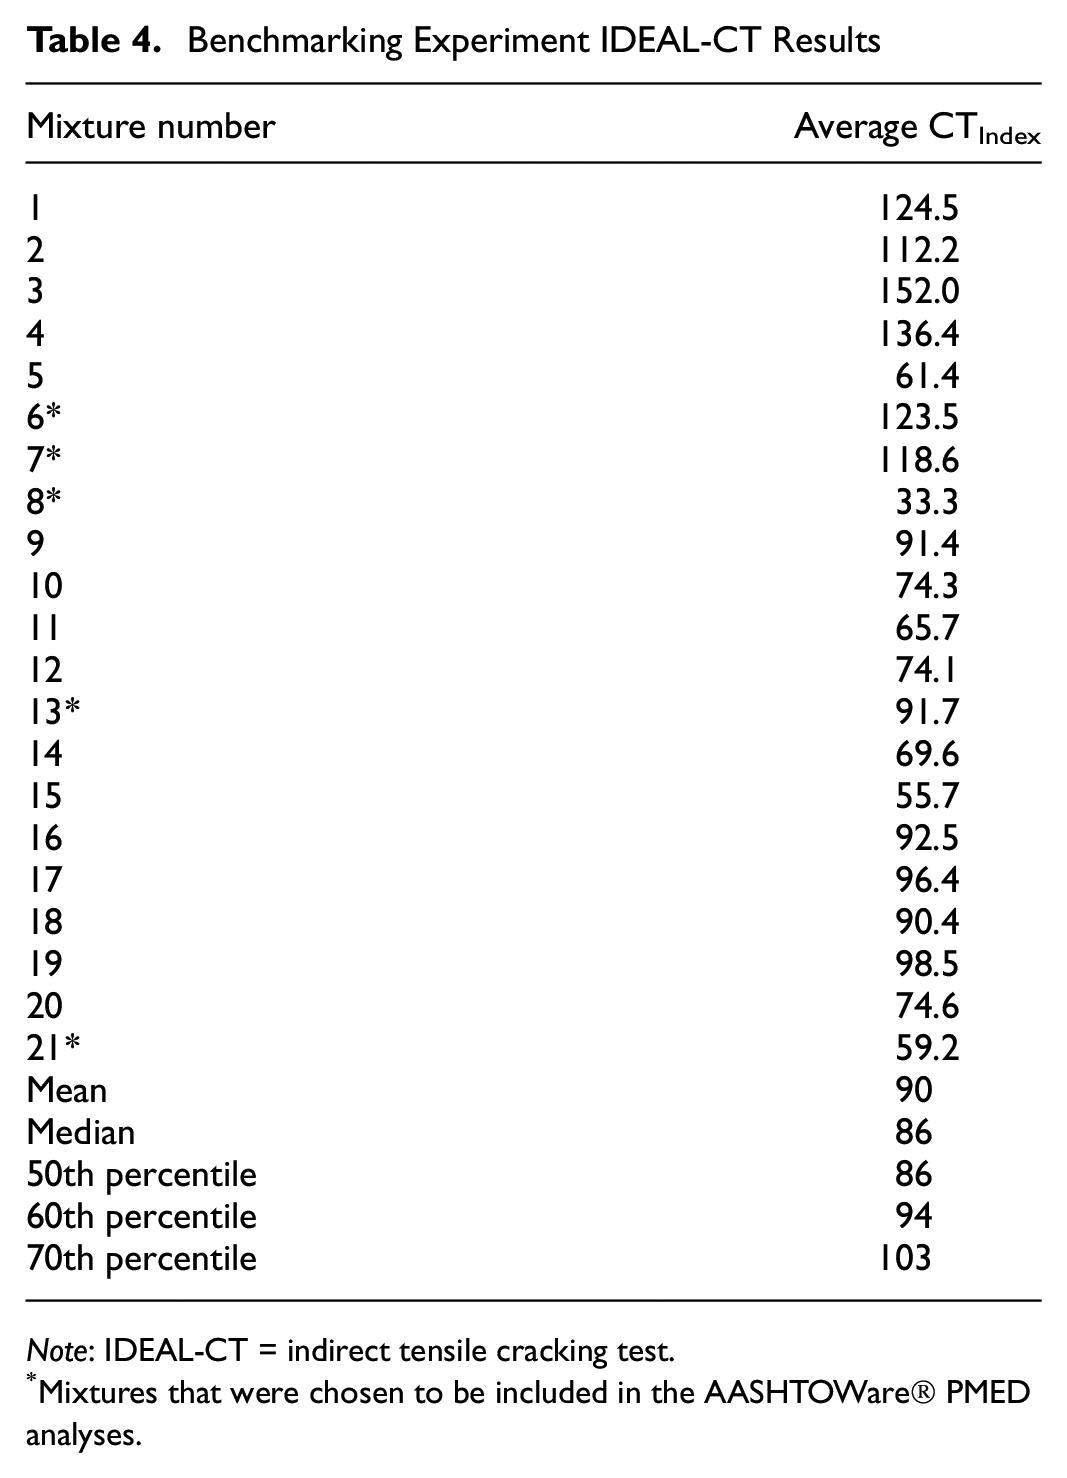
Using the IDEAL-CT, a load is applied along the diameter of the cylindrical specimen at a constant load-line displacement (LLD) rate of 50 ± 2.0 mm/min. The load and the LLD are measured throughout the duration of the tests and are then used to calculate a cracking index known as the cracking index tolerance, or CTIndex. The higher the CTIndex, the more resistant a mixture is to cracking ( 24 ). A detailed description of the CTIndex calculation is available in ASTM D8225 ( 24 ). The average CTIndex results for each of the 21 benchmarking mixtures are shown in Table 4. At the bottom of Table 4, the descriptive statistics of all the raw CTIndex results computed based on the replicate test results are also provided.
Benchmarking Experiment IDEAL-CT Results
Note: IDEAL-CT = indirect tensile cracking test.
Mixtures that were chosen to be included in the AASHTOWare® PMED analyses.
Based on descriptive statistics at the bottom of Table 4, there were three CTIndex values that the SHA could select as a preliminary pass/fail criterion. They were 86, 94, and 103 at the 50th, 60th, and 70th percentiles. The choice would depend on what percentage the SHA knew would potentially have fatigue cracking issues in the field. However, which percentile to select was actually not known.
Any preliminary criterion would need to be selected so that it was not too lenient where a majority of mixtures pass or not too strict where a majority of mixtures fail. Figure 2 shows the percentage of benchmarking experiment results that would pass various preliminary CTIndex criteria. This figure was based on the data for all individual tests, rather than averages. At lower CTIndex criteria of 30, 40, and 50, nearly all the data passed, being greater than 94%; thus, any criterion using them might be too lenient. Similarly, above a CTIndex criterion of 110, nearly all of the data failed, being greater than 80%; thus, any criterion based on it might be too stringent. From Figure 2, CTIndex criteria of 86, 94, and 103, representing the 50th, 60th, and 70th percentiles, corresponded to 49%, 40% and 29% of the data that would pass respectively. It was then a matter of choice of a preliminary criterion. Since the criterion was only preliminary, it was decided to use a passing criterion of ≥ 90, where 43% of the data passed which meant that it was not highly biased with regard to having the mixtures either pass or fail. Note that this decision was based only on the descriptive statistics presented in Table 4. Although other statistical analyses were also employed, none yielded a better means for determining a preliminary criterion. The bottom-up fatigue cracking predictions provided by AASHTOWare® PMED would then be used to validate this preliminary criterion.
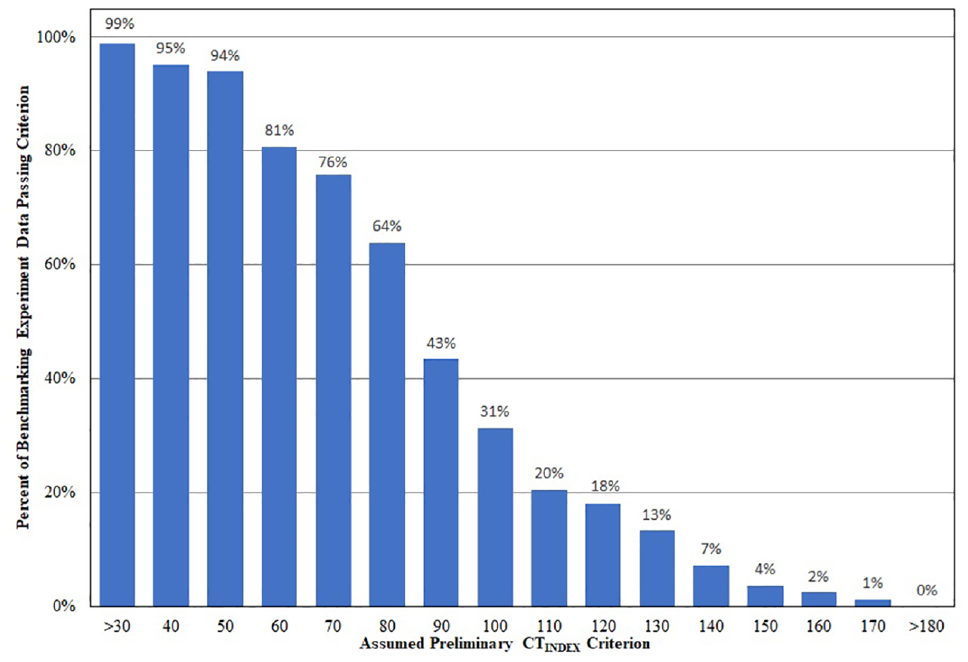
Percentage of benchmarking mixture data passing with an assumed preliminary CTIndex criterion.
Prediction of Bottom-Up Fatigue Cracking Using AASHTOWare® PMED
To validate the preliminary CTIndex passing criteria of ≥ 90, five benchmarking mixtures that had average CTIndex values greater than 90, less than 90, and almost equivalent to 90 were selected. The five mixtures were #6, #7, #8, #13, and #21 and, as shown in Table 4, they had average CTIndex values of 123.5, 118.6, 33.3, 91.7, and 59.2 respectively. Another reason why these five mixtures were chosen is that only they provided the amount of material needed to perform a thorough AASHTOWare® PMED analysis. The bottom-up fatigue cracking performance of these five mixtures were then predicted using AASHTOWare® PMED version 2.6.2 Level 1.
Although AASHTOWare® PMED version 2.6.2 Level 1 predicts fatigue life for both bottom-up and top-down fatigue cracking, as previously presented, this study focused on bottom-up fatigue cracking. Generally, asphalt pavements are designed with a service life of 20 years and fatigue cracking appears about two-thirds of the way into the service life of a pavement ( 10 ). Therefore, fatigue cracking would appear around or after 12 years of service. MassDOT has its own distress identification manual ( 25 ) which defines the extent of fatigue cracking as “light” when less than 15% of the pavement surface is cracked which means that this percent area cracked is acceptable. Based on this, for the preliminary CTIndex passing criterion of ≥ 90 to be valid, the fatigue cracking predictions from AASHTOWare® PMED should show that the 15% area cracked for the mixtures having a CTIndex≥ 90 would be reached after 12 years of service while for those with a CTIndex < 90 would be reached after less than 12 years of service.
Determination of the Level 1 Inputs for the AASHTOWare® PMED
AASHTOWare® PMED includes three hierarchical input levels defined as Levels 1, 2, and 3. Level 1 provides the most accurate predictions as its inputs are project specific. Level 2 incorporates regional inputs that are not project specific. Level 3 uses default inputs. Level 1 inputs are pavement cross section, climate, and the material properties for each asphalt mixture layer, the unbound layers, and subgrade. For consistency, all inputs were kept constant except for those related to the asphalt mixtures, which include the properties of the asphalt binders, properties such as volumetrics and unit weight, and the dynamic moduli of the mixtures.
Asphalt Binder Characterization Needed for AASHTOWare® PMED
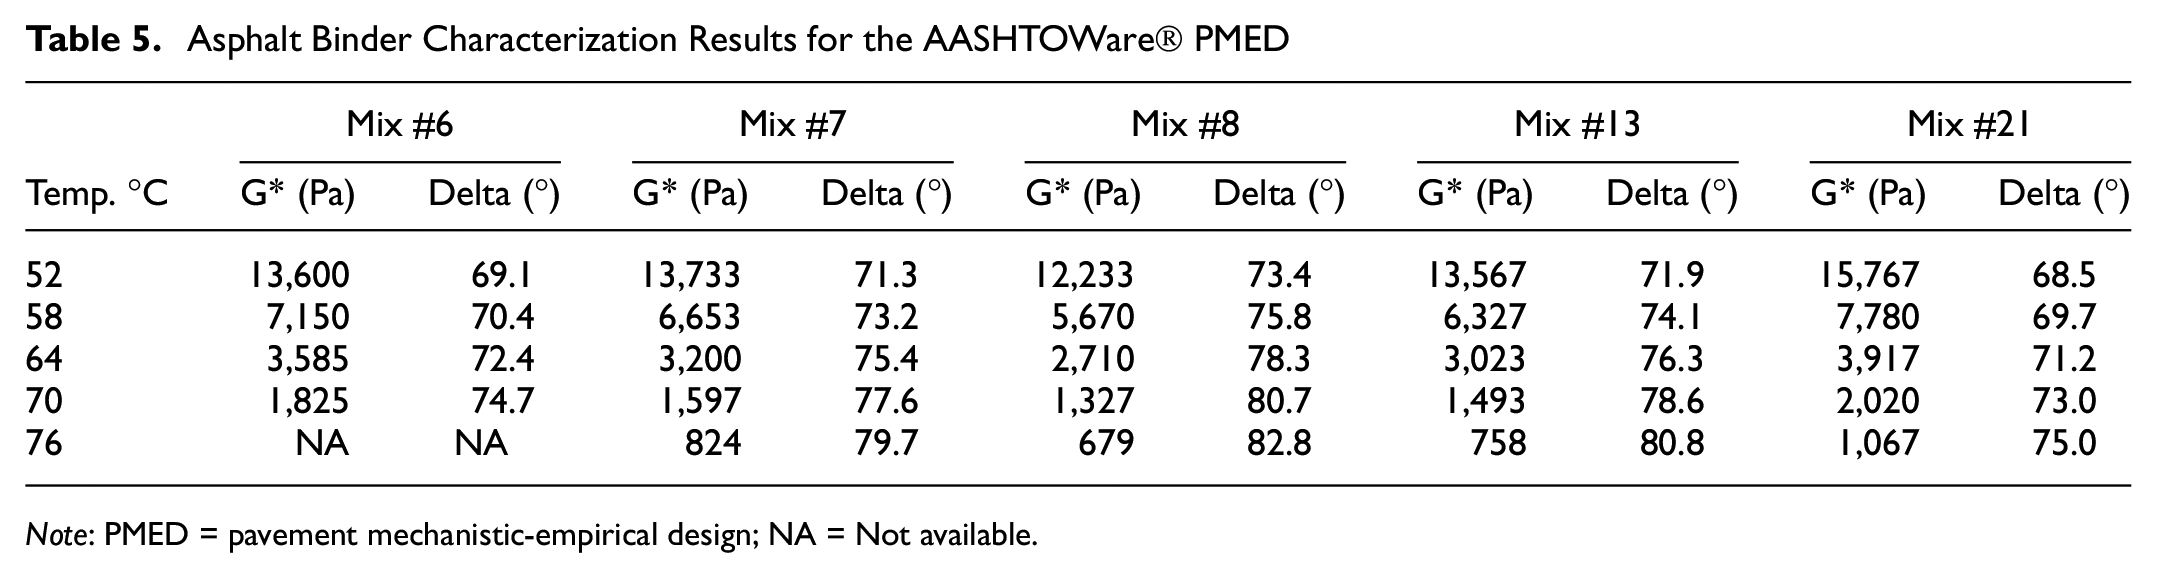
The required binder properties were the shear moduli (G*) and phase angles (°) at multiple temperatures. These properties were measured for each of the five PG 64S-28 binders used in the benchmark mixtures. These binders were sampled when the benchmarking mixtures were being sampled during production QA.
Each binder was first short-term aged in the RTFO in accordance with AASHTO T 240 “Standard Method of Test for Effect of Heat and Air on a Moving Film of Asphalt Binder (Rolling Thin Film Oven Test)” ( 2 ). The aged binder residue was then tested in the dynamic shear rheometer (DSR) in accordance with AASHTO T 315 “Standard Method of Test for Determining the Rheological Properties of Asphalt Binder Using a dynamic shear rheometer (DSR)” ( 2 ) at 52°C, 58°C, 64°C, 70°C, and 76°C (125.6°F, 136.4°F, 147.2°F, 158.0°F, and 168.8°F). The average results are shown in table 5.
Asphalt Binder Characterization Results for the AASHTOWare® PMED
Note: PMED = pavement mechanistic-empirical design; NA = Not available.
Mixture Volumetric Properties and Unit Weight Needed for AASHTOWare® PMED
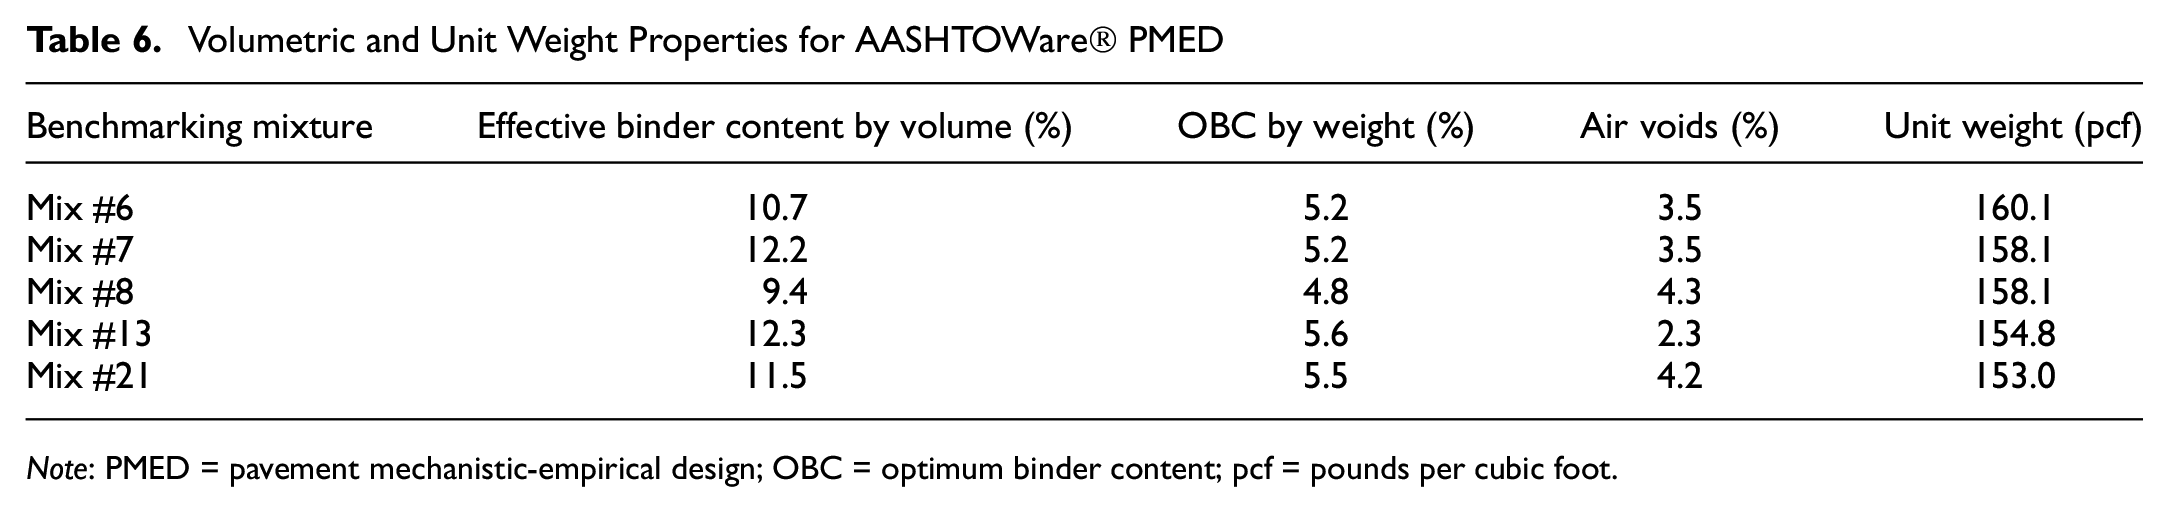
The required mixture properties shown in Table 6 were obtained from production records supplied by the SHA.
Volumetric and Unit Weight Properties for AASHTOWare® PMED
Note: PMED = pavement mechanistic-empirical design; OBC = optimum binder content; pcf = pounds per cubic foot.
Mixture Dynamic Modulus
The required dynamic moduli (|E*|) of the five mixtures, which is a key parameter used in predicting bottom-up fatigue cracking, were measured. Testing was performed in accordance with AASHTO T 378 “Standard Method of Test for Determining the Dynamic Modulus and Flow Number for Asphalt Mixtures Using the Asphalt Mixture Performance Tester (AMPT)” ( 2 ) using three test temperatures of 4°C, 20°C, and 40°C and six loading frequencies of 0.1, 0.5, 1, 5, 10, and 25 Hz at each temperature.
Loose mixtures were reheated, split, brought to the compaction temperature, and then compacted by the SGC. The cylindrical specimens were 180 mm in height by 150 mm in diameter and the air-void content was between 8% and 9%. A minimum of four replicate specimens were fabricated for each mixture. A 100-mm core was then removed from the middle of each of the fabricated specimens. The ends of this core were then cut so that the final height was 150 mm. The target air-void content of each of these 100 mm by 150 mm cores was 6% to 8%, which corresponds to the anticipated in-place density after construction. One specimen of each mixture was used to tune the AMPT to collect more accurate dynamic moduli. The three remaining specimens were then tested for their dynamic moduli.
Dynamic moduli at five temperatures of −10°C, 4°C, 20°C, 40°C, and 54°C (14.0°F, 39.2°F, 68.0°F, 104.0°F, 129.2°F) and at six frequencies of 0.1, 0.5, 1, 5, 10, and 25 Hz are needed to perform an AASHTOWare® PMED analysis. However, the dynamic moduli at the low and high temperature of −10°C and 54°C could not be measured because of the machine limitations. The required dynamic moduli at these two temperatures were then obtained from a mixture master curve. To do this, the dynamic moduli for the three replicate specimens of each mixture were loaded into an analysis software program called FlexMat™ developed by North Carolina State University. This software plotted the master curve, which was then used to predict the dynamic moduli at −10°C and 54°C for all six frequencies. Figure 3 shows the master curves for the mixtures at a reference temperature of 21.1°C.
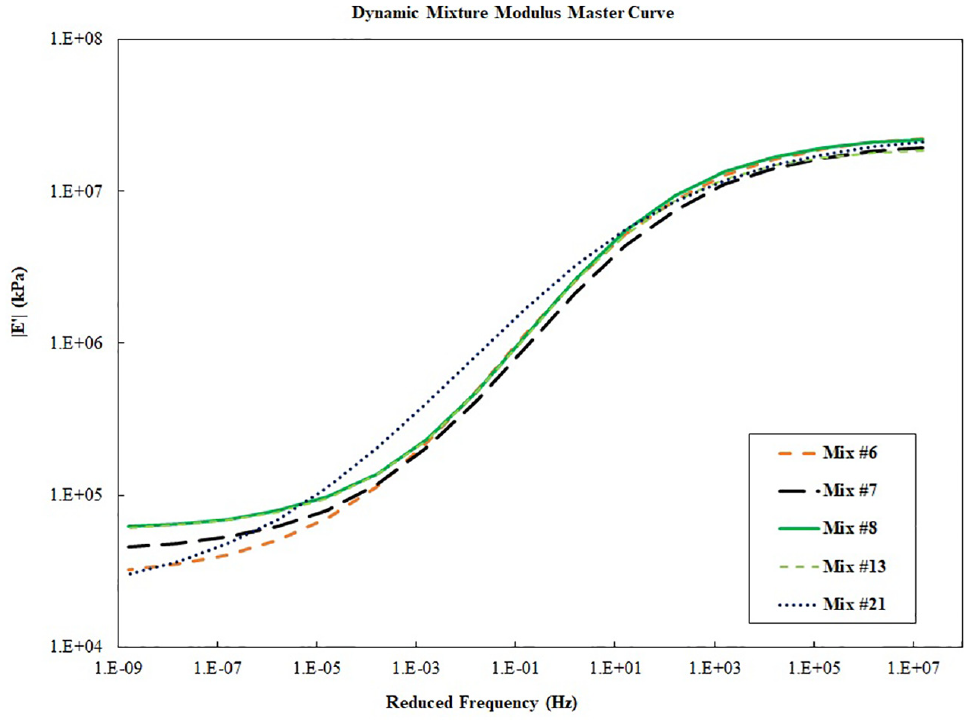
Mixture master curves.
Determination of Laboratory Fatigue Strength Coefficients Needed for AASHTOWare® PMED
AASHTOWare® PMED predicts both bottom-up and top-down fatigue cracking using an incremental damage analysis which is done by calculating the allowable number of load applications using Equation 1 ( 26 ):
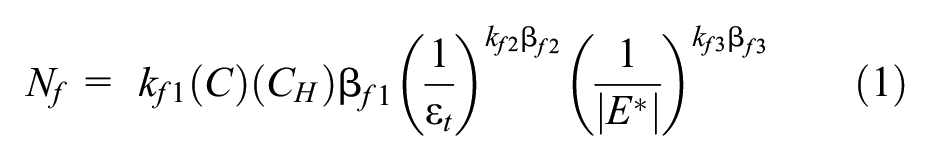
where
Nf = allowable number of load applications,
εt = tensile strain from the pavement response model at critical locations, in./in.,
|E*| = dynamic modulus, pounds per square inch (psi),
VFA = voids filled with asphalt expressed as a decimal,
CH = thickness correction factor,
k1f, k2f, k3f = laboratory fatigue strength coefficients, and
β1f, β2f, β3f = local calibration factors.
The laboratory fatigue strength coefficients, k1f, k2f, k3f, used by AASHTOWare® PMED are normally based on the software’s global laboratory-derived strength coefficients. To provide more accurate predictions for bottom-up fatigue cracking in Massachusetts, local coefficients were determined using flexural beam fatigue tests performed on each of the five benchmarking mixtures. Beams were tested in accordance with AASHTO T 321 “Standard Method of Test for Determining the Fatigue Life of Compacted Asphalt Mixtures Subjected to Repeated Flexural Bending” ( 2 ).
For each of the five mixtures, large blocks of mixture having dimensions of approximately 150 mm in width by 150 mm in height by 450 mm in length were fabricated by reheating and splitting each loose mixture to have a weight of approximately 22 to 25 kg, heating it to the compaction temperature with no additional laboratory aging, and then compacting it in the IPC Global PReSBOX, which is a shear compactor designed to make relatively large asphalt mixture blocks. From each block, four testing beams were cut using a double-bladed saw to achieve a final dimension of 63 mm in width by 60 mm in height by 380 mm in length with a ±6 mm tolerance on all dimensions, as required by AASHTO T 321. The target air-void content of each beam was 6% to 8%, which corresponded to the anticipated in-place density after construction. The minimum number of large blocks fabricated for each mixture was three, yielding 12 beams per mixture, which were needed to perform the tests at 10°C, 20°C, and 30°C and using four strain levels per temperature. Failures within a range of 10,000 to 1,000,0000 cycles were recommended by Bonaquist for typical dense-graded mixtures ( 26 ), and to achieve this testing at 500 micro-strains at each temperature. The strain levels would then be increased or decreased in increments of 100 to 200 µstrains to obtain failures within 10,000 to 1,000,0000 cycles. As the test temperature is increased, higher strain levels are required.
To calculate the laboratory fatigue strength coefficients k1f, k2f, and k3f needed for Equation 1, the results from all laboratory beam fatigue tests for each mixture were fitted to Equation 2, where AASHTO T 321 defines Nf-BF as the number of cycles where the product of flexural stiffness and load cycles (S times N) reaches its peak. This peak is determined by fitting a sixth order polynomial to the data and setting the equation for the derivative to zero.
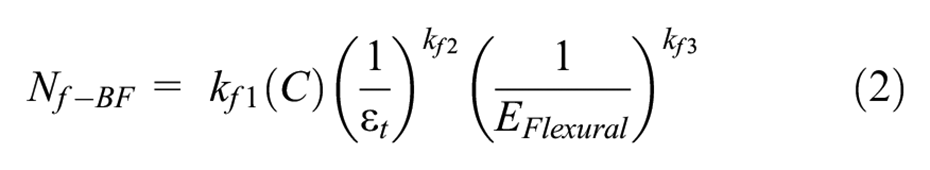
where
Nf-BF = number of load cycles to failure determined in accordance with AASHTO T321,
C = 104.84(VFA-0.69),
εt = tensile strain used in the fatigue test, in./in.,
Eflexural = modulus at 50 cycles from AASHTO T321, psi,
VFA = voids filled with asphalt expressed as a decimal, and
k1f, k2f, k3f = laboratory fatigue coefficients.
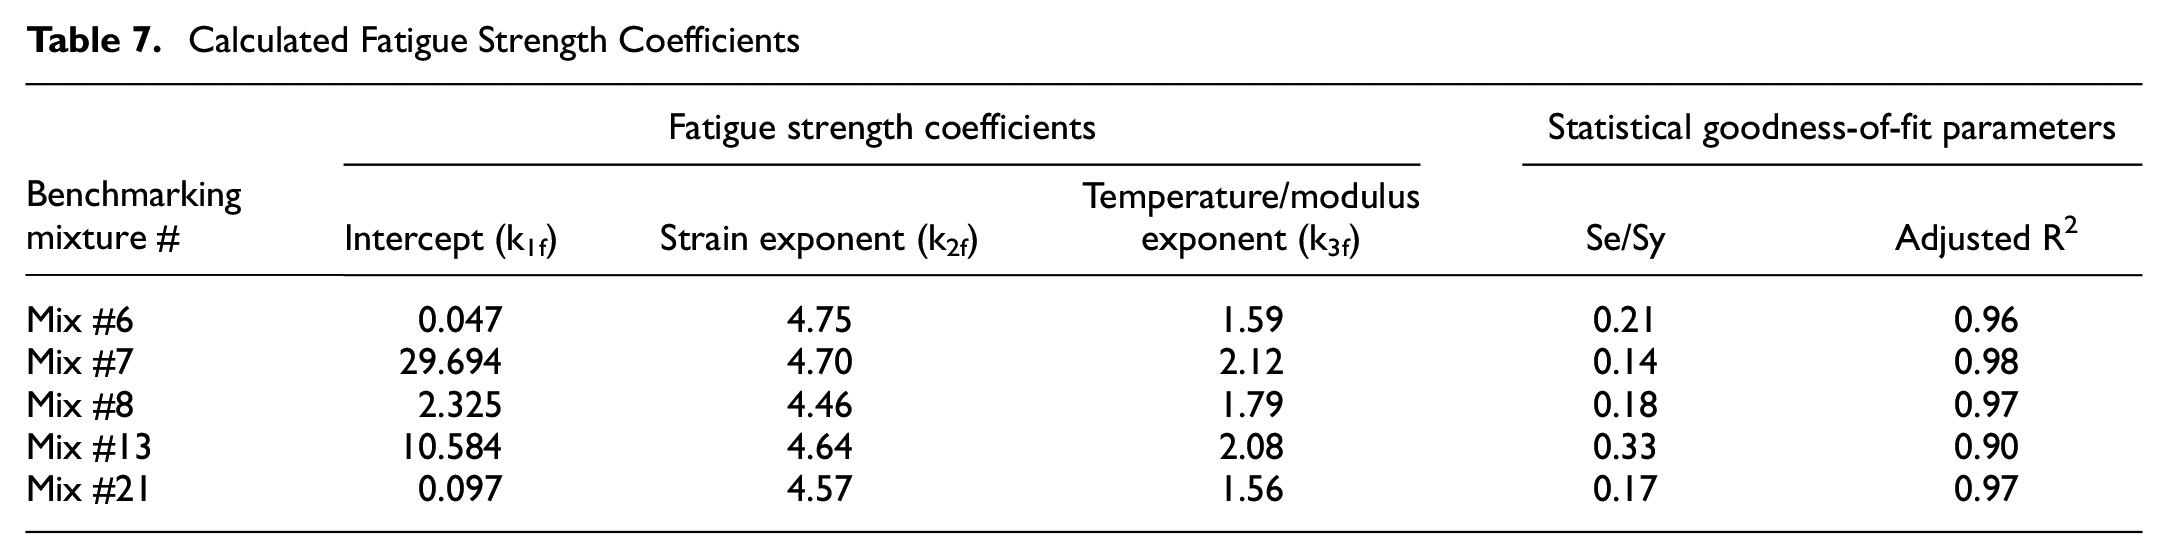
Table 7 lists the fatigue strength coefficients for each mixture and statistical goodness-of-fit between each individual laboratory measured
Calculated Fatigue Strength Coefficients
Determination of Local Calibration Factors, β1f, β2f, and β3f Needed for AASHTOWare® PMED
The local calibration factors, β1f, β2f, and β3f used by the AASHTOWare® PMED cracking model (see Equation 1) were adjusted to the local conditions of Massachusetts using available pavement section data from the long-term pavement performance (LTPP) database. The SHA has three sections listed in the LTPP database. In this study, the LTPP 25-1004 pavement section was used for calibration as the pavement performance data of this section was collected up to 2016, whereas the performance data for the other sections were monitored only to 1998 for one section and 2004 for the other section. The extracted alligator-fatigue cracking performance from LTPP, as a percentage of total lane area, was originally 0% and increased to 7.2% in 2011. The calibration process was performed by modifying the tensile strain exponent field adjusted constant
Prediction of Bottom-Up Fatigue Cracking Using AASHTOWare® PMED
AASHTOWare® PMED version 2.6.2 was then used to validate the minimum CTIndex preliminary performance criterion of 90 based on the descriptive statistics. As previously presented, the AASHTOWare® PMED predictions should show that the 15% area cracked for mixtures having a CTIndex≥ 90 was reached after 12 years of service while for those with a CTIndex < 90 was reached after less than 12 years of service.
AASHTOWare® PMED incorporates the laboratory measured G* and δ of the asphalt binders, volumetric properties, and unit weight, the |E*| master curve, and the calculated fatigue strength coefficients, k1f, k2f, and k3f. To allow for a fair comparison of the predicted bottom-up fatigue cracking performance among the different mixtures, a common set of pavement structure, traffic, and climate inputs were used for all predictions. These included an initial two-way average annual daily truck traffic (AADTT) of 3,000 with a 3% annual linear growth factor, 50% trucks in the design direction, 80% trucks in design lane, 90% reliability, and a 20-year design life, which resulted in about 11.3 million trucks in the design lane over the design period. Analyses were conducted using a flexible pavement structure composed of a 9-in. asphalt pavement layer; a 15-in. crushed stone base layer with a resilient modulus of 22 kips per square inch (ksi) and a prepared A-2-4 subgrade soil with a modulus of 7 ksi. Figure 4 shows the predicted bottom-up fatigue cracking for the five selected mixtures.
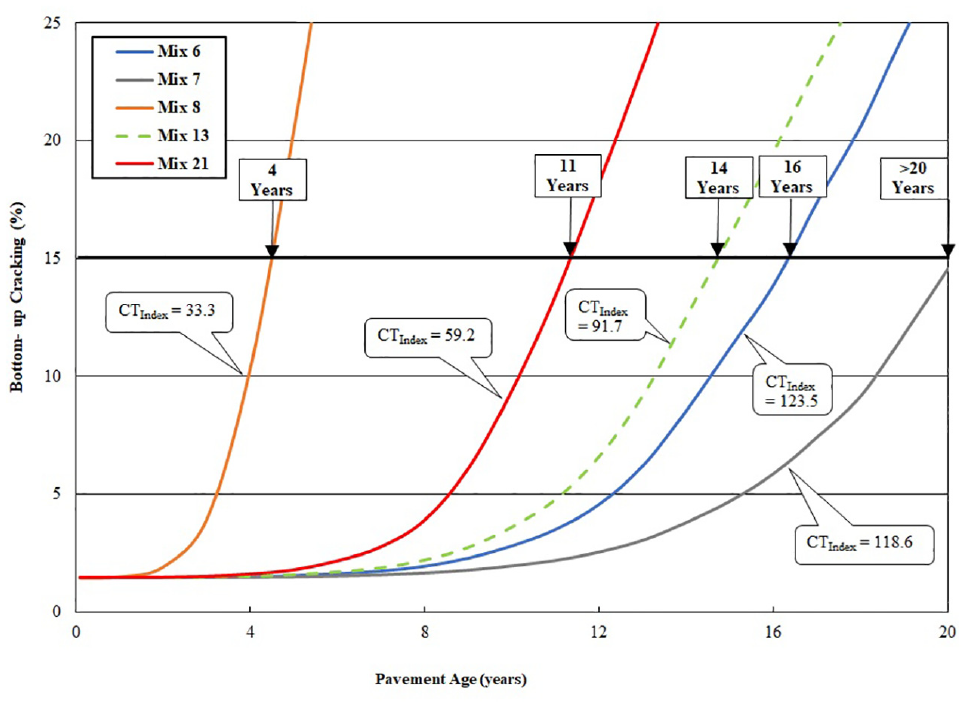
AASHTOWare® PMED predicted bottom-up fatigue cracking for the five benchmarking mixtures each having a different CTIndex.
Performance Criterion for the IDEAL-CT with regard to STA
As previously presented, AASHTOWare® PMED should show that the 15% area cracked for mixtures having a CTIndex≥ 90 was reached after 12 years of service while for those with a CTIndex < 90 it was reached in less than 12 years of service. Based on Figure 4, the mixtures with a CTIndex≥ 90, which were Mix #6 at 123.5, Mix #7 at 118.6, and Mix #13 at 91.7, were predicted to have more than 12 years of service before 15% of the area cracked. The service lives were 16, >20, and 14 years respectively. Mixtures with CTIndex < 90, which were Mix #8 at 33.3 and Mix #21 at 59.2, had less 12 years of service. Their service lives were 4 and 11 years, respectively. Based on these findings, the preliminary passing criterion CTIndex≥ 90 is valid for dense-graded 12.5 mm STA mixtures in the state. This criterion could be used until long-term field study data can be measured to further validate or invalidate its use.
Performance Criterion for the IDEAL-CT with Regard to LTA
As noted earlier, both STA and LTA should be considered when developing a BMD protocol. The minimum CTIndex criterion of 90 developed for bottom-up fatigue cracking was determined using 12.5 mm mixtures subjected to STA with a PG 64S-28 binder. Thus, this criterion would be valid during both the mixture design and production QA phases. For a comprehensive BMD protocol, in the intermediate phase between them, the performance of a mixture should be checked with respect to LTA to allow adjustments to the mixture to be made before production to ensure long-term performance. It is suggested that only cracking related performance need be evaluated as these distresses typically occur later in the pavement life, whereas rutting occurs early.
The criterion for a cracking related test in a BMD will likely have to be modified to account for LTA, as the STA criterion will likely be too stringent. The authors of this study have started an initial benchmarking experiment with respect to LTA for the IDEAL-CT, and the initial results are shown in Table 8. As can be seen from the data, there is a reduction in the average CTIndex for all mixtures using the proposed 110°C for 20-h LTA protocol, although the ranking remained the same as STA specimens.
Initial Benchmarking Experiment IDEAL-CT Results with Respect to Aging
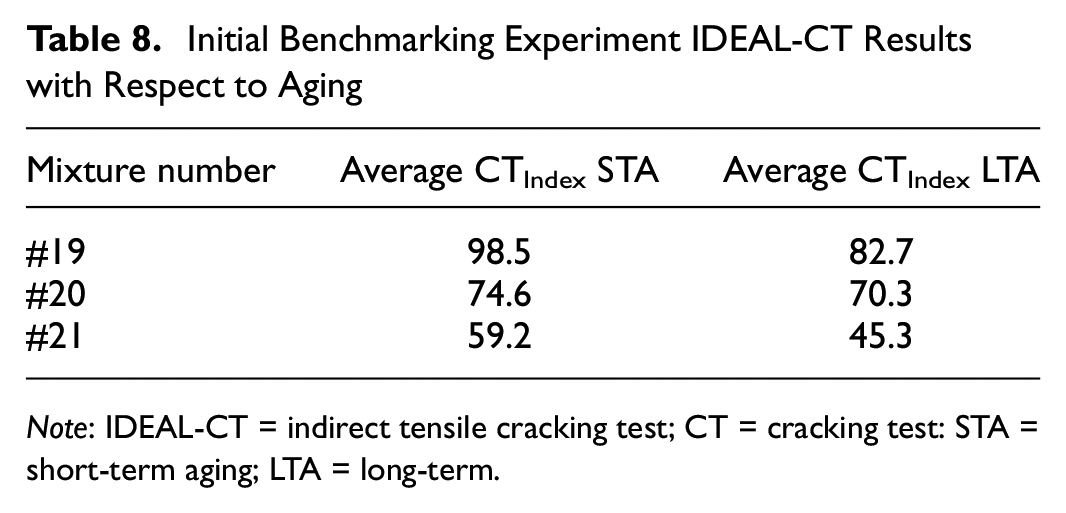
Note: IDEAL-CT = indirect tensile cracking test; CT = cracking test: STA = short-term aging; LTA = long-term.
It is suggested that an SHA should complete a separate benchmarking experiment study where only LTA specimen cracking test data are considered.
Developed Comprehensive BMD Protocol
The final comprehensive BMD protocol developed for the SHA in this study is shown in Figure 5. It addresses each of the six questions posed in this study. It covers all phases from design to production (QA) including an intermediate phase which was just discussed. It addresses specimen aging, binder source/quality checks, and production tolerance checks on top of what has been suggested be included in a BMD protocol to date.
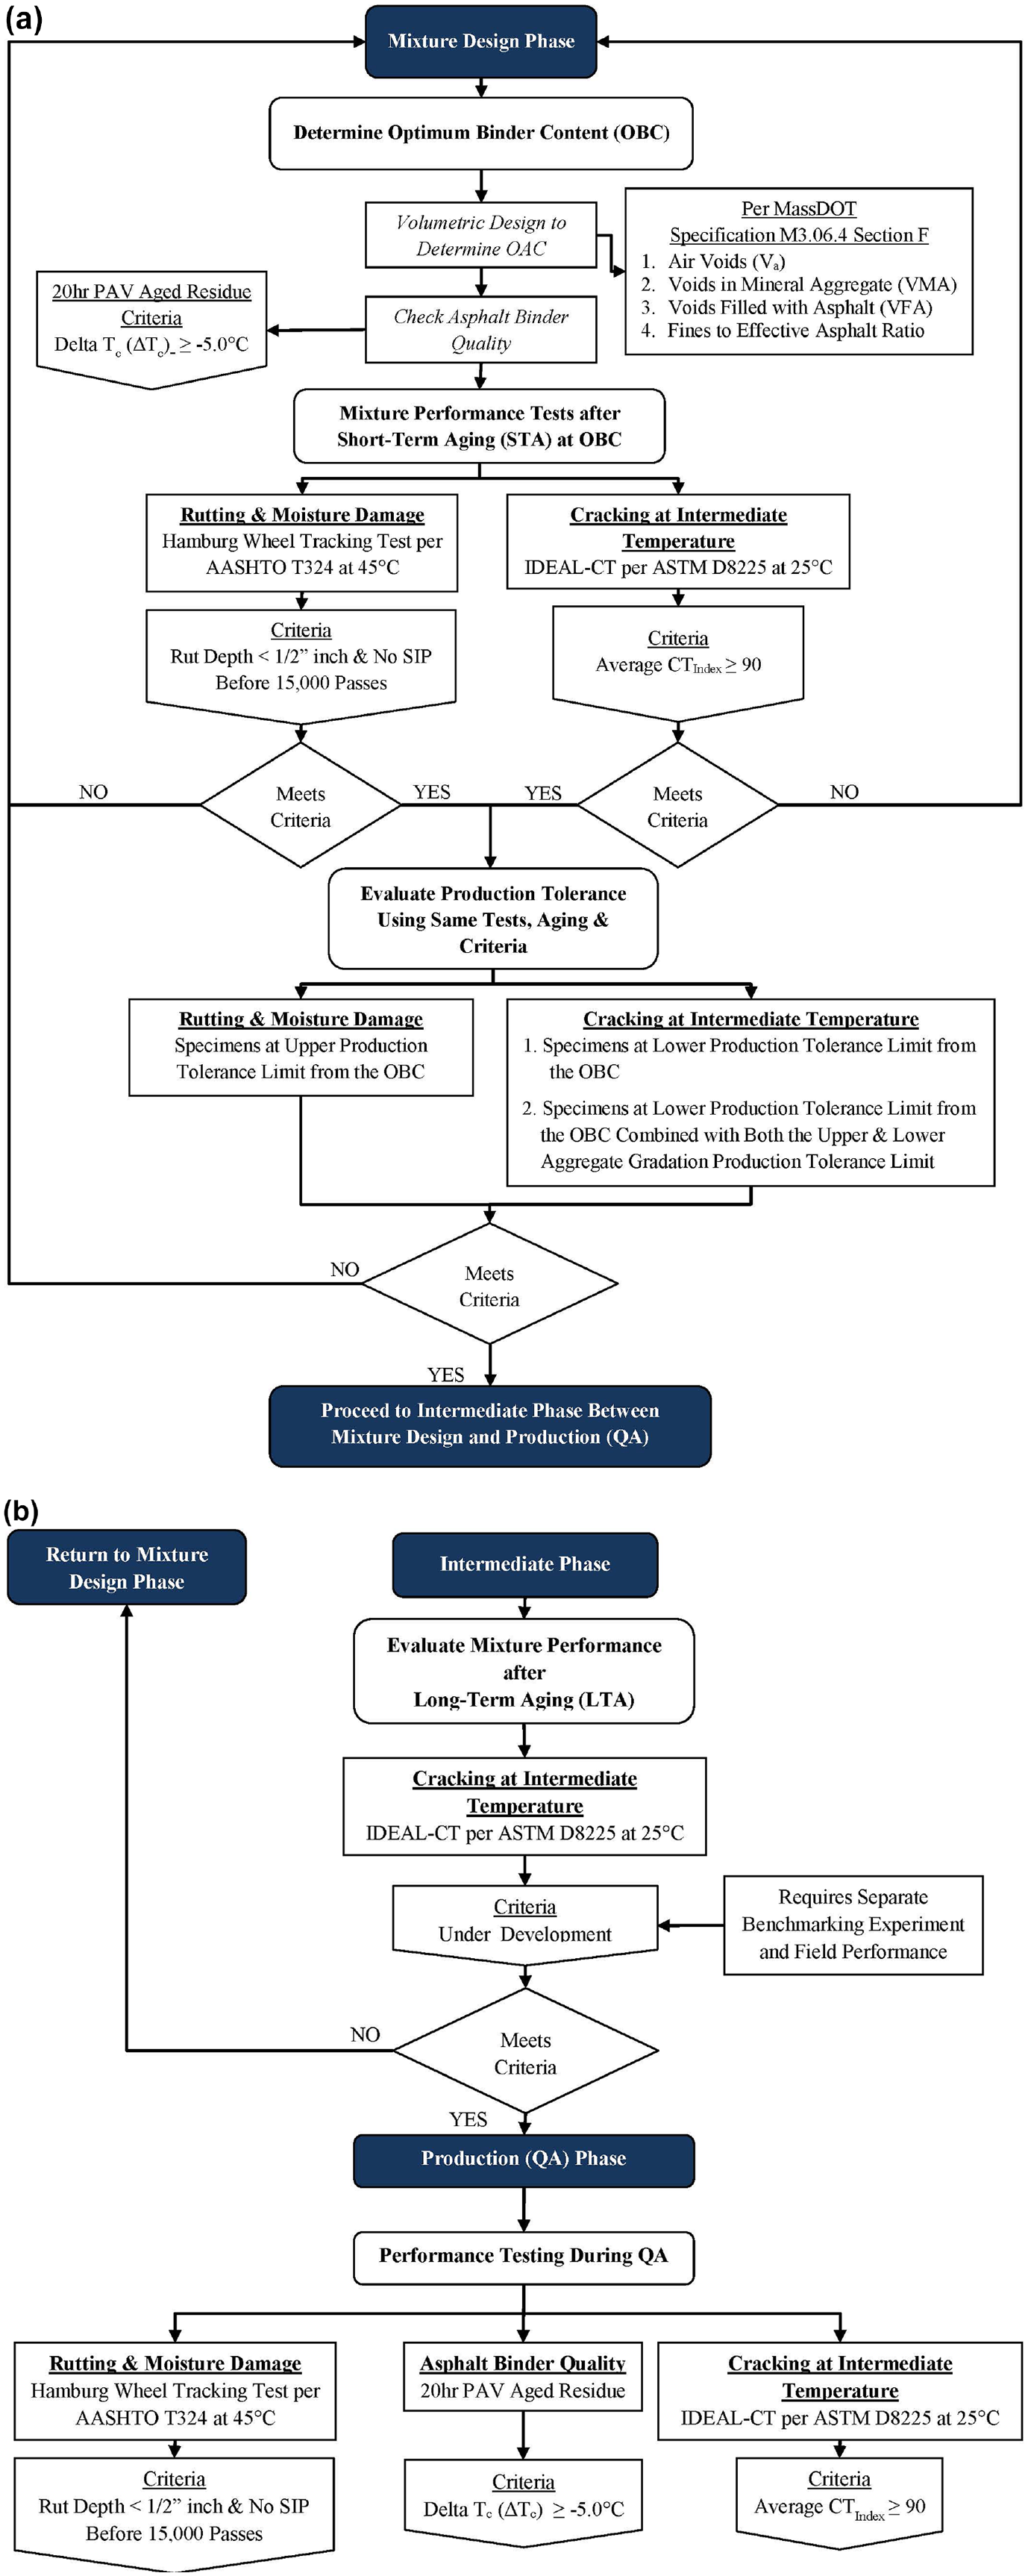
Comprehensive BMD protocol: (a) mixture design phase; and (b) Intermediate and production quality assurance phases.
Conclusions
The overall objective of this study was to develop a comprehensive BMD protocol for MassDOT using one of the four approaches presented by both NAPA and AASHTO. This comprehensive BMD is presented in Figure 5. It was designed to ensure that a mixture design remains balanced from the mix design phase to the production QA phase. The following conclusions were made:
Existing reference materials provide a good initial framework for developing a BMD protocol; however, many significant questions arise that are left for an SHA to answer when trying to implement a BMD protocol. These questions relate to how to select a BMD approach, which specific distresses to include, how to select a performance test for those distresses, proper aging protocols for the mixture, how to ensure performance with respect to production tolerances, how to ensure binder quality during production especially if the binder source changes, and how to determine pass/fail criteria for the selected performance tests. The answers to these questions were presented in this study on a question-by-question basis.
This study presented a methodology to determine and validate a performance criterion for the selected fatigue cracking test which was the IDEAL-CT. A preliminary test criterion was first obtained from a benchmarking experiment of 21 plant-produced mixtures. The results of this experiment were analyzed and descriptive statistics were used to determine it. This preliminary criterion was then validated using distress predictions from AASHTOWare® PMED based on its bottom-up fatigue cracking prediction model which was calibrated using laboratory measured and LTPP data. The results indicated that the preliminary criterion was valid. This methodology presents a valuable tool for SHAs who have limited long-term field performance data to rely on when determining performance test criteria or to validate an existing criterion. It also gives other SHAs another option for establishing performance test criteria.
The validated fatigue cracking performance passing criteria for the IDEAL-CT was a CTIndex≥ 90 for 12.5 mm mixtures produced with a PG 64S-28 binder after STA. These mixtures are the largest volume of mixtures produced in the state based on tonnage. This criterion would be valid for both the mixture design and production QA phases.
The CTIndex≥ 90 criterion was based on using one type of mixture that was STA at the plant. Developing criteria for cracking performance tests with respect to LTA requires further study since criteria for cracking performance developed using STA mixtures will likely be too stringent to use for mixtures subjected to LTA because the additional aging will decrease the performance tests results. Thus, separate benchmarking experiments will be required. Performance testing using specimens subjected to LTA is suggested for use in the intermediate phase between mix design and production since they should help exclude poor performing mixtures and also give reasonable time for mixture design adjustments or redesigns to be made before production.
Recommendations
Since the preliminary criterion of CTIndex≥ 90 was based on using one type of mixture, the SHA should make sure that it is valid for their other mixtures such as polymer modified, rubber modified, and high RAP mixtures. It is also recommended that the SHA perform shadow projects to add to their database of test results from their benchmarking experiment. Moreover, the shadow projects can be used to collect field performance data that can be used to verify the preliminary performance test criterion and make appropriate adjustments if needed.
Production tolerances and binder source should be taken into account when developing a comprehensive BMD protocol. It was suggested that an evaluation be made of the mixtures’ resistance to rutting at the upper production tolerance limit from the OBC, cracking at the lower production tolerance limit from the OBC, cracking at the lower production tolerance limit from the OBC combined with the upper aggregate gradation production tolerance limit, and cracking at the lower production tolerance limit from the OBC combined with the lower aggregate gradation production tolerance limit. Additionally, it was decided to include a parameter (ΔTc) that can evaluate asphalt binder quality if the binder source changes during the production phase.
Footnotes
Author Contributions
The authors confirm contribution to the paper as follows: study conception and design: Mogawer, Austerman, and Stuart; data collection: Mogawer, Austerman, and Abdalfattah; analysis and interpretation of results: Mogawer, Austerman, Stuart, Zhou, and Abdalfattah; draft manuscript preparation: Mogawer, Austerman, Stuart, Zhou, and Abdalfattah. All authors reviewed the results and approved the final version of the manuscript.
Declaration of Conflicting Interests
The author(s) declared no potential conflicts of interest with respect to the research, authorship, and/or publication of this article.
Funding
The author(s) disclosed receipt of the following financial support for the research, authorship, and/or publication of this article: The authors would like to acknowledge the FHWA and the Massachusetts Department of Transportation (MassDOT) for funding this study. Specifically, the authors would like to thank Mr. Ed Naras, MassDOT Pavement Management Engineer, Mr. Mark Brum, MassDOT Materials Quality Systems Engineer, and Marco Rocha, FHWA Massachusetts Pavement and Materials Engineer.