
Abstract
In 2012 Virginia Department of Transportation constructed two test sections at the National Center for Asphalt Technology Test Track containing asphalt processed via cold central plant recycling (CCPR) with identical asphalt overlays. One section contained a stabilized base beneath the CCPR layer (Section S12), similar to a full-depth reclamation layer; the other included an unstabilized aggregate base beneath the CCPR layer (Section N4). Both sections were subjected to trafficking by loaded trucks for a total of 30 million equivalent single axle loads. Minor cracking was observed at the surface of the section with the unstabilized base; the section with the stabilized foundation exhibited no surface cracking. Furthermore, strain, pressure, and deflection measurements showed better performance for the section with the stabilized foundation than the section with the unstabilized base. Because of the relatively unchanged performance of Section S12, it was taken out of service to conduct a forensic investigation. This paper presents the analysis of the instrumentation results, coring, trenching, and mechanistic testing and modeling, to better understand and compare the performance between sections. The stabilized base was found to greatly reduce bending action in the section, exhibited no substantial rutting, but also contained what appeared to be some shrinkage cracks. However, these cracks did not propagate to the surface, indicating that the CCPR layer may be an effective crack mitigator. Further, it was found that mechanistic modeling using AASHTOWare Pavement ME design software overestimated the rutting but predicted similar international roughness index and cracking to that observed in the field.
Keywords
Pavement recycling techniques, such as cold central plant recycling (CCPR) and full-depth reclamation (FDR), are effective options to rehabilitate an existing asphalt pavement or construct a new pavement at reduced cost and reduced environmental impacts ( 1 – 3 ). Although pavement recycling techniques are more commonly used in certain parts of the United States, their use, overall, is not widespread. Part of the reason for this is a lack of detailed performance data for pavement structures built using recycling techniques, especially in high traffic locations ( 2 , 4–6). In 2012, Virginia Department of Transportation (VDOT) sponsored the construction of three test sections that incorporated CCPR at the National Center for Asphalt Technology (NCAT) Test Track. Variables within these three sections included two thicknesses of asphalt concrete (AC) and the presence of a stabilized foundation in one section. The two test sections having the thinnest AC are described in more detail in this paper. These sections were designed to each have 4 in. of AC placed on top of a 5-in.-thick layer of CCPR. One of these two test sections (Section S12) included a cement-stabilized foundation (constructed using FDR equipment and construction techniques) beneath the CCPR layer, whereas the other section (Section N4) included an unstabilized dense-graded aggregate base beneath the CCPR layer.
CCPR is a pavement recycling technique in which newly milled or existing reclaimed asphalt pavement (RAP) can be used to produce an asphalt base layer that can be placed with conventional asphalt paving equipment. In a mobile plant located at or near the paving site, RAP is combined with an asphalt recycling agent (either emulsified asphalt or foamed asphalt) and an active filler such as lime or cement (if used) to produce the CCPR material ( 6 ). Since the RAP used to produce the CCPR is kept at ambient temperatures, there are significant cost and environmental savings realized by not heating the material. CCPR is typically placed at layer thicknesses of 4 to 8 in., although multiple lifts can be used to place thicker layers.
FDR is another pavement recycling technique in which portions of the bound asphalt layer, aggregate base, and a predetermined portion of the subgrade are processed to create a stabilized foundation layer. FDR is produced using a stabilizing agent, such as emulsified asphalt, foamed asphalt, lime, or cement ( 6 ). If an asphalt-based stabilizing agent is used, an active filler (e.g., cement) is often included. Similar to CCPR, the FDR material is produced at ambient temperatures resulting in additional cost and environmental savings. FDR is typically placed at layer thicknesses of 10 to 12 in.
At the end of three track cycles (9 years since construction), with the test sections subjected to 30 million equivalent single axle loads (ESALs), the section containing CCPR and the cement-stabilized foundation was taken out of service and a forensic study was conducted owing to the relatively unchanged performance. This paper summarizes the measured performance of both test sections and documents the results of the forensic study conducted on Section S12. In addition, the test sections were modeled using AASHTO Pavement ME software (Version 2.2.6) to compare field performance versus predicted performance on the basis of measured mechanistic properties for the hot-mix asphalt (HMA), CCPR, and cement-stabilized base layers.
Objectives
To better quantify the performance of CCPR in high traffic applications, the objectives of this paper include
1) Documenting the construction and comparing the structural performance of two test sections constructed at the NCAT Test Track in 2012 through 9 years of testing and 30 million ESALs of trafficking;
2) Documenting the results of a forensic evaluation of the NCAT test section containing CCPR and the stabilized foundation (Section S12);
3) Comparing the actual functional performance of these two test sections with the functional performance predicted by the AASHTO Pavement ME software; and
4) Discussing the potential for implementation of this work by departments of transportation.
Scope of Work
To accomplish the objectives of this study, performance data were collected from two VDOT-sponsored sections at the NCAT Test Track that were trafficked for 9 years over three track cycles. The test sections were designed to compare the performance of two test sections comprising CCPR: one included a cement-stabilized foundation (Section S12) and the other included an unstabilized aggregate base layer (Section N4). The performance data included results from strain, pressure, and temperature sensors installed during construction. In addition, results of ride quality, rut depth, cracking, and structural testing using a falling weight deflectometer (FWD) were added. The test sections were also modeled using AASHTO Pavement ME software. The assumed and measured input values used to complete the modeling are documented in this paper.
Cross Sections and Field Testing
The two test sections in this study, Sections N4 and S12, described in Figure 1 as 4” AC and 4” AC SB (stabilized base), respectively, were built in 2012 at the NCAT Test Track. The full-scale sections were approximately 200-ft long and 12-ft wide. The thicknesses in Figure 1 represent the average depths surveyed during construction from 12 points within each section. Both sections were built on subgrade native to the Test Track, which classifies as A-4 soil; however, it should be pointed out that this soil has a significant amount of large rock embedded in it, yielding higher-than-expected modulus values in situ as, discussed below and previously reported ( 7 ). Above that, approximately 6 in. of crushed granite aggregate base was placed in each section. To create the stabilized foundation in Section S12, the aggregate base and the top 2 in. of the subgrade were stabilized in place with cement using a process and equipment normally used to produce an FDR layer. The CCPR material was placed next, with a target depth of 5 in., but was built closer to 4.5 in. (Section N4) and 4.3 in. (Section S12). Above the CCPR was a dense-graded Superpave AC layer followed by a stone matrix asphalt (SMA) AC surface. The total thickness above CCPR was designed to be 4 in. Slight variations from the design thicknesses and between the sections was the result of natural construction variation rather than intentional experimental design. Further details about the materials in the cross sections are given in Table 1.
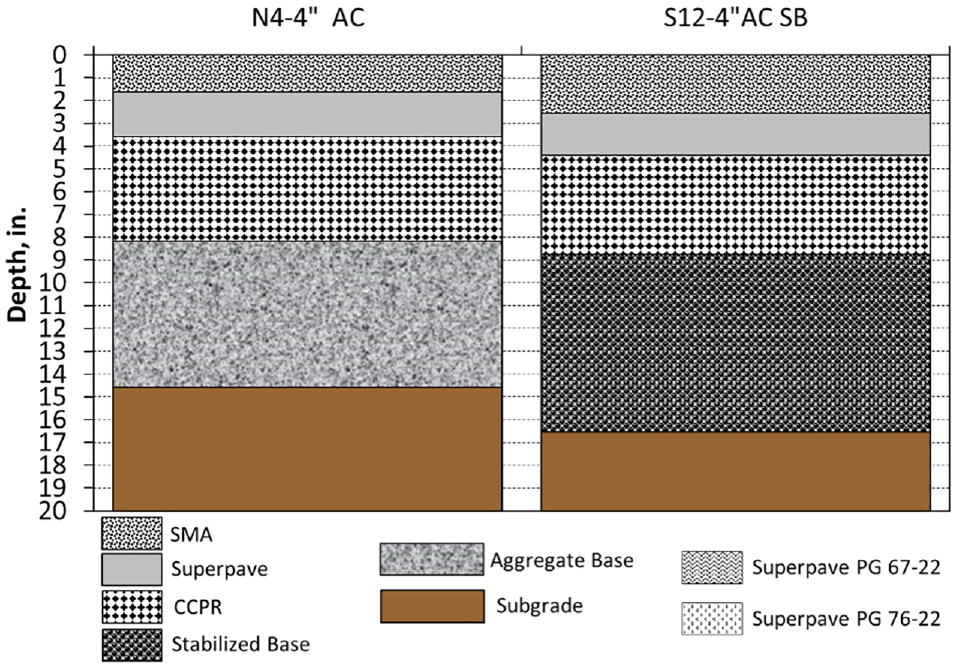
Pavement cross sections.
As-Built Layer Properties
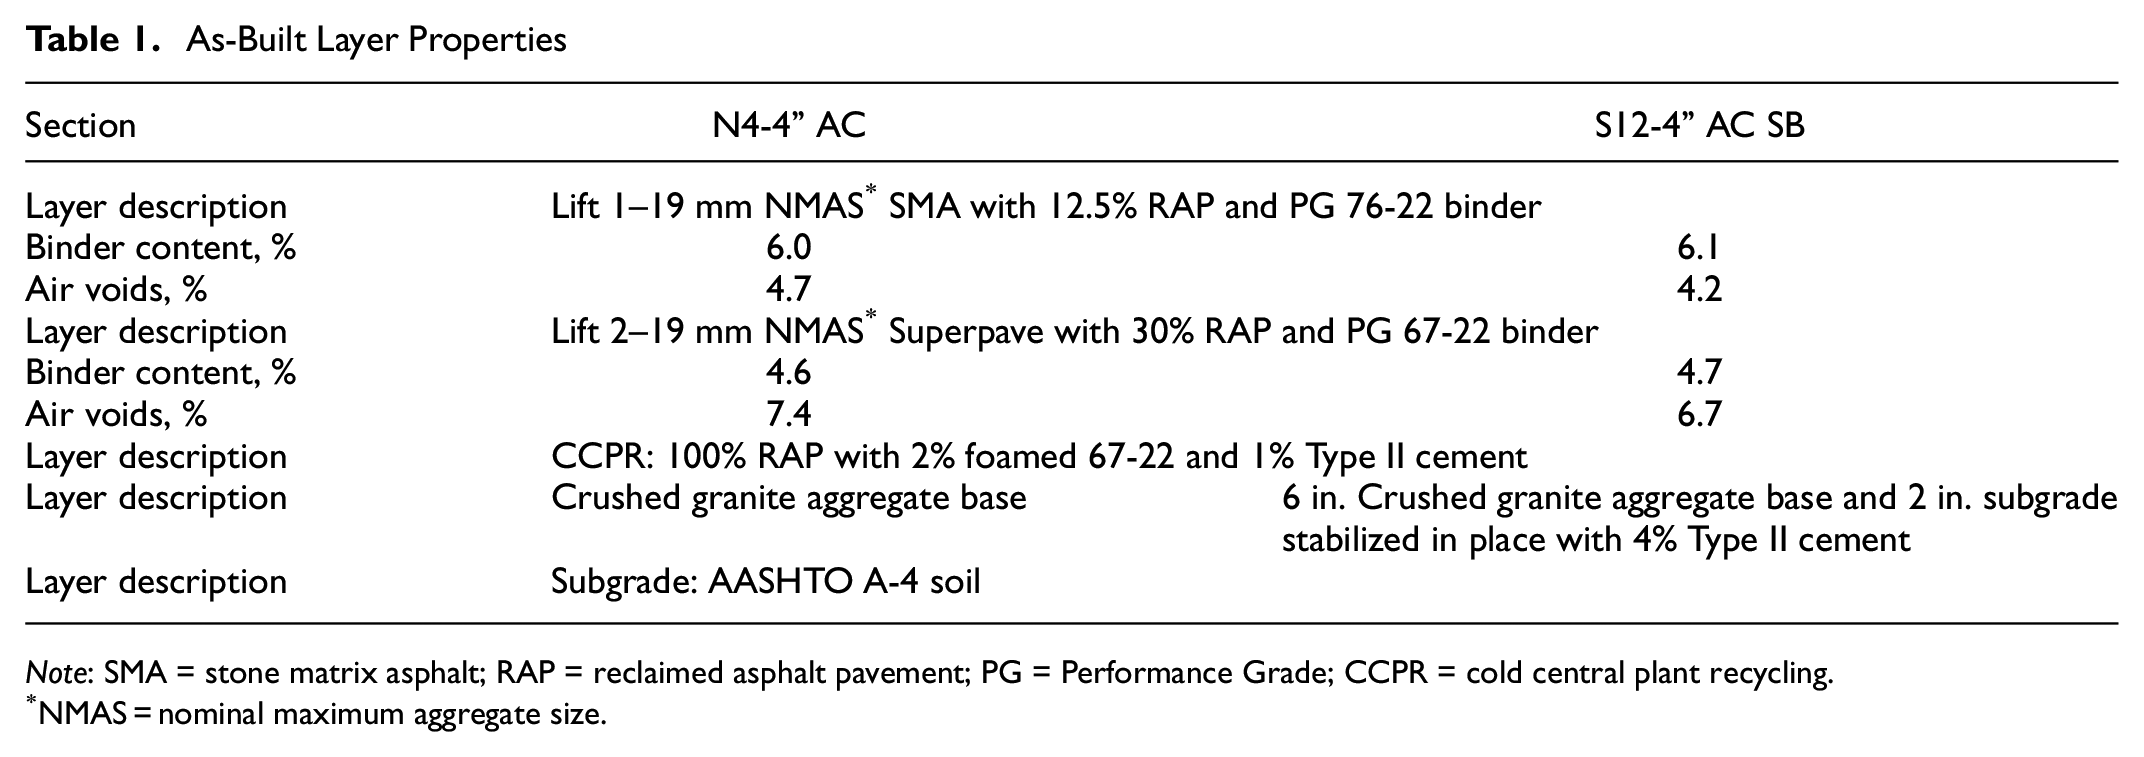
Note: SMA = stone matrix asphalt; RAP = reclaimed asphalt pavement; PG = Performance Grade; CCPR = cold central plant recycling.
NMAS = nominal maximum aggregate size.
Since the forensic investigation described later in this paper focused on both the CCPR and cement-stabilized foundation in Section S12 it is important to first document the mix design process and properties of these materials. As documented by West et al. and Diefenderfer et al. (8, 9), using a mix design process, the recycling agent and active filler used to produce the CCPR were 2% foamed asphalt using a PG 67-22 binder and 1% Type II Portland cement as an active filler. A laboratory-scale pug mill was used to mix the foamed asphalt with the RAP materials to determine the mix design parameters in accordance with AASHTO T 180-10, Standard Method of Test for Moisture-Density Relations of Soils Using a 10-lb Rammer and an 18-in. Drop, Method D. The indirect tensile strength (ITS) was also tested in accordance with AASHTO T 283, Standard Method of Test for Resistance of Compacted Hot-Mix Asphalt (HMA) to Moisture-Induced Damage. The average wet and dry bulk densities at the stated foamed asphalt and cement contents were 133.0 and 127.0 lb/ft3, respectively; the average ITS value was 83 psi with a retained strength ratio of 76%.
As further described by Diefenderfer et al. ( 9 ) with regard to the cement-stabilized foundation, the tests used in the mix design process were ASTM D1633, Standard Test Method for Compressive Strength of Molded Soil-Cement Cylinders and AASHTO T 134, Method B, Standard Method of Test for Moisture-Density Relations of Soil Cement Mixtures. The process focused on limiting the compressive strength to 350 psi after 7 days and 4% Type II cement yielded 256 psi after 7 days with a maximum dry density of 130.0 lb/ft3 and optimum moisture content of 8.0% ( 9 ).
The sections were built during the summer of 2012 and opened to traffic on October 23, 2012. Trafficking consisted of a fleet of tractor-triple-trailer vehicles running 16 h per day applying approximately 10 ESALs per vehicle pass traveling at 45 mph using single and tandem axles. As previously documented ( 8 ), the steer axles on each truck weighed approximately 10.7 kips, the drive tandem axle group weighed approximately 40.6 kips, and the five trailing single axles weighed approximately 20.8 kips per axle. Over the following 2 years of traffic, and subsequent additional test cycles beginning in 2015 and 2018, the sections were subjected to approximately 30 million ESALs (i.e., 10 million ESALs per test cycle) Trafficking was completed on February 27, 2021. Note that each test cycle consisted of 2 years of trafficking followed by a year of reconstruction and forensic studies of other sections. During these test cycles, the sections were monitored weekly by measuring any observed cracking, as well as performing rut depth and ride quality measurements. The sections were also fully instrumented to enable horizontal tensile strain measurements in the longitudinal direction (i.e., in the direction of traffic) at the bottom of the CCPR layer on a weekly basis. Finally, the sections were subjected to frequent (i.e., several times per month) FWD testing. As described previously ( 8 ), the FWD testing consisted of multiple load levels ranging from 6 to 16 kips at four longitudinal locations and three offsets (between wheelpaths [BWPs], outside wheelpath [OWP], inside wheelpath [IWP]) in each section. Backcalculation was performed using EVERCALC 5.0. The results and discussion of these measurements are presented in the following sections.
Field Performance
The sections were inspected weekly for evidence of cracking over the three test cycles and 30 million ESAL applications. No cracking was observed at the surface of Section S12 (4” AC SB). However, Section N4 (4” AC) had minor cracking develop at 29.6 million ESALs, which was first observed on January 25, 2021. The cracking was confined to the outside wheelpath, was primarily transverse to the direction of travel (though there were some interconnecting longitudinal cracks), and was spread evenly along the length of the section. The cracks were relatively tight and there was no evidence of pumping or fines at the surface. Subsequent inspections on later dates revealed much less cracking, which did not appear to progress or worsen during the last 400,000 ESAL applications. It was hypothesized that some healing or knitting together of the surface under traffic occurred after the initial cracking was observed. At the end of trafficking, there was 0.1% of wheelpath area cracked and 0.7% of lane area cracked. Both of these values are low and not indicative of a failing pavement section. Furthermore, since there was more cracking in the total lane area than wheelpath area, this indicated the cracking was likely top-down rather than bottom-up. Cracking performance was judged as excellent for both sections over the three test cycles. Coring of the cracks in Section N4 was not performed since a fourth cycle of trafficking was planned for Section N4; a forensic study is planned at a later date.
Figure 2 shows the rutting progression for Sections N4 and S12 over the 30 million ESAL applications covering a 9-year period using scanning lasers at 45 mph over the pavement width. Each series represents a four-point (i.e., monthly) moving average, which helps to smooth out the data and better illustrates long-term trends. Generally speaking, rutting did not increase significantly after the first 5 million ESALs, which coincided with completion of the first summer of trafficking. Note that temperatures at the mid-depth of the AC/CCPR layer ranged from 40°F in the winter to 120°F in the summer. Surface temperatures in the sections often reached 140°F in the summer during each test cycle. The apparent increase in rutting beginning at approximately 29 million ESALs was believed to be because of a change in the data acquisition vehicle hardware and software and was also observed in other Test Track sections at this time. Beginning at about 10 million ESALs, Section S12 (comprising the stabilized foundation) had approximately 0.05- to 0.1-in. less rutting than Section N4 (the nonstabilized foundation section). The authors of this paper do not consider this difference to be significant as, from a maintenance perspective, the way these sections would be treated in practice is no different. The overall rutting performance yielded maximum values below 0.3 in. after 30 million ESALs. This observation is especially important given that early and excessive rutting was a concern in high traffic environments for CCPR materials when this experiment began, but was not shown to be a problem for these sections.
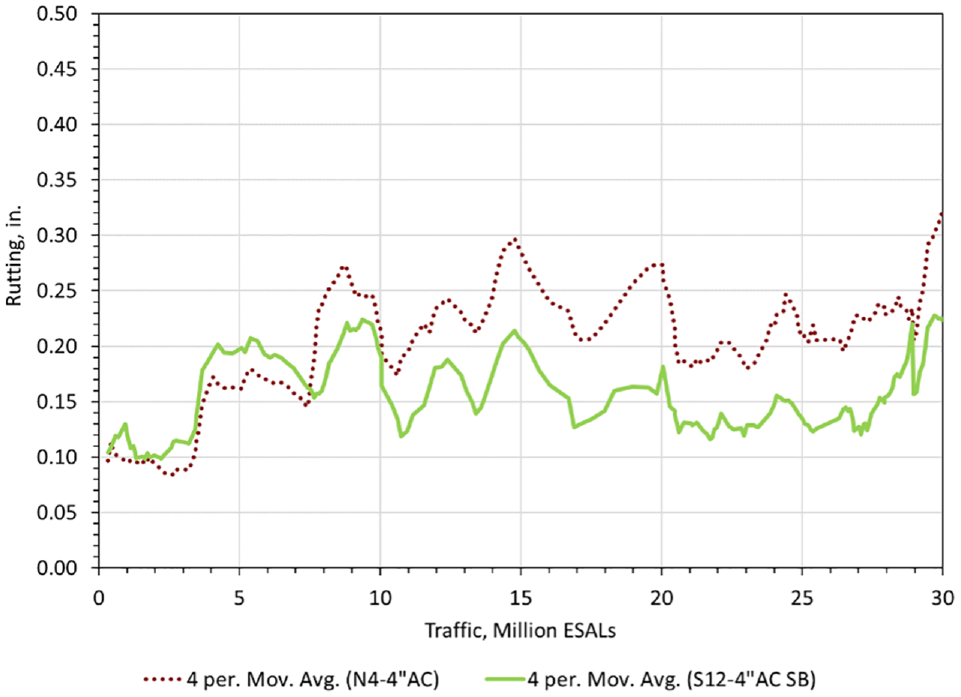
Rutting performance.
Figure 3 contains the ride quality data, expressed as the international roughness index (IRI), for the two sections. Again, the data are presented as four-point moving averages. Figure 3a contains the actual IRI data, whereas Figure 3b expresses the change in IRI relative to the very first measurement made before trafficking began in 2012 to more closely examine net changes in smoothness throughout the 30 million ESAL applications. Section S12 (4” AC SB) had significantly higher overall roughness, as shown in Figure 3a, that was attributed to the difficulties of constructing the FDR foundation in a small test section. In addition, it was previously documented ( 9 ) that Section S12 (4” AC SB) had a localized area near the beginning of the section that had very high roughness. Despite this roughness, the section was left in place and subjected to 10 million ESALs during the first trafficking cycle. Following the first traffic cycle, the area of higher roughness was profile milled to improve smoothness, which is shown by the decrease in roughness at 10 million ESALs in Figure 3a. After this point, the ride quality stayed relatively constant over time for the remaining 20 million ESALs. Section N4 (4” AC) had a relatively constant ride quality for the entire 30 million ESAL applications. A better examination of the change in IRI versus ESALs is shown in Figure 3b, where the net change in IRI from the beginning to end of trafficking was less than 10 in./mi. It should be noted that the change in IRI for Section S12 (4” AC SB) takes into account the profile milling performed at 10 million ESALs by resetting the data to that point for the remaining 20 million ESALs. The higher variability of S12 (4” AC SB) likely stemmed from the rough spot at the start of the section setting up more variable vehicle dynamics when measuring IRI. Ride quality was judged to be stable for these sections.
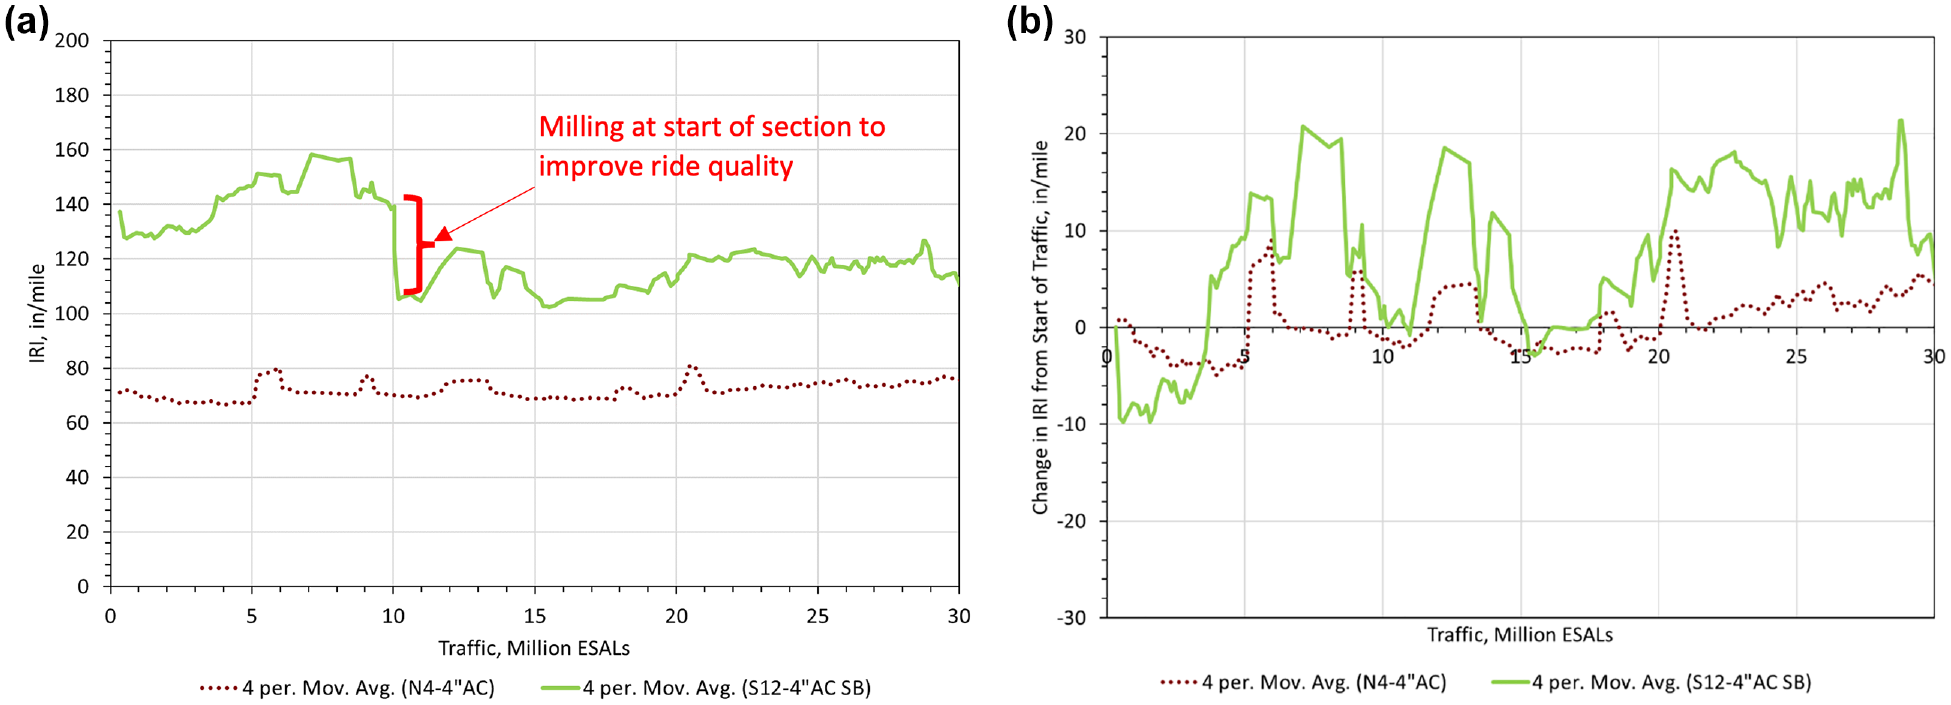
Ride quality: (a) international roughness index, and (b) change in international roughness index from start of traffic.
Structural Characterization
Horizontal tensile strain measurements made in the longitudinal direction (i.e., in the direction of traffic) at the bottom of the CCPR layer over the three test cycles are shown in Figure 4a. Gauges were placed at the bottom of the CCPR since previous laboratory investigations had found that the CCPR acts more like an asphalt bound material and it was likely that maximum tensile strain would occur at the bottom of the CCPR rather than the bottom of the Superpave mixes ( 9 ). The gaps in the data represent nontrafficking time at the Test Track, whereas other sections were undergoing reconstruction in preparation for the next test cycle. Seasonal cycling is readily apparent in Figure 4 where higher summertime pavement temperatures yield higher strain levels that decline as the ambient temperature decreases through the fall into winter, and then increases again with the spring. This effect is much more dramatic in Section N4, without the stabilized base when compared with Section S12 with the stabilized base. The stabilized foundation was thought to greatly reduce the bending action in the section under traffic that causes tensile strain at the bottom of the CCPR. There also appears to be a slight increase in tensile strain over time in Section N4 (4” AC) which is not apparent in Section S12 (4” AC SB). This may be the result of some amount of internal deterioration and/or the small amount of cracking appearing in the third test cycle in Section N4, which would result from increases in strain. Conversely, Section S12 (4”AC SB) exhibited very steady strain measurements over time, indicative of a healthy test section with strain values not changing significantly. These observations are more readily apparent in Figure 4b in which the data have been normalized to a reference temperature of 68°F and plotted versus total ESALs ( 10 ).
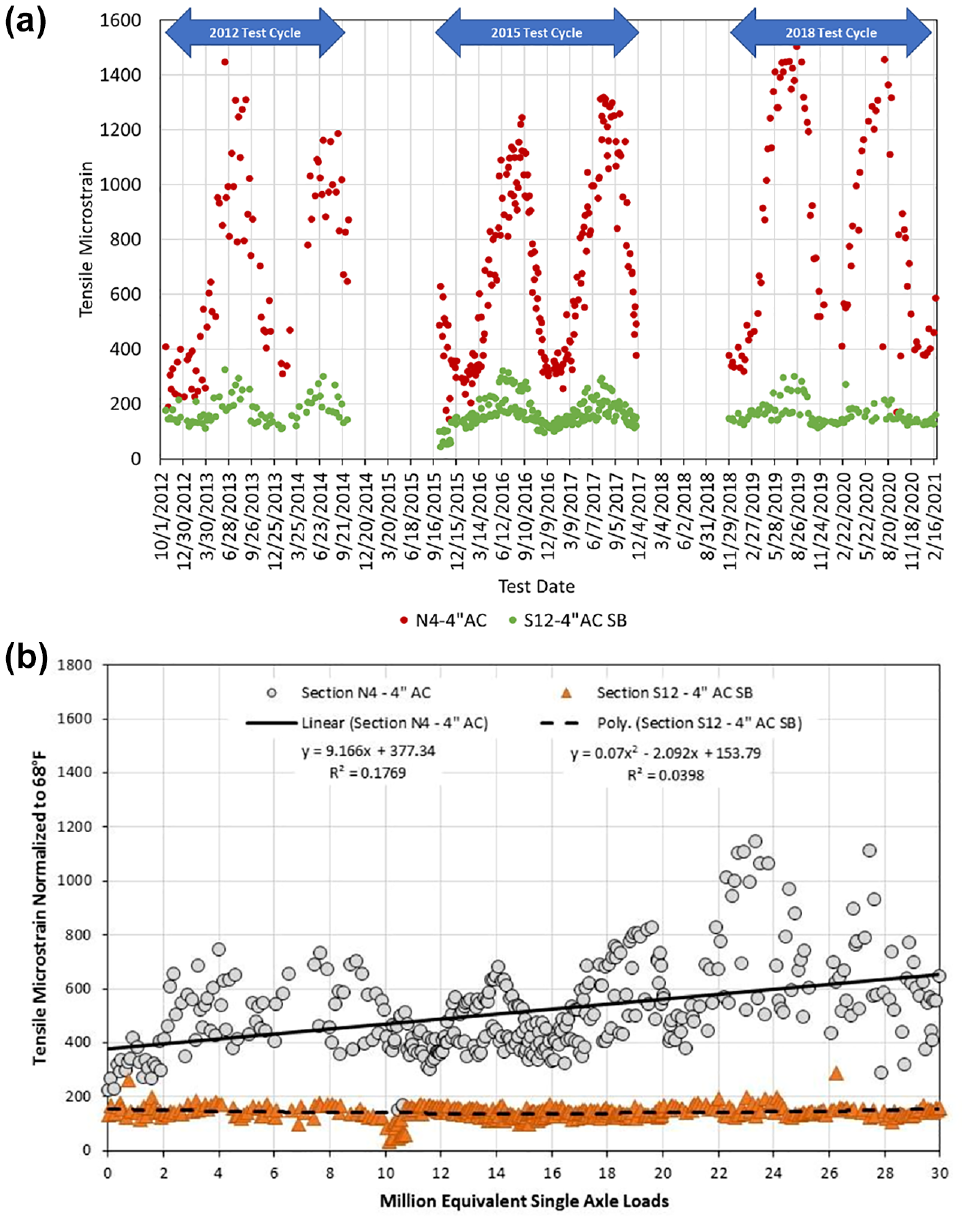
(a) Measured tensile strain responses in the longitudinal direction and (b) measured tensile strain responses in the longitudinal direction normalized to 68°F ( 10 ).
Deflection data gathered through FWD testing were backcalculated using EVERCALC 5.0. The data in the following figures show only the 9,000 lb load level where the root mean square error of the backcalculation was less than 3%. Figure 5 shows the backcalculated modulus of the combined AC/CCPR layer. As discussed by Timm et al., the AC and CCPR were considered in the analysis as one layer ( 11 , 12 ). This simplification was used since laboratory |E*| testing showed the CCPR materials acted more like an AC material than an aggregate base ( 13 , 14 ). The seasonal temperature effects on the composite AC/CCPR moduli can be seen in Figure 5a where the modulus of the AC/CCPR layers decreases in warmer months and increases in cooler months. Also, Figure 5 shows that Section S12 (4”AC SB) has a higher modulus than Section N4 (4” AC) during the three test cycles. Theoretically, since the sections have similar AC/CCPR proportions and included the same asphalt-based materials, their backcalculated moduli should have been more similar. It may be that the backcalculation process is attributing higher moduli to Section S12 as a compensating effect for the stabilized foundation. Figure 5 also shows that Section S12 has a generally steady average, or even somewhat increasing, modulus over the three test cycles, indicating the good structural health of the AC/CCPR layers. In contrast, Section N4 (4” AC) had a steady average modulus through the first two test cycles followed by a general decline in the average modulus during the last cycle. These observations are more apparent in Figure 5, b and c , where the data have been normalized to a reference temperature of 68°F and averaged on each particular testing date to provide a more condensed data set ( 10 ). This is consistent with the increase in strain shown in Figure 4b and likely results from internal deterioration and/or the cracking that appeared in the last test cycle. The backcalculated subgrade moduli were very consistent between the two sections with average moduli of 27.8 and 30.3 ksi for N4 (4” AC) and S12 (4” AC SB), respectively.
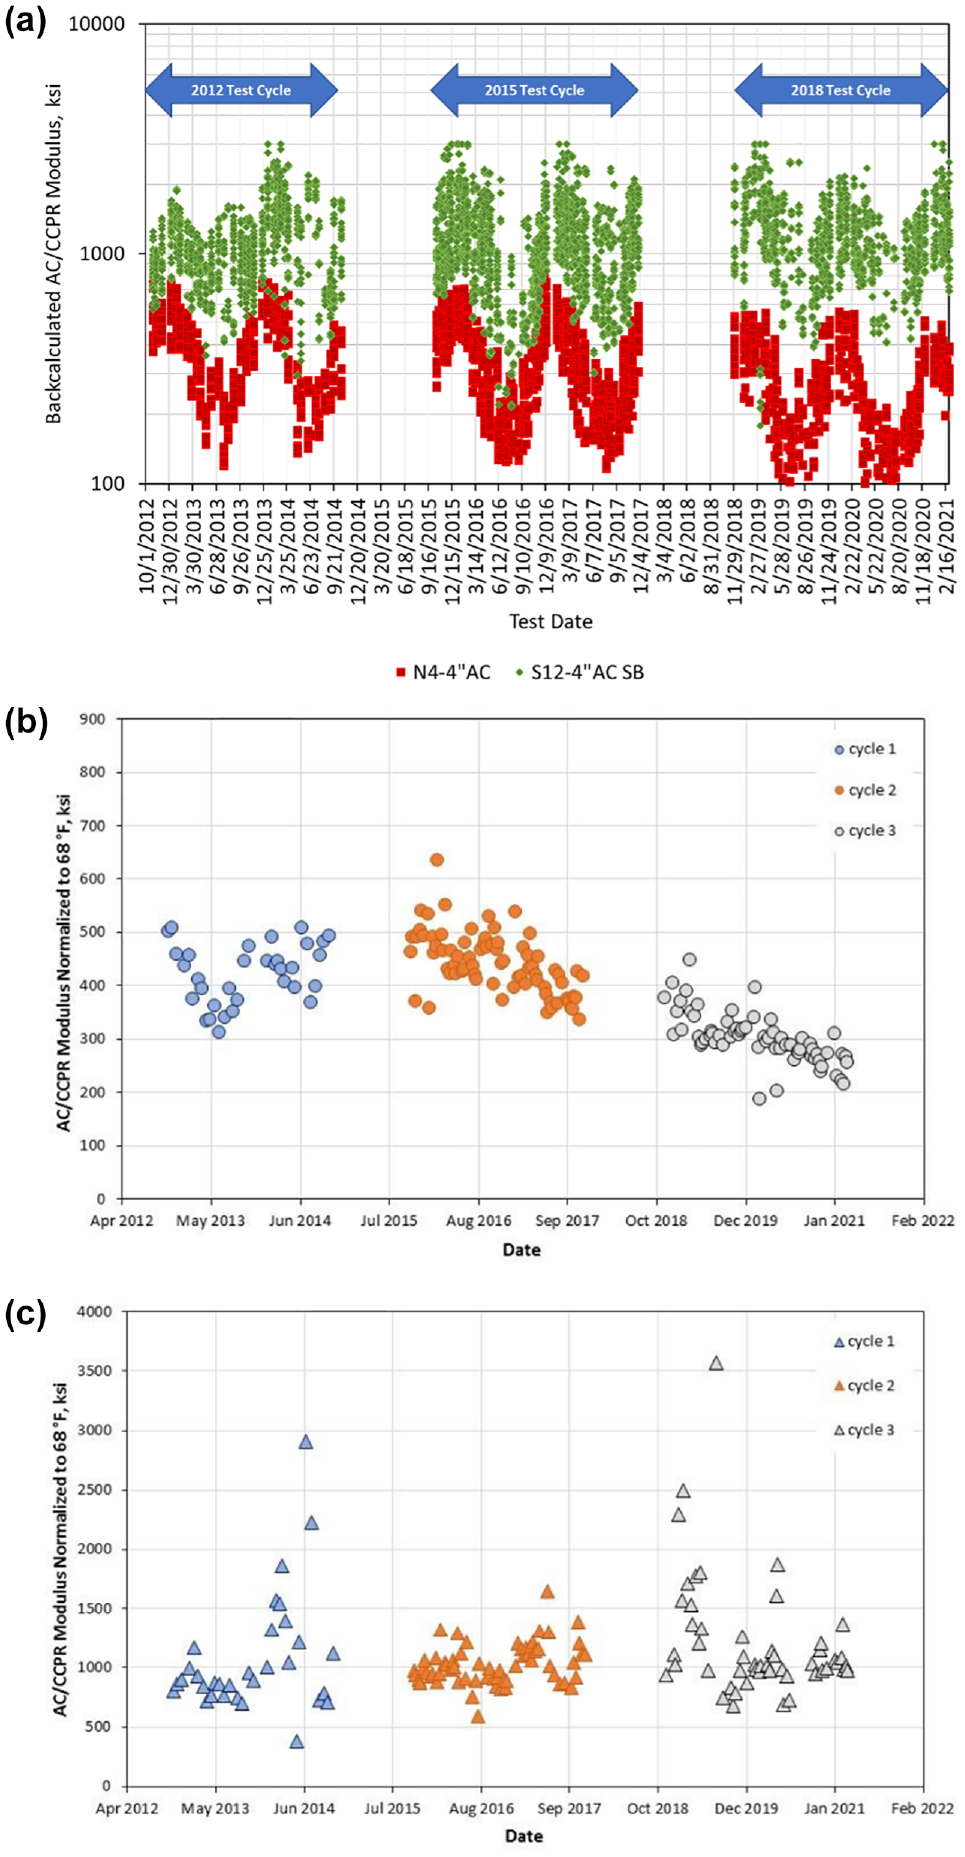
Backcalculated AC/CCPR modulus versus time: (a) AC/CCPR backcalculated layer moduli versus time—not adjusted for temperature, (b) N4 (4” AC) AC/CCPR backcalculated layer moduli versus time normalized to 68°F ( 10 ), and (c) S12 (4” AC SB) AC/CCPR backcalculated layer moduli versus time normalized to 68°F ( 10 ).
As will be discussed in the next section, the forensic investigation, conducted at the conclusion of trafficking, was revealing in relation to the condition of the stabilized foundation layer in Section S12, which showed signs of shrinkage cracking. Therefore, it is instructive to also examine the backcalculated stabilized layer moduli as depicted in Figure 6 in which the data are shown with respect to location as follows: (a) outside wheelpath, (b) between wheelpaths, and (c) inside wheelpath. Furthermore, each plot contains four series representing each of four longitudinal stations (random locations; RLs) in each section. RLs 1, 2, and 3 represent locations in 50-ft subsections spaced longitudinally along each test section and RL4 was in the middle of the gauge array installed during construction. It should be noted that the RLs were randomly selected at the start of the experiment in 2012 but then remained as fixed locations during testing over the next 9 years. Using these locations enabled the measurement of spatial variation throughout each section. Since temperature cycling was not evident in these data sets, monthly averages are presented in Figure 6 for better clarity of data. The outside wheelpath (Figure 6a) and between wheelpaths (Figure 6b) locations had very similar magnitude and behavior. There was apparent curing of the stabilized layer during the first test cycle followed by relatively constant values during the second and third cycles. The exception was RL4 in the outside wheelpath (Figure 6a) where the values were considerably lower and more scattered. This location was in the middle of the gauge array, which experienced significant disturbance during the gauge installation process and may have contributed to this behavior. Treating this point as an outlier for the sake of this discussion shows that the outside and between wheelpaths were very similar. By contrast, the inside wheelpath (Figure 6c) shows the modulus values were highly scattered, there is less evidence of curing during the first test cycle, and RLs 2, 3, and 4 had considerably lower values compared with the other offsets (Figure 6, a and b ). This behavior was present from the beginning, which has important ramifications pertaining to the forensic investigation discussed in the following section. In contrast, the backcalculated aggregate base moduli in Section N4 ranged from 6 to 20 ksi, which was consistent with values obtained from other sections using similar materials ( 7 , 15 ) and was relatively consistent throughout the entire experiment.
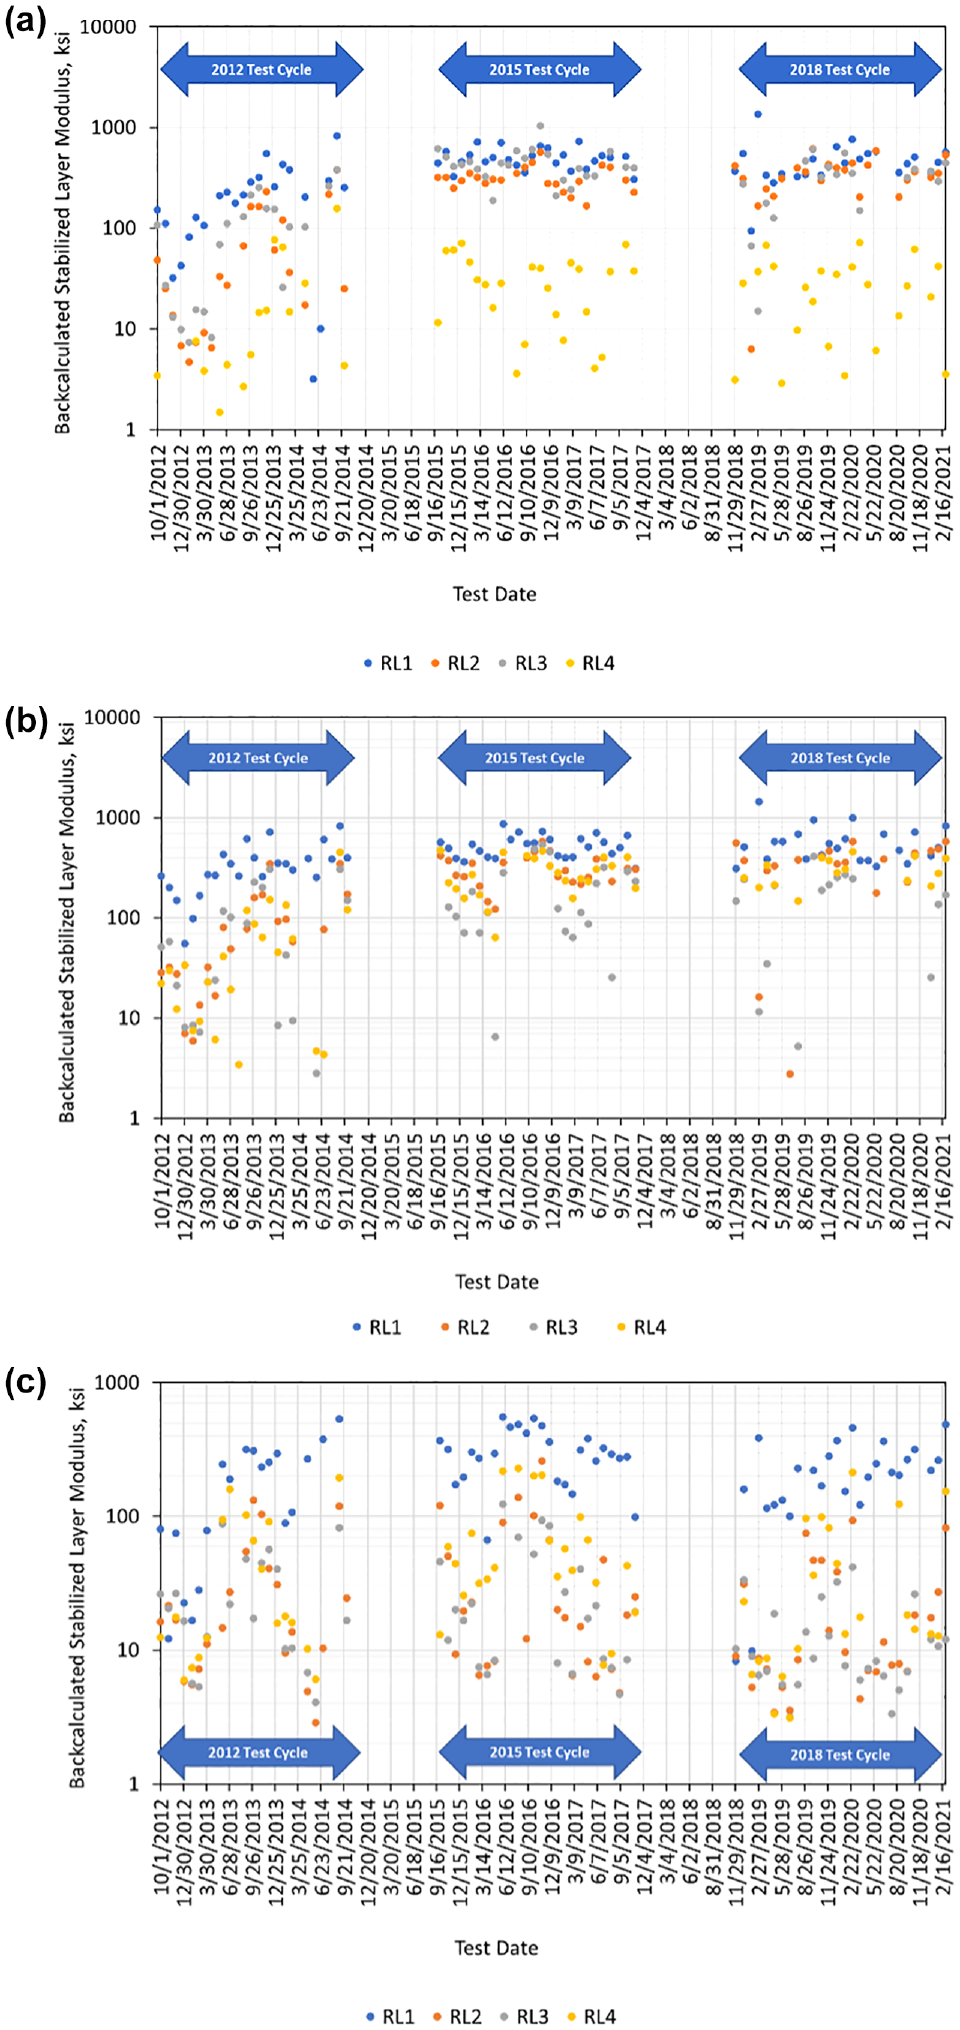
Stabilized foundation layer backcalculated monthly average modulus: (a) outside wheelpath, (b) between wheelpaths, and (c) inside wheelpath.
Forensic Investigation of Section S12
To further investigate the performance of Section S12, a forensic study was undertaken after trafficking to 30 million ESALs by first collecting cores from the outside wheelpath, inside wheelpath, and between the wheelpaths. Following this, the sections were trenched to observe the transverse profile, and finally the asphalt and CCPR layers were removed by milling to observe the condition of the stabilized foundation. The cores were taken to the laboratory for further testing as described in the following sections.
Coring
Cores from Section S12 were sampled in accordance with AASHTO R 67, Sampling Asphalt Mixtures after Compaction (Obtaining Cores). During coring, shearing occurred in the first few cores at the CCPR–SB interface, making it difficult to obtain intact samples for further testing. To successfully extract samples, the asphalt layers were cored with a 6-in. diameter drill bit and extracted. Then, the stabilized base was cored from within the 6-in. opening with a 4-in. diameter drill bit. Because it was speculated that there could be differences in material properties from the wheelpaths and between wheelpaths owing to traffic consolidation, separate cores were collected from these areas.
Trenching
Following coring, a transverse trench, approximately 3-ft wide (in the longitudinal direction), was created from the outside edge of the pavement to the centerline of Section S12. The trench extended through the stabilized base layer. The purpose of the trenching activity was to see if the rutting, measured at the surface of the pavement, resulted from the consolidation of any particular layer. The thickness of each layer was measured every 6 in. to the nearest millimeter. The data, excluded for brevity, revealed no obvious rutting of the layers in the center of the wheelpaths. Photos of the trenching activities and the exposed pavement face are included in Figure 7. Please note that the vertical joint is a byproduct of the saw cutting process. It is interesting that it is difficult to identify the interface between the asphalt- and the CCPR layer, indicating that these layers were both well-bonded and visually indistinguishable in this photo.
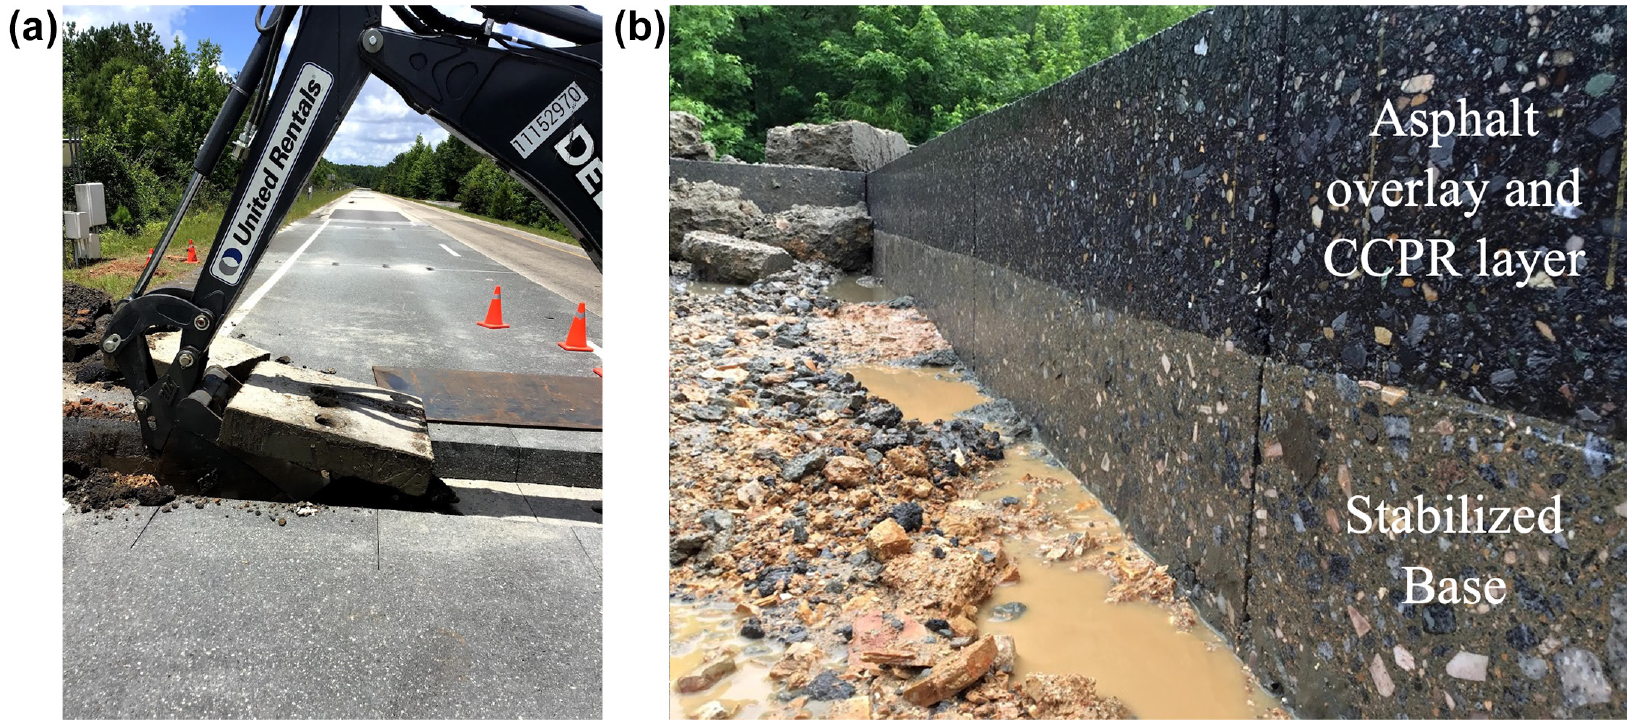
(a) Removal of a pavement section during trenching procedure, and (b) exposed AC, CCPR, and stabilized base layers over Test Track subgrade.
Milling
After trenching, the surface and intermediate asphalt mixtures were removed by milling to reveal the surface of the CCPR layer. There were no visual distresses observed in the surface of the CCPR layer. Next, the CCPR layer was milled to reveal the surface of the stabilized base layer. Special care was taken to barely touch the stabilized base layer so it could be visually inspected. Interestingly, the stabilized base layer revealed several cracks, both in the transverse and longitudinal directions, as shown in Figure 8. The cracks remained tight and did not show any signs of movement (such as breaking along the edges of the crack). The cracking was therefore suspected to be a combination of shrinkage cracks and/or fractures that occurred because of loading. This was conjectured because if shrinkage cracking was observed, a transverse orientation would be expected; if load-related cracking was observed, a longitudinal orientation would be expected. Cracking was also found to be mostly centered on the inside wheelpath. This may be a contributing factor to the lower and more variable backcalculated modulus values discussed earlier in this paper.
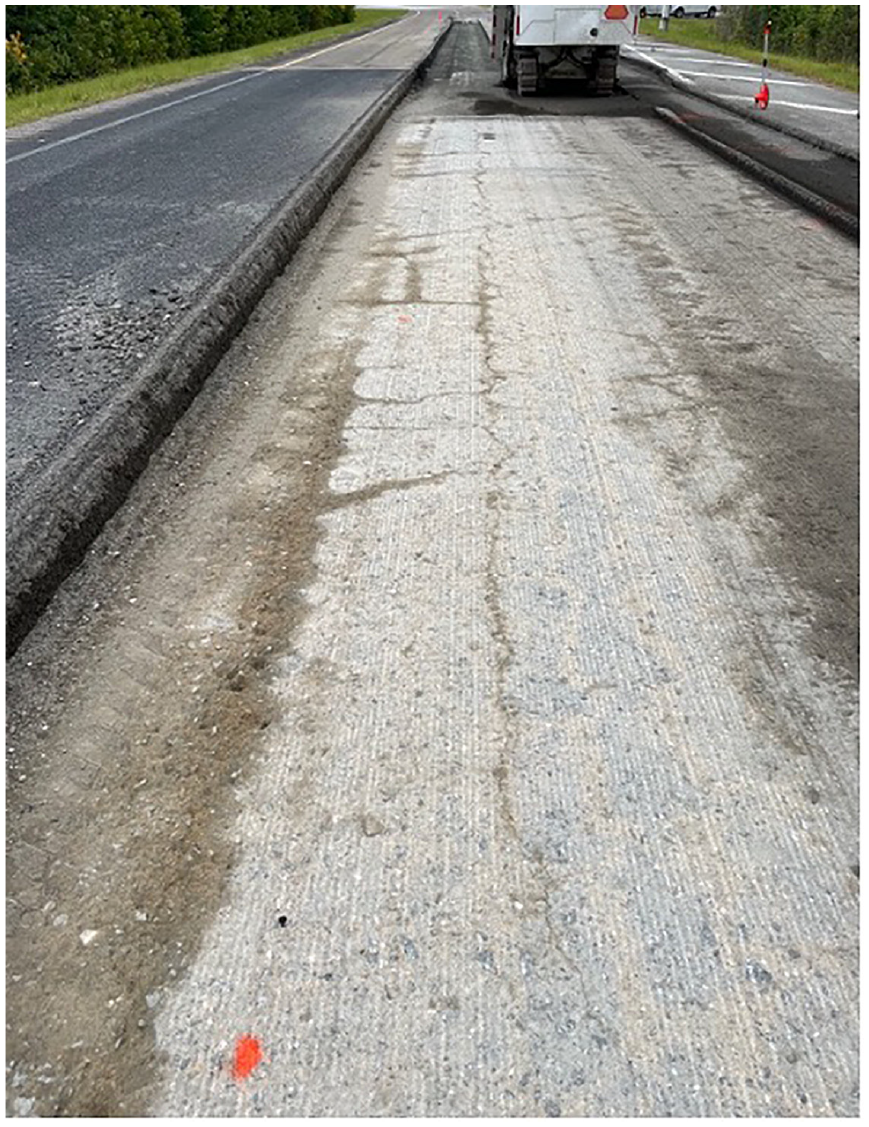
The surface of the stabilized base layer after milling the CCPR layer.
Further, these cracks did not reflect through the CCPR layer or to the surface. This was confirmed during trenching and coring where cracking in the stabilized base was not found in the overlying CCPR layer. Figure 9 shows an example of a core that exhibited cracking in the stabilized base layer (the core in the photograph is oriented so that the bottom of the core is at the top of the photograph). The lack of any cracking in the CCPR layer was thought to be owing to one of or a combination of the following reasons: (1) the cracks in the stabilized base layer maintained their load transfer ability and thus the crack energy did not propagate upwards, (2) the high void structure in the CCPR mix matrix acted as a mitigation layer, absorbing the crack energy propagating from the stabilized base layer.
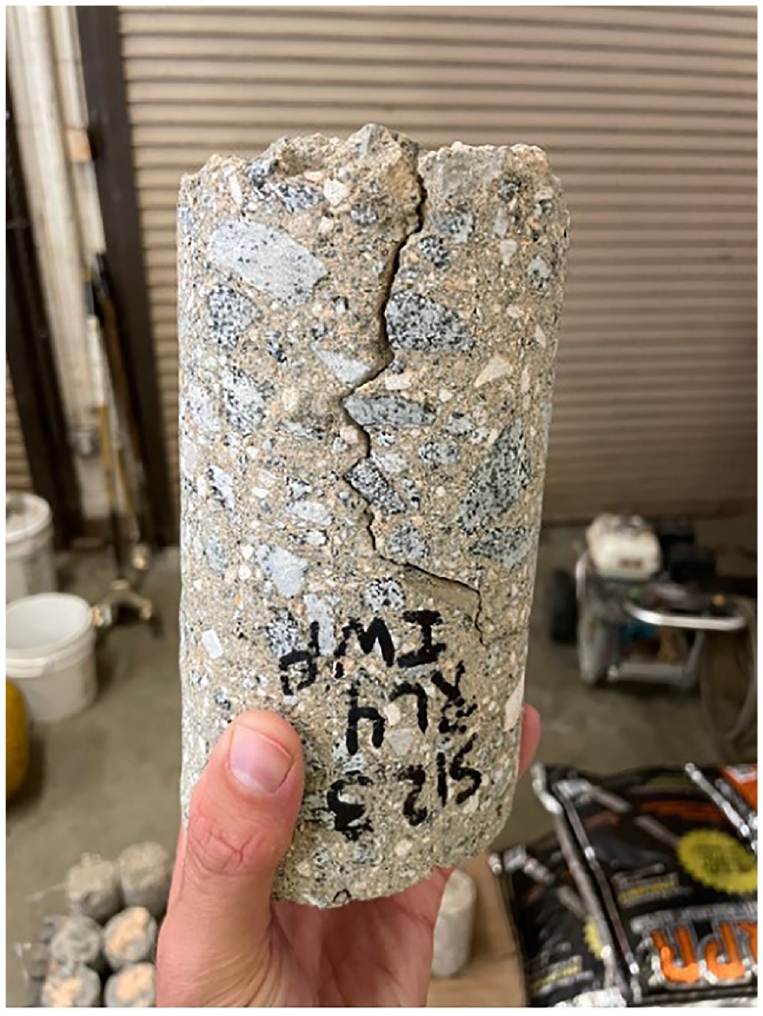
A stabilized base core with a full-depth crack.
Mechanistic Testing and Performance Prediction Comparison of Section S12
The forensic investigation included characterizing the surface AC mixture (S12-surface mixture [SM]), intermediate AC mixture (S12-intermediate mixture [IM]), and CCPR mixture (S12-CCPR) with respect to air voids, density, and dynamic modulus (E*) in accordance with AASHTO TP 132, Determining Dynamic Modulus for Asphalt Mixtures Using Small Specimens in the Asphalt Mixture Performance Tester (AMPT). The dynamic modulus (E*) was conducted on all asphalt layers and compressive strength testing was conducted on the stabilized base layer. Using the mechanistic results, the predicted performance using Level 1 or VDOT standard inputs (where Level 1 inputs could not be obtained) was computed using AASHTOWare Pavement ME Version 2.6.0 and compared with the measurements made by the Automated Distress Vehicle.
Asphalt Layers
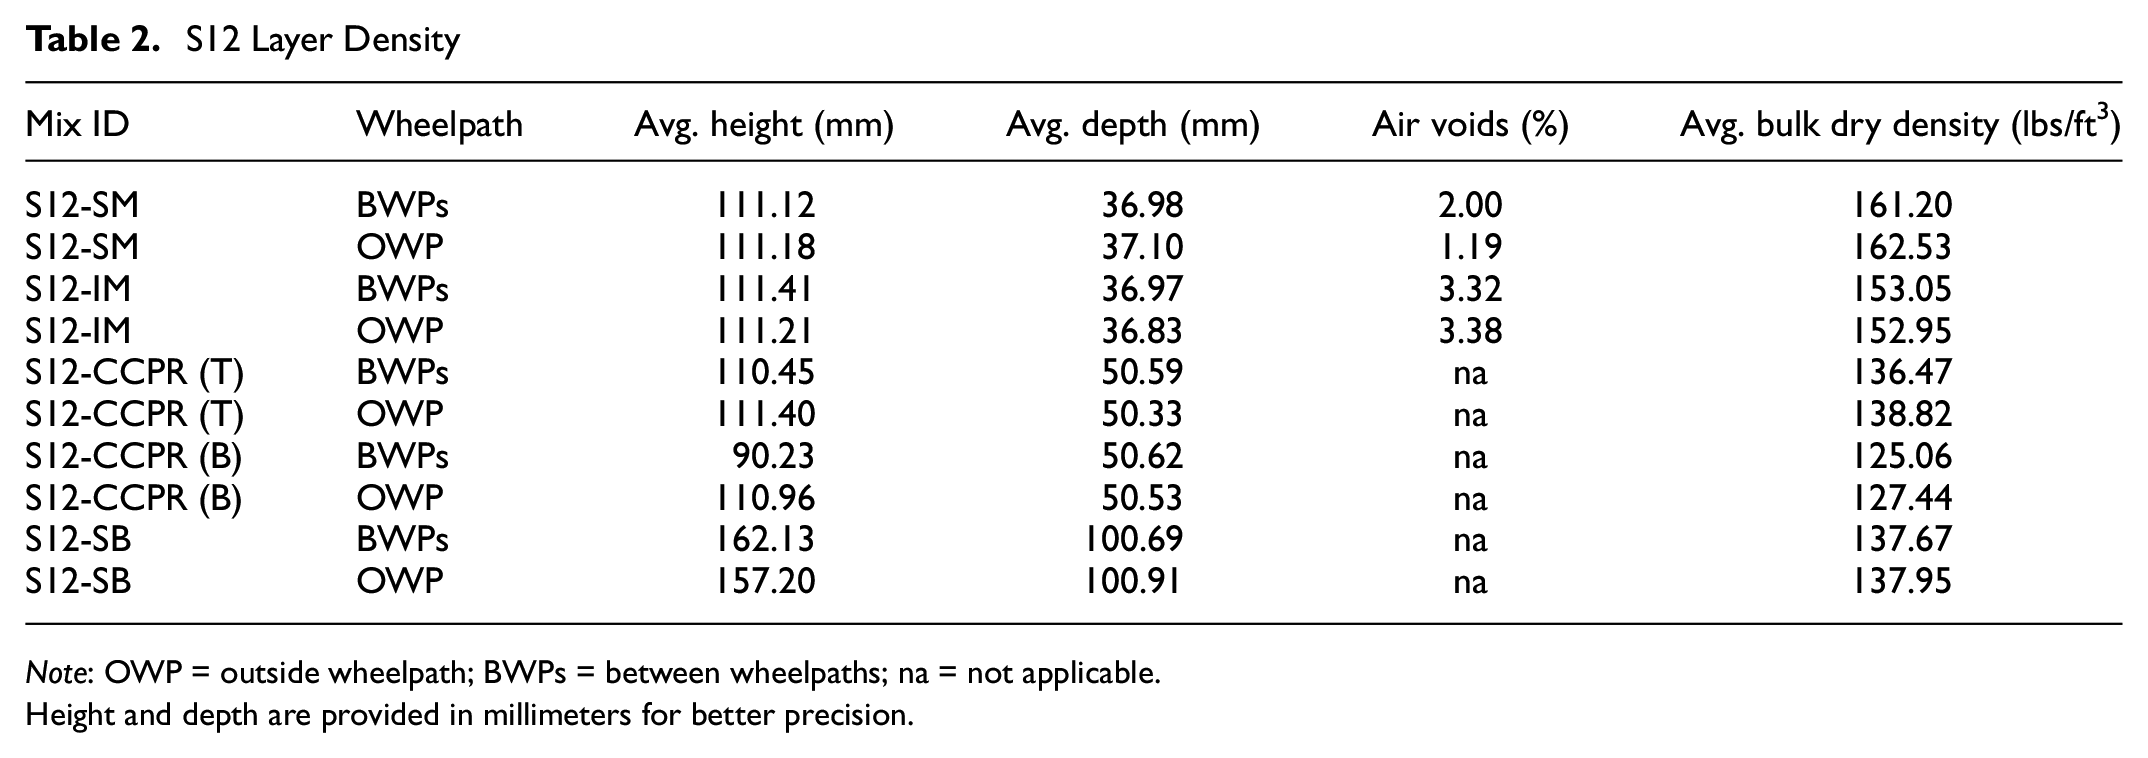
Four small-scale specimens were cored horizontally from the 6-in.-diameter field cores and trimmed in accordance with AASHTO PP 99, Procedure B. A 38-mm diameter specimen was cored from the surface and intermediate layers, and two 50-mm diameter specimens were cored from the CCPR layer. The maximum theoretical specific gravity (Gmm) was not determined from the field cores. Gmm from construction was used to determine air voids. Following specimen removal, the density for each small-scale specimen was determined by bulk specific gravity and air voids for the AC mixtures, whereas specimen geometry and dry mass were used to calculate the CCPR bulk dry density. Table 2 shows that the density was slightly lower for BWPs compared with OWP, with the exception of S12-IM. A two-tailed, equal variance Student’s t-test was conducted assuming p-values less than 0.05 were significant. The difference in BWPs and OWP densities was not found to be statistically significant except for S12-CCPR (1).
S12 Layer Density
Note: OWP = outside wheelpath; BWPs = between wheelpaths; na = not applicable.
Height and depth are provided in millimeters for better precision.
It was postulated that the upper portion of the CCPR layer had a higher density than the bottom owing to high internal friction and ambient material temperatures during construction. To evaluate this hypothesis, specimens were cored from the upper (top) and lower (bottom) segments of the field core to compare the difference in density and dynamic modulus, these specimens were designated as S12-CCPR (T) and S12-CCPR (B), respectively. Samples from S12-CCPR (B) BWPs were not obtained as they broke during the horizontal coring procedure. Therefore, dynamic modulus testing was not conducted for this sample set; however the density was evaluated. The dry density measured after construction with a nuclear density gauge in direct transmission, adjusted for moisture content, was 130 lbs/ft3 ( 9 ). Table 2 suggests some densification of the CCPR layer as the density of the wheelpath location was slightly higher (approximately 2.4 lbs/ft3) than the density between wheelpaths. Table 3.1 also shows that the top of the CCPR layer had a higher density (approximately 11.4 lbs/ft3) than the bottom of the CCPR layer. A Student’s t-test was conducted to evaluate the difference in top versus bottom density in the CCPR layer and found that the p-value was less than 0.05; indicating that the difference in top versus bottom density was statistically significant.
S12 Pavement ME Software Inputs
Note: AC = asphalt concrete; C1, C2, BF1, BS1 = Calibration Factors; VDOT = Virginia Department of Transportation; SM = surface mixture; IM = intermediate mixture; CCPR = cold central plant recycled; NMAS = nominal maximum aggregate size; BWP = between wheelpaths; OWP = outside wheelpath; ME = Mechanistic Empirical.
Annual average daily truck traffic (AADTT) was derived from known traffic data from the NCAT Test Track.
Values for SM and IM were determined from construction quality control data. Values for CCPR are VDOT default values.
Lowest average unit weight between BWPs and OWP was input into Pavement ME since the modeling analysis did not account for wheelpath. S12-CCPR (B) OWP density was used for the CCPR layer.
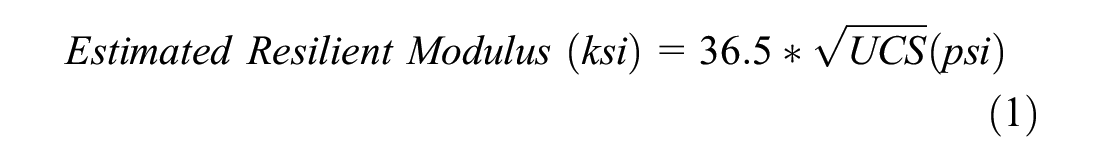
S12-SB estimated resilient modulus was derived from unconfined compressive strength data using Equation 1.
Resilient modulus of the subgrade was determined through backcalculation of falling weight deflectometer data.
Following specimen preparation, the dynamic modulus was assessed at 4.4°C, 21.1°C, and 37.8°C and at 25, 10, 5, 1, 0.5, and 0.1 Hz, consistent with testing conducted during NCHRP Project 09-51 ( 6 ). Data quality was assessed according to AASHTO TP 132. Data quality for the S12-SM and S12-IM mixtures generally met specification requirements except for one sample that had higher phase angle and deformation uniformity, and two other samples that were slightly greater than the deformation uniformity limit. This is likely to be a result of the variable void structure of the in-place cores. Deformation uniformity for the CCPR tests was as high as 51% and 60% for S12-CCPR (T) and S12-CCPR (B), respectively, which is considerably higher than the limit of 30%. These findings are consistent with observations made in NCHRP 09-51. Per AASHTO TP 132, “nonuniform air void distribution” and “poor gauge point placement” are known causes for high deformation uniformity and both factors were observed in testing the CCPR layer, as the high void structure resulted in a rough external texture making it difficult to apply gauge points consistently.
From the E* data, master curves were developed based on the average E* for three to four specimens, depending on availability, in accordance with AASHTO R 84. Figure 10 illustrates the master curves for each layer and wheelpath location for the AC and CCPR layers from Section S12. S12-IM produced a higher modulus than S12-SM, likely owing to the lower asphalt content, thus the aggregate’s role in controlling the stiffness of the mixture. S12-SM was an SMA mixture produced at 6.1% asphalt content, compared with S12-IM, a dense-graded Superpave mixture at 4.7% asphalt content. The higher asphalt content in the surface may have provided more flexibility and strain response within the mixture decreasing the modulus. OWP and BWPs produced similar results, suggesting that slight deviations in density observed in Table 2 did not have a considerable effect on E*. This was also observed for S12-CCPR (T) even though differences between BWPs and OWP density were found to be significant. The density gradient throughout the CCPR layer did affect the E* data. From Figure 10, E* for S12-CCPR (B) was roughly half the E* recorded for S12-CCPR (T). The CCPR layer also does not appear to be as sensitive to changes in temperature and frequency as the dense-graded mixtures indicated by a lower rate of change with increasing reduced frequency, which agrees with the findings from NCHRP 09-51 ( 6 ).
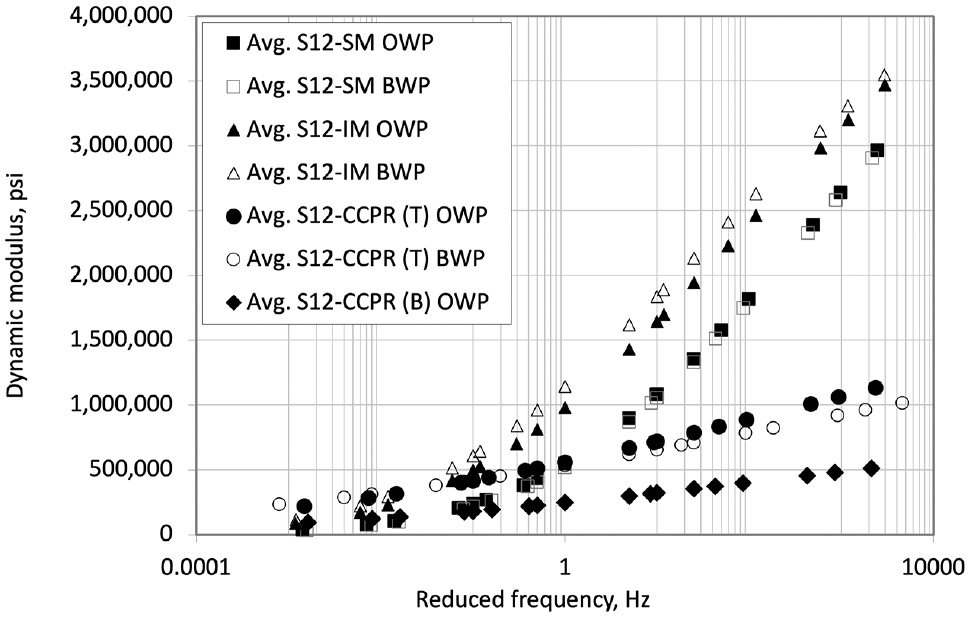
S12 dynamic modulus master curves for the outside wheelpath (OWP) and between wheelpaths (BWPs) for the surface mixture (SM), intermediate mixture (IM), and cold central plant recycled layers.
Mechanistic Testing of the Stabilized Base Layer
For the stabilized base layer, density and unconfined compressive strength (UCS) were evaluated in accordance with ASTM D1633. Specimen trimming was minimized to achieve as close to a height-to-diameter ratio of 2 as possible. Aggregate pieces around the core edges were prone to chipping during trimming so the sample was enclosed in a fiberglass tube for support during cutting. Some material was still lost causing some samples to fail the 3-mm planeness criterion for gypsum capping. If samples failed this criterion on account of missing aggregate but generally met the requirement across the rest of the sample, the specimen was not trimmed again to conserve height. Cores were then capped with gypsum cement in accordance with ASTM C617. To ensure proper workability and set time, 0.33 water-to-cement ratio was used, but the mortar cubes did not meet the minimum specification strength of 5,000 psi. Since the strength of the cap exceeded the expected strength of the specimens by nearly three times, it was considered acceptable. Specimens were tested applying a constant load of 20 psi/s.
Figure 11 details the density and UCS for S12-SB BWPs and OWP cores and for the design. Although the density was similar between BWPs and OWP, the strengths resulted in an average difference of 172 psi. A Student’s t-test found that the difference in strength, based on wheelpath, was not statistically significant in that the p-value was greater than 0.05. Figure 11 also shows a higher variability among the OWP specimens. This suggests potential internal material property variations along the width of the lane. There was also a considerably higher strength when compared with the design strength. Cement-stabilized bases are expected to continue to gain some strength over time. However, S12-SB increased 300% in strength compared with the design ( 9 ), which implies that a higher than designed cement content was used during construction and further suggests that perhaps shrinkage is the cause of the cracks that formed in the SB.
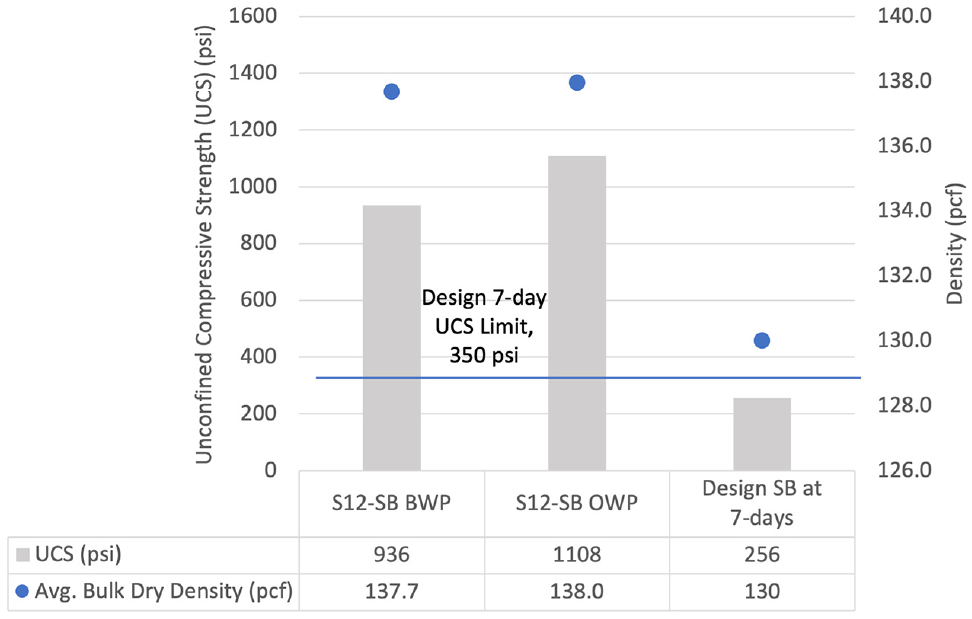
Unconfined compressive strength of the stabilized base layer compared with design data.
Pavement ME Evaluation and Comparison
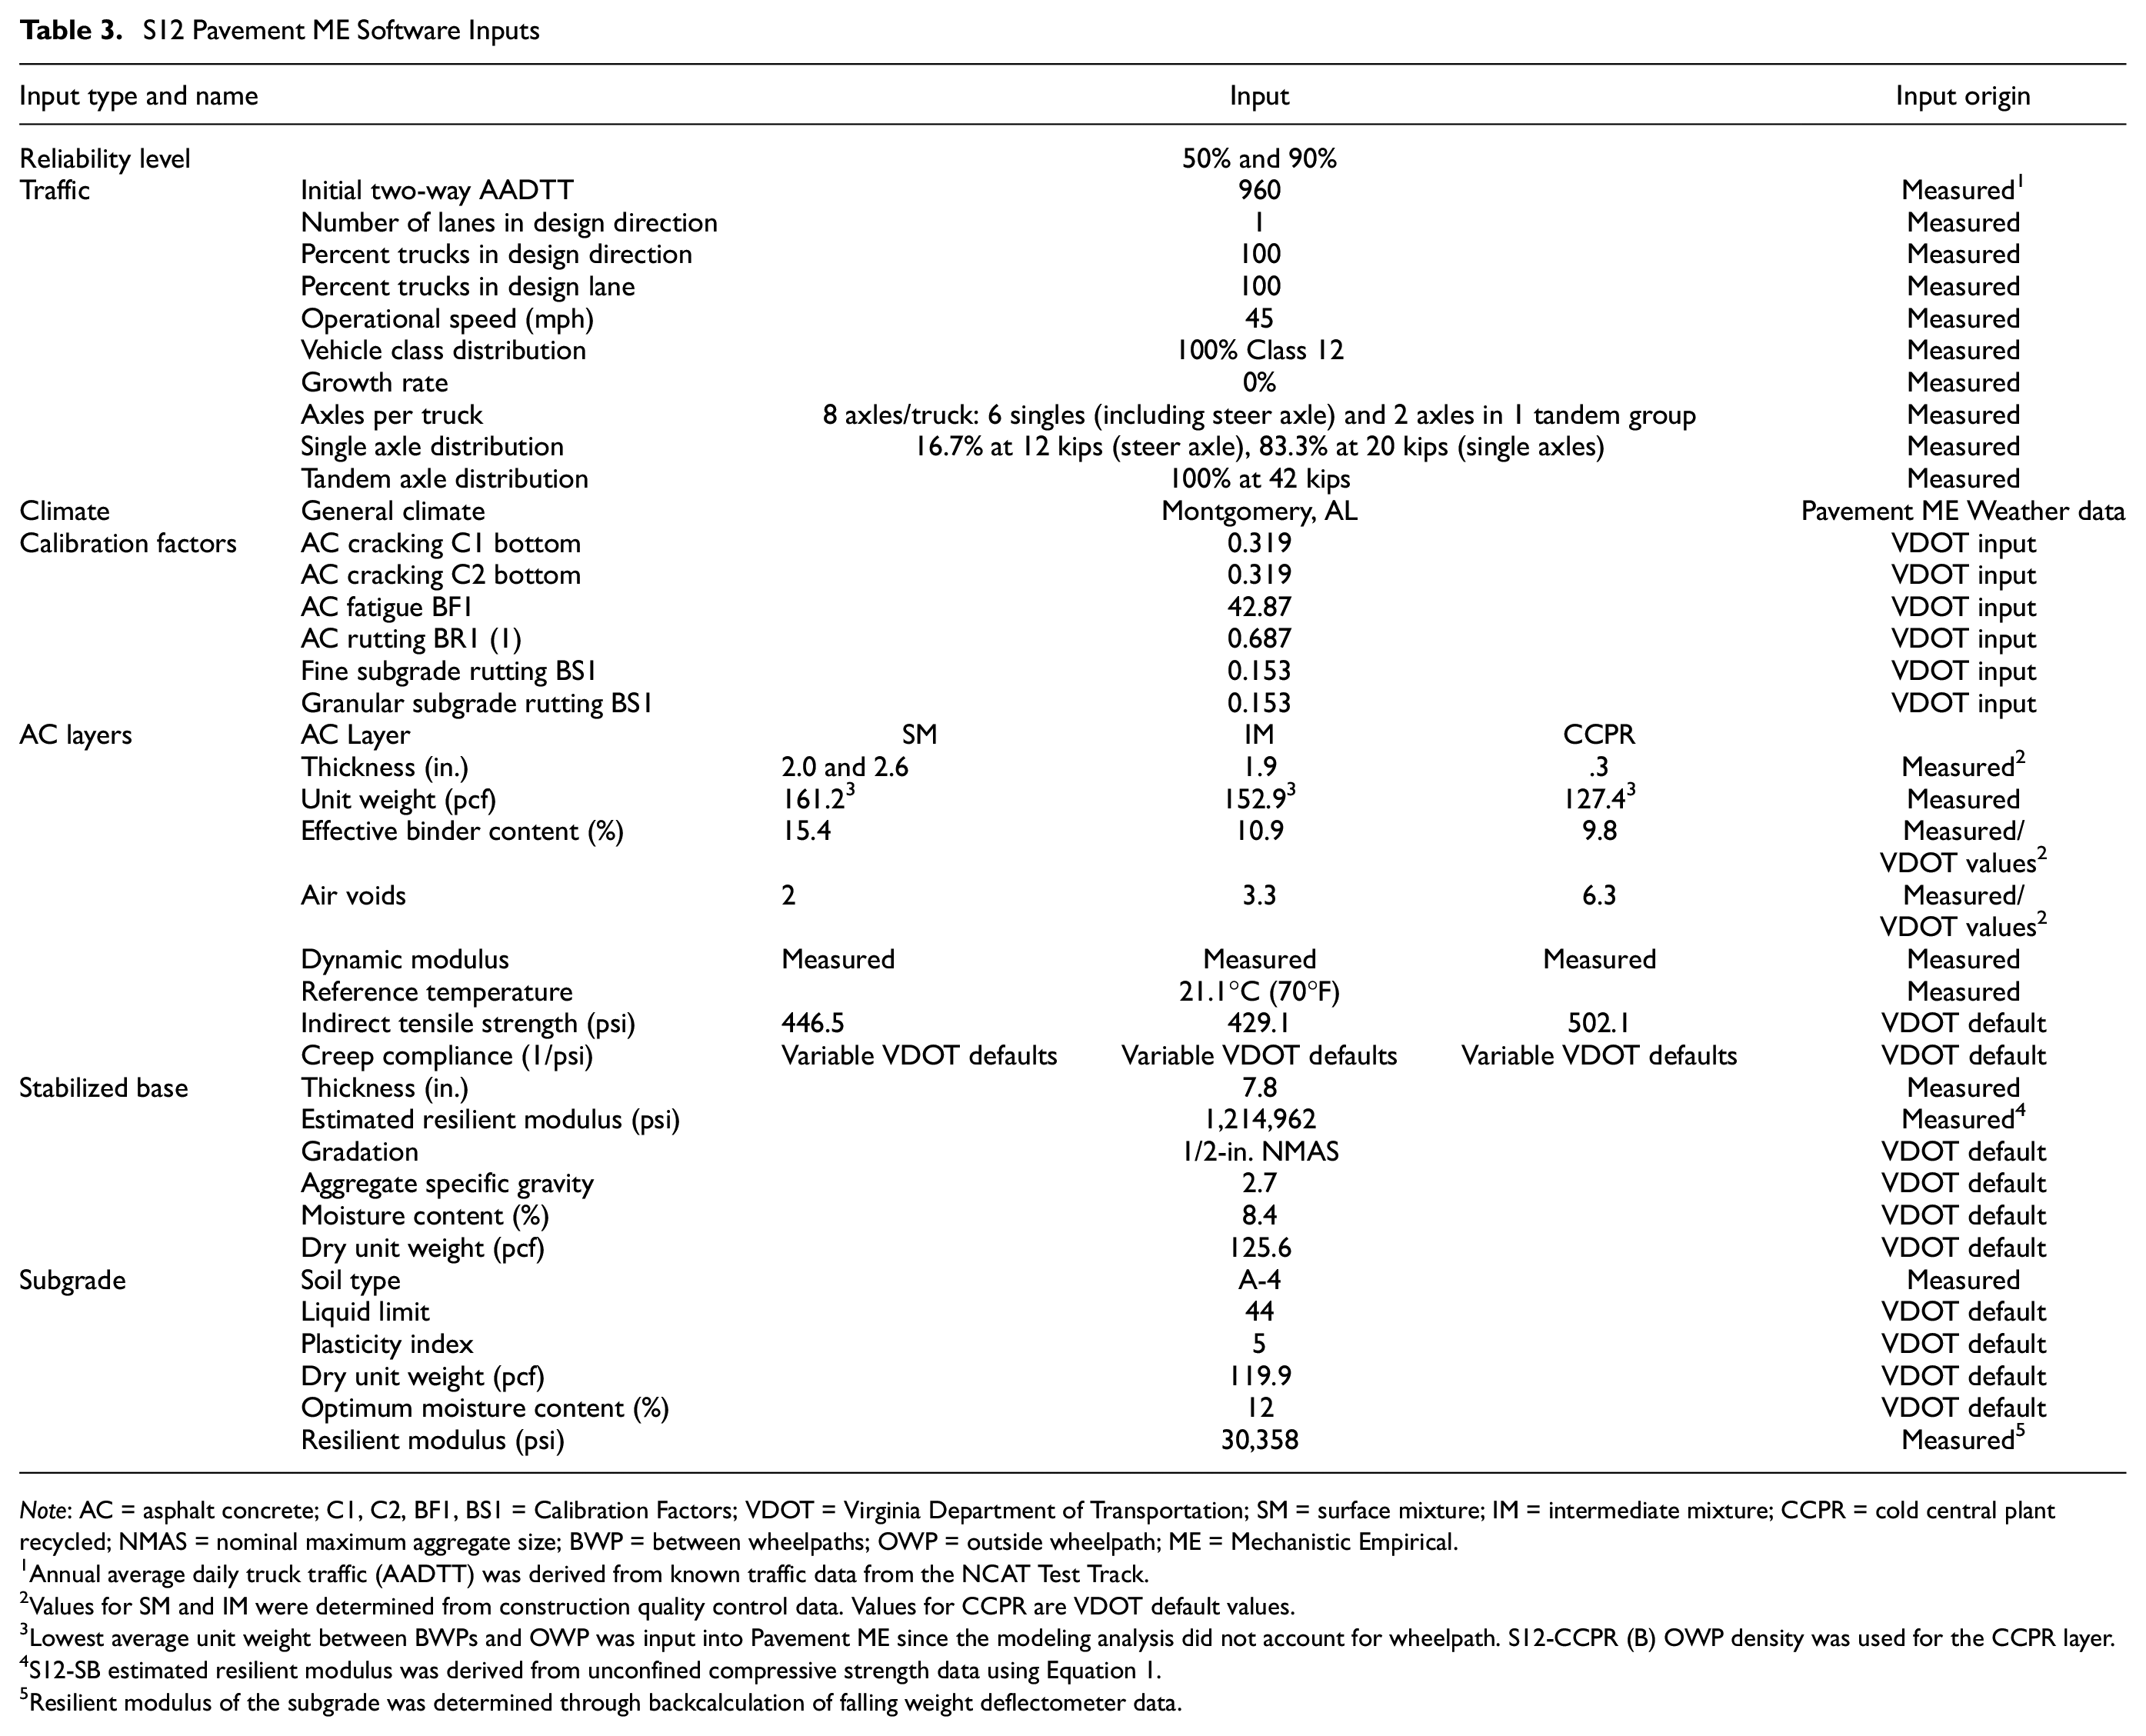
Following testing, Section S12 was evaluated in Pavement ME to compare the predicted with the actual performance. Material inputs were taken from laboratory testing of specimens prepared from the cores collected during the forensic investigation. The inputs included measured E* from the HMA and CCPR and the measured compressive strength of the cement-stabilized base cores taken after 10 years. Historical resilient modulus (MR) data for the subgrade materials were used at the NCAT Test Track. VDOT’s AASHTOWare Pavement ME User Manual was used as a guideline to modify software defaults to Virginia’s state-specific values where Level 1 inputs were not available ( 14 ). Some inputs were further modified to correspond to measured or derived values for Section S12, such as traffic, climate, and pavement layer information. Inputs modified from software defaults are listed in Table 3, with the corresponding reference for each input.
Traffic inputs were modified to reflect conditions at the NCAT Test Track over the three research cycles in which 30 million ESALs were applied. To account for no trafficking between research cycles when reconstruction of other sections occurred, the analysis period was adjusted to 8 years of continuous traffic that evenly resulted in 30 million ESALs over the analysis period. Based on these conditions, the initial two-way annual average daily truck traffic (AADTT) was 960, which produced 30.1 million ESALs at the end of the analysis period, just above the target of 30 million ESALs. Vehicle class distribution, vehicle configurations, and hourly distributions were also changed to reflect NCAT’s fleet of tractor-triple-trailer trucks consisting of a steer axle, a drive tandem axle, and five trailing single axles per vehicle and NCAT Test Track trucking operations.
VDOT’s Pavement ME user manual models the CCPR and stabilized base layers similar to an asphalt base mixture and a strong nonstabilized base, respectively. Making the generalization that CCPR is similar to a base mixture requires assuming typical values for volumetric properties that are otherwise unknown for CCPR. For example, Gmm is not typically determined for CCPR mixtures making air voids and effective binder content and requires assumptions to be made. In addition, the SM layer was an SMA but was modeled as a standard SM layer since Pavement ME does not distinguish specialized mixtures. To model the stabilized base, the UCS was correlated to resilient modulus (Mr) using Equation 1, ranging from 1,117 to 1,215 ksi ( 16 ),
S12 was evaluated for two scenarios: 2 and 2.6 in. of S12-SM based on the target thickness and the VDOT surveyed thickness, respectively, with all other thicknesses based on recorded values by Diefenderfer et al. ( 9 ). All other inputs and properties were held constant between iterations.
Figure 12 illustrates the average predicted rutting for the total pavement compared with the average measured rutting. Pavement ME overpredicted total rutting by roughly 150% compared with the measured performance. However, the predicted rutting at 90% reliability is considerably lower than the threshold limit of 0.75 in., indicating that the structure would pass this performance criteria if the software were used in the design phase. Between iterations, more rutting is predicted for the 2.6-in. SM, even though it capitalizes on a strong aggregate structure and should in theory result in less rutting. With regard to assuming a continuous 8-year test cycle, when observing the predicted average rutting over the first 10 million ESALs (which were applied continuously), the predicted rutting values were very close compared with the measured distresses.
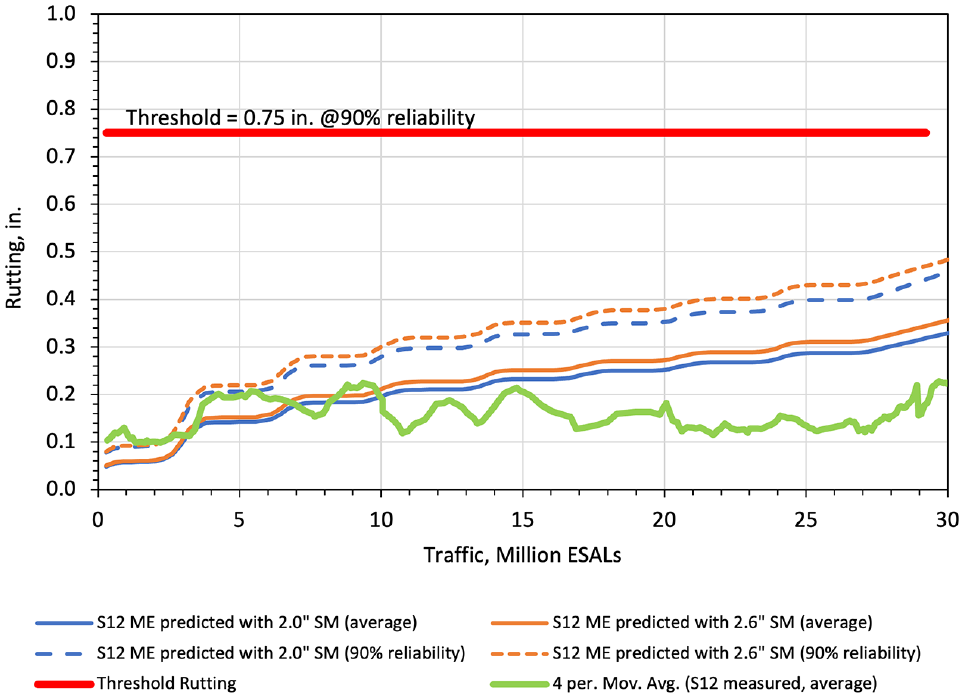
S12 predicted and measured rutting.
As previously stated, a portion of Section S12 exhibited higher roughness and was remediated at 10 million ESALs. To account for the roughness correction to Section S12, a change in IRI data over the analysis period from the initial IRI before opening to traffic was used rather than actual IRI data for comparison. Figure 13 compares the predicted and measured change in IRI data over the analysis period relative to the initial IRI after construction. Like the rutting analysis, the 2.6-in. SM was predicted to have a higher change in IRI than the 2-in. SM.
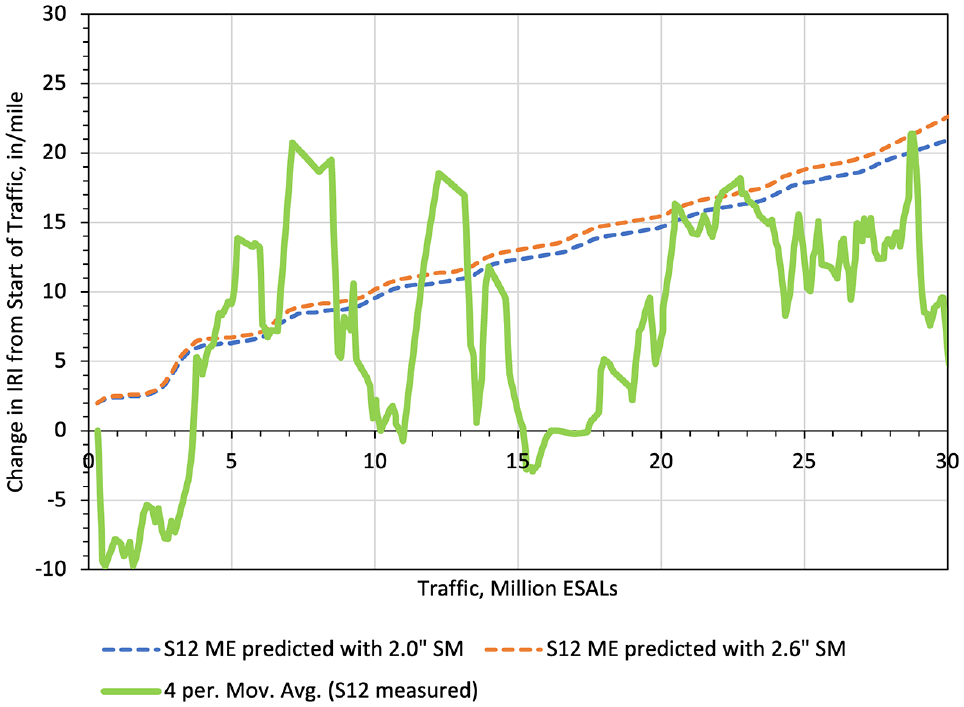
S12 predicted and measured change in IRI from the start of traffic.
Even though no cracks were observed on the surface of section S12 after 30 million ESALs, Pavement ME analysis predicted 84 ft/mi of thermal cracking and 262 to 263 ft/mi of top-down cracking at a 90% reliability level after 30 million ESALs for both scenarios with 2.0 and 2.6 in. of SM, respectively. However, the predicted values were considerably lower compared with the threshold limit of 1,000 ft/mile and 2,000 ft/mile for thermal and top-down cracking, respectively. Because of such low values, a figure was excluded for brevity. The Pavement ME software predicted bottom-up fatigue cracking of 1.85% and 1.86% of lane area for scenarios with 2.0 and 2.6 in. of SM, respectively. However, the forensic investigation revealed that no bottom-up fatigue cracking occurred in section S12.
The results of the Pavement ME evaluation show that the software predicted similar or more distress than was observed for the pavement section. This may be caused by a combination of overgeneralization of pavement material inputs for the SMA, CCPR, and stabilized base layers, which does not have an appropriate way to input key material characteristics, and the use of transfer functions that were originally calibrated for different materials. Further study of these issues is warranted.
Findings, Conclusions, and Recommendations
The following conclusions and recommendations can be drawn from the completion of trafficking 30 million ESALs on test sections containing CCPR and an asphalt overlay, with and without a stabilized base:
Cracking, rutting, and IRI remained satisfactory (i.e., no maintenance actions are needed) for both Sections N4 and S12. The research sponsor decided to discontinue trafficking on Section S12, but will continue trafficking Section N4 to investigate the propagation of minor cracks that appeared at the end of its third test cycle.
The stabilized base layer greatly reduced the bending action in Section S12 as compared to Section N4 that had the unstabilized aggregate base. This was shown by the lower tensile strain at the bottom of the CCPR for Section S12.
Trenching of Section S12 showed no substantial deterioration or rutting in the cross section.
Forensic investigations revealed that cracking, originating in the stabilized base layer, did not propagate through the CCPR layer. It was concluded that the properties of the CCPR layer made it effective at reducing reflective cracking.
A density gradient was found between the top and bottom of the CCPR layer. The difference in density was found to influence the E* results in that the dynamic modulus of the bottom of the layer was approximately half the dynamic modulus of the top of the layer. It is unclear whether the performance of the section would be different had the gradient not existed. Future research should study whether differences in density between the top and bottom of a CCPR layer result in differences in performance.
The stabilized base layer in Section S12 was found to contain both longitudinal and transverse cracks during the forensic study. It is suggested that these cracks are the result of both loading and shrinkage cracking given their orientation and the high compressive strength of the stabilized base-layer material.
The cracking in the stabilized base layer in Section S12 was considered to be nonworking cracks and thus their presence might only be significant in wet–freeze environments.
Pavement ME overestimated the predicted rutting, but provided similar predictions for IRI and cracking. It is known that the material inputs and transfer functions in Pavement ME are designed for HMA and future research should consider developing relevant material property inputs and transfer functions within Pavement ME specifically for CCPR and stabilized base layers.
Footnotes
Author Contributions
The authors confirm contribution to the paper as follows: study conception and design: B. Bowers, B. Diefenderfer, D. Timm; data collection: B. Bowers, T. Lynn, D. Timm; analysis and interpretation of results: B. Bowers, B. Diefenderfer, T. Lynn, D. Timm, S. Gatiganti; draft manuscript preparation: B. Bowers, B. Diefenderfer, T. Lynn, D. Timm, S. Gatiganti. All authors reviewed the results and approved the final version of the manuscript.
Declaration of Conflicting Interests
The authors declared no potential conflicts of interest with respect to the research, authorship, and/or publication of this article.
Funding
The authors disclosed receipt of the following financial support for the research, authorship, and/or publication of this article: The CCPR sections built in 2012 were sponsored by Virginia Department of Transportation (VDOT). The authors are grateful for the support and cooperation of the many individuals from VDOT and the contractors involved in the experiments.