
Abstract
Reasonable and appropriate traffic sign information volume (TSIV) is crucial to ensure road traffic safety, especially at the entrance zones of highway tunnels. This research compares how various levels of TSIV affect both visual characteristics and visual workload of drivers through real road driving tests. Forty participants were recruited to conduct a field driving experiment at six highway tunnels. The eye movement data of drivers were collected by an eye tracker and the effects of TSIV on drivers’ eye movement characteristics, visual stability, visual SampEn (sample entropy), and visual workload intensity were analyzed and evaluated. At the T3 level (48.31 bits) of TSIV, the drivers’ average fixation duration and average saccade duration were both at the lowest value, while the drivers’ average saccade amplitude reached the maximum, and the dispersion of the three eye movement indicators was the smallest. In addition, the drivers’ visual SampEn increased continuously when approaching the tunnel portal, and was the lowest at T3 level. With the increase of TSIV, drivers’ visual workload intensity decreased first and then increased, the minimum being at T3 level. The drivers’ visual behavior is more stable, visual coordination ability is better, and visual workload and psychological pressure are least under the T3 level, which is beneficial to ensure driving safety at the entrance zone of a highway tunnel. Inappropriate levels of TSIV at highway tunnel entrance zones will cause inevitable risks to driving safety.
Keywords
China now has the world’s biggest highway tunnel network in both length and quantity of tunnels, as well as the fastest growth rate as a result of the explosive growth of its highway transportation infrastructure ( 1 ). Highway tunnels play an extremely important role in the traffic system, making travel for people and freight more convenient and fast. However, tunnel traffic safety is an important issue in the field of highway traffic safety because tunnel accidents cause greater severity of injuries and traffic delays than accidents on open roads ( 2 , 3 ). Many studies on the subject of tunnel traffic safety have pointed out that the entry zone has a far greater accident rate than the rest of the tunnel, making it the most dangerous part of the tunnel ( 4 – 6 ). As a result, it is crucial to consider traffic safety while designing the tunnel entrance zone to lower the number of accidents and their severity, and the traffic delays they produce.
Statistics on traffic accidents in Chinese highway tunnels point to abrupt and unforeseen shifts in the surrounding traffic as the root cause of the high accident rate in the tunnel entrance zone ( 7 , 8 ). Therefore, providing reasonable information at the tunnel entrance zone for drivers to judge and make decisions in advance, and improving drivers’ perception of information at the tunnel entrance, is an effective measure to improve tunnel traffic safety. Traffic signs are one kind of traffic management device that may provide road users with important information about the forthcoming scenario ( 9 ). As a result, reasonable traffic signs at the highway tunnel entrance area are critical ( 10 ).
Traffic signs are important facilities for the transmission and feedback of traffic information. Traffic signs provide clear traffic information to road users through characters, numbers, colors, graphic symbols, and other information elements. They guide and organize traffic flow to ensure the safe, smooth, and orderly operation of vehicles ( 11 ). Therefore, traffic sign information is directly related to the safety of highway operation ( 12 ). However, it seems that the issue of the reasonableness of traffic sign setting has not been given due attention, and one very prominent problem is that the phenomenon of unreasonable traffic sign information volume (TSIV) is very common. Unreasonable TSIV is specifically manifested in two situations: insufficient and overloaded traffic sign information. The overload of TSIV can lead to an increase in the driver’s perceptual reaction time, a decrease in visual search efficiency, and a greater visual cognitive workload ( 13 , 14 ). Insufficient TSIV also makes it difficult for drivers to gain sufficient information, which causes psychological strain and inadequate preparation for operation, and may even induce risky driving behaviors such as driving while distracted or driving aggressively ( 15 ). It is clear that both excessive and inadequate TSIV will have a detrimental effect on the safety of driving. Especially at the highway tunnel entrance zone, the driver is about to enter an enclosed and dim tunnel from the open and bright road environment. More effort is required of the driver than on a typical stretch of highway ( 16 – 18 ), and the role of traffic sign information to guide and prompt drivers is also more important. Thus, it is very important to traffic safety that the TSIV at the highway tunnel entrance zone is reasonable.
While driving, drivers are required to understand information that is pertinent to the performance of driving duties in real time, so that they can make decisions and adjust the driving operation through their judgment of the situation ( 19 , 20 ). Studies have shown that drivers primarily acquire information about the traffic environment through visual behavior during driving ( 21 ). At the same time, drivers’ eye movements can characterize their information preferences and mental workload levels when faced with various traffic scenarios ( 22 ). Therefore, analyzing the changes of drivers’ eye movements affected by TSIV is one of the methods used to evaluate whether TSIV is reasonable or not ( 23 ).
TSIV at the highway tunnel entrance zone should be evaluated before a highway tunnel is opened for operation. However, the current relevant standards in China, “Design Specifications for Highway Safety Facilities” ( 24 ) and “Specifications for Design of Highway Tunnels, Section 2, Traffic Engineering and Affiliated Facilities” ( 25 ), which specify the types and locations of traffic signs that should be set up and are recommended to be set up in highway tunnels, do not clearly specify the appropriate range of TSIV at the entrance area, which may be one of the reasons why the issue of unreasonable TSIV at the highway tunnel entrance zone is very serious. Moreover, there are few studies that evaluate TSIV at the highway tunnel entrance zone. To accomplish this goal, the current research investigates the safety impact of TSIV at the entrance zone of highway tunnels based on the visual characteristics of drivers and the level of visual workload they experience. The findings of the research may be used to develop a directing strategy for the sensible placement of traffic signs at the entrance zone of the highway tunnel, so that more user-friendly and effective traffic signs can be designed and installed, thus ensuring safe driving.
The remaining parts of this paper are divided into the following sections. The Literature Review section summarizes previous studies related to traffic signs at tunnels, traffic signs and human factors, and TSIV. The Methodology section describes the method for quantification of TSIV and the test tunnels, participants, experimental apparatus and procedure involved in this study. The Results section analyzes observations about the effects of TSIV on drivers’ visual characteristics obtained from the field driving experiments. The Discussion section discusses the findings about the effects of TSIV on drivers’ visual stability, visual sample entropy, and visual workload intensity. The Conclusion section presents the main findings of the study and suggestions for further research.
Literature Review
Research on Traffic Signs at Tunnels
A series of meaningful research results have been achieved on tunnel traffic signs. Based on the analysis of simulated driving experiments, Fang et al. ( 10 ) concluded that drivers’ judgment can be affected by unreasonable combinations of warning signs and deceleration measures, leading to negative effects like premature lane changes and increased driving workload at the entrance section of the highway. The presence of exit advance guide signs in tunnels has a beneficial impact on the controllability of vehicles being driven through them ( 26 ). Lu et al. ( 27 ) and Shang et al. ( 28 ) suggested distinct advance guidance signs for the location and distance of the tunnel exit, and tested the safety efficacy of signs with varying heights, widths, and spacing depending on drivers’ visual characteristics. In addition, they also compared and analyzed the differences in visual recognition between drivers who were familiar and unfamiliar with different advance guide signs, and they discovered that advance guide signs placed on the left side wall of highway tunnels are more effective than those placed on the right side wall ( 29 ). Hu et al. ( 30 ) conducted research to investigate the connection between the characteristics of contour design inside the highway tunnel and the dimensions of the guide signs. A model of the size of the guide signs within the tunnel was developed, and maximum dimensions for the guide signs were provided based on the various combination situations. By researching drivers’ visual recognition processes, Bai et al. ( 31 ) created a model for speed limit signage at highway tunnel entrances and exits and suggested values for various driving scenarios. When the entrance zone and exit zone of two neighboring tunnels are located close to one another, the presence of traffic signs at tunnel exits may have an effect on the safety of driving. Based on drivers’ visual inertia and features of pupil shifting, Bin et al. ( 32 ) suggested a model for the placement of traffic signs in clusters of neighboring tunnels. Variable message signs (VMS) are used in emergency evacuation of road tunnels for road users to find an escape path. Ronchi et al. ( 33 ) found that the features of VMS that performed best in emergency evacuation of road tunnels included larger size signs, flashing lights, and a combination of green graphic symbols and amber text.
Research on Traffic Signs and Human Factors
Numerous studies have found that traffic signs have a significant influence on the human factors of driving. The driver’s misperception and interpretation of road space is one of the causes of human errors. Reasonable traffic signs are extremely important to improve the perception of road space, and the effectiveness of traffic signs depends on whether the driver has received the information conveyed correctly ( 34 ). The individual qualities of drivers and the design features of signs have a considerable influence on the driver’s ability to comprehend traffic signs. Furthermore, a driver’s ability to comprehend traffic signs has a close relationship with traffic safety ( 35 ). According to the research done by Kaplan et al. ( 36 ), the impression of a safety improvement was connected not only to the driver’s understanding of the traffic signs, but also to the TSIV, and it was more related to the driver’s driving style and the information processing needs of the environment. Ng and Chan ( 37 ) found that years of holding a driver’s license and education level had significant effects on the comprehensibility of traffic signs. By employing a decision tree algorithm, Taamneh ( 38 ) was able to establish the primary elements that influence a driver’s interpretation of traffic signs. These include the driver’s age, marital status, educational background, and amount of driving experience. Taheri et al. ( 39 ) believed that the availability of traffic signs depended mainly on the education level and age of the driver, as well as on the design characteristics of the traffic signs. On the other hand, a driver’s behavior can change significantly in the process of identifying traffic signs ( 40 ), for example, drivers may tend to reduce their speed to read the information displayed on VMS ( 41 ). Huang et al. ( 42 , 43 ) observed that complicated diagrammatic guide signs affected drivers’ visual characteristics and driving behavior and suggested the best design for advanced guide signs of closely spaced exit ramps on urban expressways. Zahabi et al. ( 44 , 45 ) analyzed the effect of freeway exit ramp traffic signs on drivers’ attention allocation and found that older drivers exhibited poorer performance and more conservative control strategies, while the number and format of panels and familiarity had no significant effect on drivers’ performance and attention allocation, but that all drivers were more accurate in visual recognition and identification of six-panel signs. Guan et al. ( 46 ) observed that drivers’ deceleration behavior relied on whether they received the information provided by traffic signs and how much they trust it.
Research on TSIV
TSIV can affect the vision, cognition, and driving behavior of drivers. Research on TSIV has achieved many important results. Static cognitive studies were used by Lyu et al. ( 47 ) to reach the conclusion that the cognitive workload of drivers was directly connected to TSIV. These experiments demonstrated that the driver’s response time increased as TSIV rose. In addition, the findings of the simulated driving tests revealed that there were substantial disparities in the ways in which drivers maintained their speed and offset their lanes in response to various TSIVs. Liu ( 13 ) noted that TSIV significantly affected drivers’ visual search performance, with a negative correlation between TSIV and search velocity. According to the findings of Xie et al. ( 48 ), TSIV had a substantial influence on the cognitive effort of the driver but had no effect on driving performance. Liu and Deng ( 49 ) developed a model to investigate the connection between TSIV and a driver’s visual recognition, and they came to the conclusion that the more information that was transmitted by traffic signs, the more cognitive effort was required for drivers to absorb that information. When the TSIV was more than 642 bits, there was an excess of information. To assure the driver’s safety and comfort, Han et al. ( 23 ) examined the participant’s visual characteristics at varying driving speeds and TSIV levels, and found that the driver’s fixation duration, saccade duration, and saccade amplitude were most responsive to the change in TSIV. Using simulated driving tests and questionnaires, Xu et al. ( 50 ) assessed the information threshold of graphical VMS and discovered that the number of roads displayed on the VMS negatively affected drivers’ legibility speed, legibility time, and subjective scores, with a significant drop in accuracy when the VMS displayed six road numbers. Yang et al. ( 51 ) obtained eye movements and driving behavior data in scenarios with monolingual and bilingual guide signs using a driving simulator and eye tracker, found that the performance of participants worsened with increasing number of place names, and identified a maximum number of five place names for bilingual guide signs on the highway. The strain on drivers’ visual memory may be raised by an excessive amount of information on traffic signs, as noted by Du et al. ( 12 ), which in turn can increase response time and decrease accuracy.
Many attempts have been made so far to examine the influence that traffic signs and the information volume they contain have on the performance of drivers and the safety of road traffic in general. However, the issue of TSIV at highway tunnel entrance zones has not attracted enough attention. There is little known about how TSIV at highway tunnel entrance zone affects drivers’ visual characteristics and driving safety. This indicates that it is urgent to evaluate the safety effect of TSIV at the highway tunnel entrance zone. This specific gap in the previously conducted research is addressed directly by the present research. The following are the primary goals of this research: (i) to analyze the influence of TSIV at the highway tunnel entrance zone on the visual characteristics of drivers; (ii) to evaluate the relationship between TSIV at the highway tunnel entrance zone and the visual workload of drivers; (iii) to propose the TSIV with the best safety performance at the highway tunnel entrance zone. The results of this study could provide a point of reference for the adjustment of relevant standards as well as the appropriate positioning of traffic signs at the entrance zone of a highway tunnel if they are taken into consideration.
Methodology
Quantification of TSIV
The present study assumes that traffic signs with different information volume will bring different information workload to drivers; as a result, the information given by traffic signs must first be quantified.
In 1948, Shannon introduced the idea of information theory and established the term “information entropy,” proving that the entropy is equivalent to the degree of uncertainty of the information content ( 52 ). Information theory is based on probability theory and states that the likelihood of any information element appearing in a thing is proportional to its information volume. Information theory was developed to explain why this is the case ( 53 ). According to Shannon’s information theory, the calculation formula of TSIV is:

where H(X) is the information volume of X traffic sign (bits). Xi represents the information element, i, in traffic sign X. m is the number of types of information elements in a traffic sign. P(Xi) is the probability of occurrence of an information element.
Assuming that each type of information element in traffic signs will appear and appear with the same probability, then P(Xi) = 1/m, and the method for calculating the information volume of each information element in traffic signs is simplified as:

There are seven primary categories for traffic sign information elements based on the requirements of the Chinese national standard “Road Traffic Signs and Markings” ( 54 ). Besides the standard Chinese characters, there are also 26 English characters, 10 Arabic numbers, six geometric figures, 11 colors, 30 pointing symbols, and 50 graphic symbols.
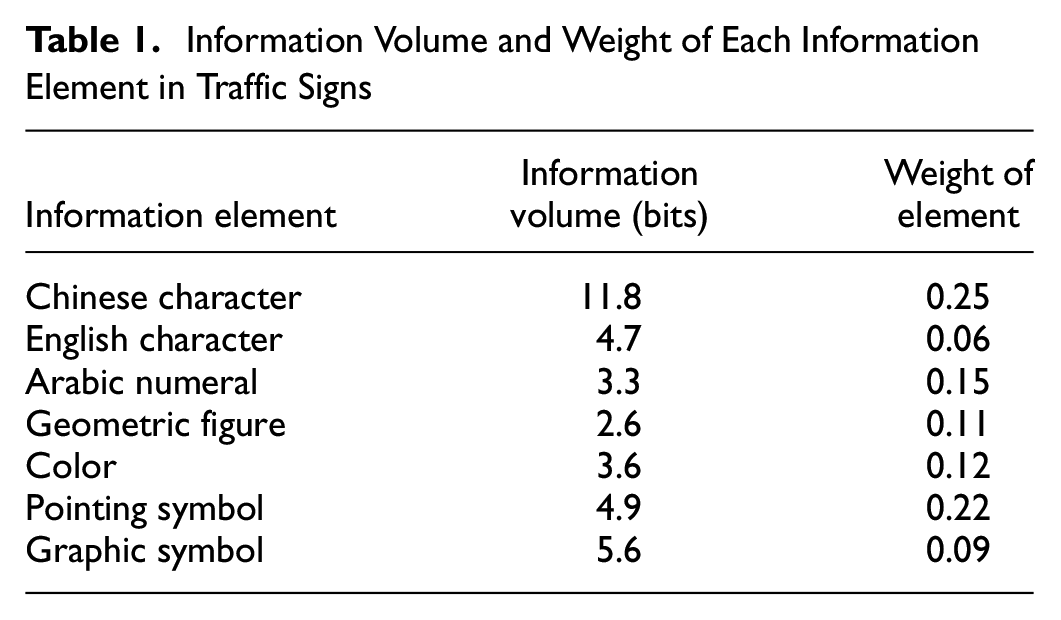
It is vital to establish the importance of each information element since the many elements include a variety of information that drivers perceive in a variety of ways depending on the element used. The analytic hierarchy process was used to determine the importance of different information elements included in traffic signs in accordance with the drivers’ own individual assessments of their significance. The present study also adopts the same method to finally determine the weight of seven types of information elements in traffic signs ( 23 ). Table 1 displays the information volume and weight of each information element.
Information Volume and Weight of Each Information Element in Traffic Signs
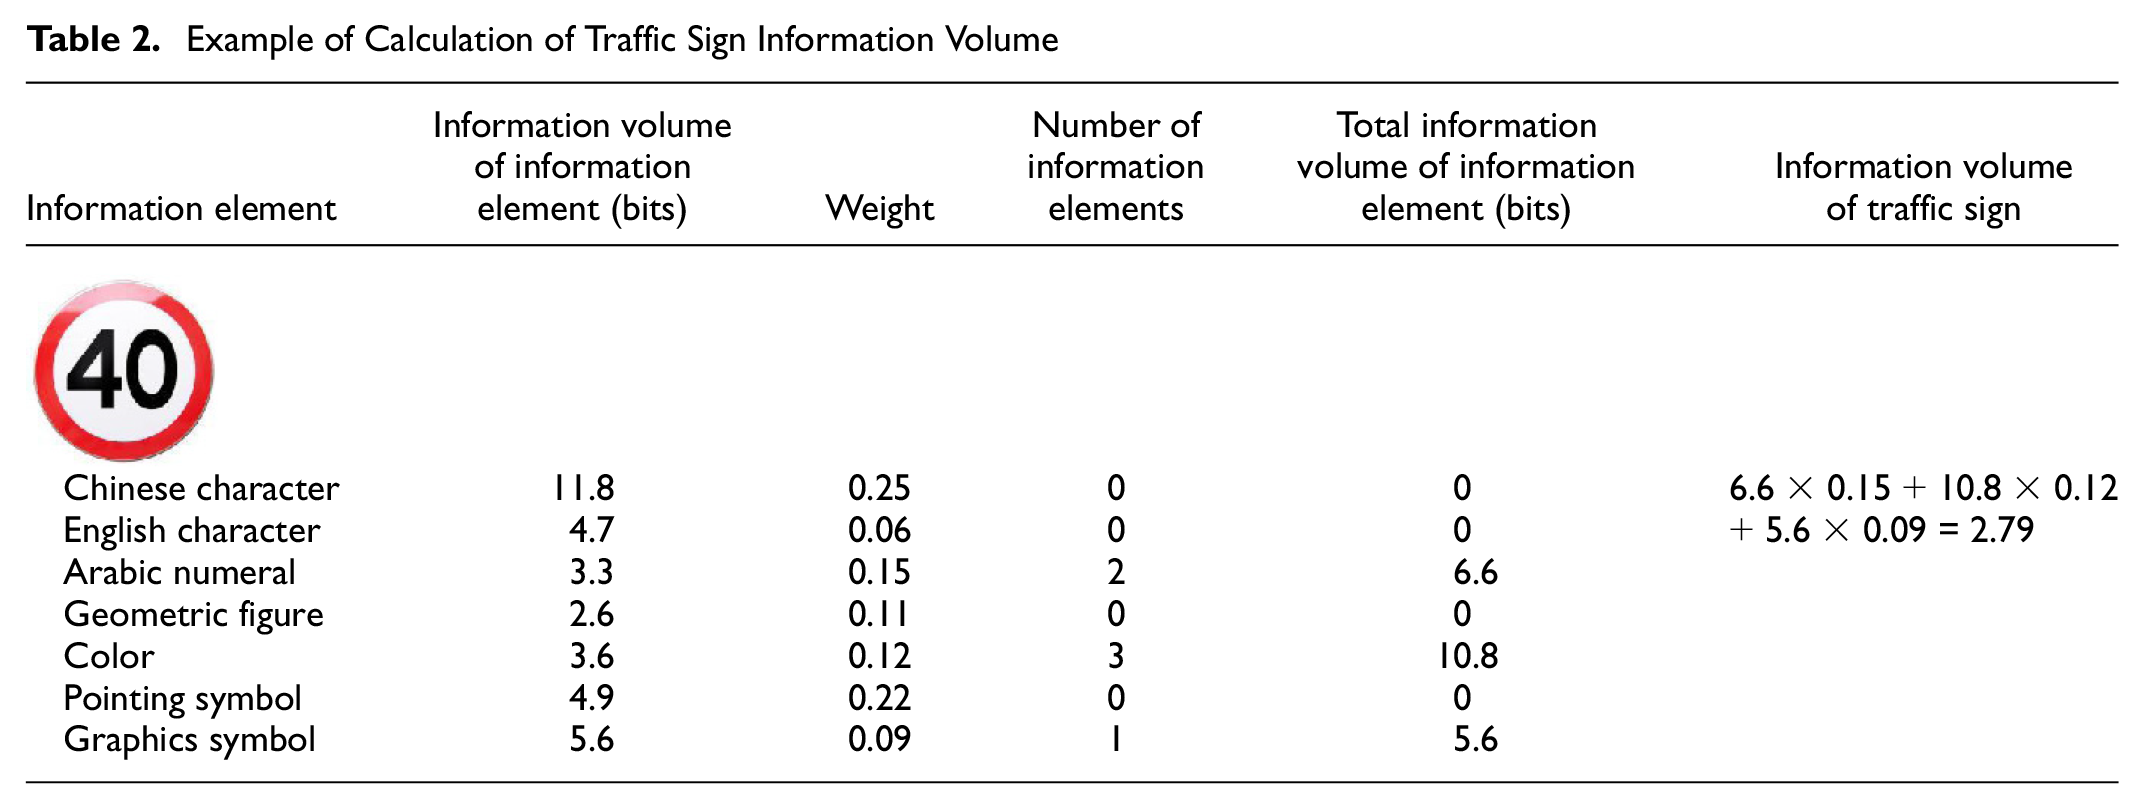
Equation 3 may be employed to calculate the TSIV.

where Wi is the weight of information element i. H(Xi) is the information volume of the information element i. Ni is number of information element i.
An example of calculation TSIV is shown in Table 2.
Example of Calculation of Traffic Sign Information Volume
Test Tunnels
The entrance zone of a highway tunnel presents a distinctive visual environment, and it is important to precisely and reliably assess the impact of TSIV on drivers’ visual characteristics in that environment. In this study, we conducted real vehicle driving field tests at six highway tunnels in Yunnan Province, China. These experimental tunnels are single-hole, two-way, two-lane tunnels with straight roads approaching the tunnel entrance and a speed limit of 40 km/h.
We selected highway tunnels with similar entrance environments, such as similar tunnel portal, similar road alignment, roadside landscape conditions, and road surface conditions, to control for potential variations in the entrance environment. In addition, we chose to conduct the experiment at the same time period of the day; specifically we conducted the experiment during off-peak hours to minimize variations in traffic flow and congestion that could affect visual workload. In practice, no other driving vehicles interfered with our experiment. We conducted the experiment during similar weather conditions to minimize variations in weather-related factors that could affect visual workload. Through these measures, the influence of variable environmental conditions on the test results was greatly reduced, and the accuracy and reliability of the test results were improved.
According to the Chinese industrial standard “Specifications for Design of Highway Tunnels Section 2 Traffic Engineering and Affiliated Facilities” ( 25 ), all kinds of prohibition signs, warning signs, and guide signs of highway tunnel are set within 250 m before the tunnel entrance, so the data on eye movement within this range was selected as the data source in this study.
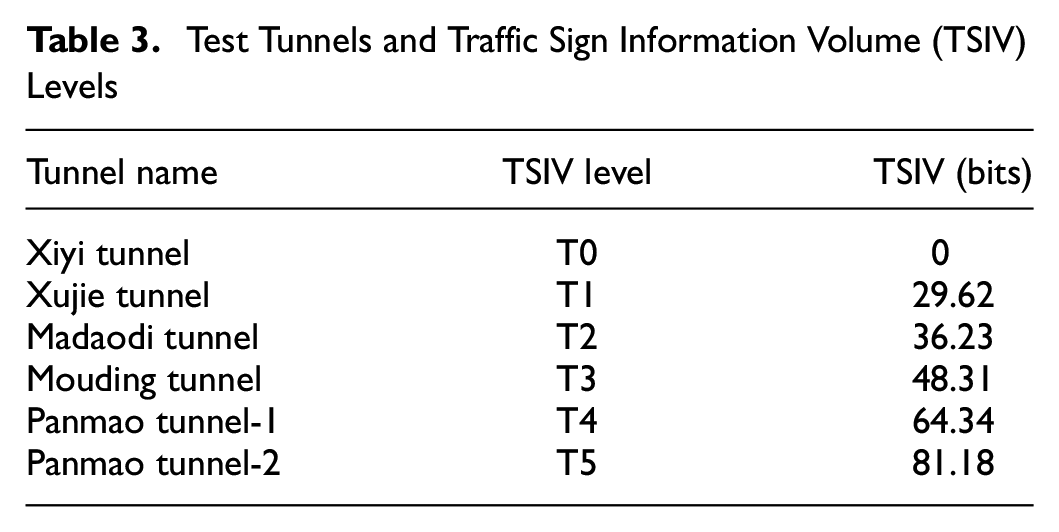
According to the method for quantification of TSIV described above, the traffic sign information in the entrance zones of the six test tunnels was quantified, and six levels of TSIV were finally determined. The name and TSIV level of each test tunnel are shown in Table 3, and some scenarios of the test tunnels are shown in Figure 1.
Test Tunnels and Traffic Sign Information Volume (TSIV) Levels
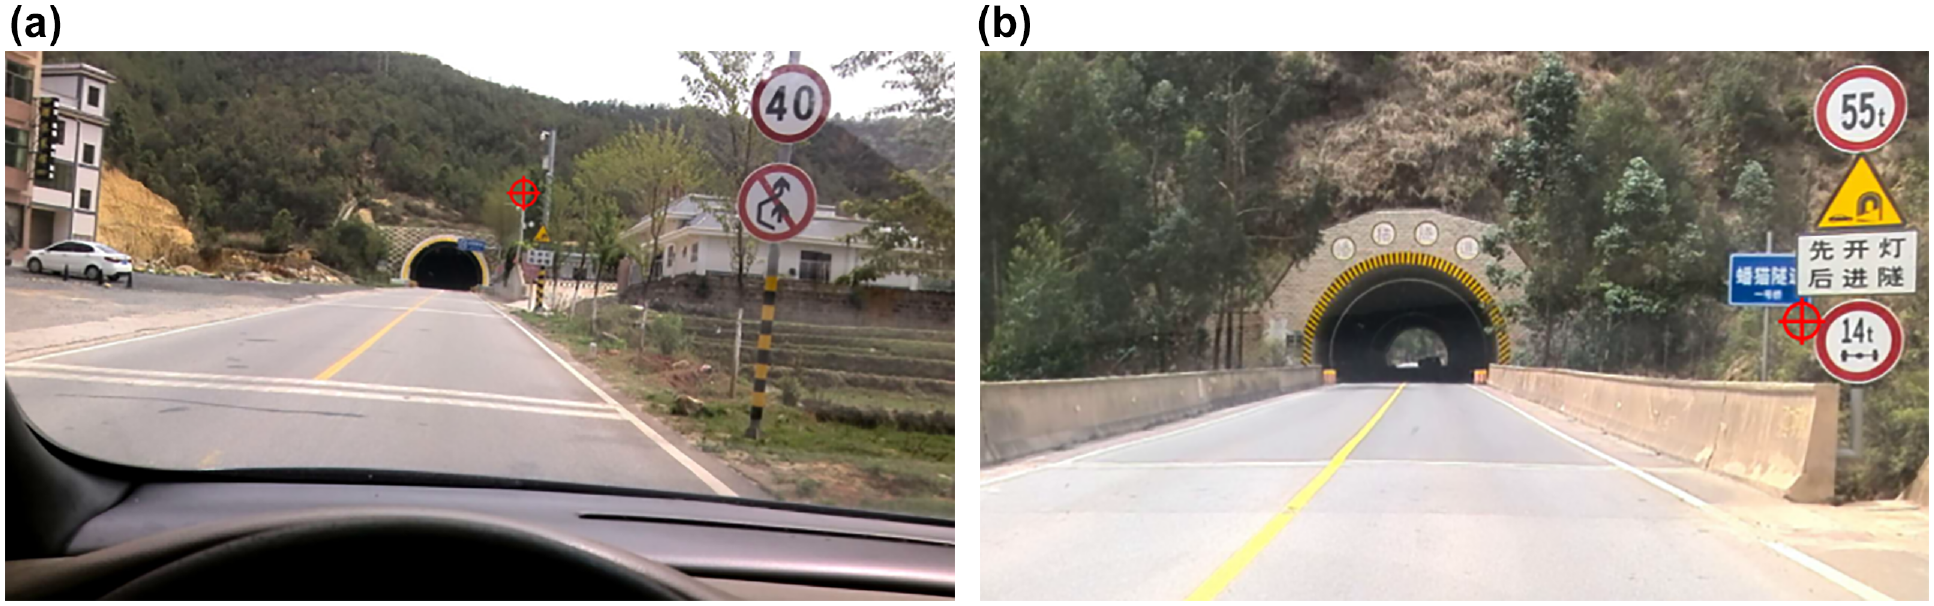
Sample images of two of the test tunnels: (a) Xujie tunnel and (b) Panmao-1 tunnel.
Participants
Forty participants were recruited for this study to participate in the experiment. Based on the gender ratio of drivers in the population of China, the participants included 28 male drivers and 12 female drivers. The participants had a mean age of 27.65 years (standard deviation = 2.75). Each participant was an expert driver who had never been in a serious crash and practiced safe driving behaviors. No one who took part in the study suffered from any kind of sleep issue, illness, or other physical or physiological impairment (self-reported). There were no cases of color blindness among the participants, and all claimed to have normal or corrected visual acuity. In addition, all participants were asked to ensure they had adequate sleep, and avoided alcohol, caffeine, and medication intake during the 24 h before testing, and they avoided strenuous exercise before participating in the experiment. The participants gave their informed agreement to have information collected on their eye movements before beginning the experiment. Meanwhile, the relevant ethical guidelines were observed in all other respects. The scenario of a participant during the experiment is shown in Figure 2.
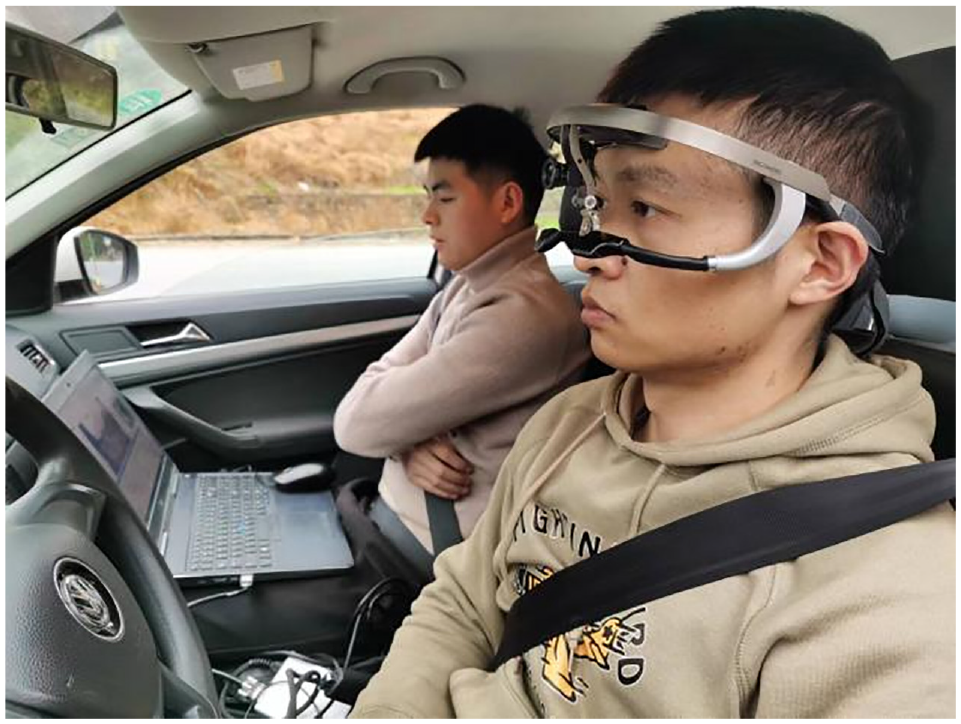
A participant and eye-tracking device used during the experiment.
Apparatus
According to a survey on the types of vehicles that used the experimental tunnels, 90% of them were passenger cars, so the Buick GL8 was chosen as the car driven by the participants in this experiment. Data on the driver’s eye movements were gathered with the use of a device called Dikablis Professional eye-tracking device produced by ERG-ONEERS, Germany. The eye-tracking device is accurate to within 0.05 degrees, with an acquisition frequency of 60 Hz. The driver’s fixation, saccade, and eye blink movements were recorded and collected in real time using D-Lab 3.51 software on the laptop computer attached to the eye-tracking device. In addition, the software is used for the subsequent extraction and analysis of the data pertaining to the participant’s eye movements. The eye-tracking device used during the experiment is shown in Figure 2.
Procedure
Each participant received instructions about the experiment and practiced adaptive driving with the eye-tracking device before beginning the experiment. First, the researcher explained the objective of the research to the participants, the device functions and instructions for use, and other related considerations. All participants were then asked to complete an adaptive driving process. Within the framework of adaptive driving, each participant was given at least 10 min of unrestricted driving time while on the road, except for the experimental tunnel zone, until they confirmed that wearing the eye-tracking device would not interfere with their normal driving and operation. Participants’ eye movement data were not measured during the adaptive driving process.
Before the start of the formal experiment, the eye-tracking device was positioned in a manner that was comfortable for the participants, and they were given instructions, and a laptop computer dedicated to the experiment was connected to the eye-tracking device. The eye-tracking device was then calibrated online. It needed to be calibrated using the four-point calibration method to record eye movement data accurately. After confirming that the equipment connection and data recording were normal, participants were introduced to the driving route of the experimental tunnel zone. Once participants confirmed that they had understood the driving route and precautions, the formal experiment began. It was required of each participant that they drive through the tunnel entrance zone for each of six levels of TSIV in accordance with their usual driving habits and obeying the relevant traffic rules.
Finally, according to the eye movement data and eye movement videos recorded and saved in the eye-tracking device, the valid experimental data of six levels of TSIV were extracted, and then these data were analyzed and the results are discussed in this paper.
Statistical Analysis
The independent variable of this study is the TSIV in the entrance zones of highway tunnels: T0 (0 bits), T1 (29.62 bits), T2 (36.23 bits), T3 (48.31 bits), T4 (64.34 bits), and T5 (81.18 bits). The dependent variable is a changing characteristic of the visual characteristics when drivers recognize different levels of TSIV. Data analysis was conducted using IBM SPSS Statistics 20.0, employing one-way ANOVA to assess the differences in drivers’ fixation duration, saccade duration, and saccade amplitude among different levels of TSIV. The normality assumption of the data was validated using the Kolmogorov-Smirnov test, and the Pauta criterion was used to eliminate outliers. All statistical tests were conducted at the 99% and 95% significance levels to reduce the risk of type I errors (false positives), given the relatively small sample size in this study. The least significant difference test was used for post-hoc testing. In addition, principal component analysis (PCA) was used to reduce the dimensionality of the indicators, resulting in a new indicator to evaluate the visual workload intensity of drivers.
Coefficient of Variation
Coefficient of variation (CV) is a statistic that measures the degree of variation of each observed value in variables. CV can eliminate the influence of different units and means on the comparison of the degree of variation of each variable ( 55 ). If the CV is lower, then the degree of variation or deviation will also be smaller, which means that the risk will also be relatively low. On the other hand, the higher the CV, the greater the degree of variation or departure, and the higher the danger. CV is widely used in the research field of human factors in driving, and it is used in representing the degree of variation in driving speed ( 56 ) and visual behavior ( 57 ). The variation of eye movements reflects the adaptability and comfort of drivers in a driving environment ( 58 ). In this paper, CV is used to analyze the degree of drivers’ visual coordination under different TSIV conditions.
The CV was calculated as:

where CV is the coefficient of variation of eye movement indicators; SD is the standard deviation of eye movement indicators; M is the mean value of eye movement indicators.
Sample Entropy (SampEn)
Sample entropy (SampEn) is a nonlinear kinetic parameter that evaluates the complexity of time series by gauging the size of the likelihood of producing new patterns in the signal. The larger the chance of generating new patterns, the more complicated the sequence ( 59 ).
When compared with approximation entropy, SampEn has two advantages: the computation of SampEn does not rely on the data length, and the SampEn has superior consistency. Both of these advantages are compared with the approximate entropy ( 60 ). The greater the sequence self-similarity, the lower the SampEn value should be; conversely, the higher the SampEn value, the more complex the sample sequence should become. Currently SampEn has been applied to assess the complexity of physiological time series (EEG, sEMG, etc.) ( 61 – 63 ).
In general, for a time series consisting of N data:

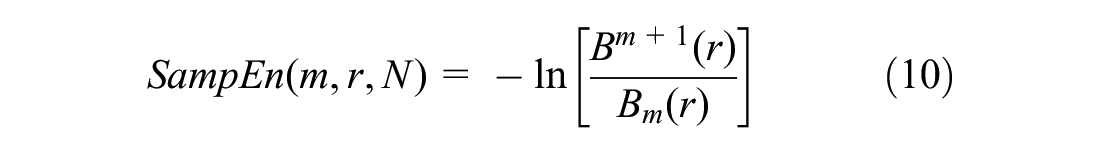
the SampEn is calculated as follows:
Form a sequence of vectors of dimension m by serial number:

where
2. Define the distance between the vectors Xm(a) and Xm(b):
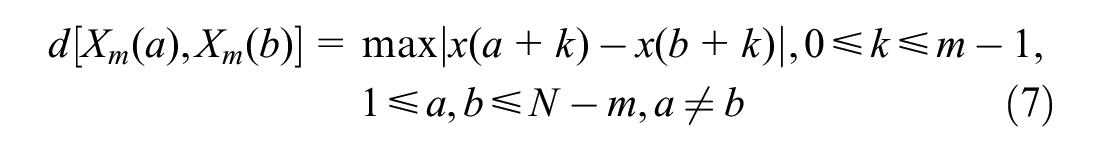
3. For a given Xm(a), count the number of distances between Xm(a) and Xm(b) that are less than or equal to a given threshold r, denoted as N(a), and calculate its ratio to the total number of distances:

where r takes the value of
Calculate its average value for all i:

4. Add 1 to the embedding dimension and repeat the above formula steps for the m+1 dimensional vector to obtain
Results
This section investigates the influence of TSIV at the entrance zone of a highway tunnel on drivers’ fixation duration, saccade duration, and saccade amplitude. To discuss the influence of TSIV on drivers’ visual behavior and driving safety in detail and deeply, we will compare and discuss the effects of different levels of TSIV on drivers’ visual stability, visual coordination ability, and visual workload.
Analysis of Fixation Duration
Fixation duration is a parameter representing the temporal characteristics of fixation behavior. It indicates the time spent by the driver paying attention to and processing relevant information during driving, indicating the period of time it takes for the driver to comprehend potentially hazardous information or the level of effort involved in obtaining useful information ( 64 , 65 ). It is also a measure of the driver’s strategy for processing information content in the visual field and for their own subjective information processing strategy. In most cases, the amount of information present in the visual field and the level of effort involved in processing information have a direct impact on the duration of time spent in fixation ( 66 , 67 ).
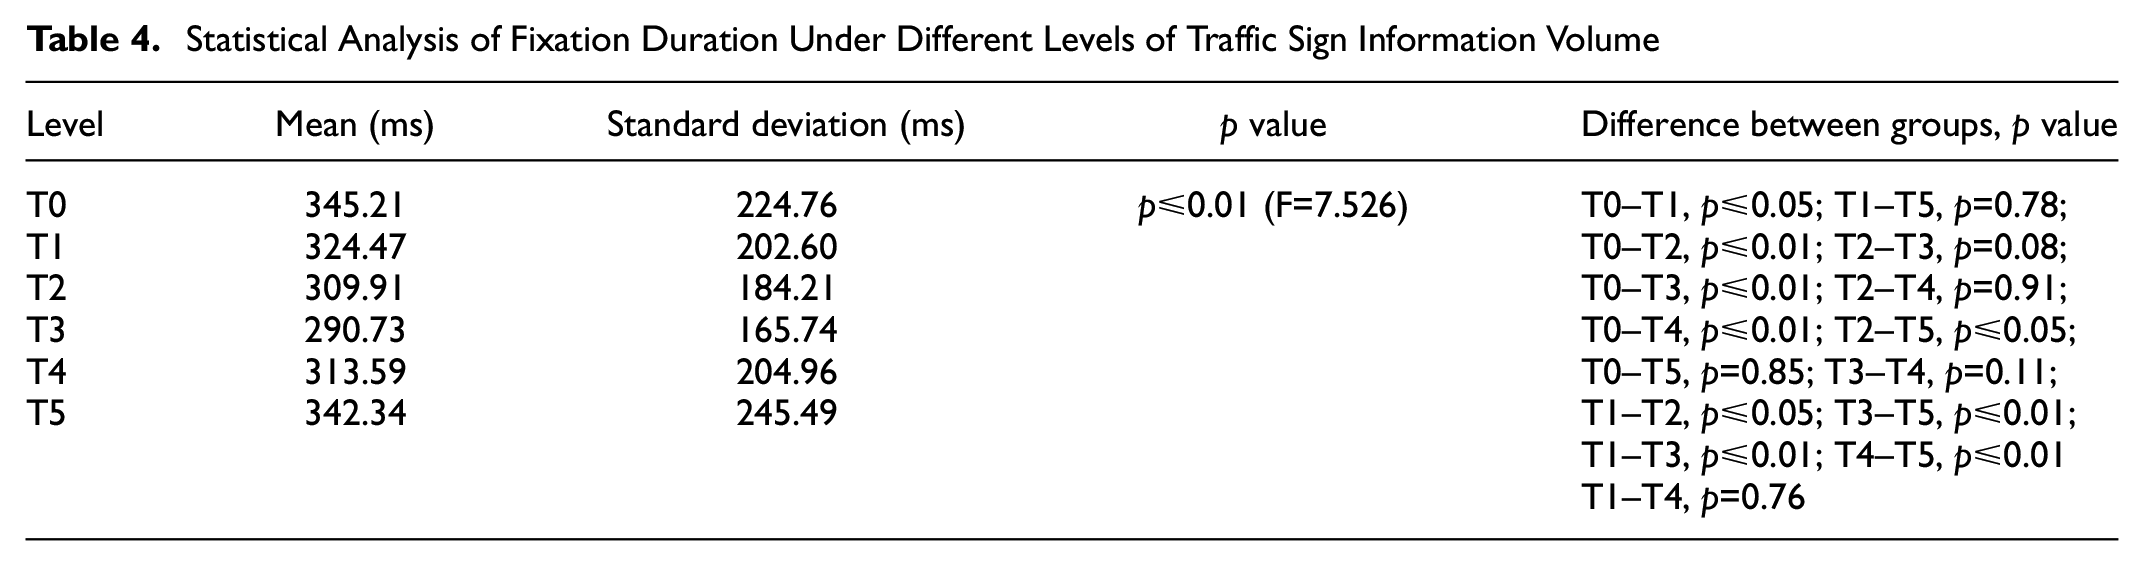
Statistical characteristics and changing trends of drivers’ fixation duration under different levels of TSIV are respectively shown in Table 4 and Figure 3. This study choses 99% significance level to reduce the risk of type I errors (false positives), given the relatively small sample size in this study.
Statistical Analysis of Fixation Duration Under Different Levels of Traffic Sign Information Volume
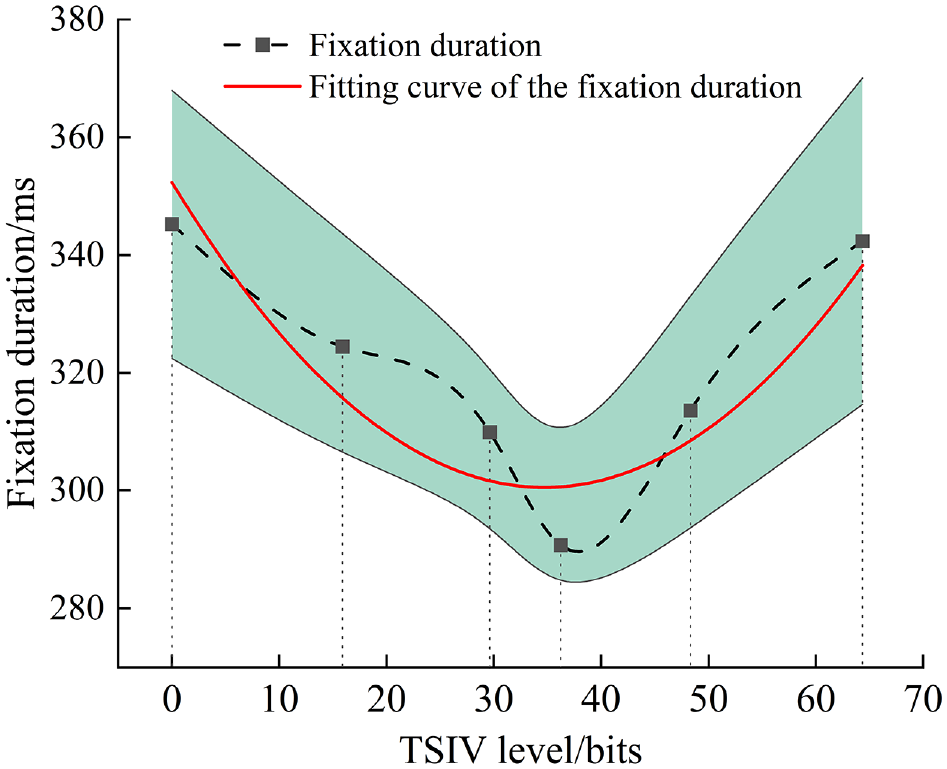
Changing trend and fitting curve of fixation duration.
It can be seen from Table 4 that the mean and standard deviation (SD) of drivers’ fixation duration under different levels of TSIV showed a significant fluctuation change, where the average fixation duration was the shortest at T3 level, at 290.73 ms, and the longest at T0 level, at 345.21 ms, and the difference between them was 54.48 ms. The SD of fixation duration also showed the same pattern of performance, with the smallest SD at the T3 level, indicating that the performance of fixation duration was more stable at this level than at the other levels.
Meanwhile, the results of the one-way ANOVA showed that drivers’ fixation duration was statistically significantly different (p ≤ 0.01) at the different levels of TSIV, and it could also be observed that multiple group pairs among the six levels of TSIV exhibited significant group differences, suggesting that fixation duration was significantly affected by the shift in TSIV that occurred at the tunnel entrance zone.
As the change trend shows in Figure 3, with increase in TSIV, the drivers’ fixation time exhibited a decreasing and then increasing change pattern, and the data distribution showed a change trend from scattered to concentrated and then gradually scattered. Drivers showed relatively longer fixation duration with no traffic sign information and with too much, while they showed the shortest average fixation duration with a more concentrated distribution at the T3 level of TSIV. This indicates that, with the T3 level, drivers had better perception and access to road traffic environment information and were able to process the target information efficiently, and this condition made it possible for drivers to drive more safely.
A nonlinear fit was made to the average fixation duration of drivers at each level of TSIV. The fitting curve is shown in Figure 3, and the results of the fitting analysis are shown in Table 5. The drivers’ average fixation duration and TSIV were found to have a distribution of quadratic function, according to the data, and the quadratic fitting equation was:

The adjusted R2 was 0.79, indicating that the fit was very good. This fitted equation allows us to calculate the performance of drivers’ fixation duration under other levels of TSIV.
Results of Fitting Analysis of Fixation Duration Under Different Levels of Traffic Sign Information Volume
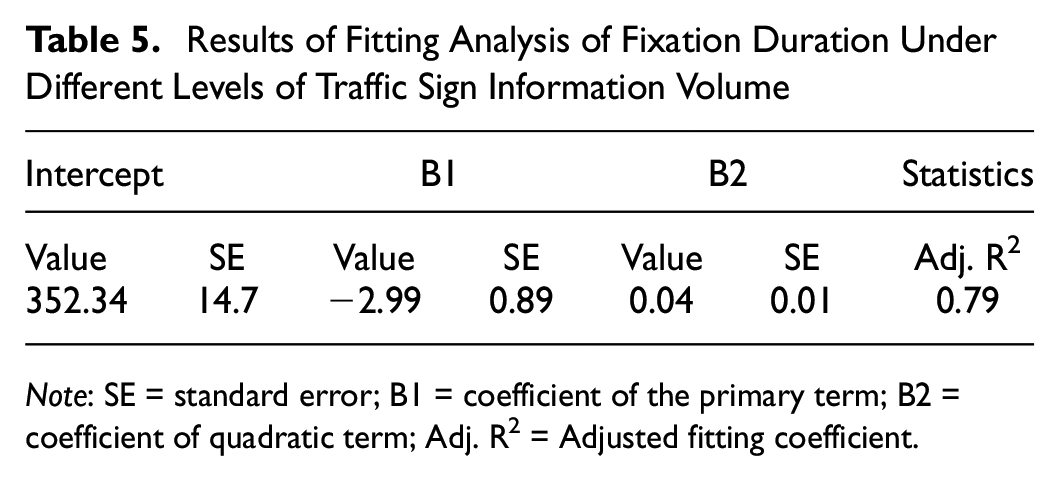
Note: SE = standard error; B1 = coefficient of the primary term; B2 = coefficient of quadratic term; Adj. R2 = Adjusted fitting coefficient.
Analysis of Saccade Duration
During the driving process, the saccade duration shows the time spent looking for information that should be sought for through the process of visual search, which can effectively measure the efficiency of a driver’s search for the target information in the road traffic environment. If the information to be searched for and processed is simple, the corresponding saccade duration is shorter and the search is more efficient ( 68 ). Statistical characteristics and changing trend of drivers’ saccade duration under different levels of TSIV are respectively shown in Table 6 and Figure 4.
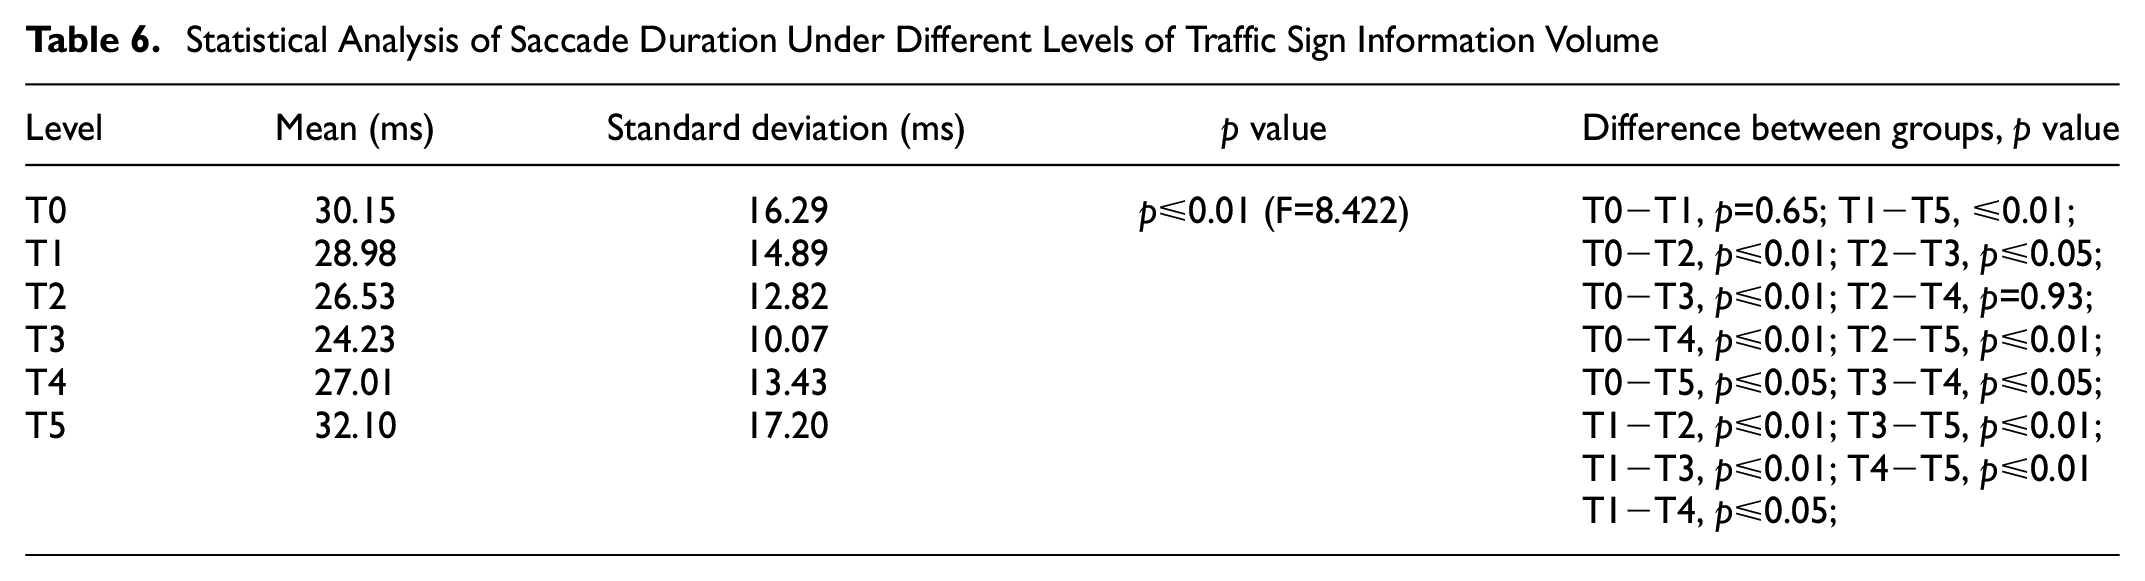
Statistical Analysis of Saccade Duration Under Different Levels of Traffic Sign Information Volume
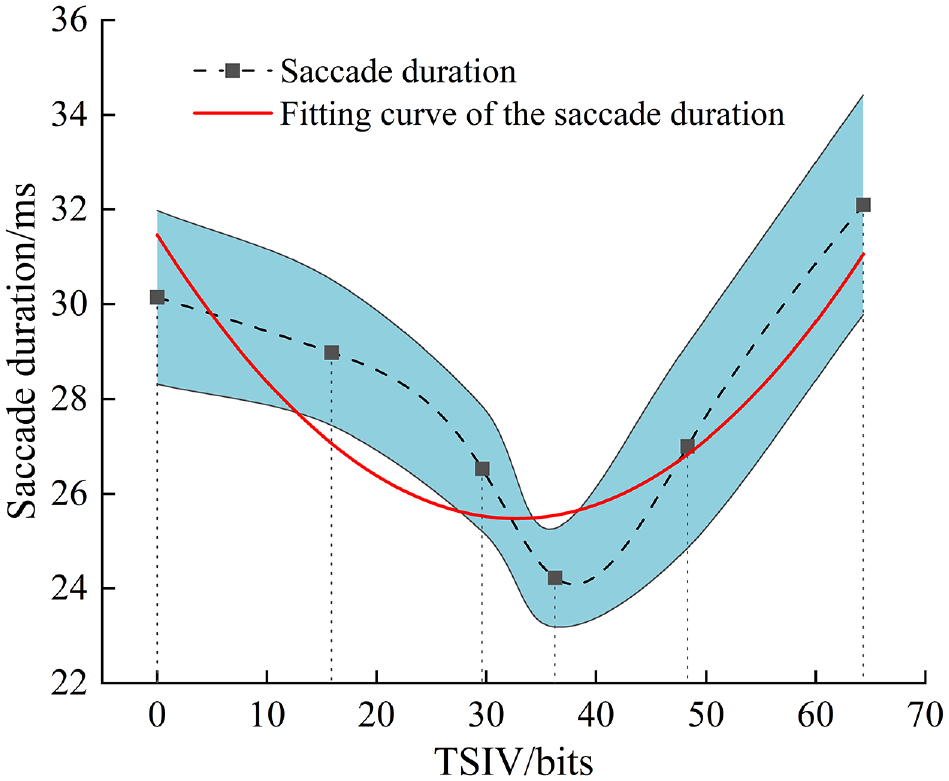
Changing trend and fitting curve of saccade duration.
It can be seen from Table 6 that the mean and SD of the drivers’ saccade duration under different levels of TSIV showed a significant fluctuation change. Saccade duration was shortest at T3 level, at 24.23 ms, and longest at T5 level, at 32.10 ms, and the difference between them was 7.87 ms. The SD of saccade duration also showed the same performance pattern, with the smallest SD under the T3 level, indicating that the performance of drivers’ saccade duration was more stable at T3 level compared with other levels of TSIV.
Meanwhile, the results of the one-way ANOVA showed that drivers’ saccade duration had statistically significant differences (p ≤ 0.01) at different levels of TSIV, and it could also be observed that multiple group pairs among the six levels of TSIV exhibited significant group differences, indicating that the change in TSIV at the tunnel entrance zone had a significant effect on drivers’ saccade duration.
From the change trend shown in Figure 4, we can observe that when TSIV increased, the drivers’ saccade duration exhibited a changing trend that went from first reducing then to rising. This was a tendency that changed with the TSIV, and the data distribution showed a trend from decentralized to concentrated and then gradually decentralized. Drivers showed relatively longer saccade durations in both the condition with no traffic sign information and the condition with excessive TSIV, while they showed the shortest average saccade duration with a more concentrated distribution at the T3 level. This shows that at the T3 level, drivers were able to gain the information they needed more quickly, narrow their searches to relevant results, and make better informed decisions about how to handle the traffic situation. Moreover, the efficiency of searching for road traffic environment information was relatively high, which was conducive to ensuring driving safety.
A nonlinear model was used to fit the mean saccade duration of the drivers operating under the TSIV at each level. The fitting curve is depicted in Figure 4, and the results of the fitting analysis are provided in Table 7. The results show that the average saccade duration and TSIV showed a distribution of quadratic function, and the quadratic fitting equation was:
Results of the Fitting Analysis of Saccade Duration Under Different Levels of Traffic Sign Information Volume
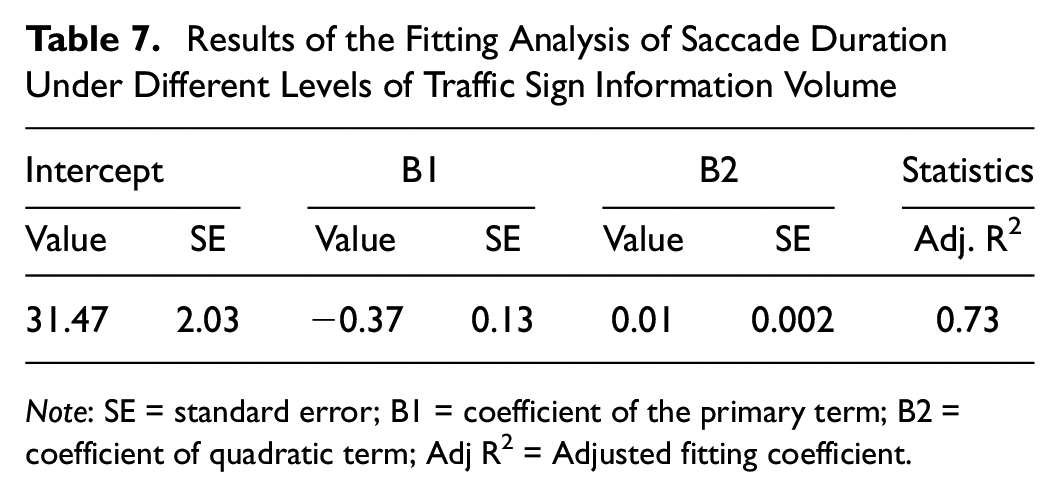
Note: SE = standard error; B1 = coefficient of the primary term; B2 = coefficient of quadratic term; Adj R2 = Adjusted fitting coefficient.

and the adjusted R2 was 0.73, indicating that the fit worked very well. This fitted equation allows the performance of drivers’ saccade duration under other levels of TSIV to be calculated.
Analysis of Saccade Amplitude
The amplitude of a driver’s saccades may be used successfully to assess the degree to which the driver is paying attention when seeking for information while driving. If the driver can effectively obtain and process enough target information during the previous fixation behavior, then the driver’s next fixation will span a large distance, that is, the saccade amplitude, to search for and obtain the information from other regions. As a consequence of this, having a saccade amplitude that is sufficiently large is advantageous for the driver in their capacity to anticipate and access information concerning the traffic situation that is all around them. This, in turn, eliminates or significantly reduces the driver’s experience of strain ( 69 , 70 ).
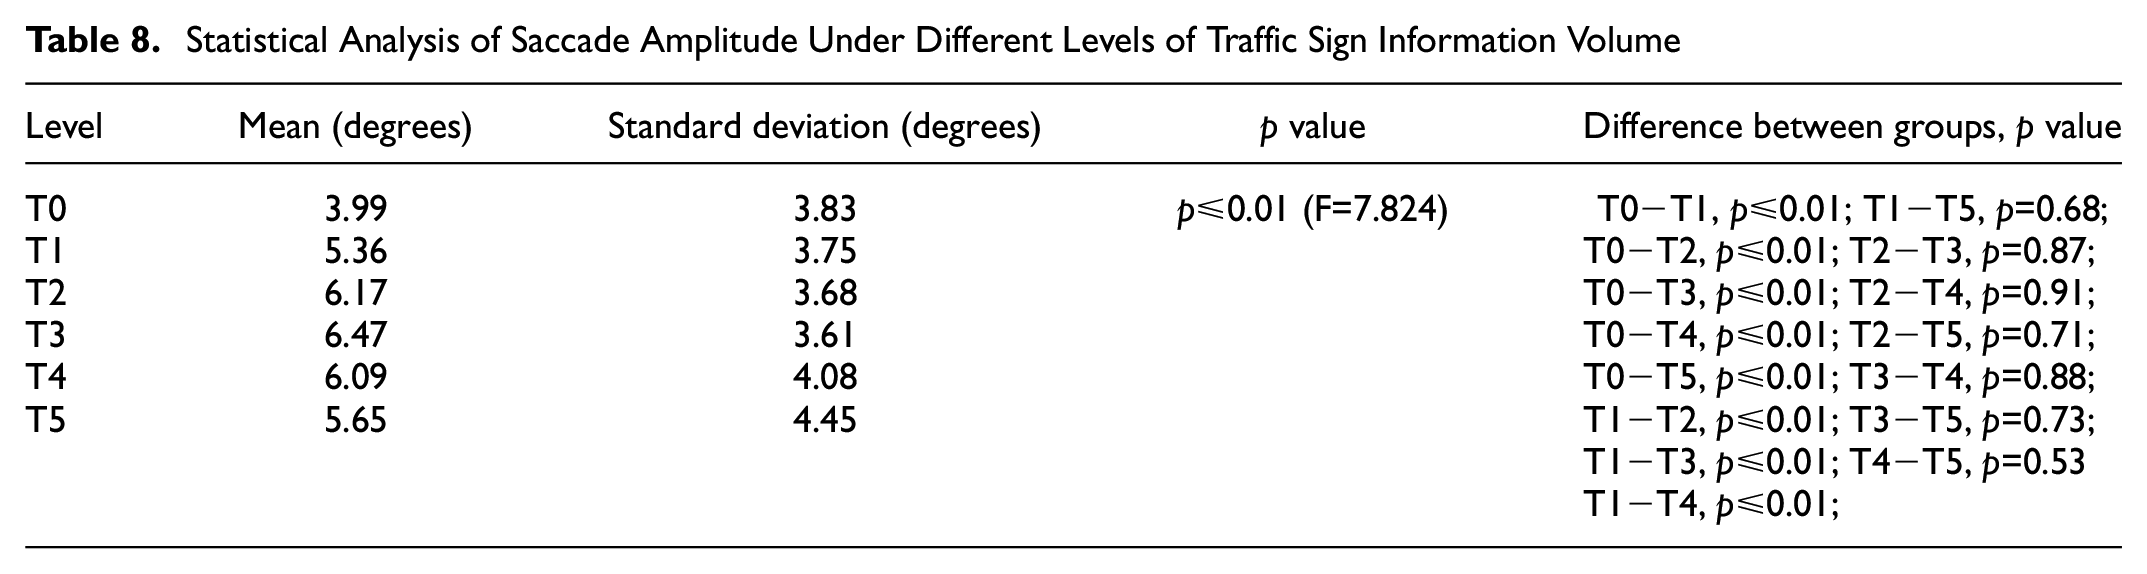
Statistical characteristics and changing trends of drivers’ saccade amplitude under different levels of TSIV are respectively shown in Table 8 and Figure 5.
Statistical Analysis of Saccade Amplitude Under Different Levels of Traffic Sign Information Volume
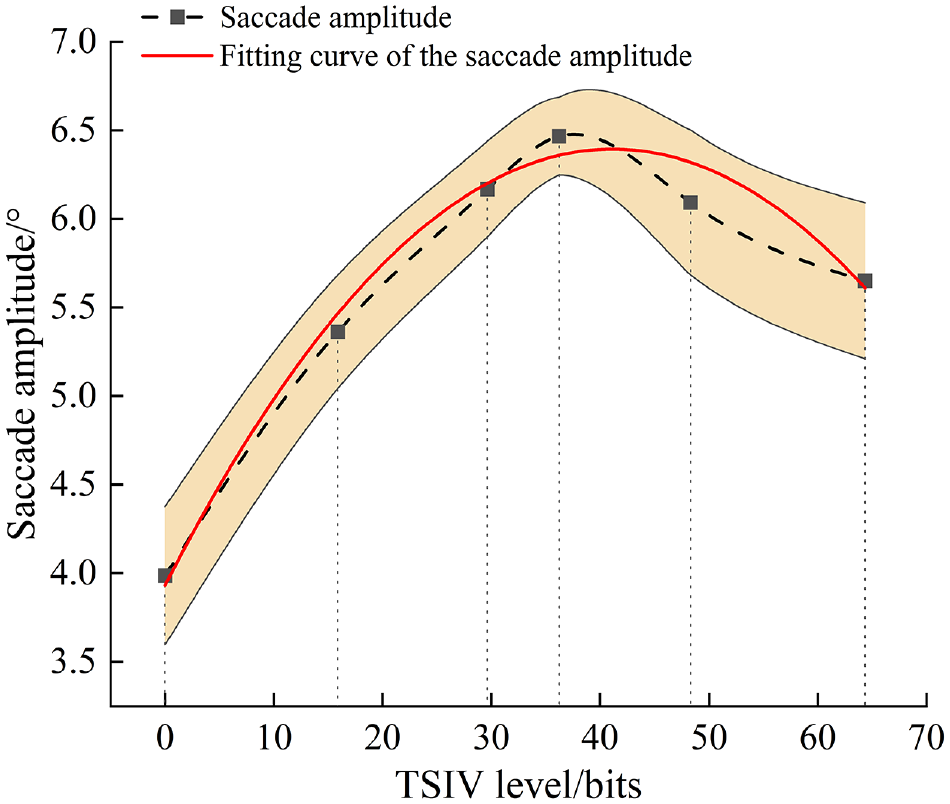
Changing trend and fitting curve of saccade amplitude.
Table 8 makes it clear that the mean and SD of the drivers’ saccade amplitude showed significant fluctuations under different levels of TSIV, where the mean saccade amplitude was the largest at 6.47° at the T3 level and the smallest at 3.99° at the T0 level, with a difference of 2.48° between them. Meanwhile, the SD of saccade amplitude was the minimum at the T3 level, indicating that the drivers’ saccade amplitude performance was more stable at T3 compared with other levels of TSIV.
Meanwhile, the results of one-way ANOVA showed that the drivers’ saccade amplitude had statistically significant differences (p ≤ 0.01) at different levels of TSIV, and it could also be observed that multiple pairs of TSIV among six levels exhibited significant group differences, which indicates that the change in TSIV at the tunnel entrance zone had a significant effect on drivers’ saccade amplitude.
Figure 5 represents a change trend that demonstrates that, as the TSIV increased, the drivers’ saccade amplitude demonstrated a change trend that was initially growing and then dropping. Drivers showed a relatively small saccade amplitude in both the condition with no traffic sign information and the condition with excessive TSIV, while drivers showed the largest average saccade amplitude under the T3 level, with a relatively concentrated distribution. This reflects that, in the cases of insufficient and excessive TSIV, during the visual search, drivers were only able to obtain limited information from each fixation, which led to a small subsequent saccade amplitude. Additionally, it was more difficult for drivers to extract the information from each fixation, which also contributed to the smaller saccade amplitude. Drivers had better access to information about the traffic situation under the T3 level of TSIV; they were better able to see and understand the traffic conditions around them. This, in turn, made drivers feel less anxious and increased the overall safety of driving.
A nonlinear fit was made to the average saccade amplitude of drivers at each level of TSIV. The fitted curve is shown in Figure 5 and the results of the fitting analysis are shown in Table 9. The results show that the drivers’ average saccade amplitude and TSIV showed a distribution of quadratic function, and the quadratic fitting equation was:

and the adjusted R2 was 0.97, showing that the fitting effect was extremely good. The performance of the drivers’ saccade amplitude at other levels of TSIV can be calculated by this fitting equation.
Results of the Fitting Analysis of Saccade Amplitude Under Different Levels of Traffic Sign Information Volume
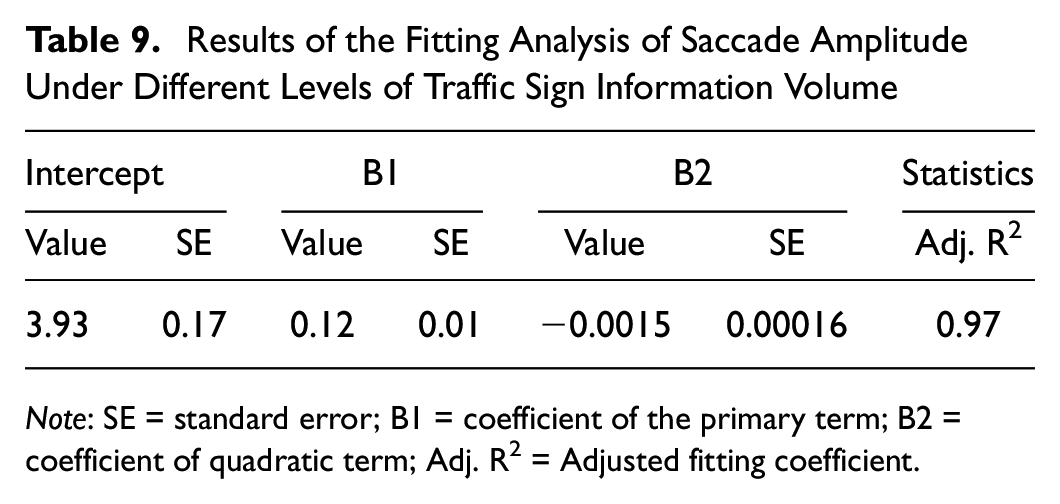
Note: SE = standard error; B1 = coefficient of the primary term; B2 = coefficient of quadratic term; Adj. R2 = Adjusted fitting coefficient.
Comparison of Visual Stability
The CVs of the eye movement indicators under different TSIV levels were calculated, and the comparison results are shown in Figure 6.
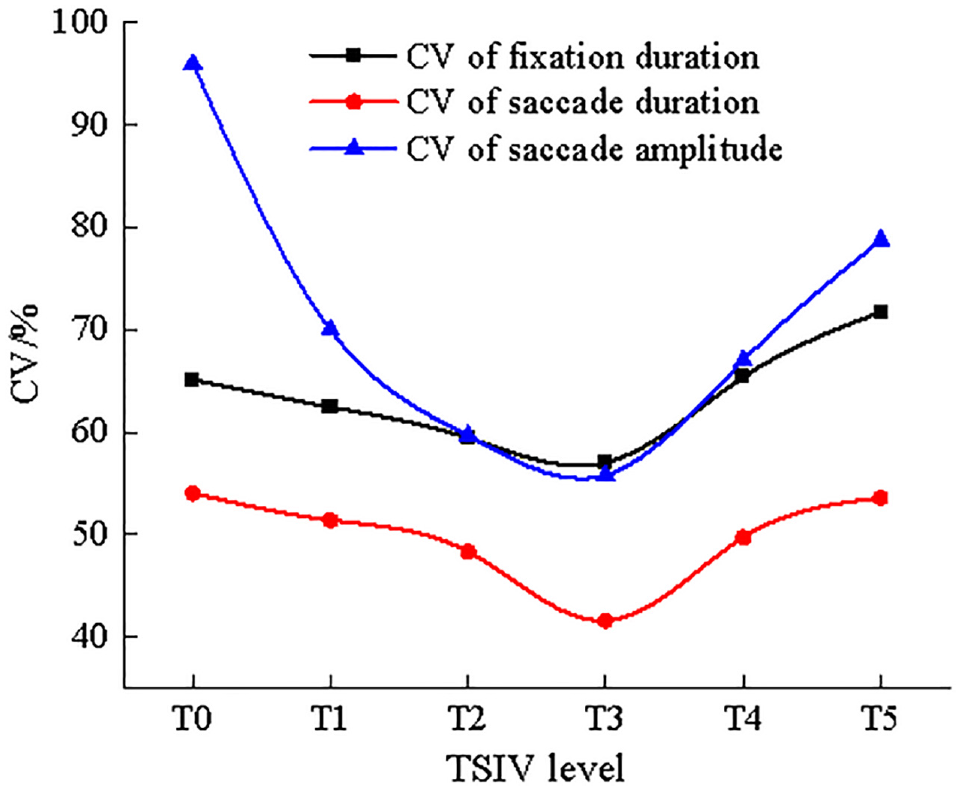
Comparison of the coefficient of variation of each eye movement indicator under different levels of traffic sign information volume.
The comparison of CV eye movement indicators under different levels of TSIV showed significant differences, and the change of TSIV caused the fluctuation difference of drivers’ visual performance. With the increase of TSIV, the CV of the three eye movement indicators decreased at first and then increased. The CV values were the lowest at level T3, which were 57.01%, 41.56% and 55.80% respectively. This indicates that the dispersion of eye movement indicators was the smallest and the visual performance coordination was the best under this TSIV level.
It should also be noted that the maximum difference in the CV for fixation duration, saccade duration, and saccade amplitude across different TSIV levels was 14.7%, 12.47%, and 40.19%, respectively. This suggests that the stability of duration for both the fixation and saccade were less affected by the TSIV changes, while the stability of the saccade amplitude was more susceptible to changes in the TSIV.
Comparison of Visual SampEn
According to the calculation method of SampEn, the fixation duration SampEn, saccade duration SampEn, and saccade amplitude SampEn of the drivers in the process of driving through the tunnel entrance zone were calculated respectively. The trends of the visual SampEn of drivers under different TSIV levels are shown in Figures 7 to 9.
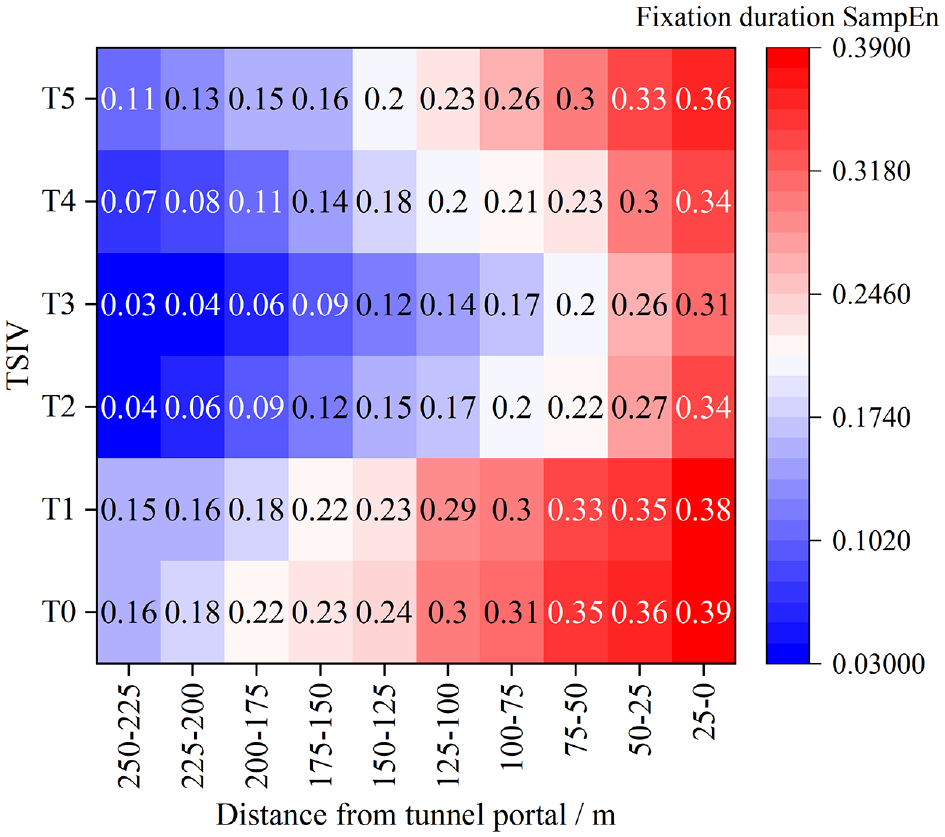
Changing trend of sample entropy of fixation duration at different levels of traffic sign information volume.
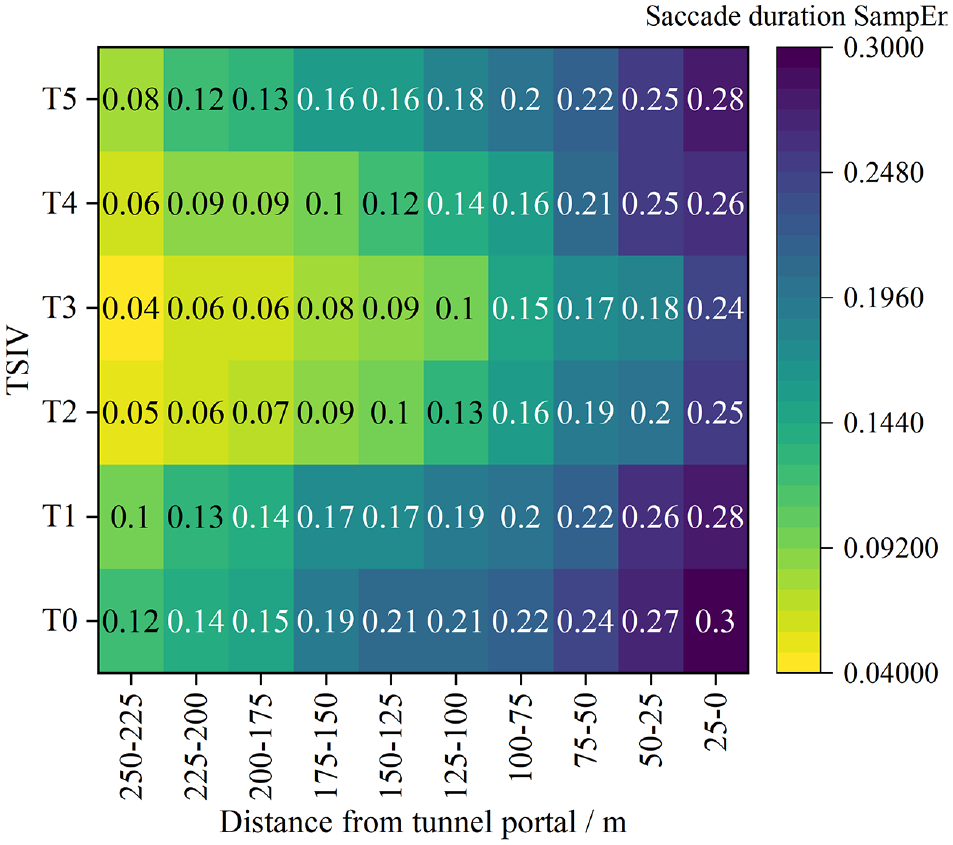
Changing trend of sample entropy of saccade duration at different levels of traffic sign information volume.
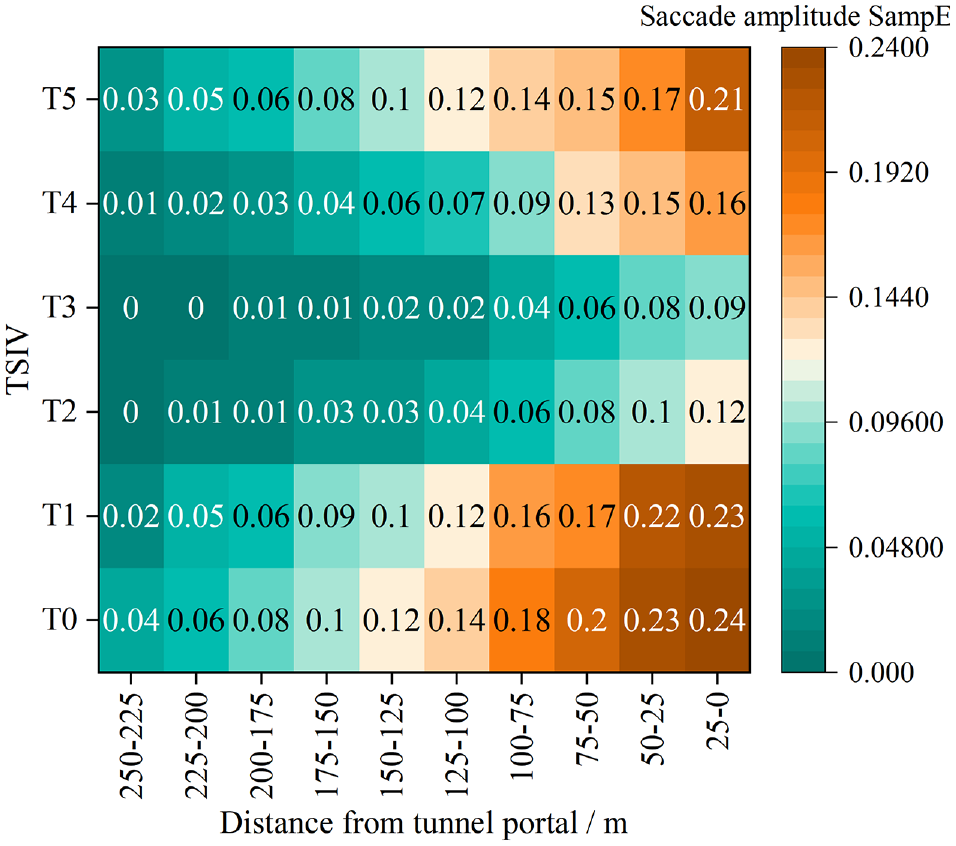
Changing trend of sample entropy of saccade amplitude at different levels of traffic sign information volume.
According to the comparison of the change of fixation duration SampEn, saccade duration SampEn, and saccade amplitude SampEn when driving through the tunnel entrance zone under different TSIV levels, the following results can be obtained:
The SampEn of fixation duration, saccade duration, and saccade amplitude of drivers all showed a trend of gradually increasing as the distance to the tunnel becomes closer. Moreover, the TSIV affected the amplitude and speed of the increase of visual SampEn. This indicates that the drivers’ visual performance became unstable in the process of approaching the tunnel gradually, which may be the visual search strategy for completing the driving task of entering the tunnel safely. Research has shown that drivers need to search and obtain enough information to ensure safe and comfortable entry into the tunnel ( 71 ).
The SampEn of fixation duration, saccade duration, and saccade amplitude of drivers began to increase at a greater rate about 125 m to 100 m from the tunnel portal, which was about the decision sight distance of drivers at the speed limit of 40 km/h. This indicates that the intensity of searching and obtaining the road environment information was increasing gradually within the decision sight distance from the tunnel portal, and the confusion degree of the visual search mode was also increasing gradually.
TSIV had a substantial impact on SampEn of drivers’ fixation duration, saccade duration, and saccade amplitude when driving through the tunnel entrance zone, and it was obvious that the visual SampEn was the minimum at T3 level. This demonstrates that the visual performance and searching patterns of drivers were severely influenced by TSIV. The drivers’ fixation and saccade behaviors were relatively stable in time series under T3 level, and the confusion degree of visual search patterns was the lowest. This stable and orderly visual search pattern is beneficial to the driving safety at the highway tunnel entrance zone.
Comparison of Visual Workload Intensity
According to the previous analysis results, a driver’s fixation duration, saccade duration, and saccade amplitude are significantly affected by TSIV, which can explain the effect of TSIV on the driver’s visual characteristics from a certain perspective. However, the eye movement indicators of drivers are inevitably related to some extent, which will directly lead to the accumulation and overlap of the information reflected by these indicators to a certain extent ( 23 ). These three eye movement indicators were downscaled in this study using PCA, with the goal of obtaining a complete indicator that might more accurately indicate the effects of TSIV on the driver’s visual workload, which was characterized as visual workload intensity.
Standardization was performed on the data consisting of the three eye movement indicators, and then the correlation matrix and test results were calculated for the standardized data. Table 10 presents the correlation matrix involving the indicators for the observation.
Correlation Matrix of Eye Movement Indicators
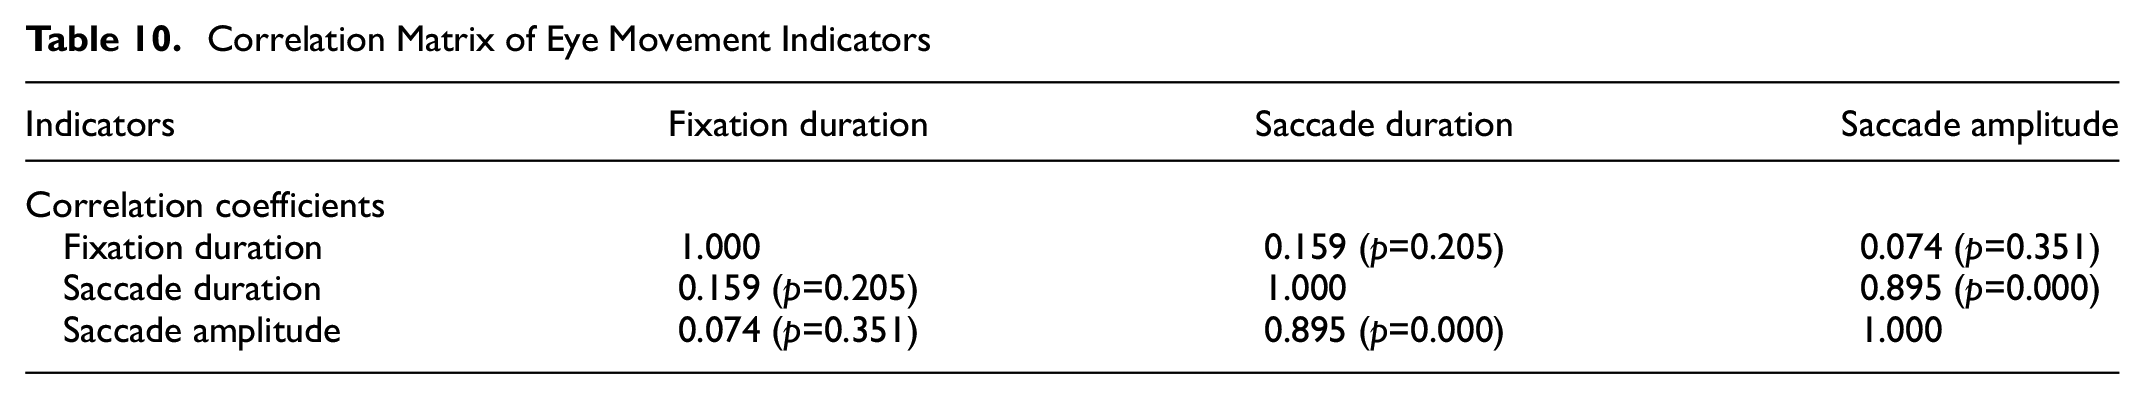
The three eye movement indicators have Kaiser-Meyer-Olkin (KMO) statistics of 0.688 > 0.5 and Barlett test of sphericity (BST) results of p = 0.000 < 0.05, indicating that they are appropriate for PCA. The PCA findings are shown in Table 11 below.
Contribution Rates of Variance for Eye Movement Indicators
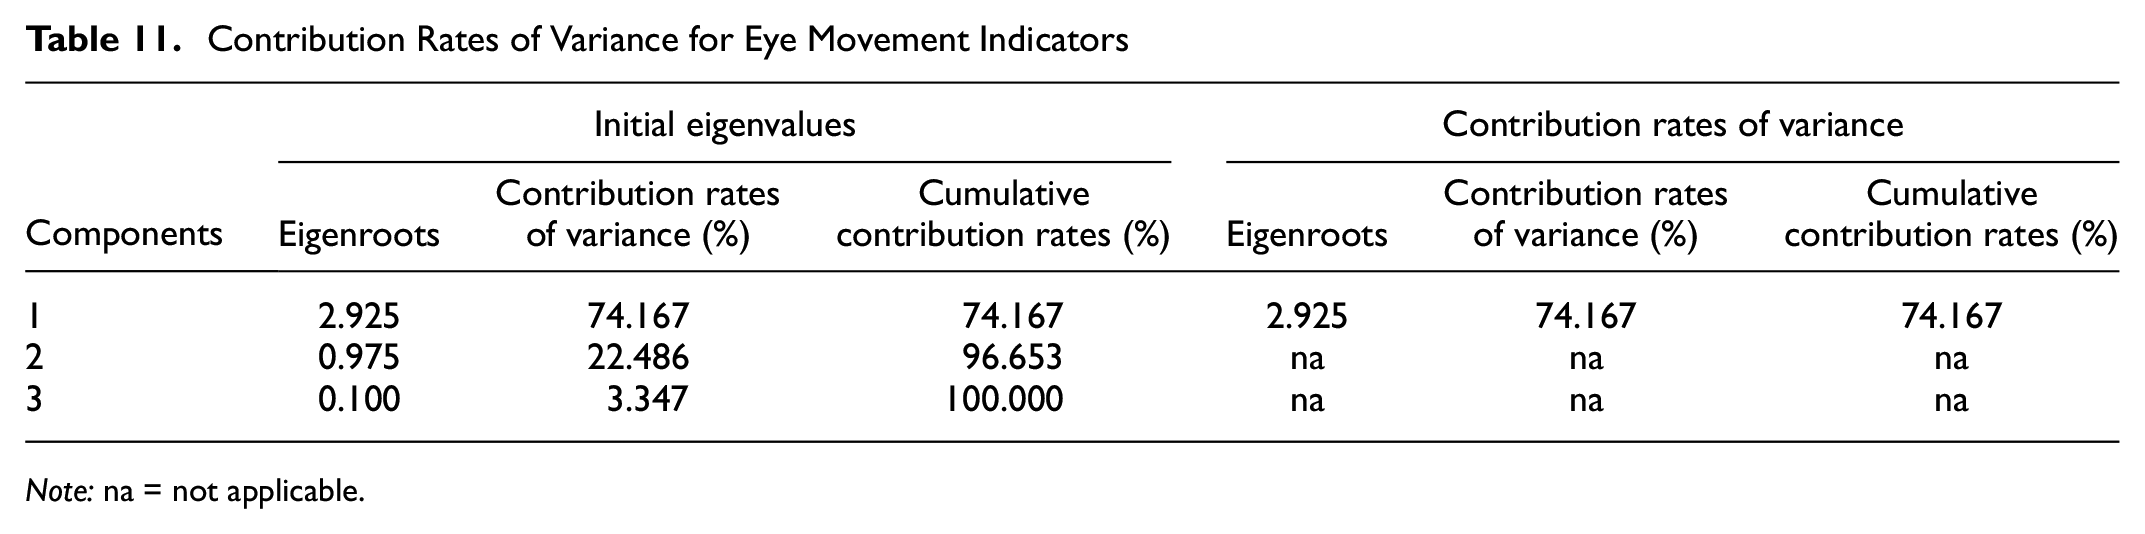
Note: na = not applicable.
The data presented in Table 10 demonstrate that the contribution rate of the first principal component has reached 74.167%, that is, it explains 74.167% of the total variation. The results show that one principal component extracted from the three eye movement indicators can represent most of the information of the original indicators. Therefore, a single major component was recovered as an all-encompassing indication of the visual workload intensity perceived by the driver. Table 12 demonstrates the factor scores as well as the loading weights for the three indicators.
Loading Weights and Factor Scores of Eye Movement Indicators
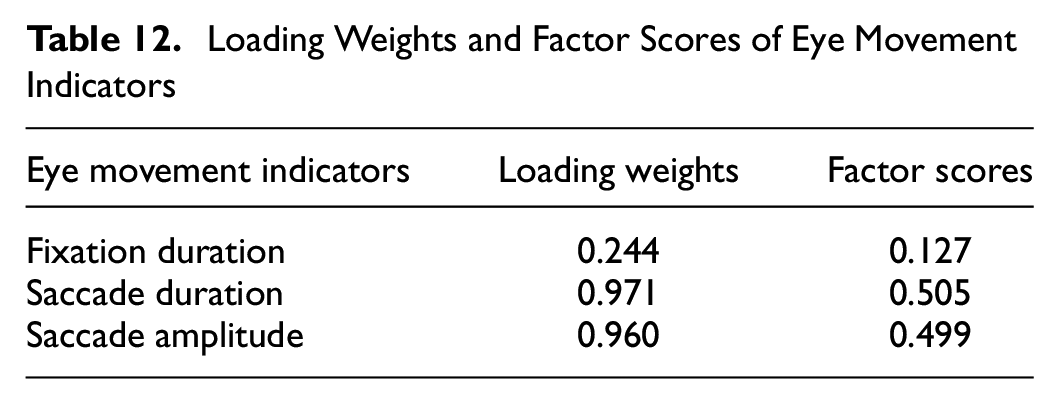
In the linear combination of principal components, the coefficient for each eye movement indicator is the loading weights divided by the open square of the associated eigenroots. Since just a single principal component was identified, the coefficients of the individual eye movement indicators inside this principal component are the weight coefficients of the total visual workload indicators. The weighting coefficients of three eye movement indicators in the visual workload intensity indicator were 0.143, 0.983, and 3.038, respectively.
Consequently, the driver’s visual workload intensity may be described as:

where
F = Driver’s visual workload intensity (dimensionless)
FD = Driver’s fixation duration (ms)
SD = Driver’s saccade duration (ms)
SA = Driver’s saccade amplitude (degrees)
The visual workload intensity of drivers under different TSIV levels at the highway tunnel entrance zone is calculated and fitted, as shown in Figure 10.
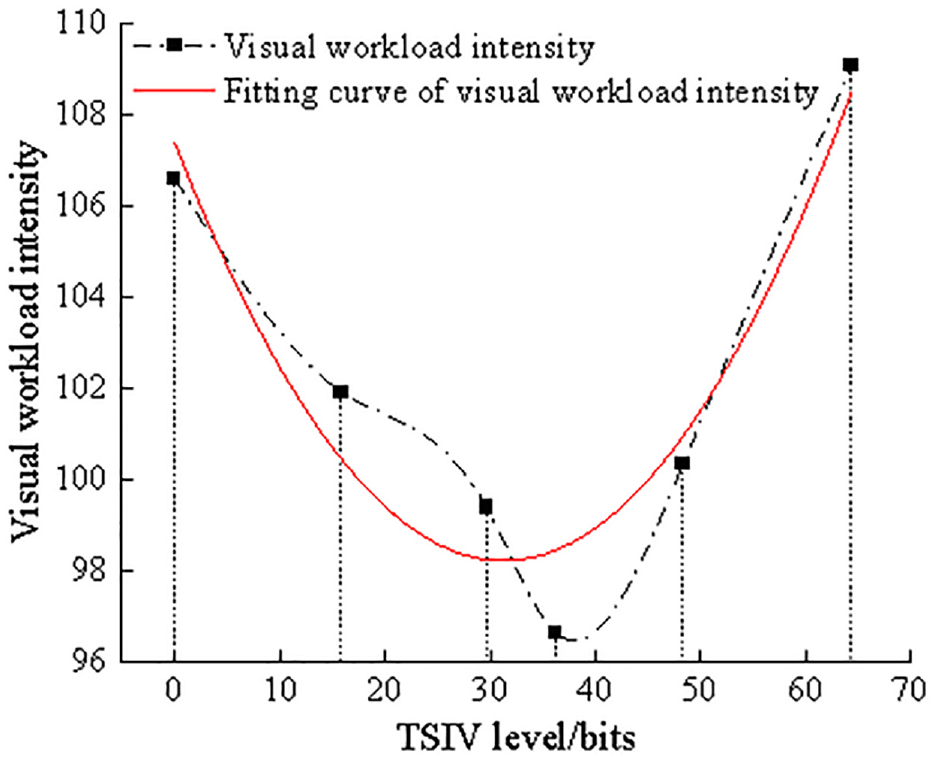
Visual workload intensity of drivers under different levels of traffic sign information volume.
The nonlinear fitting equation between the drivers’ visual workload intensity and the TSIV is
In conclusion, the statistical study above showed that the TSIV of the highway tunnel entrance zone significantly affected the visual workload intensity of drivers. When TSIV increased, drivers’ visual workload intensity followed a decreasing-to-increasing pattern, with a lower turning point under the T3 level indicating the beginning of the upward trend. This indicates that the visual workload and psychological pressure of drivers searching for traffic environment information under the T3 level TSIV were lower, which is beneficial for driving safety at the highway tunnel entrance zone. These results were consistent with the analysis of drivers’ eye movement behavior and visual SampEn.
Discussion
The main objective of this work was to evaluate the rationality of TSIV at the highway tunnel entrance zone, and to compare and analyze the influence of different levels of TSIV on drivers’ visual characteristics and driving safety through field driving tests. The results showed that the TSIV at the entrance zone of a highway tunnel had significant effects on drivers’ visual characteristics, visual stability, visual coordination, and visual workload. More specifically, the three eye movement indicators of drivers had a quadratic function relationship with TSIV, and the three eye movement indicators reached their minimum and the maximum values, respectively, under T3 level of TSIV, and the dispersion degree was the smallest. In addition, drivers’ visual SampEn continued to increase during the process of approaching the tunnel portal, but compared with other TSIV levels, the visual SampEn at T3 level is the smallest. Additionally, the drivers’ visual workload intensity tended to decrease with increasing TSIV, reaching a minimum at the T3 level before gradually increasing. The results of these experiments showed that drivers’ visual behavior was more stable, their visual coordination ability was higher, and their visual workload and psychological pressure were both lower, at the T3 level, all of which contribute to better driving safety in the entrance zone of a highway tunnel.
Specifically, with increase of TSIV in the entrance zone of highway tunnels, significant differences in drivers’ visual characteristics have been observed. This is mainly manifested by a decrease and subsequent increase in the average duration of drivers’ fixation and saccade, and an initial increase followed by a decrease in drivers’ average saccade amplitude. This change is caused by the impact of TSIV on drivers’ cognitive load, attentional demands, and information processing. Previous research has confirmed a close relationship between drivers’ reaction time, cognitive load, driving performance, and TSIV ( 47 , 52 ). Information overload from traffic signs can increase drivers’ visual cognitive burden and lead to driving errors, which is also an important factor affecting driving safety and causing accidents ( 12 ). This impact is reflected in drivers’ visual characteristics in their ability to search for, perceive, and process traffic sign information. During the process of transitioning from insufficient to appropriate to overloaded TSIV, drivers’ fixation and scanning behaviors are significantly influenced. When TSIV is insufficient, drivers have difficulty obtaining sufficient information, resulting in longer fixation and saccade durations and smaller saccade amplitudes. When TSIV is appropriate, drivers’ visual performance is better, and their ability to search for and process information is enhanced. However, when TSIV is overloaded, this good visual performance is disrupted because drivers’ visual resources are excessively consumed ( 72 ), making it more difficult to search for and extract information, and visual performance is impaired ( 49 , 73 ).
In recent years, traffic safety problems caused by the unreasonable setting of TSIV have attracted increasing attention. Some studies have explored the impact of TSIV on drivers in the driving scenarios of urban roads ( 13 , 49 ) and expressways ( 47 , 74 ), and have given the recommended value of TSIV. However, there has been no research and exploration of TSIV for highway tunnels, especially the entrance zone. It is well known that the visual environment of the highway tunnel entrance zone changes sharply ( 75 , 76 ), and the driving workload of drivers in this zone is relatively high. Therefore, it is even more important to provide drivers with appropriate traffic information and ensure the rationality and suitability of the TSIV at the entrance zone of the highway tunnel for the driving safety, which is also the main starting point of this study.
Some similar previous studies on TSIV were mostly about the effect of the amount of information and the layout of a single traffic sign layout on drivers, or the effect of traffic signs arranged in the same cross section on driver behavior ( 77 , 78 ). This study, however, focuses on the information volume available on all traffic signs at the entrance area of highway tunnel, which is a risky driving area that should receive priority attention.
Obviously, changes in the TSIV could affect drivers. With regard to visual characteristics, both the average duration of fixation and saccade exhibited a fluctuating tendency, initially dropping and then rising in tandem with an increase in TSIV, while the average saccade amplitude showed the opposite trend, which was consistent with the conclusion of Han et al. ( 23 ). The difference is that their study explored the reasonable density of TSIV per kilometer of monotonous highway, while this study evaluated the suitability of TSIV within 250 m before the highway tunnel entrance. In addition, in our study, CV and SampEn were innovatively introduced into the field of drivers’ visual characteristics to evaluate the impact of TSIV on drivers’ visual stability and coordination, which has not been found in other studies in the field of drivers’ visual characteristics. Previous studies have used Markov model ( 79 ) and entropy rate ( 80 ) to evaluate drivers’ gaze behavior when driving in highway tunnels, but the premise of this method is to divide the driver’s visual field, so this method is relatively limited. In contrast, the visual SampEn used in this study can represent well the complexity and coordination of visual behavior in the recognition of each level of TSIV at the highway tunnel entrance zone. Apart from this, the results of the effect of TSIV on the visual workload intensity of drivers were consistent with the conclusions of Han et al. ( 23 ). The reason for this may be related to the visual search strategy ( 81 ) and comprehension ( 82 ) of drivers when facing varied traffic information. Because drivers are always searching for the most meaningful information directly related to their driving tasks ( 83 ), the insufficiency or overload of such information prompts will affect drivers’ cognitive workload and allocation of psychological resources.
Furthermore, it should be emphasized that the traffic signs in the experimental tunnel entrance zones involved in this study were all static traffic signs. However, other highway tunnel entrance zones may have dynamic traffic signs (such as dynamic speed limit signs) and VMS ( 84 , 85 ), so the results of this study may not be applicable to the two types of traffic signs mentioned above because their information content may be dynamically changing, which can better guide and manage dynamic traffic. Especially for VMS, this type of sign panel can display information composed of text, images, or a combination of both, and can dynamically display and disseminate information through scrolling or flashing, resulting in great flexibility in the content and type of information displayed by the sign. In addition, the location and content of these signs are more important for ensuring driver comprehension and driving safety ( 86 ). However, in China, dynamic signs and VMS are more inclined to be set on freeways, so future research on the TSIV of freeways should take into account dynamic signs and VMS ( 87 , 88 ).
It is also worth noting that, to control variables, this study did not consider the effect of traffic flow on drivers’ visual recognition of TSIV. However, in actual tunnel driving environments, traffic conditions may be more complex. Different levels of traffic volume and driving speed, as well as the physical characteristics of the tunnel, may pose challenges to drivers’ information processing abilities. Drivers may need to adjust their speed and following distance quickly to adapt to changes in traffic flow, which requires them to maintain a high level of vigilance and reaction speed. The entrance of the tunnel may be obstructed by buildings, trees, or other obstacles, which may limit drivers’ visibility and require them to avoid obstacles by appropriate speed and positioning. At the entrance of the tunnel, there may be insufficient lighting or sudden changes in lighting, which may interfere with drivers’ vision and require them to adapt to changes in lighting and maintain a high level of attention. These are all factors that need to be considered in future in-depth research ( 71 , 89 , 90 ).
Road traffic signs should meet the five principles: to fulfill the needs of road users, to command the attention of road users, to convey a clear and concise meaning, to command respect from road users, and to give adequate time for proper response of road users. This study evaluates TSIV at the entrance zones of highway tunnels, to analyze the rationality of traffic signs in this zone. The results of this study show that drivers’ visual performance, visual stability, and visual workload performance are the best at T3 level (48.31 bits). According to the layout of T3 traffic signs, this study gives the recommended case of traffic signs in the tunnel entrance zone. To ensure drivers’ visual comfort and driving safety, the design of traffic signs at highway tunnel entrance zones should include several types of signs. These should include warning signs indicating speed limits, indicative signs for turning on lights, prohibition signs to prohibit lane changes, and information signs containing the name and length of the tunnel.
The evidence of this study can guide the reasonable setting of traffic signs at the entrance zones of highway tunnels. However, the effectiveness of traffic signs also includes the readability and accuracy of signs from the perspective of driving human factors. Therefore, in the future, a reasonable combination setting scheme of traffic signs at highway tunnel entrance zone can be further explored by combining the driving behavior data, to ensure the traffic safety of the highway tunnel. In addition, the suitability of TSIV of freeways, expressways, and urban roads will be different because of the different road environments, and the results of this study are more suitable for the evaluation of TSIV of low-grade highway tunnel entrance zones.
Conclusions
Reasonable TSIV plays a critical role in ensuring traffic safety; especially at highway tunnel entrance zones with high driving risk, the evaluation of TSIV is most important. In this study, the eye movement data of drivers under different levels of TSIV at the highway tunnel entrance zone were obtained through real vehicle driving field experiments, and the effects of TSIV on drivers’ visual characteristics such as fixation duration, saccade duration, and saccade amplitude were analyzed. In addition, CV, visual SampEn, and visual workload intensity were used to evaluate the effects of TSIV on drivers’ visual stability, visual coordination ability, and visual workload. The main conclusions of this study are as follows:
The average durations of fixation and saccade reduced and then increased with increasing TSIV, and the average saccade amplitude increased first and then decreased. They all reached the threshold value at T3 level (48.31 bits) with the minimum SD, indicating that drivers’ visual behavior is more stable at T3 level.
The CV of fixation duration, saccade duration, and saccade amplitude all exhibited a tendency of first reducing and then rising with the growth of TSIV. At T3 level, the dispersion of eye movement indicators are the smallest and the visual performance coordination is the best.
The SampEn of fixation duration, saccade duration, and saccade amplitude of drivers increase continuously as drivers approach the tunnel portal, but the visual SampEn is the minimum at T3 level of TSIV. This indicates that the driver’s mental state gradually becomes tense in the process of approaching the tunnel, but their performance is more relaxed and comfortable under T3 level.
As the level of TSIV is increased, drivers experience a decrease in their visual workload intensity at first, followed by an increase in that intensity. The lowest level of visual workload intensity occurs at the T3 level. It has been shown that the psychological strain placed on the driver is at its lowest point at the T3 level, which is beneficial for ensuring drivers’ safety in the zone leading up to the tunnel entrance of the highway.
Footnotes
Author Contributions
The authors confirm contributions to the paper as follows: study conception and design: L. Han, Z. Du; data collection: K. Wu; analysis and interpretation of results: L. Han, Z. Du, K. Wu; draft manuscript preparation: L. Han. All authors reviewed the results and approved the final version of the manuscript.
Declaration of Conflicting Interests
The author(s) declared no potential conflicts of interest with respect to the research, authorship, and/or publication of this article.
Funding
The author(s) disclosed receipt of the following financial support for the research, authorship, and/or publication of this article: This study was supported by the National Natural Science Foundation of China (No. 52072291).