
Abstract
Despite extensive research on traffic injury severities, relatively little is known about the factors contributing to truck-involved crashes in developing countries, especially in the context of Bangladesh. Because of the unavailability of authentic crash data sources, this study collected data from alternative sources such as online English news media reports. The current study prepared a database of 144 truck-involved fatal crash reports during the period of 12 months (January 2021 to December 2021). The crash reports contain a bag of 15,300 words. Several state-of-the-art text mining tools were utilized to identify crash patterns, including word cloud analysis, word frequency analysis, word co-occurrence network analysis, rapid automatic keyword extraction, and topic modeling. The analysis revealed several important crash contributing factors, such as the type of vehicle involved (auto-rickshaw, bus, van, motorcycle), the manner of collision (head-on), the time of the day (morning, night), driver behavior (speeding, overtaking, wrong-way driving), and environmental factors (dense fog). In addition, “coming from opposite direction” and “head-on collision” are two important sequences of events in truck-involved crashes. Truck drivers are also involved in crashes with trains at rail crossings. The findings of this research can assist policymakers in identifying crash avoidance strategies to lower truck-related crashes in Bangladesh.
The World Health Organization (WHO) estimates that road traffic crashes are the eighth leading cause of death, with more than 1.35 million fatalities globally each year ( 1 ). It is important to note, however, that crash prevalence and severity differ significantly between countries, with developing and underdeveloped countries reporting higher deaths than developed countries. Despite developing countries having fewer registered vehicles, they have a higher casualty rate because of factors such as inadequate road infrastructure, lowered safety standards, and riskier driving practices. According to WHO, 93% of all road fatalities occur in low- and middle-income countries (LMICs), despite these countries owning around 60% of the world’s vehicles ( 2 ). Even so, developing countries must adopt stricter traffic laws, promote safe driving habits, and enhance their road infrastructure to improve their road safety. In LMICs such as Bangladesh, fatalities and serious injuries because of traffic crashes are major health concerns. According to the 2018 WHO Global Status Report ( 3 ), the WHO estimate of the number of traffic fatalities in Bangladesh was 24,954 (95% confidence intervals: 20,730–29,177). The report also provides some other valuable crash statistics: 67% of roadway crash fatalities and injuries occurred in the economically productive age groups (15–64 years old), there were 15.3 fatalities occurred per 100K population, there were estimated serious injuries of 374,310, and the cost of fatalities and series injuries was US$11,630 (5.3% of the country’s gross domestic product [GDP]). Because of the underdeveloped crash reporting system in Bangladesh ( 4 ), it is challenging to collect comprehensive data on these collisions and their underlying causes.
Truck-involved crashes are one of the most significant types of crashes that need to be examined in depth, especially in developing countries. The vehicle mix and travel patterns are considerably different from those in developed countries, as most people rely on heavy vehicles (buses and trucks) for travel and goods movement ( 5 ). As a result of the greater exposure, crash involvement is higher for trucks and buses. For instance, a prior study found that the number of fatalities and injuries per 10,000 crashes was higher in Vietnam and Kenya than in the U.S.A., primarily as a result of the high frequency of collisions involving multi-passenger vehicles, including buses, minibuses, and trucks ( 6 ). There are several factors that can be attributed to truck-involved crashes ( 7 – 9 ). These factors are important to understand as these crashes pose a considerable risk to public safety, and analyzing the factors that contribute to them can help decrease the number of deaths and injuries. In addition, truck crashes usually cause property damage, medical expenses, and lost productivity, which can have a substantial impact on the economy. This cost can be reduced if policymakers and stakeholders in the industry understand the factors that lead to these crashes and implement follow-up actions (i.e., countermeasures) as well as measurements of those actions to achieve safety improvement. Furthermore, a deeper understanding of the factors behind fatal truck crashes can aid in policy development, including the development of regulations to enhance truck safety. Understanding the causes and patterns of crashes in this industry can support the development of best practices, such as driver training, vehicle maintenance, and other safety measures. Bangladesh has experienced a sharp rise in crashes involving heavy vehicles, particularly trucks, in recent years ( 10 ). Truck-involved crashes made up around 25% of all crashes in Bangladesh in 2022, which is second only to motorcycle crashes (29%) according to the Passenger Welfare Association of Bangladesh ( 11 ). Because of the mass of large trucks, the count and severity of injuries are higher in number in truck-involved crashes. The number of fatalities in truck-involved crashes in Bangladesh is usually extremely high, as these crashes are associated with vulnerable road users such as human haulers, cycle or motorcycle riders, rickshaws, and auto-rickshaws. As a result, the morbidity and mortality rates of truck-involved crash injuries have increased, making it one of the most serious safety concerns. For example, Table 1 lists some of the major truck-involved crashes, which were reported in different online news media. For example, the fatal truck-involved crash that occurred on July 11, 2011, in Mirsarai, Chattogram, resulted in 44 fatalities (second row in the table), which is an extremely high number for a single road traffic crash.
Some Major Truck-Involved Crashes in Bangladesh
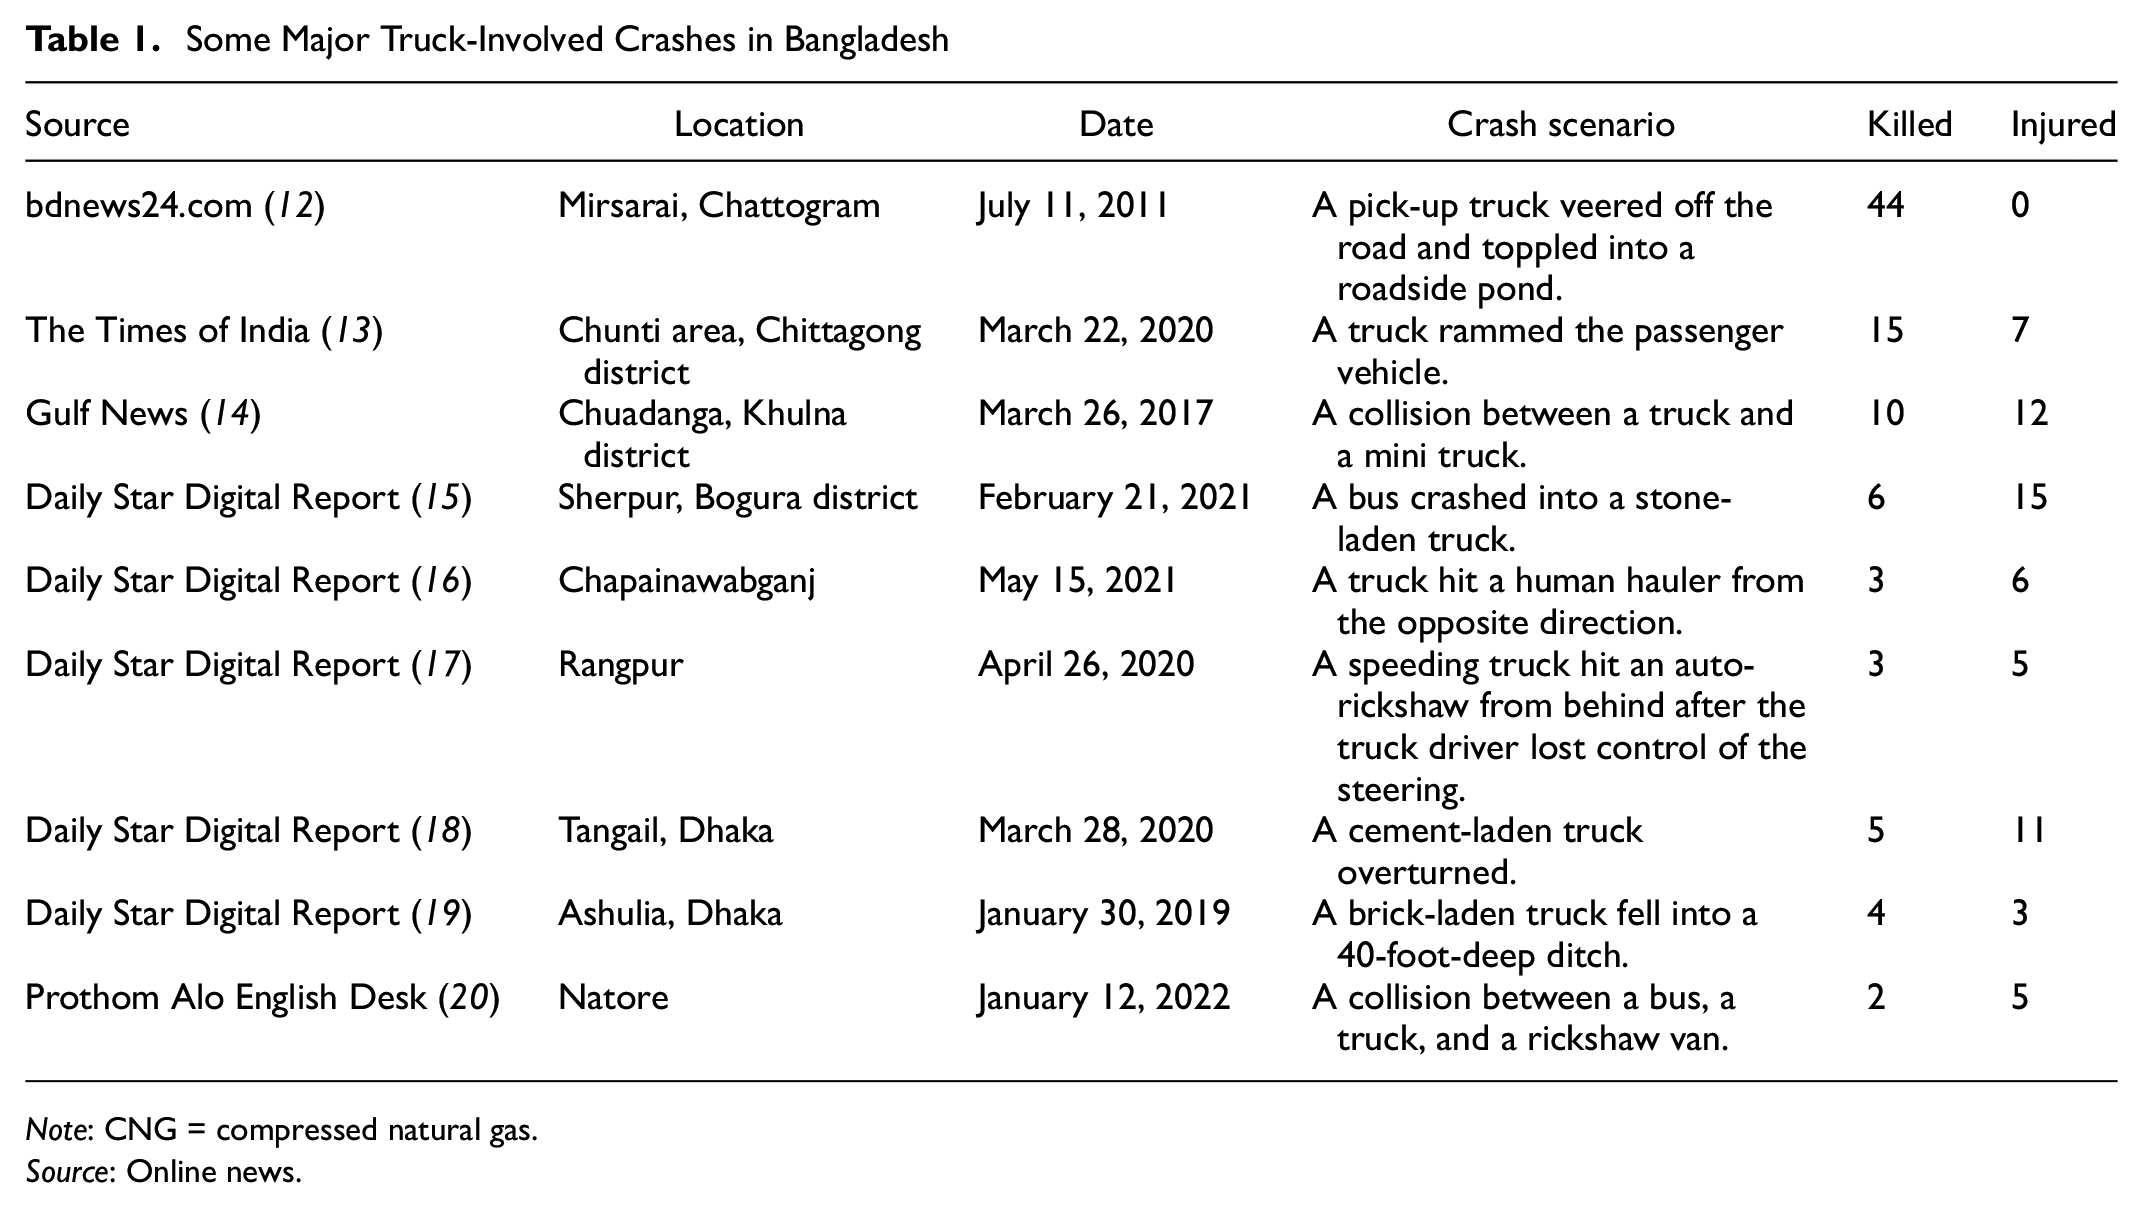
Note: CNG = compressed natural gas.
Source: Online news.
Because of the absence of authentic crash records, this study explored alternative sources to determine the contributing factors to truck-involved crashes in Bangladesh. The current study followed the approach developed by Das ( 21 ). Das collected fatal crash reports (for all vehicles) from online English daily news media sources by using Google News Alert. After collecting the data, this study identified critical factors by applying different natural language processing (NLP) tools. The current study focused on only fatal truck-involved crashes to address a specific safety concern. State-of-the-art text mining tools were used to identify insights and factors from reported text contents about fatal track-involved crashes. The findings of this study are expected to provide a better understanding of the crash contributing factors of truck-involved crashes in Bangladesh.
Literature Review
The literature review focuses on three key areas: (1) major U.S. studies on truck-involved crashes; 2) major studies on crashes and truck-involved crashes in Bangladesh and other developing countries; and (3) studies on news media-related information extraction for transportation safety.
Major U.S. Studies
Truck-involved crashes are a key safety concern in the U.S.A. As there is detailed information on crash data specifics, studies focused on many issues, such as key contributing factors, patterns of risk factors, severity patterns and classification, and frequency analysis using advanced statistical and machine learning models. Dong et al. ( 22 ) estimated large truck-related crash frequencies by developing a multivariate Poisson-lognormal (MVPLN) model. Comparisons among car, car–truck, and truck crash counts concerning different contributing factors were identified in the developed models. Cheung and Braver ( 23 ) explored the undercounting of large truck crash frequencies in federal and state crash databases. The results show that large truck involvement-related misclassification is significantly high. The Large Truck Crash Causation Study (LTCCS) provides in-depth information on crash data, which is usually unavailable in state-maintained traffic crash data. Using the LTCCS and naturalistic driving data, Hickman et al. ( 24 ) conducted a synthetic risk ratio analysis. Zheng et al. ( 25 ) applied gradient boosting and data mining methods to identify the impact of key contributing factors on crash severities associated with commercial trucks. This study examined 25 variables, and 22 of them were identified as significant variables contributing to injury severities. In Texas, truck-related crash frequencies increased by 82% from 2009 to 2012. Zhao et al. ( 26 ) identified hot spots and developed collision diagrams by collecting traffic crash data from Texas from 2011 to 2015. Rahimi et al. ( 27 ) applied a high-dimensional clustering approach to identify patterns of large truck crashes by using crash data from Florida between 2007 and 2016. The results suggested that truck-related crash data can be explored in major clusters, such as same-direction, opposing-direction, and single-vehicle crashes, to better understand the patterns and develop relevant countermeasures. Das et al. ( 28 ) applied an innovative dimension reduction method known as taxicab correspondence analysis (TCA) on fatal crash data involving a large truck. Using 2010–2015 large truck fatal crash data from the Fatality Analysis Reporting System (FARS), this study identified five clusters with attributes such as two-lane undivided roadways, intersection types, posted speed limit, crash types, number of vehicles, driver impairment, and weather. Note that the current findings and recommendations in the context of the U.S.A. may not be transferable to developing countries such as Bangladesh because of the unique vehicle mix (slow- and fast-moving vehicles), traffic violation culture, level of education and awareness, failure to enforce traffic laws, and so on ( 29 ).
Major Truck-Involved Crash Analysis in Bangladesh and Other Developing Countries
Traffic safety-related studies in Bangladesh are limited. Most of these studies used aggregate data and performed either exploratory data analysis (EDA) or simple statistical analysis. According to the authors’ knowledge, two studies focused solely on truck-related crashes in Bangladesh. A study conducted by Sufian et al. ( 30 ) collected data on road traffic crashes in Bangladesh from 1998 to 2010. The EDA shows that truck drivers’ activities contributed to 95% of truck crashes. Other factors were associated with pedestrians, vehicular properties, and the roadway environment. Conducting a field observation on some bus terminals (Gabtoli truck terminal and Dholaikhal), this study also identified that vehicle-related defects are significantly high in trucks, which could be associated with traffic crashes. Another study utilized the “Quasi-Static Rollover Model” to investigate the “rollover criteria” of heavy trucks in single-vehicle run-off-road (SVROR) crashes in Bangladesh ( 31 ). The study used a hypothetical combination of the geometric dimension of the truck and loading condition to find the critical condition in which rollover occurs. Some of the other research conducted in Bangladesh only briefly examined truck-related collisions. Table 2 highlights information (including the year, data source, location, methods, and key findings of truck-involved crashes) from a few previous studies in the context of Bangladesh. It is important to mention here that the findings of these studies are limited, and it is difficult to assess how basic human, roadway, or environmental factors are associated with truck-involved crashes.
Findings from Previous Studies
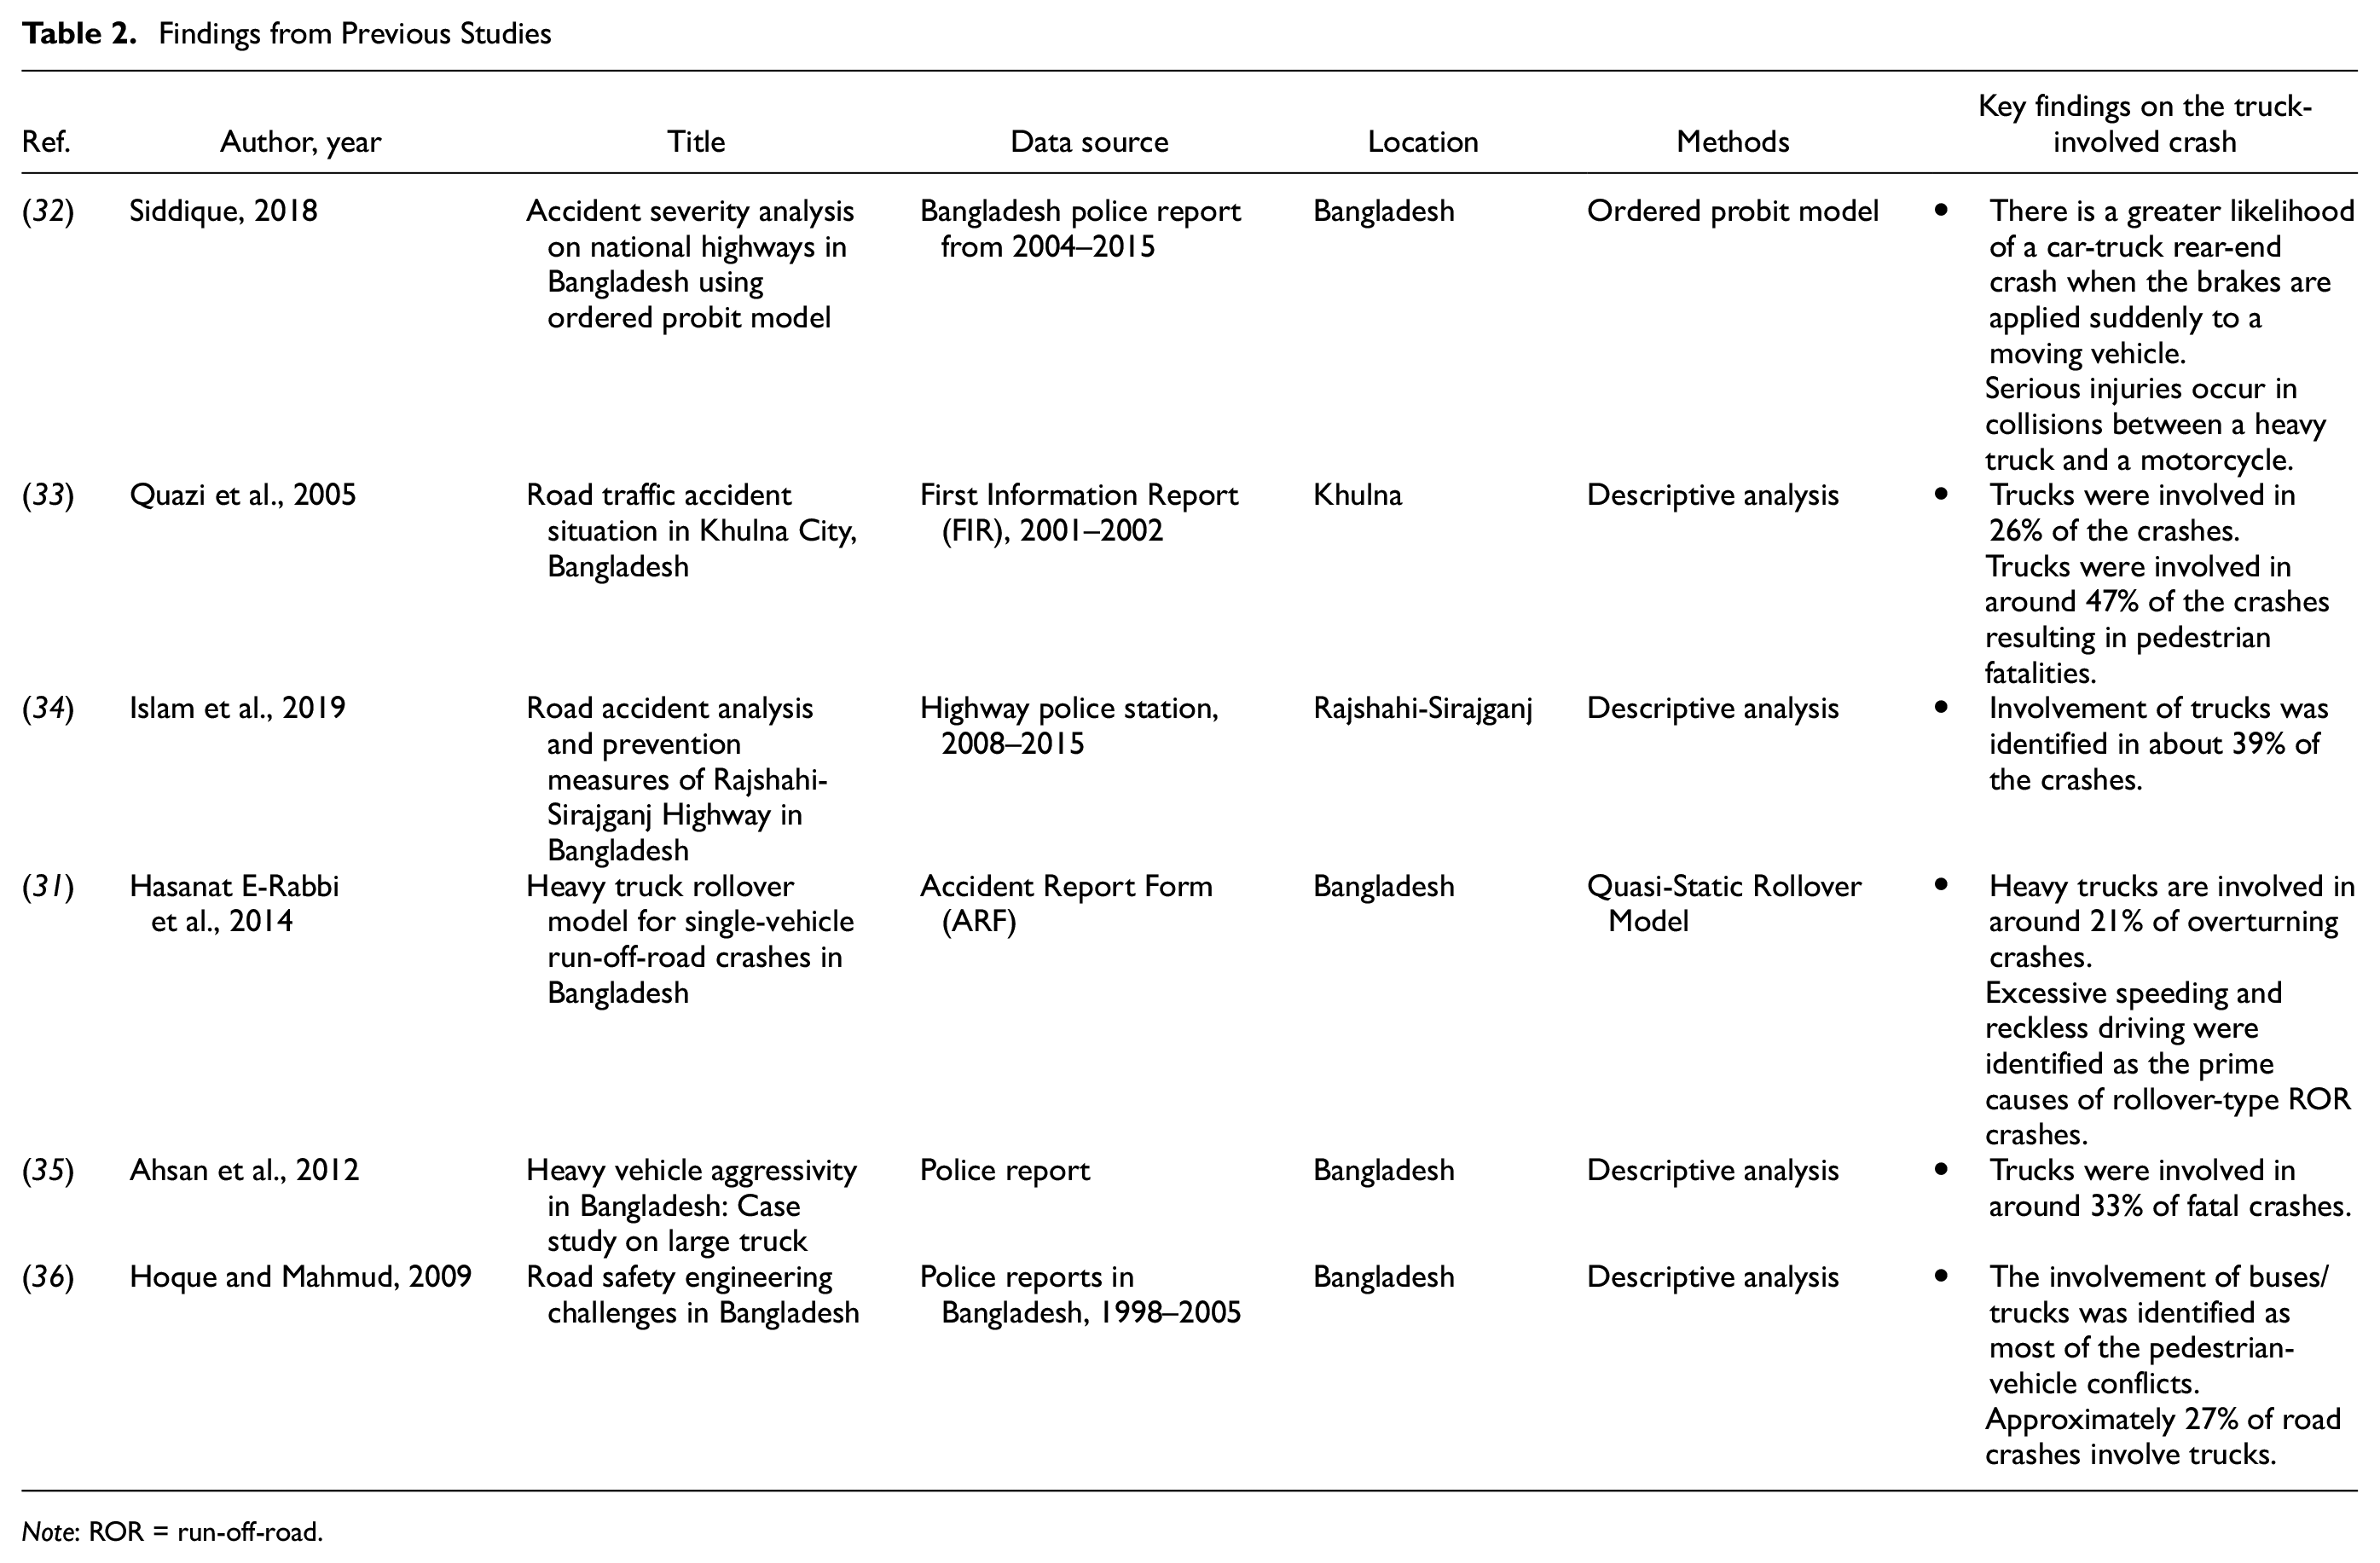
Note: ROR = run-off-road.
Truck-involved crashes have also received research attention in other developing countries. For example, a study conducted in Iran analyzed 4359 single-vehicle truck crashes (March 2011–March 2012) and identified several significant factors contributing to crashes, including drivers’ education status, advanced braking system deployment, curved alignment, and high posted speed limit ( 37 ). Another study conducted in Iran evaluated the factors influencing the severity of heavy truck-involved incidents and revealed unsafe lane changing as a major contributor to crashes ( 7 ). The study also emphasized unrealistic schedules and expectations of truck companies as a source of stress for large truck drivers. Another study utilized police-reported pedestrian crashes in Addis Ababa, Ethiopia, from 2009 to 2012 ( 38 ). According to these findings, if a truck is involved in the crash, the likelihood of fatal and severe pedestrian injuries increases by around 11% and 2.1%, respectively. A previous study suggested that overloaded truck transport is an inevitable outcome of fast economic growth in developing countries and can make up as high as 80% of the total number of trucks on the highway ( 39 ). Again, fatal crashes involving heavy trucks are correlated to the amount of overloading, as suggested by a few of the previous studies ( 40 – 42 ).
Traffic Safety Analysis Using News Media Mining
News media mining has been becoming increasingly popular among researchers when conventional data is limited. Das ( 21 ) applied different NLP tools to news media data to extract insights into fatal crashes in Bangladesh. In another study, Das ( 43 ) collected news media reports on the impact of speeding on crashes during COVID-19. This study applied text network analysis to identify the patterns of risk factors. This study developed topic models and interactive topic model web tools to explain the keywords and their significance in each topic. Yang et al. ( 44 ) explored massive media reports to develop an e-scooter crash database. This study identified 169 e-scooter-related traffic crashes from news reports during 2017–2019. This study also conducted an EDA on the developed crash datasets. Karpinski et al. ( 45 ) identified 21 shared e-scooter fatalities in the U.S.A. from 2018 to 2020 by exploring media reports. This study explored the reports to identify potential risk factors. This study found that most crashes (86%) involved motor vehicles and 28% of these were hit-and-runs. Keliikoa et al. ( 46 ) explored local media news coverage of non-motorist-related crashes in Hawaii in 2019. The content analysis shows that language patterns in news article titles were usually non-agentive (77%) and focused on pedestrians or bicyclists (77%) without mentioning drivers or vehicles (69%).
Research Gap, Objectives, and Novelty of Study
Traditional data collection methods such as crash reports by police may be insufficient in providing a comprehensive understanding of the factors contributing to road crashes. Digital data sources such as news articles, social media posts, and other textual data are becoming increasingly available, making text mining an effective tool for analyzing road crash factors and patterns, as well as extracting insights that can be applied to improving road safety. To the best of our knowledge, no prior study has explored contributing factors and their patterns for truck-related crashes in developing countries via the text mining approach. An in-depth analysis is thus needed to mitigate the current research gap. Thus, the goal of this study is to apply text mining tools to identify the factors contributing to truck crashes in Bangladesh, along with the patterns associated with them. Analyzing fatal truck-involved crashes using a text mining approach can be highly effective for numerous reasons. Firstly, it enables the analysis of large amounts of unstructured data, such as police reports and crash records, to identify the key factors and patterns associated with these types of crashes. As a second benefit, text mining can uncover insights and patterns that were not immediately visible in the data, revealing new factors or combinations of factors that contribute to truck crashes. Moreover, real-time monitoring of news articles, social media, and other sources can help identify trends or factors contributing to fatal truck crashes. Lastly, text mining can provide policymakers, industry stakeholders, and safety professionals with insights into contributing factors and patterns of truck crashes. Last but not least, prioritizing interventions and solutions can be accomplished by identifying the most common and significant factors contributing to fatal truck crashes. Through targeted interventions and better decision-making, text mining can provide a more comprehensive understanding of the factors and patterns that contribute to these crashes.
In summary, understanding the contributing factors and patterns associated with fatal truck-involved crashes is essential for improving public safety, reducing economic costs, focusing on policy development, and promoting best practices in the industry. Therefore, the findings of this research are expected to assist transportation experts and policymakers in identifying crash avoidance strategies to lower truck-related crashes in Bangladesh.
Scope
The scope of this research is limited to online news articles published in the English language in Bangladesh. Other news articles published in the local languages, such as “Bangla,” are not included in this paper.
Methods
The technique of extracting data from a collection of texts is known as text mining or text data mining. In 1999, Hearst ( 47 ) first used the term “text data mining” and distinguished it from other ideas, like NLP. The objective of text mining is to discover information and patterns from text data, which can be unstructured or semi-structured ( 48 ). There are several steps involved in text mining, including data collection, data preprocessing, text analysis, and interpretation. Preprocessing removes noise, such as stop words and punctuation, and transforms the text into a structured format that can be analyzed. The data is collected from various sources and then preprocessed to remove noise. Afterward, patterns, relationships, and trends are identified by analyzing the text using a variety of techniques, such as NLP, machine learning, and statistical analysis. As a final step, the results are interpreted to gain meaningful insights and knowledge. Along with applications in other research domains, text mining has become an increasingly popular approach in transportation safety research. Some of the recently published articles are related to heavy vehicle crashes ( 49 ), rail crashes ( 50 ), evaluating roadway crashes for road asset management ( 51 ), mining highway–rail grade crossing crash data ( 52 ), classification of roadway traffic injury collision characteristics ( 53 ), pedestrian violation behaviors ( 54 ), work zone crashes ( 55 ), and so on.
The basic methodology of text mining is to transform the text into a numeric dataset. To facilitate this, the term document matrix (TDM) method is utilized. In the TDM, the text data is represented in the form of a matrix. Before creating the TDM, basic preprocessing of the text is required, including the removal of punctuation, stop words (common English words), white space, numeric numbers, and special characters. Also, all of the text is converted into lowercase to reduce variations of the same word. For example, “Accident” and “accident” are treated as the same words after transformation. It is worth noting that the majority of online news sites in Bangladesh use the term “accident” instead of “crash” when reporting, despite the two words having different meanings.
Term Document Matrix
The TDM represents the document vector in matrix format. In this matrix, rows correspond to the terms (or words) in the document, columns correspond to the documents in the corpus (complete collection of documents), and cells correspond to the weights of the terms. The weights are either 0 or 1. Here, 1 indicates the presence and 0 indicates the absence of the term in a particular document. For example, let us consider the following three documents.
D1: An
D2: The
D3:
These documents can be converted into a TDM after basic preprocessing. The candidate terms are indicated in bold. Table 3 represents the TDM for the three documents (D1, D2, D3).
Example of a Term Document Matrix (TDM)
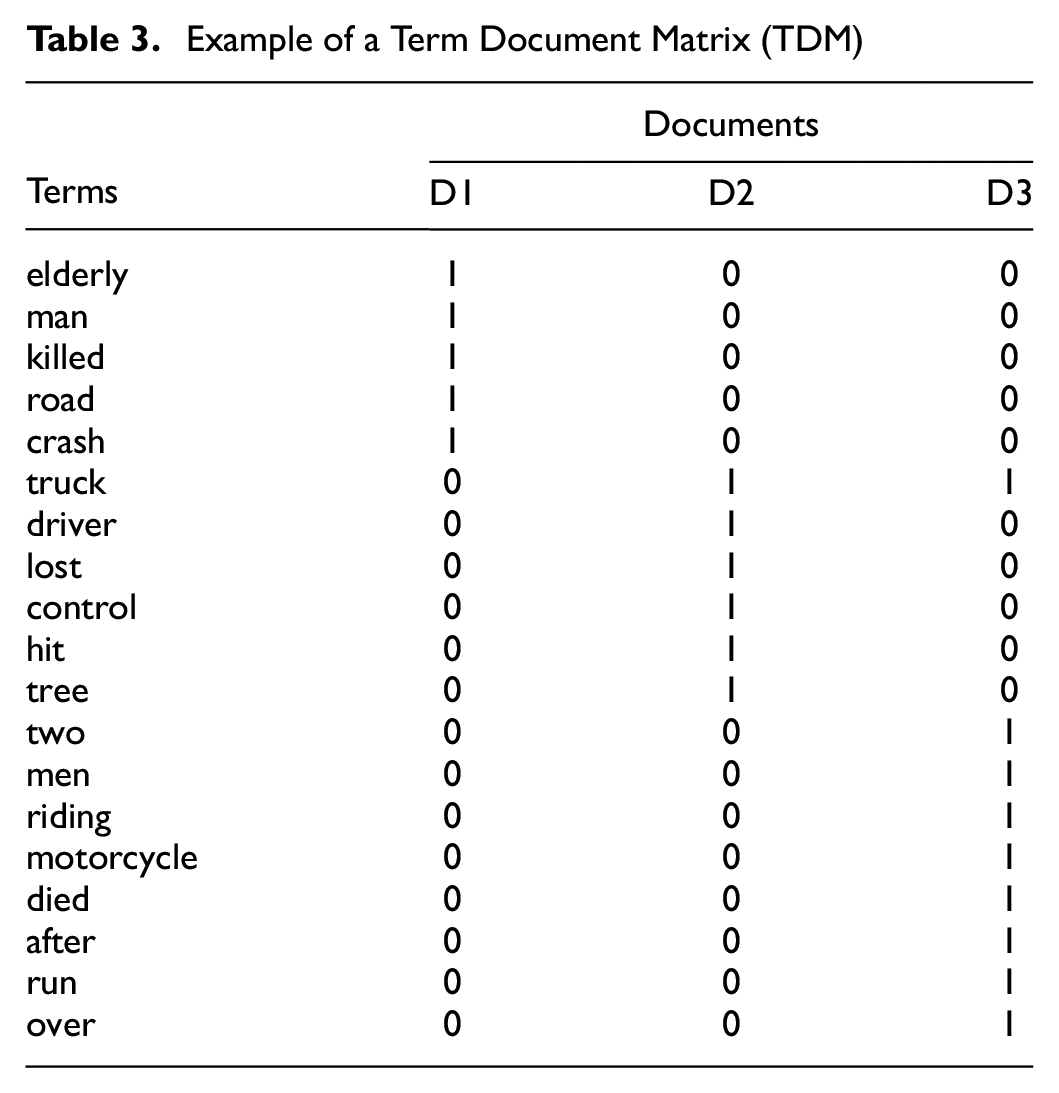
The word “elderly” is present in document D1, which is why it is coded “1” in document D1 but “0” in the other two documents. The next important step in the text mining approach is the identification of the term frequency (TF), document frequency (DF), and inverse document frequency (IDF). Let “t” indicate terms (words), “d” indicate documents (set of words), and “N” indicate the count of the corpus. Note that the corpus is the total document set.
Term Frequency
The TF measures how frequently a term occurs in a document. The equation for TF is provided below ( 56 ):

Document Frequency
DF measures the importance of documents in the whole set of corpora. In other words, DF is the number of documents in which a specific word is present. For a specific word “t”, DF(t) is the occurrence of “t” in the documents.
Inverse Document Frequency
IDF is simply the inverse of DF. The IDF of a term indicates how frequently the term appears in a corpus that contains the term. The equation for IDF is provided below ( 56 ):

To avoid very low values of IDF, a logarithm is used. The TF-IDF of a term is calculated by multiplying the TF and IDF scores. A hypothetical example is provided below.
Consider a document containing 100 words where the word “truck” appears five times. The TF for the word “truck” is 5 divided by 100, or 0.05. Now assume that out of a total of 10 million documents, 1000 of them include the term “truck.” Then, the measure IDF can be calculated as the logarithm of (10,000,000/1000) = 4. Finally, the TF-IDF weight can be found as 0.05 multiplied by 4, which is 0.20.
Word Correlation
The measurement of word correlation determines whether certain words are found together. Let us consider two words, “A” and “Z,” and let their appearance in the document be considered in a binary format: “1” for presence, “0” for absence. For example,

Rapid Automatic Keyword Extraction
Rapid automatic keyword extraction (RAKE) is a method for extracting keywords from individual documents. The RAKE algorithm is unsupervised and independent of both domain and language. The basic steps of RAKE are the determination of word degree, word frequency, and the ratio of the degree to frequency (also known as the score), as shown in Table 4. The degree of the word “XYZ” can be found by counting the number of words that occur in candidate keywords containing “XYZ,” including “XYZ” itself. Word frequency is simply the number of times the word occurs in the entire text. For illustration, the following sentence can be considered:
“The
Example of Rapid Automatic Keyword Extraction Process
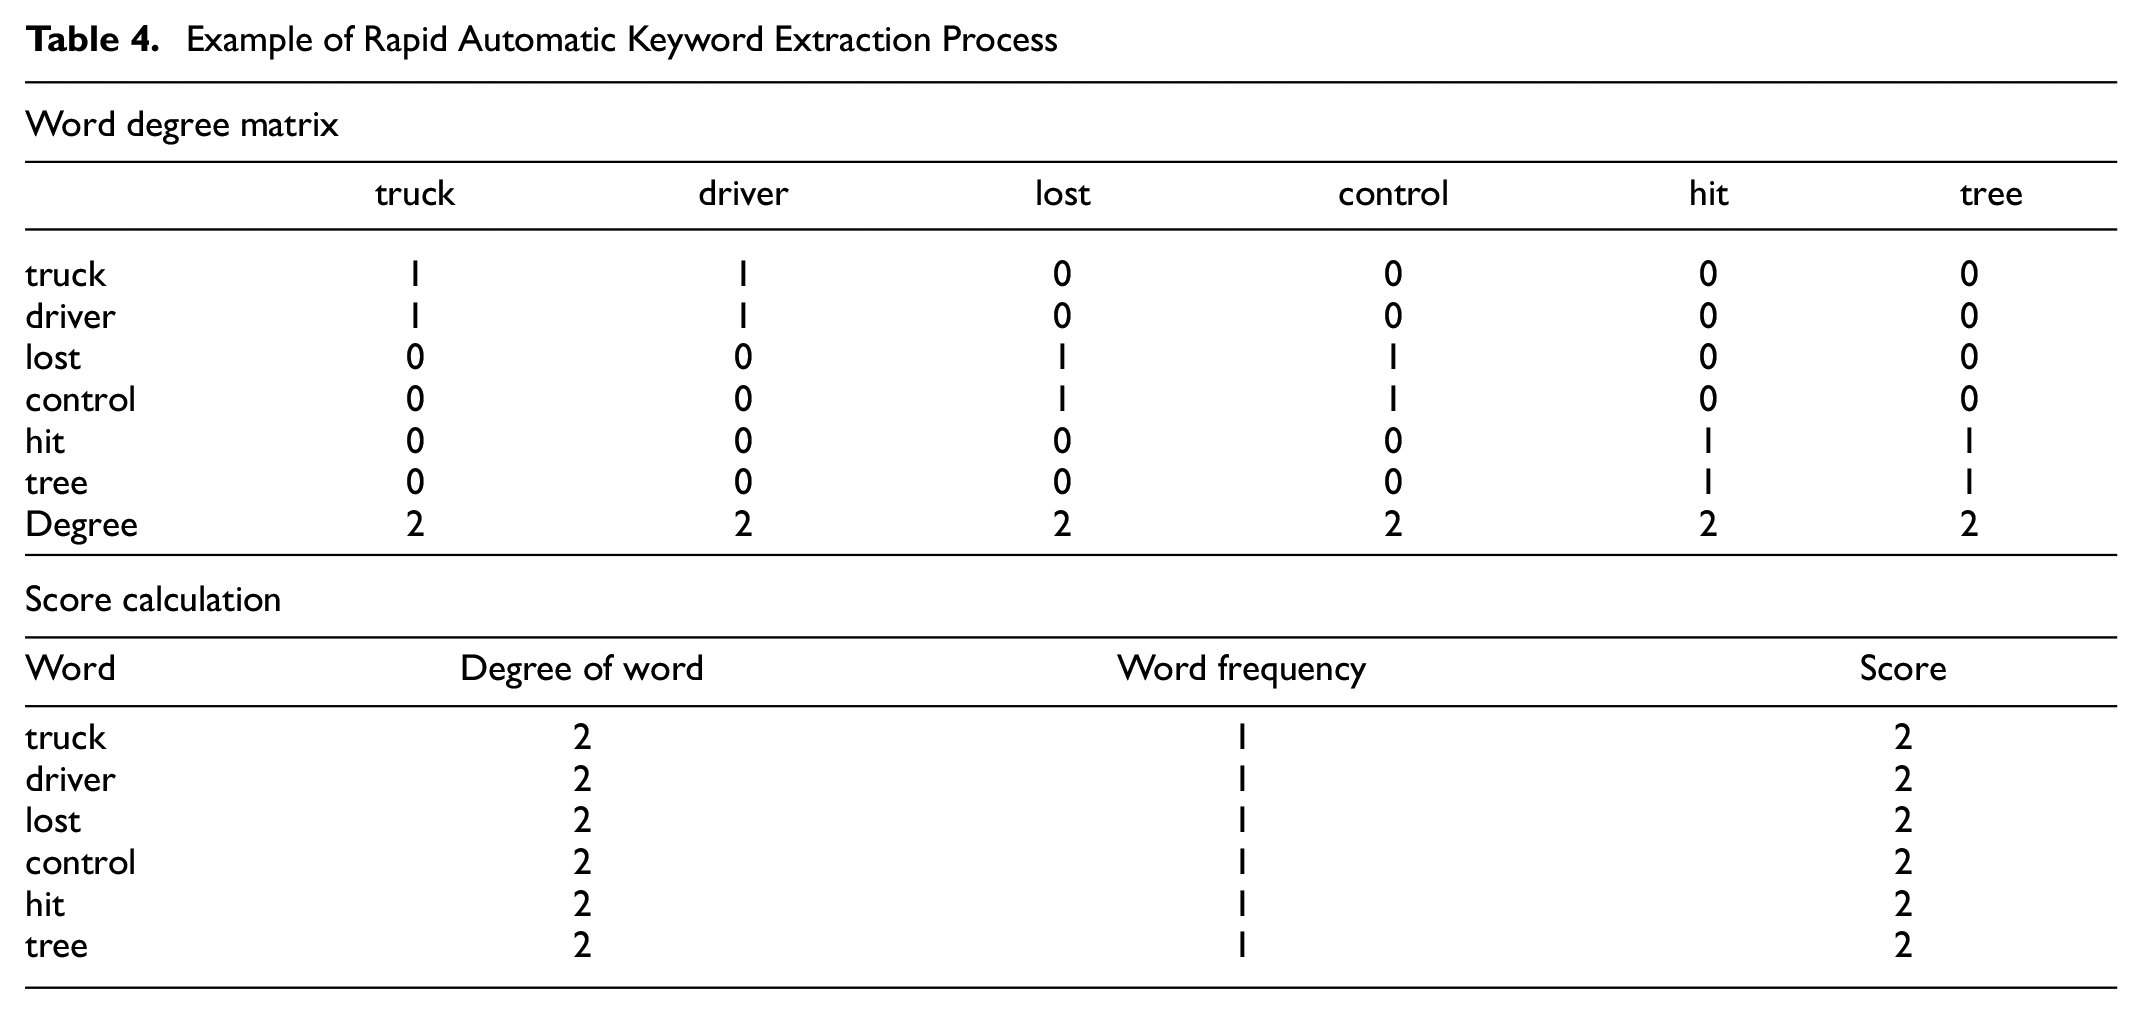
Here, the content words (total = 6) are shown in bold in the above sentence. Now, we need to define candidate keywords. Let us define three candidate keywords:
truck driver;
lost control;
hit tree.
In the next step, a word degree matrix is constructed where each row shows the number of times a given content word co-occurs with another content word in candidate keywords. For example, the word “truck” appears with the word “driver” and is coded as “1.” The diagonal portion of the table consists of only “1” because each word appears once in the text. Finally, the score for each word can be calculated as the ratio of the degree of the word and the word frequency. Now, the score for each candidate keyword is simply the combined sum of each score. For example, the score of the keyword “truck driver” is 4.
Topic Modeling
Topic modeling is an unsupervised machine learning technique that automatically analyzes text data to determine cluster words that frequently occur together within a set of documents ( 58 ). The research team utilized the latent Dirichlet allocation (LDA) algorithm, which is the most popular topic modeling technique to extract topics from a given corpus and performs better than other methods, such as non-negative matrix factorization (NMF), latent semantic analysis (LSA), and the Pachinko allocation model (PAM) ( 59 – 61 ). Previous research conducted by Blei et al. ( 62 ) provides a handy resource for the theoretical evolution of LDA. There are two basic assumptions of LDA modeling: (a) every word is a combination of an underlying set of topics and (b) every topic is a combination of a set of topic probabilities. The working flow diagram of the LDA algorithm is provided in Figure 1.
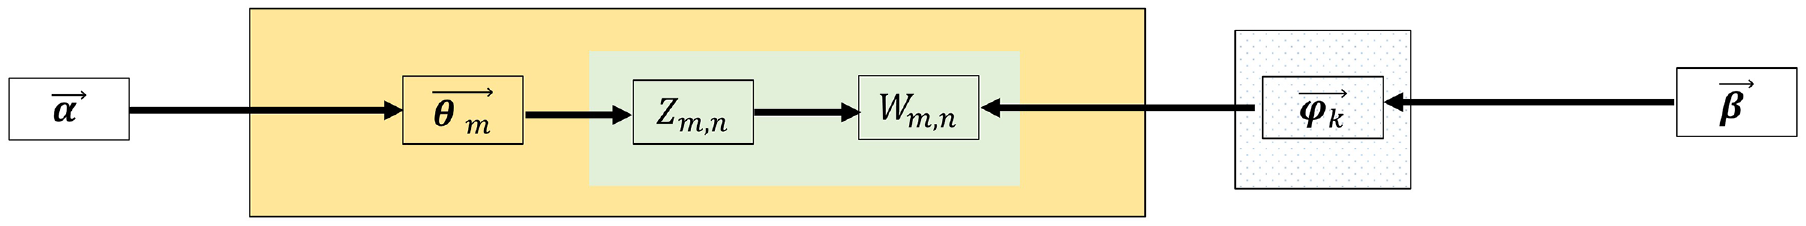
Working flow diagram of the latent Dirichlet allocation model ( 59 ) (color online only).
The interpretation of the LDA parameters is as follows:
Here, the yellow box refers to all the documents in the corpus and the green color box is the number of words in a document. According to LDA, every word is associated with a latent topic, which here is stated by Z. This assignment of Z to a topic word in these documents gives a topic word distribution present in the corpus that is represented by theta (θ). The LDA algorithm is an iterative process. The end goal of LDA is to find the most optimal representation of the document–topic matrix and the topic–word matrix to find the most optimized document–topic distribution and topic–word distribution.
The research team utilized R statistical software (version 4.2.0) to conduct the text mining analysis. A wide range of open-source R software packages was utilized, including “wordcloud2,”“topic models,”“tm,”“syuzhet,”“rapidraker,” and “quanteda.”
Data Preparation
Working with Google Alerts
Google Alerts (google.com/alerts) is a notification service that allows users to get information such as web pages, newspaper articles, blogs, or scientific research that matches their search keywords. The research team used this tool to collect crash reports from online sources in Bangladesh from January 2021 to December 2021. To narrow down searches, the research team used the following keywords in the Google Alerts service:
Bangladesh accident;
Bangladesh road collision;
Bangladesh road crash;
Bangladesh road fatalities and injuries;
Bangladesh traffic accident;
Bangladesh traffic crash;
highway crashes in Bangladesh.
The articles were pulled from news agencies, most of which are local newspapers in Bangladesh. Note that the study considered only online news articles written in English, and did not include articles published in any other languages (e.g., Bangla). Each article was manually entered into the dataset. The same crash may occasionally be covered by multiple online newspapers. For this reason, in this step, every report was carefully examined to eliminate duplicates. The final prepared dataset contains a total of 12 variables, namely source, headline, date published, narratives, killed, injured, district, division, crash time, crash type, vehicle 1, and vehicle 2. The variable “narratives” contains the crash reports collected from online sources and subsequently processed for applying text mining. Figure 2 shows the database preparation and analysis flowchart in detail.
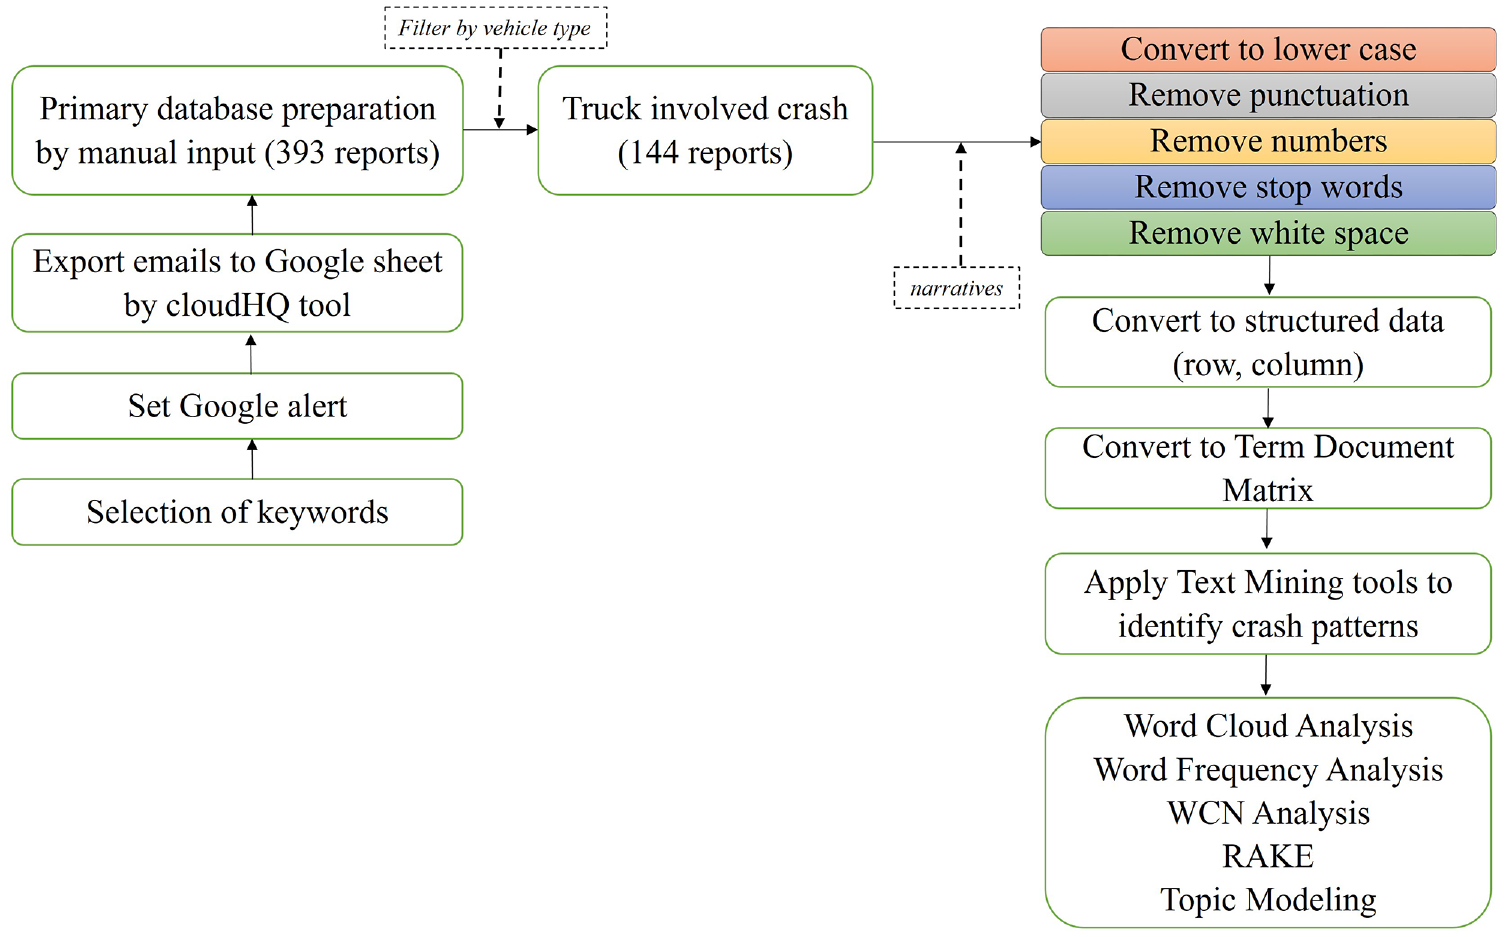
Database preparation and analysis flowchart.
To demonstrate the structure of crash narratives, one example of the crash narratives was randomly selected from the dataset:
An elderly man was killed in a road accident in the Bejerdanga area on the Jashore-Khulna highway under Phultala upazila of Khulna district last night. The deceased was identified as Farazi Ashraf Hossain, 68, who hailed from Abhainagar upazila of the district. Police said the accident occurred when a speeding truck hit Ashraf Hossain in the area as he was crossing the highway around 9.30 pm, leaving him dead on the spot. Police seized the truck and held its driver. A case was filed in this connection.”
Exploratory Data Analysis
Table 5 provides a summary of the crash database used in this study. A total of 144 online news reports related to truck-involved crashes were collected during the study period. The mean value for each total word in each report was found as 106.3 with a 95% confidence interval of 6.5. Other truck-related crash statistics, including the number of fatalities and injuries, age, and gender, were also extracted from the news reports. For example, truck-involved crashes resulted in 627 fatalities and injuries in 2021 in Bangladesh, with 51.5% killed and 48.5% injured. Note that the age (63.64% unknown) and gender (49.12% unknown) information of most of the crash-involved individuals were not reported in the online news. This is identified as a potential shortcoming of online crash news reporting in Bangladesh.
Descriptive Statistics
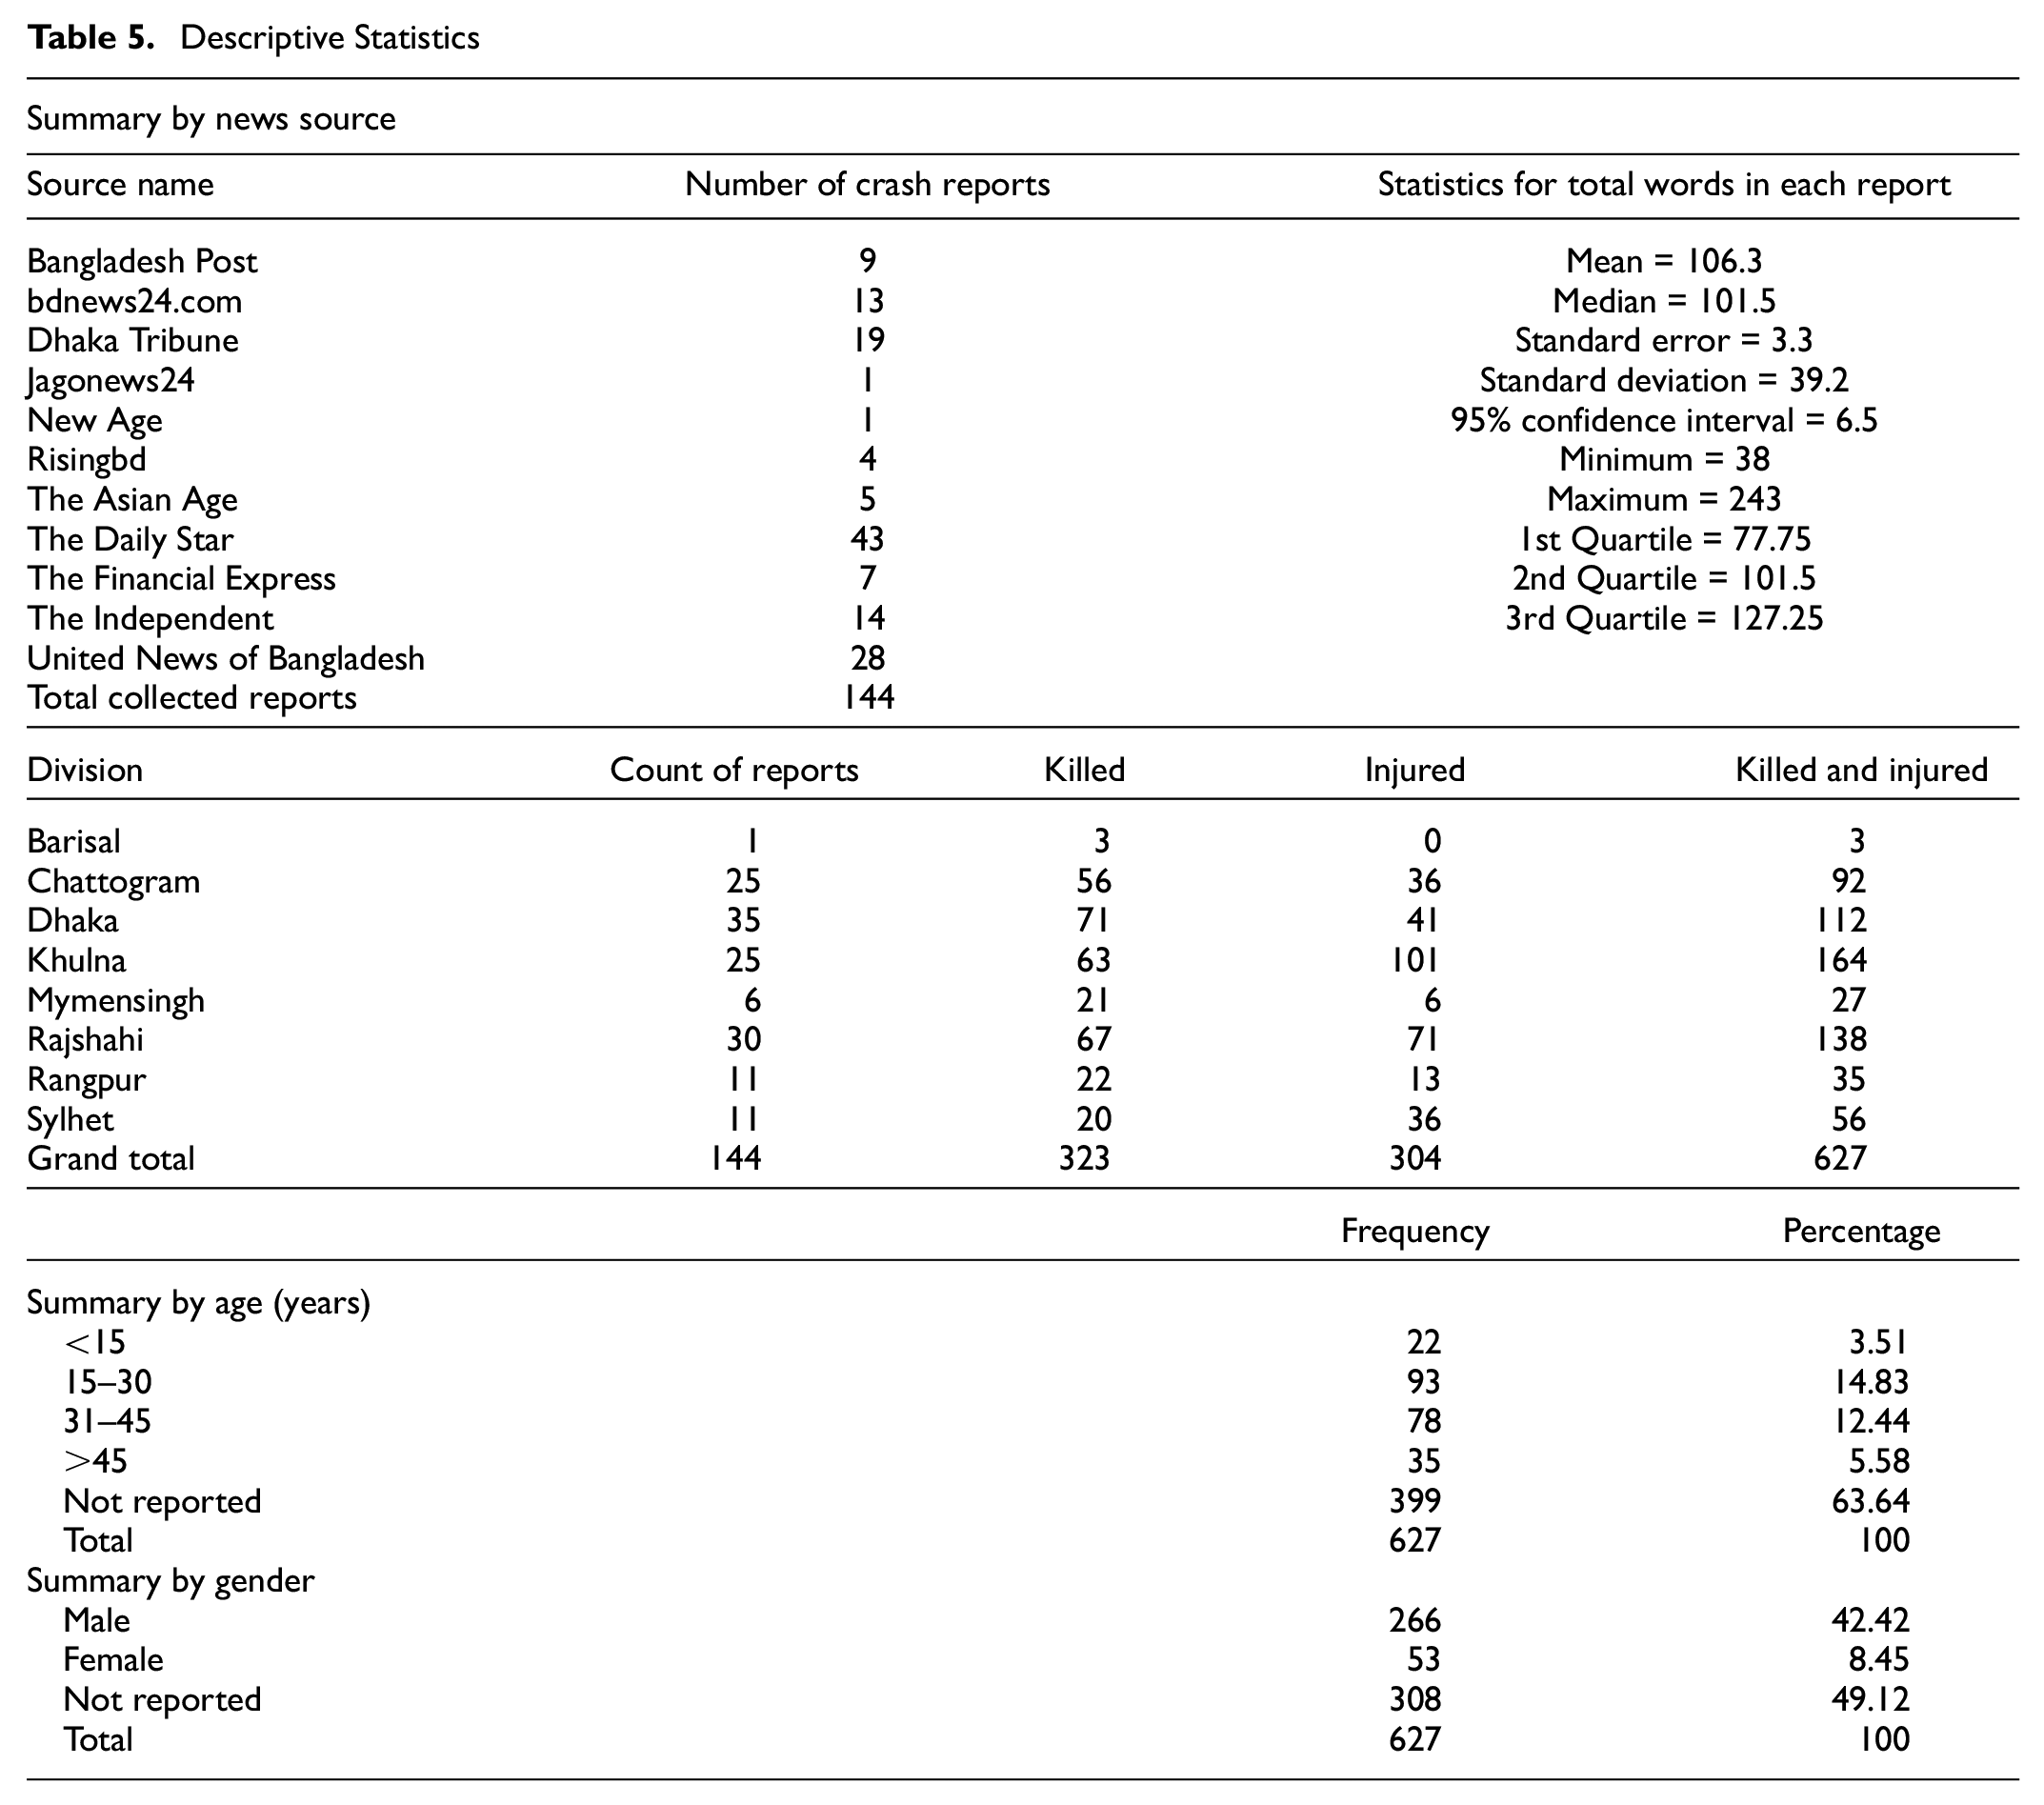
Figure 3 shows the spatial distribution of truck-involved fatalities and injuries in Bangladesh. The top five districts in which truck-involved fatalities and injuries occurred were Jhenaidah (84), Sylhet (44), Bogra (40), Dhaka (36), and Jashore (35).
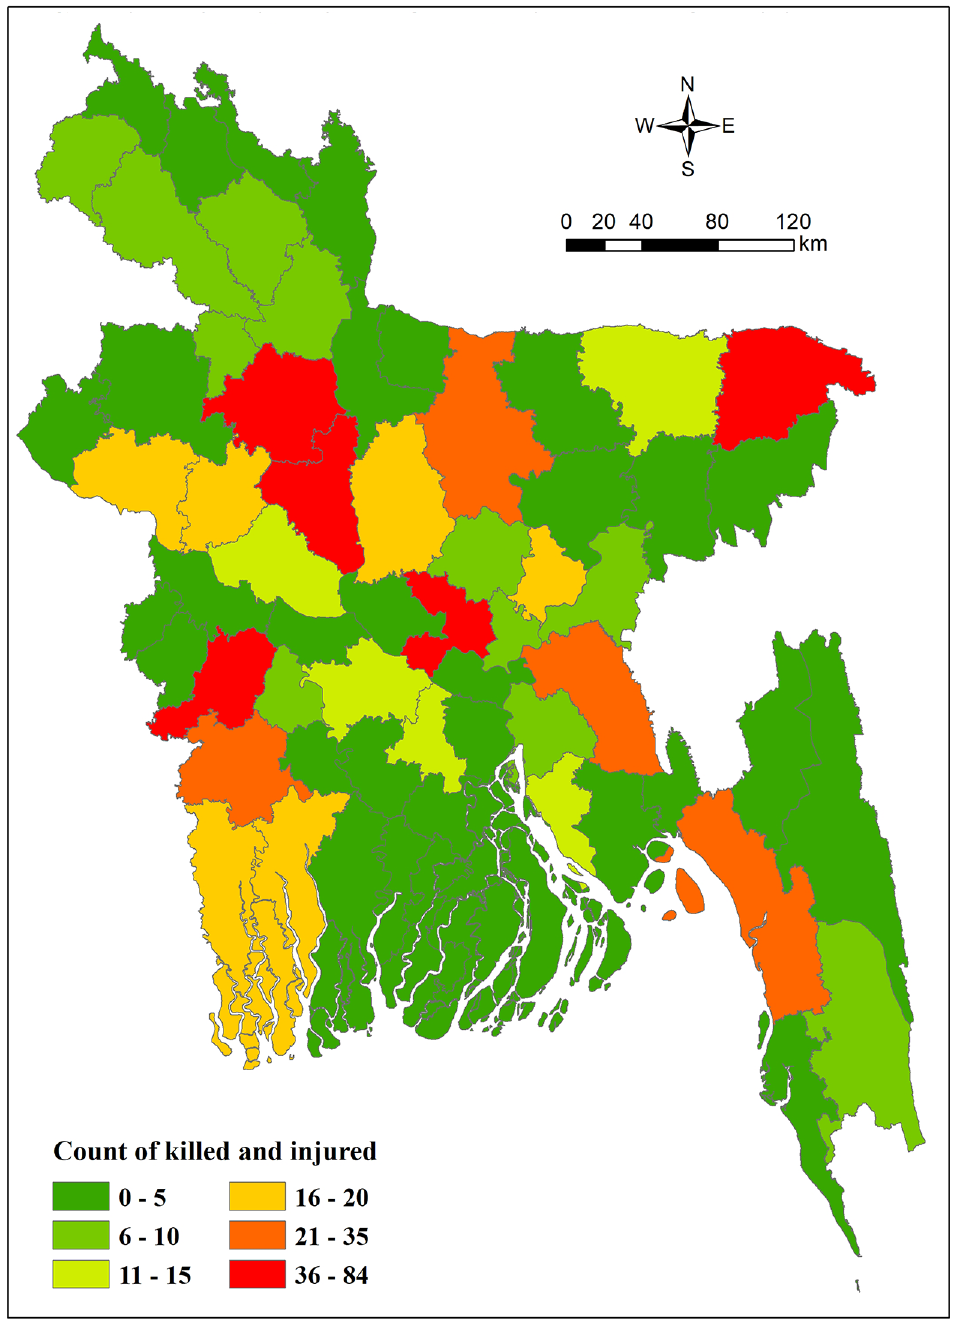
Spatial distribution of fatalities and injuries in truck-involved crashes in Bangladesh (2021).
To understand the temporal variation of truck-involved fatalities and injuries during 2021, a time-series graph is plotted (Figure 4). The term “ratio” in the graph indicates the proportion of the total killed and injured in all traffic crashes divided by the killed and injured in truck-involved crashes. The ratio of truck-involved crashes was found to be higher during February (63.3%), April (61.5%), and October (51.4%). For total crashes, peaks are observed in July and September. Since the Eid (the biggest Muslim celebration) holiday is celebrated in July, more crashes occur throughout this month. This is in line with a recent investigation by the Al Jazeera news network ( 63 ). In addition, more crashes are reported at the beginning and end of the year, probably because of the foggy weather conditions during those times of the year. This is consistent with a recent study in Bangladesh, which identified that adverse weather conditions significantly increase the likelihood of fatalities and severity of crashes ( 64 ). One possible explanation is that fog obscures drivers’ vision of the road, making it difficult to assess the distance between vehicles ahead ( 65 ).
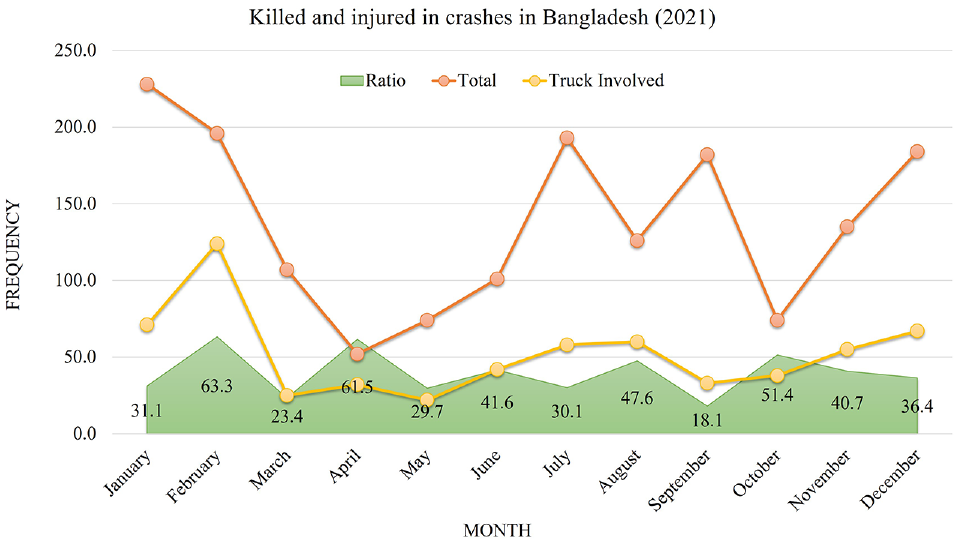
Temporal variation of truck-involved and total crashes (reported in online news).
Results and Discussion
TF-IDF Results
In this analysis, a total of 144 crash reports (i.e., documents) were utilized, which consist of a total of 15,300 words (i.e., terms). After preprocessing, only 1950 words remained. Therefore, the final matrix used for the analysis consists of 144 rows and 1950 columns with a total of 280,800 elements or cells. Only 7234 out of these total 280,800 cells had non-zero entries. Therefore, the sparsity of this TDM was found to be 97.42%, suggesting that 97.42% of the 280,800 cells had zero entries.
Word Cloud Analysis
The quantitative analysis of keywords was done using word cloud analysis to provide a visual representation of crash narratives. Figure 5 shows the word cloud with the 150 most frequently used words in the reported truck-involved crashes in online news in Bangladesh. Note that the bigger the letters of the word in the picture, the more often it occurs in the text. For example, “police,”“said,”“upazila,”“injured,”“accident,”“highway,”“deceased,”“killed,”“station,” and “hospital” are some of the most frequent words in the reports. The general findings of this word cloud analysis are truck-involved crashes causing injuries and fatalities, police involvement in the crash scene for investigation, and transportation of crash victims to the medical college hospital.
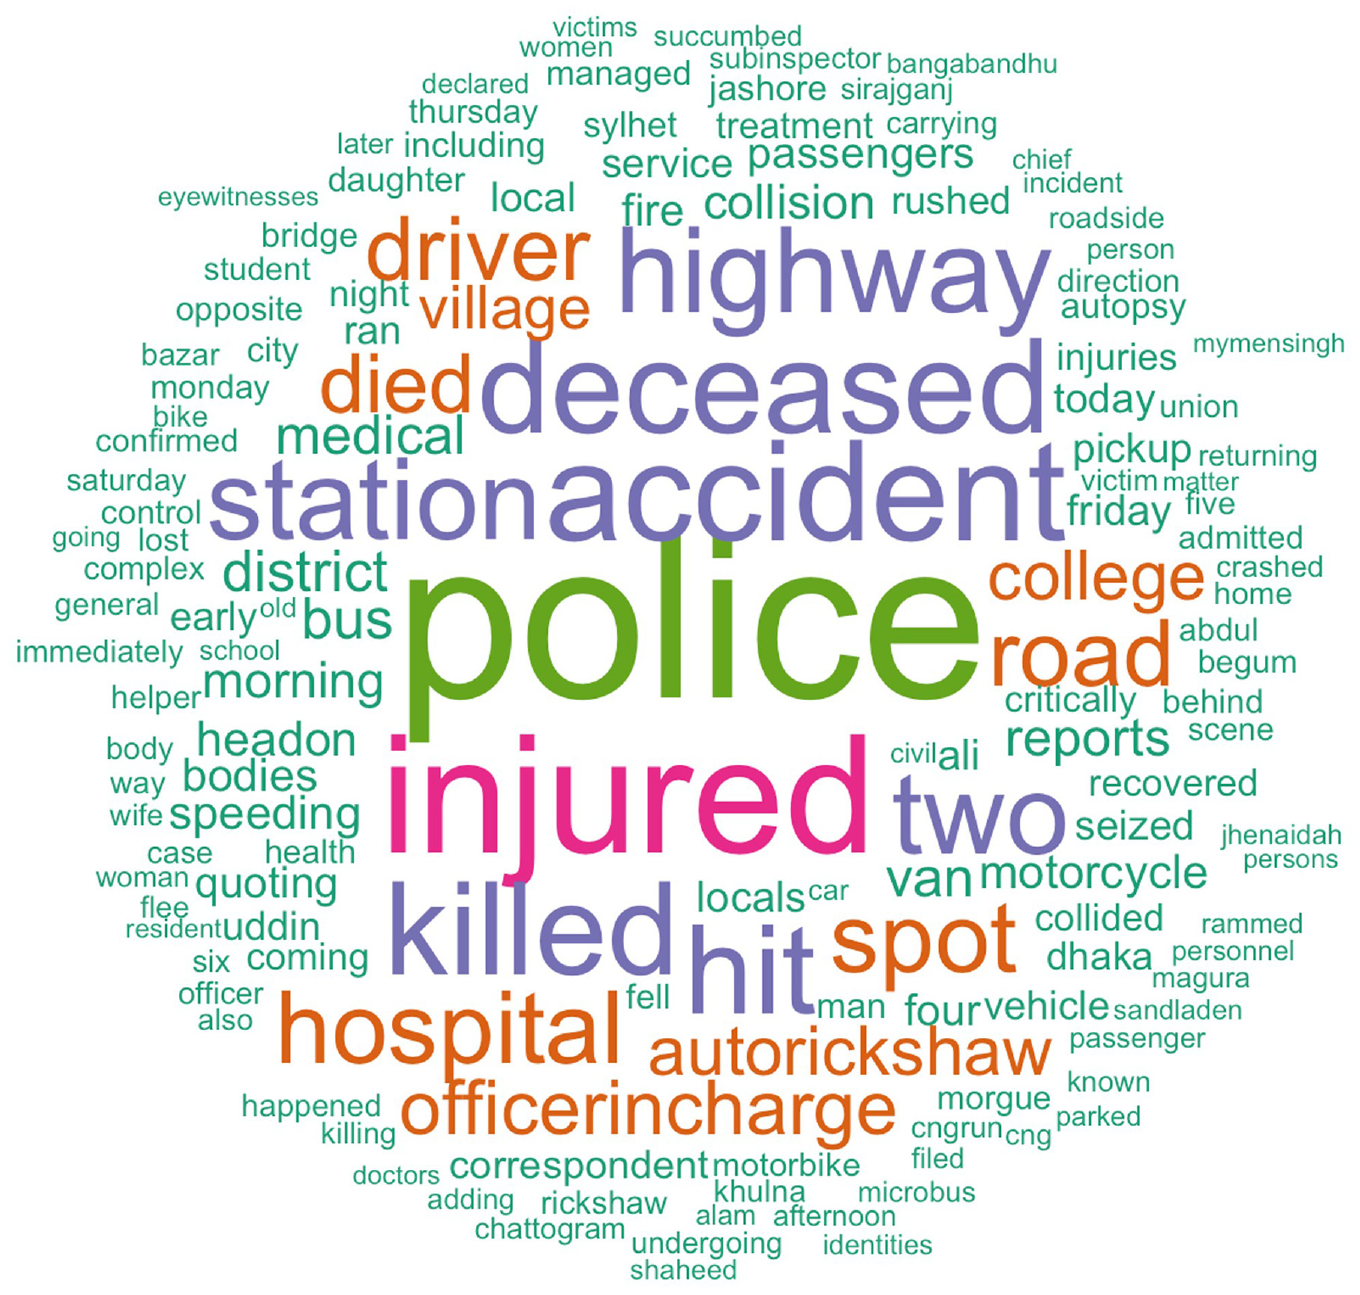
Word cloud analysis.
Word Frequency Analysis
To identify the frequency associated with words, a bar plot is provided (Figure 6).
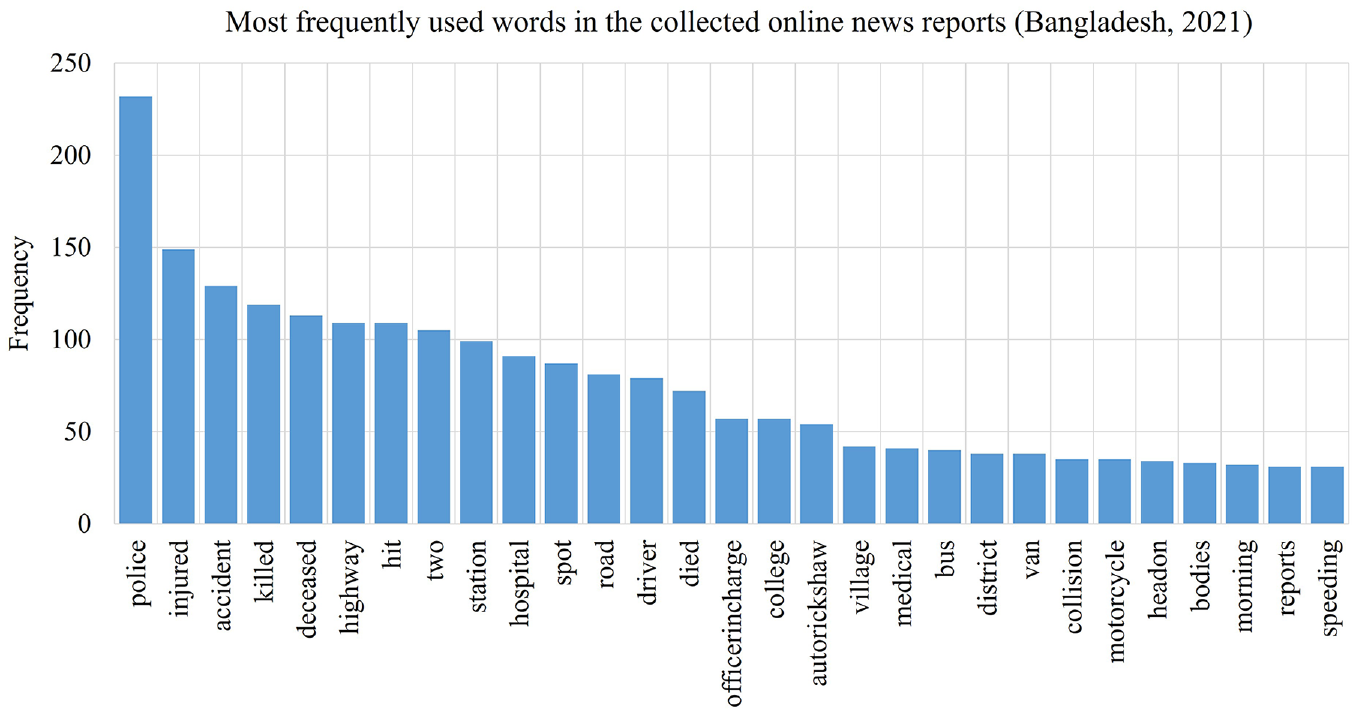
Word frequency bar plot (arranged in ascending order).
Note that a minimum frequency level is specified over which the words are included in the bar plot, allowing for the discovery of intriguing words related to truck-involved crashes. For example, the minimum frequency threshold was set as 30. Therefore, any words that appeared at least 30 times in the bag of words were included in the bar plot.
There are a total of 29 words in the above bar plot. The top five most frequent words in the above bar plot are police (232 times), injured (149 times), accident (129 times), killed (119 times), and deceased (113 times). The bar plot also contains some useful information about vehicle type, manner of collision, and time of the day. For example, four different vehicle types appeared in the above bar plot, namely auto-rickshaw (54 times), bus (40 times), van (38 times), and motorcycle (35 times). This implies that the majority of fatal truck-involved crashes occurred because of collisions with buses, motorcycles, auto-rickshaws, and vans. The term “head-on” was used 34 times, indicating that head-on collisions were the primary cause of the majority of truck-related crashes. The word “speeding” appeared 31 times, suggesting that speeding is one of the crash contributing factors for truck-involved crashes. The word “morning” appeared 32 times, which suggests that morning hours were the most common time for truck-related crashes.
Word Co-occurrence Network Analysis
The word co-occurrence network (WCN) is a key tool for visualizing the relationships among words that appear together in a sentence. Figure 7 shows the WCN plot for truck-involved crashes.
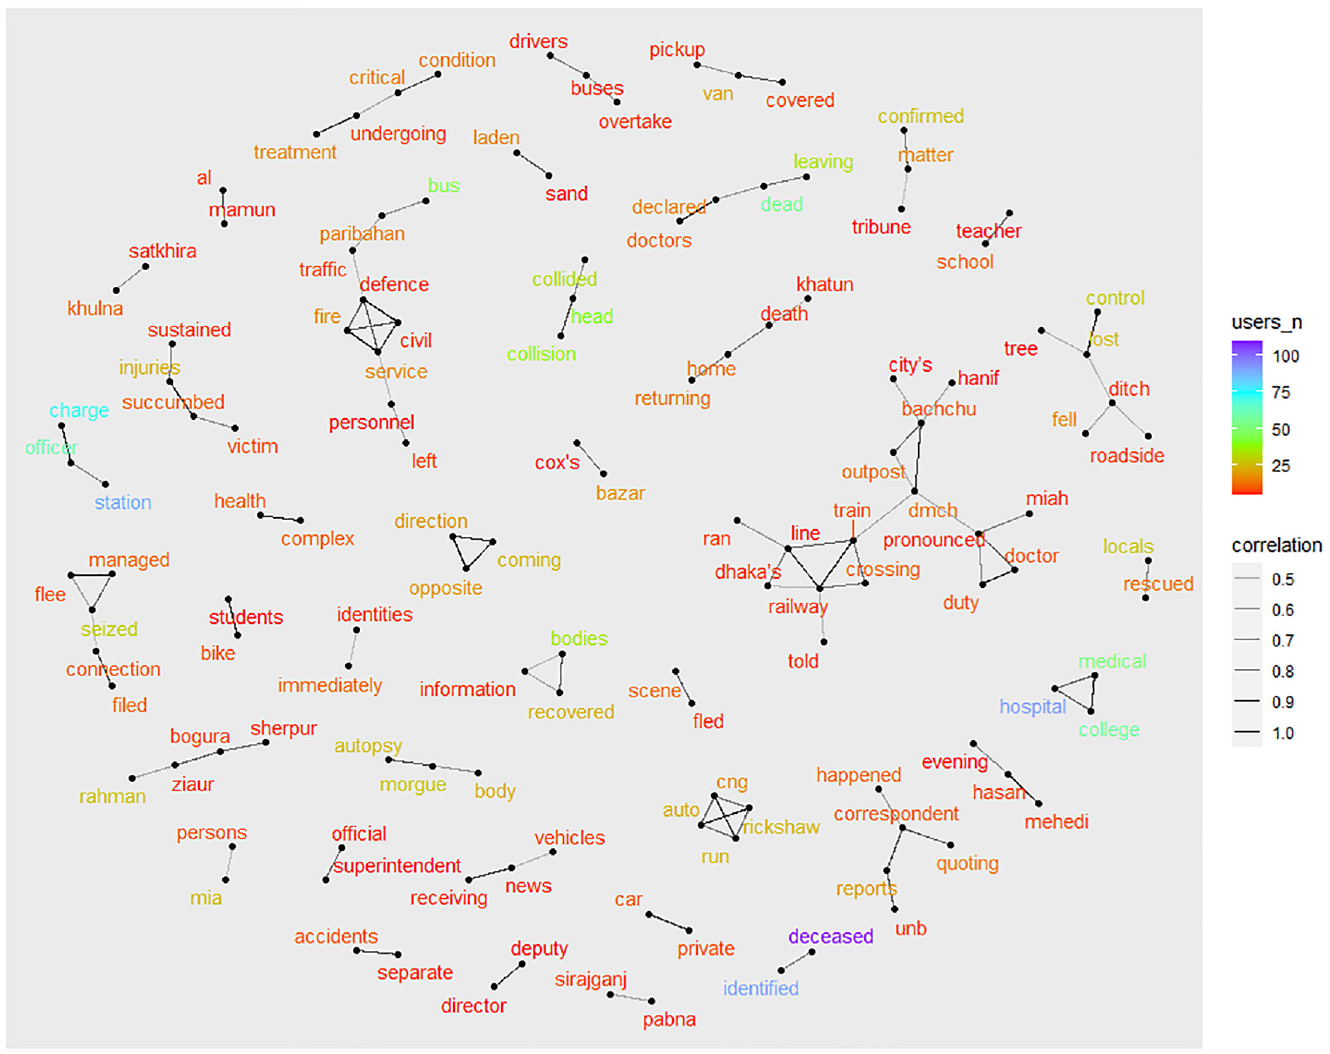
Word co-occurrence network (WCN) plot for truck-involved crashes.
The WCN is created by joining the vertices of n consecutive words in a sentence. Two important parameters (n, ϕ) are required to produce a WCN plot. The parameter “n” represents the minimum number of users (reports in this case) who used these words. The parameter “ϕ” indicates the minimum correlation among consecutive words. The value of these parameters was set as n = 5 and ϕ = 0.40 after several trial-and-error runs. The selection of these parameters is based on subject matter experience and the identification of meaningful patterns. Some of the meaningful co-occurrences of terms selected from the above WCN plot are explained below.
A link is visible around the words “head,”“collision,” and “collided.” This indicates that the majority of truck-involved crashes in Bangladesh occur because of head-on collisions with other vehicles. Another link is observed among the words “coming,”“opposite,” and “direction.” Therefore, “coming from opposite direction” and “head-on collision” are two important sequences of events in truck-involved crashes.
Another link is spotted around the words “train,”“line,”“railway,”“crossing,”“ran,” and “told.” This indicates a crash scene involving a train and truck at the railway crossing. In Bangladesh, fatal crashes at railroad crossings occur frequently, as most of them are left unauthorized or unattended.
The connection among the words “lost,”“control,”“tree,”“fell,”“roadside,” and “ditch” indicates a series of events in truck-involved crashes.
A link is observed among the words “buses,”“drivers,” and “overtake,” suggesting that “overtaking” is an important crash contributing factor in truck–bus crashes.
The words “fled” and “scene” are connected (ϕ = 0.56), possibly pointing to a hit-and-run crash involving truck drivers. The words “managed,”“flee,” and “seized” are linked similarly in another instance, implying two distinct scenarios: (a) truck drivers who managed to flee and (b) truck drivers who were seized while attempting to flee.
The correlation coefficient between the words “bike” and “students” was found to be 0.73. This implies a collision involving students on motorcycles and trucks.
The network plot also offers some important details with respect to the type of vehicles involved in truck-related crashes in Bangladesh. Some of these crash-involved vehicles are compressed natural gas (CNG) auto-rickshaws (a link is observed among “cng,”“auto,”“rickshaw,” and “run”), covered vans/pickups (a link is observed among “covered,”“van,” and “pickup”), sand-laden trucks (a link is observed between “sand” and “laden”), and private cars (a link is observed between “private” and “car”).
Some of the crash locations/routes were also identified in the network plot, including Cox’s Bazar (ϕ = 0.53), Bogura–Sherpur (ϕ = 0.55), Pabna–Sirajganj (ϕ = 0.43), and Khulna–Satkhira (0.44).
Rapid Automatic Keyword Extraction
The RAKE algorithm identified a total of 4102 keywords. The distribution of these keywords is as follows: 1-gram (2500), 2-gram (1131), 3-gram (292), 4-gram (118), 5-gram (27), 6-gram (26), 7-gram (6), 8-gram (1), and 9-gram (1). In general, 2-gram (consisting of two words) provided the most useful information. The research team reviewed all of the 1131 keywords and identified key factors that were most likely to have played a role or were associated with the truck crashes. Figure 8 shows keywords (selected 2 grams) extracted by the RAKE process.
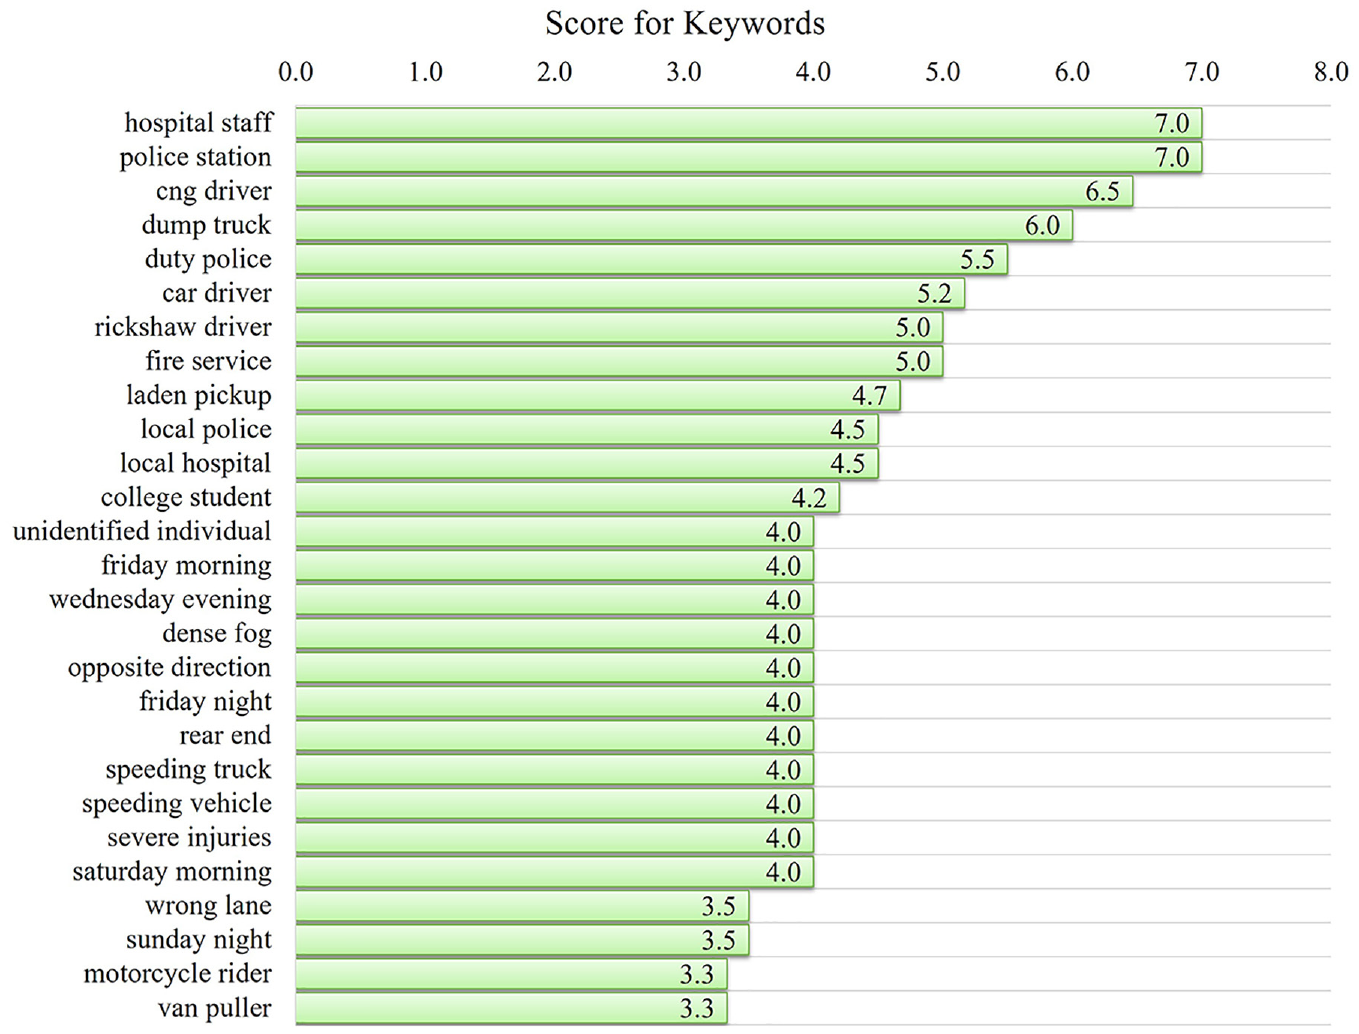
Rapid automatic keyword extraction for truck-involved crashes.
Note that the notation “s” represents the “score” of the keywords. In Bangladesh, police, medical, and fire service personnel frequently respond to crash scenes. Some of the keywords that support this statement include hospital staff (s = 7), police station (s = 7), duty police (s = 5.5), fire service (s = 5), local police (s = 4.5), and local hospital (s = 4.5). The drivers of different vehicle types were found to be associated with the truck-involved crashes, including cng drivers (s = 6.5), car drivers (s = 5.2), rickshaw drivers (s = 5), and van pullers (s = 3.3). In addition, the involvement of other vehicles (dump trucks and laden pickups) was observed in crashes involving trucks. The time of the day was also identified as an important factor in truck-involved crashes. Some of the examples of different times of the day were Friday morning (s = 4), Wednesday evening (s = 4), Friday night (s = 4), Saturday morning (s = 4), and Sunday night (s = 3.5). The “dense fog” keyword (s = 4) was identified, suggesting that poor environmental conditions play a role in truck-involved crashes. In crashes involving trucks, driver behavior also makes a substantial contribution. For example, “speeding truck” (s = 4), “speeding vehicle” (s = 4), and “wrong lane” (s = 3.5) keywords were identified. The majority of truck-involved crashes occur with vehicles coming from the opposite direction (s = 4).
Topic Modeling Results
The research team utilized the LDA algorithm for topic modeling. One important step in the LDA technique is to select the number of topics. The research team used the “coherence score” as a measure to select the optimum number of topics. The plot of the coherence score against the number of topics is provided below (Figure 9).
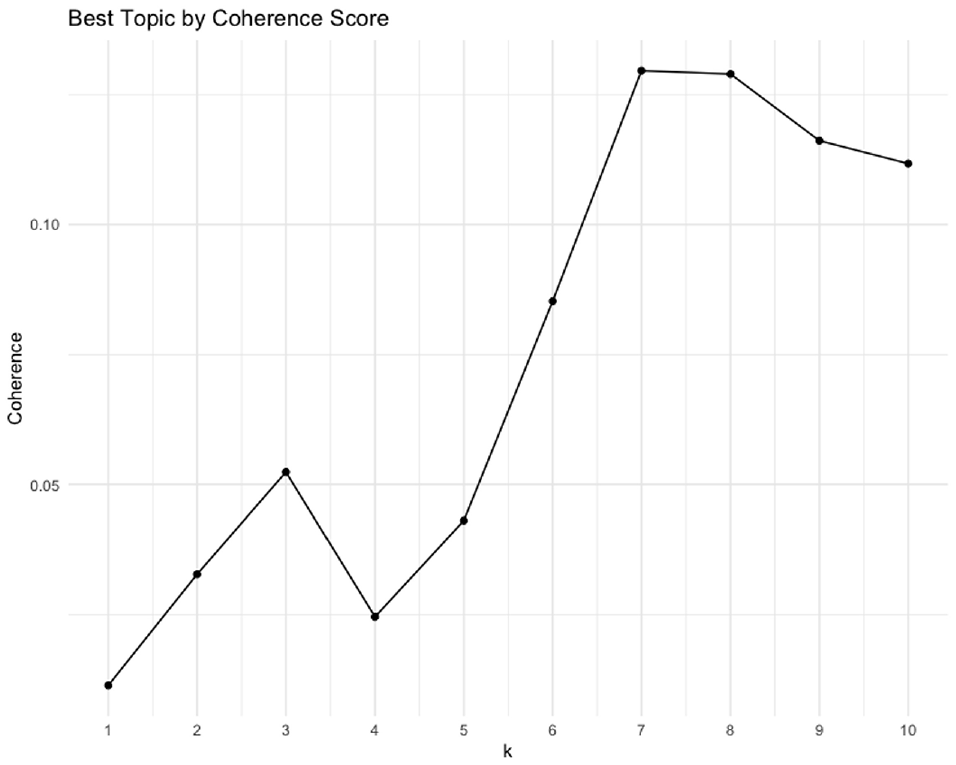
Selection of the optimum number of topics by coherence score.
The plot reveals that k = 7 provides the highest coherence score. The results obtained from topic modeling after setting k = 7 are provided in Figure 10. Note that most of the topics include the word “police,” suggesting their involvement in the investigation of truck-involved crashes. Some other useful findings from the topic modeling are provided below.
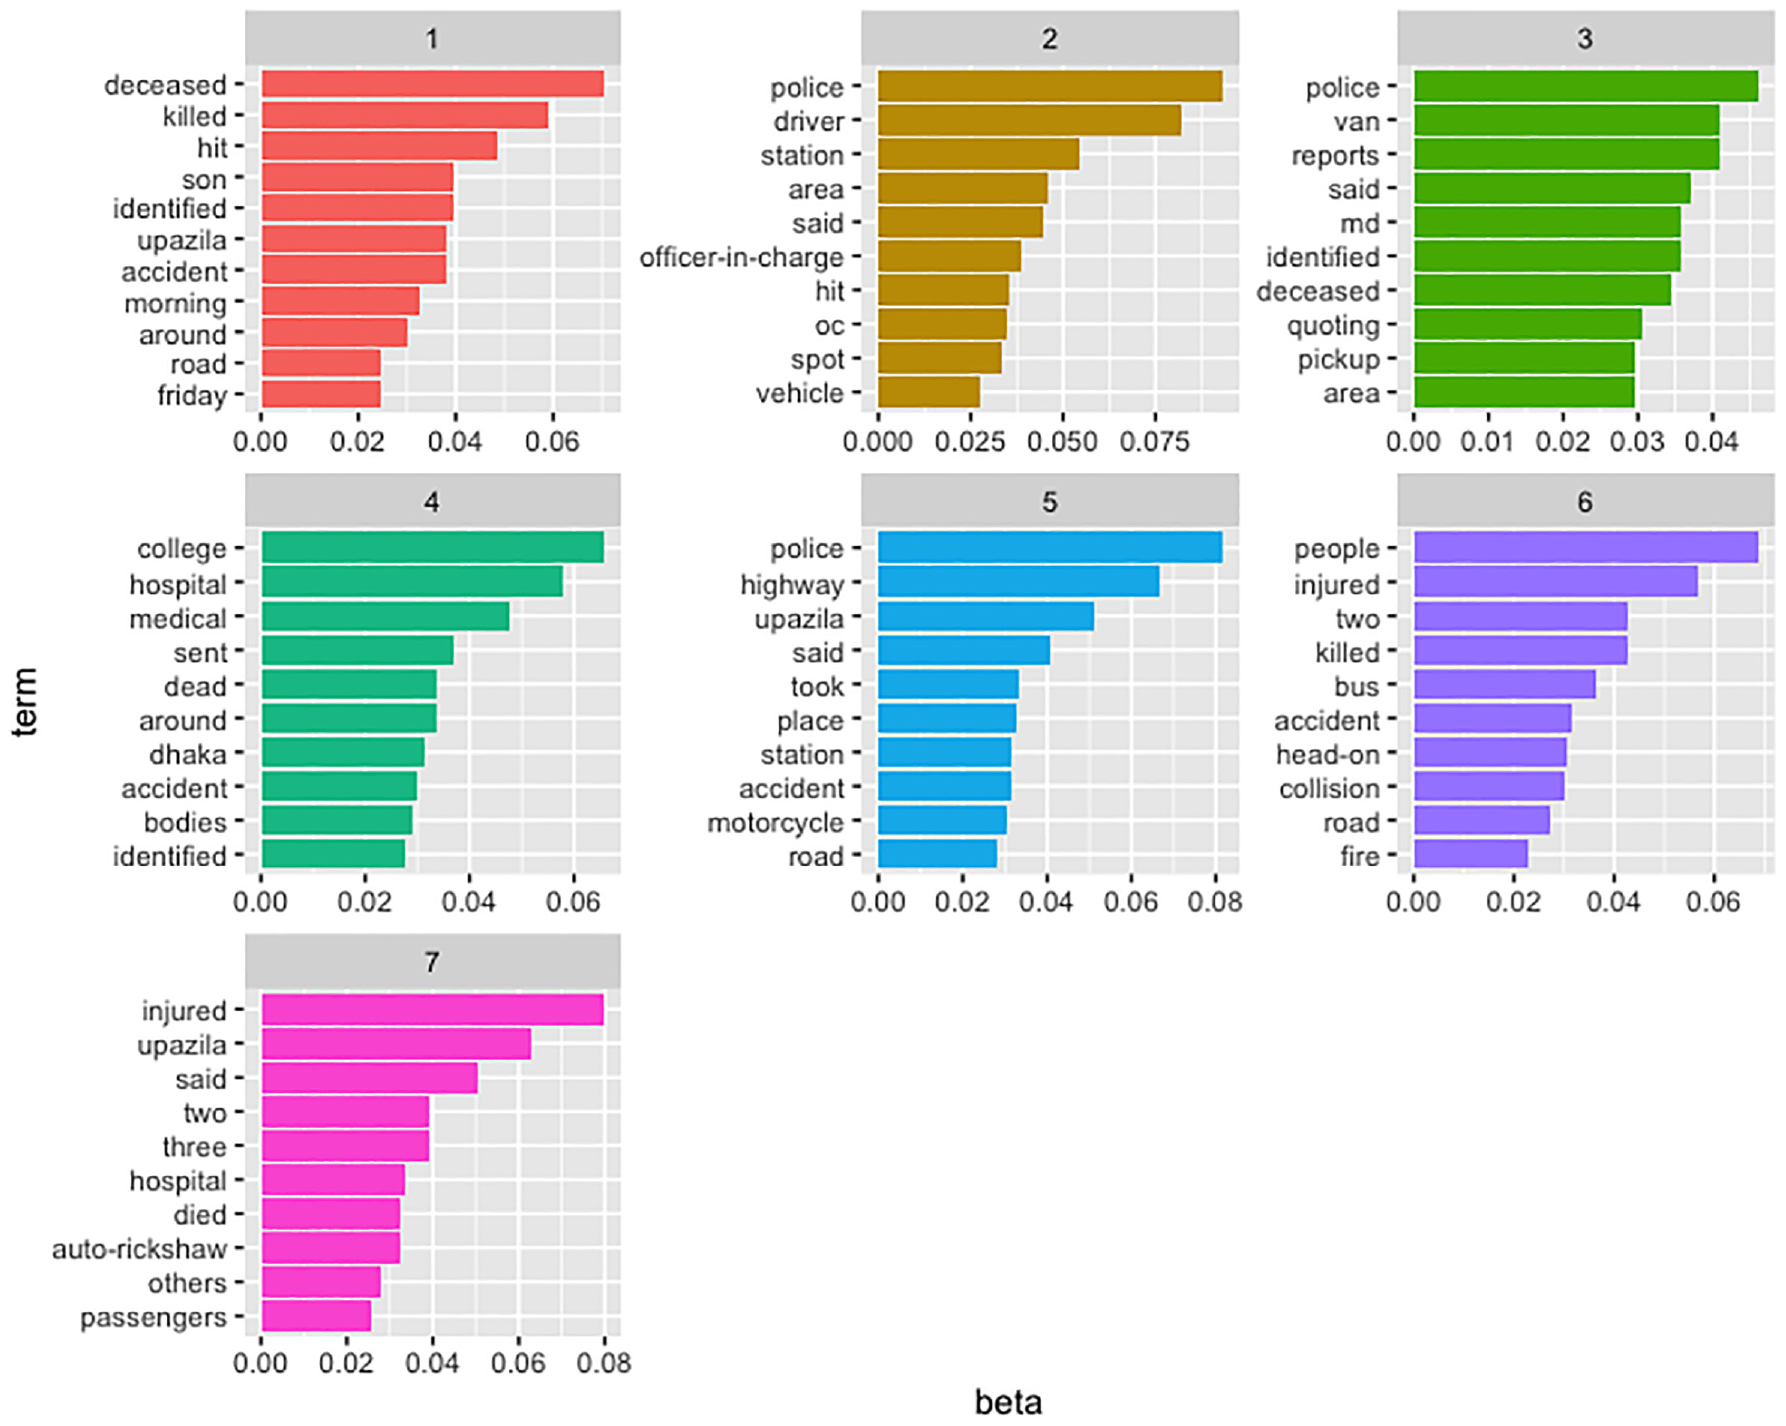
Identified topic models for truck-involved crashes.
Discussion
The findings of the present study on truck-related crashes in Bangladesh provide valuable insights into the contributing factors and patterns of these crashes. In addition, studies conducted in the U.S.A. have indicated that a variety of factors contribute to truck-involved crashes, including driver fatigue, distracted driving, speeding, and inadequate training and supervision of drivers ( 66 – 69 ). The Federal Motor Carrier Safety Administration (FMCSA) found that driver fatigue contributed to approximately 13% of large truck crashes in the U.S.A. ( 70 ). It has also been reported that trucks with higher safety ratings are less likely to be involved in crashes ( 71 ). Despite that the specific contributing factors may differ between countries, the overall implications of these studies are similar. The authors emphasize the importance of addressing driver behavior, vehicle safety, and infrastructure concerns to reduce the number of truck crashes. As part of efforts to address these issues, regulations have been enacted in the U.S.A., including the Hours of Service (HOS) rule, which limits the number of hours a driver can work each day or week, and the Electronic Logging Device (ELD) mandate, which requires drivers to electronically document their hours of driving. There is some evidence in Bangladesh that addressing the issue of drivers’ licenses versus the number of registered vehicles may be the key to reducing the number of truck-related crashes.
The results of research on truck-involved crashes in developed and developing countries suggest that to develop effective strategies and policies to reduce the occurrence of these crashes, it is essential to understand the contributing factors and patterns of these crashes. The following is a summary of a few of the major findings of this study.
EDA suggests that most of the fatal truck-involved crashes occurred in the Khulna division and Jhenaidah district. Temporal patterns suggest that a higher number of crashes occur at the beginning and end of a year. This can be attributed to several factors, such as there being more social events and celebrations during the holidays, which result in driving under the influence, as well as adverse weather conditions during the winter, fatigue from vacations, and the rush to meet deadlines at the end of the year. The risk of road crashes increases when these factors are combined.
The word cloud analysis identified some of the most frequent words in the reports, including “police,”“injured,”“accident,”“highway,”“deceased,”“killed,”“station,”“hospital,” and so on. The general findings of this word cloud analysis are truck-involved crashes causing injuries and fatalities, police involvement in the crash scene for investigation, and transportation of crash victims to the medical college hospital.
The word frequency analysis provided some useful information, such as the kinds of vehicles involved (auto-rickshaw, bus, van, and motorcycle), the manner of collision (head-on, speeding), and the time of the day (morning).
“Coming from opposite direction” and “head-on collision” are two important sequences of events in truck-involved crashes. “Overtaking” is an important crash contributing factor in truck–bus crashes.
Several other crash scenarios were identified, including “a train and truck at the railway crossing” and “students in bike and truck.” This indicates that vulnerable roadway user risk and crossing-related issues need to be addressed with appropriate guidance and effective countermeasures, respectively.
The “dense fog” keyword was identified, suggesting that poor environmental conditions play a role in truck-involved crashes. This is consistent with a recent study ( 64 ) that emphasized inclement weather as a major factor in the severity of collisions during the winter season.
Wrong-way driving (WWD) was identified as a factor contributing to truck-involved crashes. To tackle this, “wrong way” signs can be a useful tool to alert truck drivers.
Some of the crash locations/routes were also identified in the network plot, including Cox’s Bazar (ϕ = 0.53), Bogura–Sherpur (ϕ = 0.55), Pabna–Sirajganj (ϕ = 0.43), and Khulna–Satkhira (0.44). Transportation agencies can focus on these specific routes.
Topic modeling suggested several important crash scenarios, including “a truck-involved crash occurring on Friday morning resulting in fatalities,” a “crash scene involving a van with a pickup truck,”“involvement of motorcycles in truck-involved crashes”, “a crash scenario between bus and truck involving in a head-on collision,” and “a crash scenario between an auto-rickshaw and truck and the injured passengers were taken to the hospital.” These crash scenarios can be utilized as an “exposure pattern” in educational campaigns.
Conclusion
The study analyzed fatal truck-involved crashes in Bangladesh using crash reports collected from several online news portals. The database consists of a total of 144 fatal truck-involved crash reports (bag of 15,300 words) collected between January 2021 and December 2021. Several text mining tools were utilized, including word cloud analysis, word frequency analysis, WCN analysis, RAKE, and topic modeling. Along with the findings in this study, the identification of in-depth crash contributing factors can assist in appropriate countermeasure selection and policy/regulation development. According to Bangladesh Road Transport Authority (BRTA) statistics ( 72 ), there are currently 292,000 drivers with heavy and medium driving licenses in the country. However, the total number of registered heavy and medium vehicles is now 423,000 in the country. The huge discrepancy between the number of registered vehicles and the number of driving licenses potentially suggests the root cause of the truck-involved crashes. Drivers without a legal license are more likely to drive recklessly and pay less attention to traffic laws and regulations. To address road crashes, the Bangladeshi government must first concentrate on this license issue. Furthermore, future research on truck-related crashes in Bangladesh can go extensively into these licensing challenges.
There are several practical solutions and implications that can be considered to reduce the number of fatal truck-involved crashes in Bangladesh. Some of these solutions include location-specific interventions, seasonal interventions, crash scenario-specific interventions, and education campaigns. To implement location-specific interventions, interventions can be tailored to the Khulna division and the Jhenaidah district, where the majority of fatal truck crashes occur. Several measures can be taken to accomplish this, such as enforcing traffic rules more strictly, improving road infrastructure, and promoting awareness campaigns for truck drivers and other road users. To address the factors that contribute to crashes during the holiday season, seasonal interventions should be implemented. Several countermeasures can be implemented to address specific crash scenarios, including addressing vulnerable road users’ risk at railway crossings, addressing crossing-related issues, and utilizing “wrong way” signs to address WWD. Disseminating information about specific crash scenarios and ways to avoid them can be used in education campaigns to promote safe driving practices and create awareness. Further research should investigate the effectiveness of these interventions, identify additional factors contributing to truck-involved crashes, and use machine learning algorithms for predictive analysis to inform targeted interventions. Lastly, it is important to examine the economic implications of truck-related crashes, including medical treatment costs, property damage, and lost productivity.
Research Contribution
This research has two major contributions. In the absence of a reliable and current crash database in Bangladesh, the idea of using Google news alerts and text mining tools will help other researchers to investigate crash patterns. Also, the identified crash patterns and contributing factors for truck-involved crashes will help policymakers identify problem-specific crash countermeasures.
Limitation
The research team’s reliance on crash reports collected over a 12-month period limits the scope of their findings. Conducting data collection for extended periods would likely reveal more intriguing crash patterns. Furthermore, the availability of the database is restricted to online websites that are based on the English language. To enhance future studies, it is recommended to include the Bangla news portal. To get a clear understanding of the context, the research team further reviewed a few Bangla and English news articles and focused on reported accidents. We found similarities between the crashes reported by both language newspapers. Interestingly, the newspapers in Bangladesh have both Bangla and English versions to cover both national and international audiences. For example, the newspaper named “Prothom Alo” (link: https://www.prothomalo.com/) has both Bangla and English versions. Therefore, the same crash is expected to be reported by both the Bangla and English versions of the newspaper. The inclusion of the Bangla language newspaper is expected to be a redundant process of data collection and may end up reporting the same crash in both versions. Based on this observation, the research team decided not to include any Bangla version of the newspaper. It is worth noting that online news portals generally offer generic information with respect to crashes without delving into the in-depth technical details of the contributing factors. The identification of generic crash reporting practices in online news portals in Bangladesh suggests the need for additional research to explore the underlying reasons and potential avenues for improvement.
Footnotes
Acknowledgements
The research team would like to acknowledge the assistance of the internet news portals from which the database was gathered.
Author Contributions
The authors confirm contribution to the paper as follows: study conception and design: A. Hossain; data collection: S. Alam; analysis and interpretation of results: A. Hossain, S. Das; draft manuscript preparation: A. Hossain, X. Sun, S. Alam, S. Das, A. Sheykhfard. All authors reviewed the results and approved the final version of the manuscript.
Declaration of Conflicting Interests
The author(s) declared no potential conflicts of interest with respect to the research, authorship, and/or publication of this article.
Funding
The author(s) received no financial support for the research, authorship, and/or publication of this article.