
Abstract
This research aims at providing more information concerning the performance of public transport means that exist in most underdeveloped countries from an environmental and economic perspective. This study compares autorickshaws, motorcycles, 14-passenger, and 29-passenger minibuses. A cradle-to-grave life cycle assessment (LCA) and a life cycle cost analysis (LCC) for passenger transportation were carried out. The LCA analysis was carried out using the Center of Environmental Science, Leiden University (CML-IA) baseline impact assessment method. A cost model was developed to analyze the purchase, maintenance, and operation costs of passenger transportation. The LCA results reveal that in an informal transport system, lower-capacity vehicles have a better environmental performance per passenger-kilometer than higher passenger-capacity vehicles during off-peak hours. In the LCC analysis, motorcycles were revealed to be the most cost-inefficient alternative. Both LCA and LCC results show that the operational stage owing to fuel consumption has the highest impact on the environment and economy. To decrease the environmental and economic impacts of the transportation system, the first action should be focused on the operational stages of these types of vehicles.
Keywords
In many underdeveloped countries, especially those in Sub-Saharan Africa, South America, and some parts of Asia, road transport serves as the primary mode of passenger transportation. Notably, various low-passenger capacity modes are prevalent in these regions. For instance, autorickshaws and motorcycles dominate the transportation landscape in numerous Asian countries, while minibuses with limited passenger capacity are the preferred choice in many African nations ( 1 ). Informal modes access areas of the city that cannot be easily reached by formal modes such as bus rapid transit or light rail transit. Besides, these public transportation services are an essential driver to achieve urban development; however, they create a series of challenges mainly environmental, economic, and social ( 2 ). Informal modes of transport lack infrastructure such as terminals, parking stops, and restrooms among others, which causes them to park anywhere along the roads and drop off and pick up passengers anywhere along the roads. This inconveniences other road users, causing traffic congestion. Most of the modes are old and lack technology that monitors and controls emissions. Failure to monitor emissions results in high levels of greenhouse gases and air pollution with detrimental environmental impacts. It is essential to recognize that these informal transport modes exert direct and indirect impacts on the environment. The direct effects, such as fuel consumption and emissions, are relatively straightforward to monitor. However, the indirect consequences, including impacts on human health and the consumption of natural resources, require a more comprehensive assessment.
One of the most popular methods of monitoring those impacts is life cycle assessment (LCA). Using LCA, the resources consumed, emissions produced, and other exchanges involved in the collection of primal matter, energy production, product utilization, and product disposal, are quantified ( 3 ). In most LCA studies, battery electric vehicles (BEV) were the most non-polluting. In many studies, BEVs were compared with compressed natural gas (CNG) vehicles, diesel, and gasoline internal combustion engine vehicle (ICEV), hydrogen fuel cells plus liquefied petroleum gas vehicles ( 4 – 8 ). To consider all the impacts of public transportation, many studies conducted a cradle-to-grave LCA approach ( 9 – 15 ). Some studies focused on the impact of public transport considering the type of vehicle and passenger capacity ( 16 – 18 ).
Equally, road transport systems have low barriers of entry, but they come with high maintenance costs for both vehicles and infrastructure. This is attributed to the relatively short lifespan of vehicles: typically less than 10 years. When evaluating these factors in the context of sustainable transportation, it’s essential to consider the lifetime costs of these services from a life cycle perspective. These costs are summed up using life cycle cost analysis (LCC) analysis ( 19 ). The dominant costs covered in the transport related LCC studies include vehicle purchasing price, energy consumption cost, maintenance, and repair ( 20 – 22 ). Majority of the LCC studies compared vehicles based on the type of energy they use, that is, hybrid (HEV), BEV, and ICEV ( 23 – 25 ). However, some studies compared vehicles according to their size and type, for example, Khan and Arshad ( 26 ) analyzed the economic impact of buses, wagons, and taxis. Krelling and Badami ( 27 ) stated that the fuel price and fuel economy are critical costs and affect the LCC of vehicles and affect new technologies in comparison to diesel ICEVs. Therefore, the low purchase price and the low operational and maintenance cost of ICEVs are the main reasons ICEVs perform better than vehicles that operate on other fuels such as BEV, CNG, and others ( 28 , 29 ).
Many of the studies in road passenger transportation have concentrated on either LCA or LCC. In the literature, it has been observed that the number of studies dealing with LCA and LCC together is quite low. These studies were carried out by Petrauskienė et al. ( 30 ), Bekel and Pauliuk ( 31 ), França et al. ( 32 ), and Bibire et al. ( 33 ). In Petrauskienė et al. ( 30 ), BEV, HEV, and ICEVs were compared, and ICEVs had the most negative environmental impacts. The LCC results showed that BEVs and diesel ICEVs were more cost-effective as compared with the HEV and gasoline ICEVs. In Bibire et al. ( 33 ), the combination of both LCA and LCC enabled decision makers to choose an environmentally beneficial and cost-effective service. Therefore, this study fills two gaps.
Four specific and different types of vehicles have been assessed economically and environmentally.
While these modes of transport exist in developed countries as transport modes, in underdeveloped countries they are specialized in providing mass passenger transportation just like the underground train system. Accordingly, this study aims to contribute an extensive analysis of this transportation system which was lacking in the literature.
The hypothesis of this study is that the underdeveloped regions of the world, particularly Sub-Saharan Africa and certain parts of Asia, possess unique transportation systems that align with the lifestyles and urbanization patterns of their populations.
From this motivation, this study aims to:
identify the dominant modes of transport in underdeveloped countries and to build an inventory of the materials consumed and produced by the dominant unique modes of transport found in the underdeveloped countries throughout their lifetime;
compare the economic and environmental impacts of the transport modes under study; to contribute to the joint analysis of LCA and LCC of the transportation system, by which the potential to reduce the environmental burdens and economic costs of these informal vehicles can be achieved; to find out the impact of passenger demand on the environmental performance of the modes under study;
provide recommendations for enhancing the performance of the informal low-capacity passenger transport system.
While most studies either focus on the type of fuel or on the vehicles of the same design, for example, four-wheeled vehicles, our study, in a unique manner compares vehicles of different types and different passenger capacities. Such vehicles include motorcycles, autorickshaws, 14-passenger minibus, and 29-passenger minibus. Statistics from various studies show that in most Sub-Saharan African cities the majority of the people walk to work. The rest of the people use various available means of transport. Table 1 shows the various means of transport used in different cities. Statistics show that majority of the cities have populations of more than 1 million people. Many African cities rely basically on minibuses of different passenger capacities to provide transportation to such big populations. According to statistics, the four modes of transport chosen in this study were identified as the ones with the highest modal share in most of the underdeveloped countries. These modes transport more than 1 million passengers every day in their respective cities. While transporting passengers they make a significant number of trips throughout the day consuming energy and producing large quantities of emissions daily. Additionally, these informal modes meet a high demand. For example, more than 70 % of transport in Nairobi, Kenya, 65 % of public transportation in Pretoria, South Africa, and 54% of trips in Dhaka, Bangladesh are provided by the informal modes ( 34 ). Therefore, those are the main reasons why these specific modes were chosen in this study. Table 1 shows the modal share of different passenger transport modes in some underdeveloped countries.
The Percentage Share of Different Operating Transport Modes in Various Cities
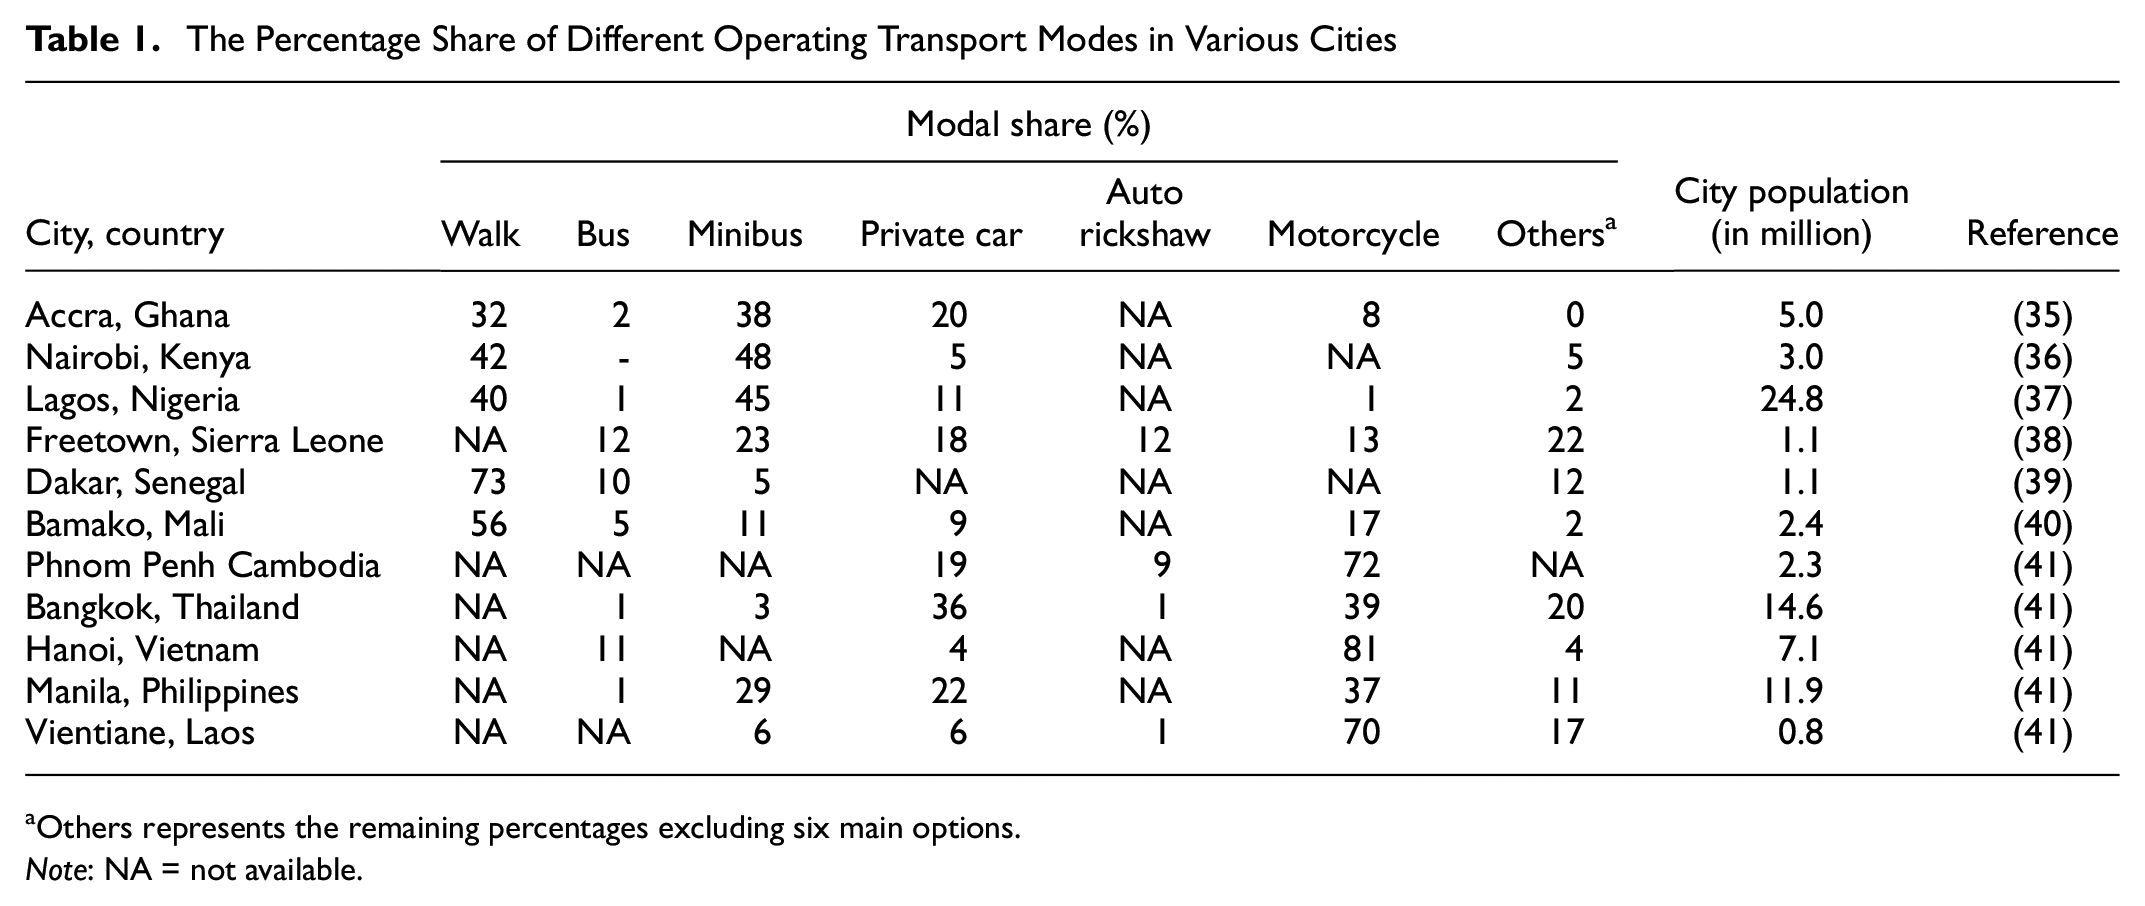
Others represents the remaining percentages excluding six main options.
Note: NA = not available.
In addition to the commonly considered costs in LCC studies such as purchasing cost, fuel cost, taxes, maintenance, and repair, our study takes into consideration the salaries of vehicle drivers. The present study not only estimates the economic impact of transporting an individual passenger but also how environmentally detrimental it is to transport one passenger for a kilometer using a motorcycle, autorickshaw, 14-passenger minibus, and 29-passenger minibus throughout the vehicle’s lifetime. Therefore, this study, provides a basis to compare the modes from not only an environmental but also an economic point of view. Finally, the four vehicles in this study were specifically chosen because of their uniqueness. These vehicles except the motorcycle do not exist in any LCA database, which makes their LCA nearly impossible. The authors present an approach that can be used to assess the environmental impacts of activities and products whose data inventories are hard to access or even unavailable.
This paper starts by explaining the main stages of LCA and LCC, specifically how the methods were executed, how data were obtained, and how they were analyzed. The paper progresses by presenting the findings on the economic and environmental impacts of transporting a passenger for a kilometer using the transport system found in underdeveloped countries. The paper ends with a discussion of the findings, what they reveal about the transport system under study, and suggested measures to ensure the efficiency of the transport system.
Materials and Methods
In this study, an LCC and a cradle-to-grave LCA approach were implemented. The framework of this study is given in Figure 1. This section describes how the stages of LCA and LCC are implemented, how data is obtained, and how it is calculated to yield results for recommendation purposes. Although most of the data were obtained from Ugandan sources, we try to generalize our research for it to represent countries that are on the same level as Uganda or are slightly higher than Uganda as regards economic development.
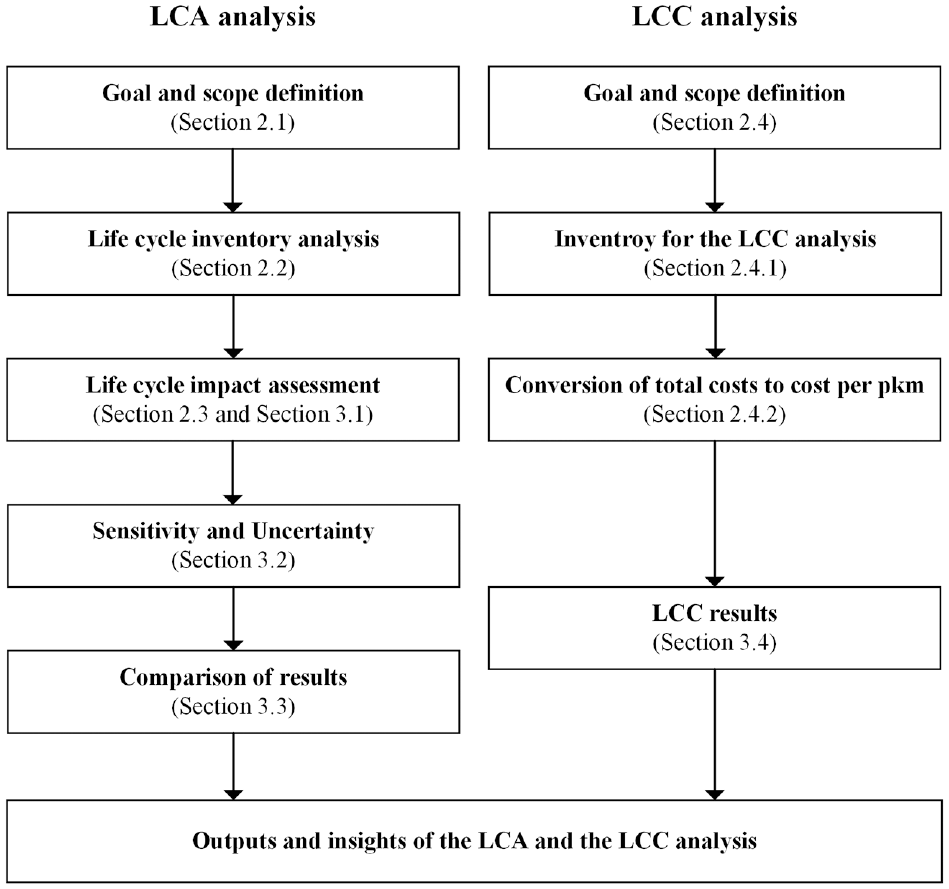
Framework of the study.
Goal and Scope
This study evaluated the environmental performance of passenger transportation in underdeveloped countries using four different ICEVs from cradle to grave. The system boundaries in Figure 2 include raw material extraction, energy production, vehicle manufacturing, shipment, operation, maintenance and repair, and end-of-life. The functional unit is to transport 1 passenger 1 km, stated as “passenger-km (pkm)”.
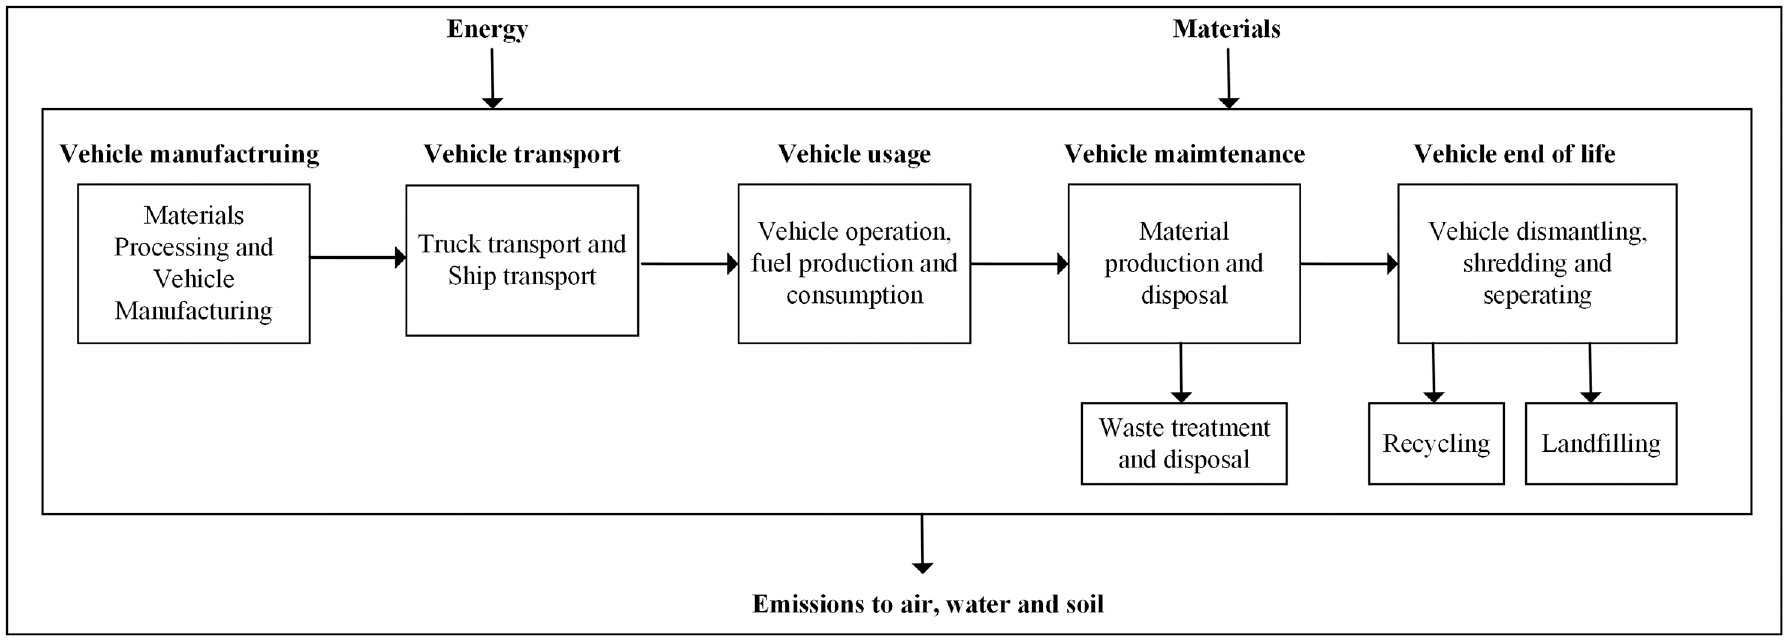
System boundaries for this life cycle assessment (LCA) study.
Life Cycle Inventory Analysis
Based on ISO 14040 ( 42 ) and ISO 14044 ( 43 ) standards, life cycle inventory (LCI) analysis was performed, and the data used were obtained mainly from the Ecoinvent database v3.3 and literature sources. The vehicles discussed in this study differed only with reference to passenger capacities, dimensions or weights, lifespans, and the type of fuel used. LCA analysis was carried out to calculate the environmental impacts of transportation in the city, considering the different public transportation vehicles currently used on the same roads, routes, and at the same time. It is also assumed that these vehicles operate when they are fully loaded with passengers. Although this assumption was the base scenario, this study carried out a sensitivity analysis where several scenarios were assessed to find out the performance of the transport means when the passenger load capacities are altered.
Vehicles selected for evaluation consist of a 29-passenger diesel minibus weighing 3,700 kg; a 14-passenger diesel minibus weighing 1280 kg; a 3-passenger gasoline autorickshaw with a weight of 388 kg; a motorcycle, weighing 108 kg.
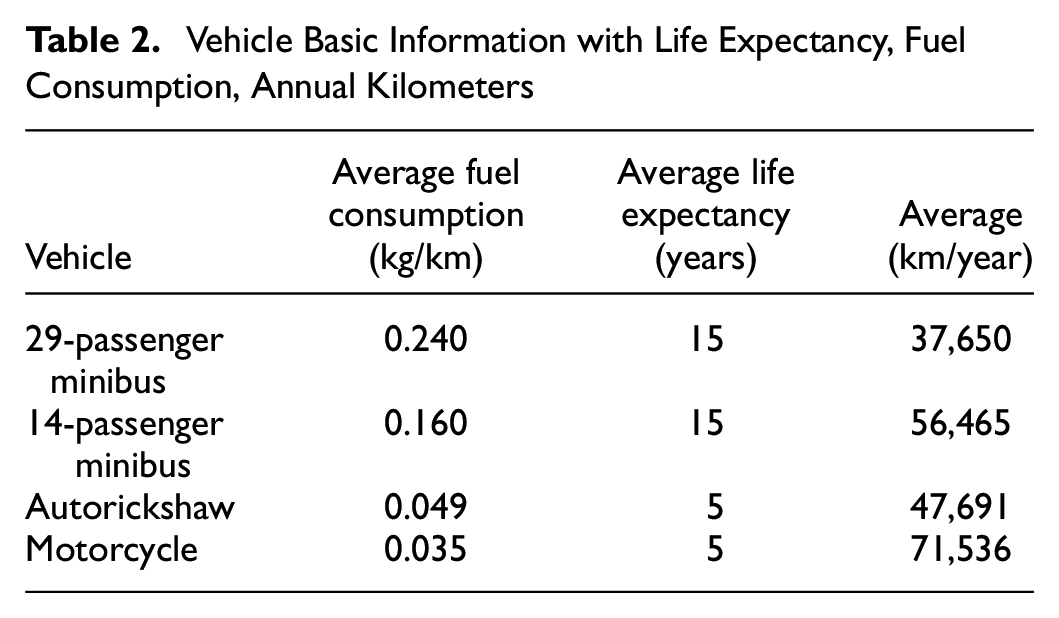
The type of fuel consumed, and the number of passengers carried by the mentioned vehicles, information concerning their fuel consumption rates, longevity, and annual covered distance is very essential while making estimations. This information was obtained from vehicle operators through questionnaires. This information was analyzed and summarized in Table 2.
Vehicle Basic Information with Life Expectancy, Fuel Consumption, Annual Kilometers
Vehicle Manufacturing
During this phase, LCI data for vehicle manufacturing were obtained from both the Ecoinvent database v3.3 and literature studies related to a particular vehicle. All the vehicles under evaluation in this study could not be found in the Ecoinvent database in their exact form, others such as the minibuses and the autorickshaw were not even available in the database. For this reason, the vehicles in the database that were already available were modified to resemble the vehicles under scrutiny mainly based on weight. It is important to note that this study included impacts of the infrastructure needed in manufacturing a vehicle.
The vehicles that were modified through calculations included the Volvo 8500 bus (weight of vehicle is 11,000 kg, consuming about 0.40 kg of diesel per km) for the minibuses, and the 50-cc scooter (weight of vehicle is 90 kg, consuming 0.03 kg of gasoline per km) for the autorickshaw and motorcycle. The modification was executed using Equation 1.

where Matsv is the number of requirements needed for the production of a specific vehicle, Mateiv the amount of material (kg) used to produce the Ecoinvent database vehicle to be modified, Wtsv weight of a specific vehicle among those considered in this study, Wteiv the weight of the Ecoinvent database vehicle to be modified.
Some information such as that in Table ESM1 (in the supplementary material) about amounts of material required to manufacture specific components of the modes of transport under scrutiny was obtained from the literature. All the data which were not obtained from the literature except that of motorcycles were estimated using Equation 1. Table ESM1 specifies how the data concerning the manufacture of specific components of the vehicle were obtained.
Vehicle Transport
In this study, vehicles were imported from China to Uganda, an underdeveloped country found in sub-Saharan Africa. More information concerning the shipment of the vehicles is provided in the supplementary material.
Vehicle Usage
Inventory data on fuel production and vehicle tailpipe emissions is given in this section. LCI for diesel and gasoline production used by selected vehicles was based on data provided by Ecoinvent database v3.3. In this study, all stages of fuel production in the Ecoinvent database v3.3 were considered for diesel and gasoline production.
Since the database does not contain the low-passenger-capacity minibuses and the autorickshaw used in this study, three methods were used to calculate the values for the major emissions and pollutants. Firstly, considering the assumption that vehicles within the Indian road transportation system are not much different from those for developing countries, the results of the study conducted by the Central Pollution Control Board-Ministry of Environment, Forest and Climate Change of India-CPCB (44) on specifically carbon monoxide (CO), nitrogen oxides (NOx), and particulate matter (PM) emitted by vehicles similar to those in this study were accepted. Numerical values for hydrocarbon (HC) emissions were obtained from the Indian emission report ( 44 ). Secondly, emissions specifically non-methane volatile organic compound (NMVOC), nitrous oxide (N2O), and ammonia (NH3), were calculated according to the EMEP/EEA air pollutant emission inventory guidebook ( 45 ). Here, the exhaust emissions of vehicles were calculated by multiplying fuel consumption and emission factor per km according to vehicle type ( 45 ). Table ESM2 and Table ESM3 show the fuel consumption of the vehicles considered in this study. It is important to note that emissions from tire and brake wear were not considered. Table 3 shows the main emissions from vehicles.
Main Pollutants Emitted by Motor Vehicles
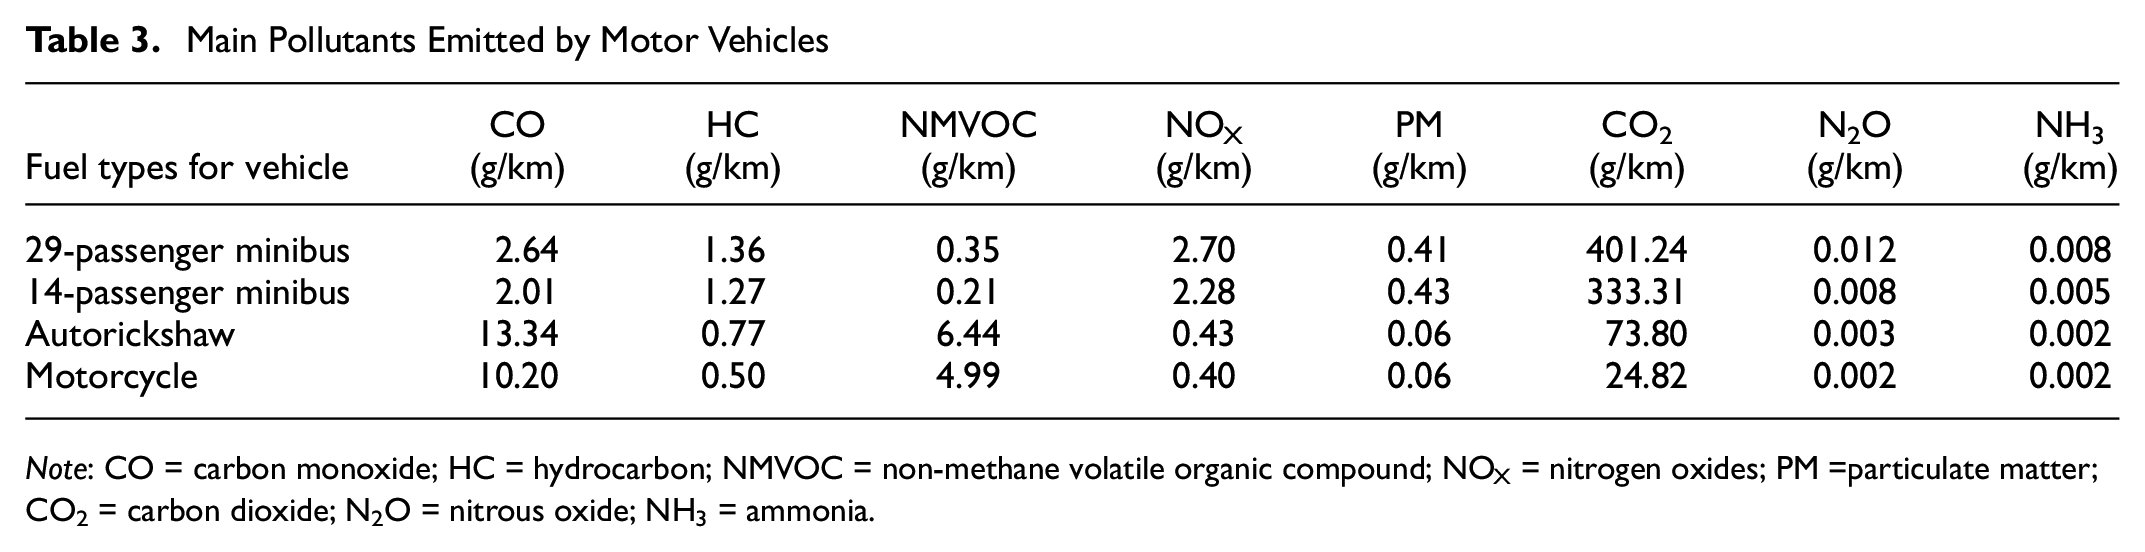
Note: CO = carbon monoxide; HC = hydrocarbon; NMVOC = non-methane volatile organic compound; NOX = nitrogen oxides; PM =particulate matter; CO2 = carbon dioxide; N2O = nitrous oxide; NH3 = ammonia.
Thirdly, besides the emissions in Table 3, the numerical values of the rest of the emissions were obtained by modifying the data in the Ecoinvent database using Equation 2.

where Pollutantsv is the number of pollutants per km produced by a specific vehicle, Fuelsv the amount of fuel per km consumed by a specific vehicle among those under study (29-passenger minibus, 14-passenger minibus, autorickshaw, or motorcycle), Pollutanteiv the number of pollutants per km produced by the modified Ecoinvent database vehicle corresponding to a specific vehicle among those under study, Fueleiv the amount of fuel per km consumed by the modified Ecoinvent database vehicle corresponding to a specific vehicle out of those under study. For example, the scooter provided by the Ecoinvent database consumed 0.0252 kg of gasoline per kilometer, and because of this consumption, it releases different amounts of pollutants which are presented in the database. Conversely, a motorcycle considered in this study consumes 0.038 kg of gasoline per kilometer. To find out the amounts of emissions produced by a motorcycle, the emissions produced by the scooter provided by the Ecoinvent consuming 0.0252 kg of gasoline are expressed with reference to the amount of fuel consumed by a motorcycle considered in this study per kilometer.
Diesel production is based on “low sufur in regional storage”, while gasoline production is based on gasoline, two-stroke blends, and gasoline in regional storage. In this study, the energy and emissions involved in the building and operation of road infrastructure were not considered.
Vehicle Maintenance
In this study, materials (such as steel, aluminum, lead, high-density polyethylene, and rubber), energy (natural gas, electricity, and fuel oil), and other resources including tap water, and lubricating oil were consumed during vehicle maintenance. This study also considered wastes produced during vehicle maintenance emissions. These, especially emissions and heat are assumed to be released into the atmosphere while liquid or solid wastes can be incinerated, recycled, or disposed. This study considered the energy consumed during waste treatment. It considered the amount of waste mineral oil, plastics, wastewater, and rubber disposed of in municipal incinerators and wastewater treatment systems. This study gave special emphasis the maintenance of vehicle tires and their disposal after wearing out. It is assumed that tires require more maintenance than any other component of a vehicle. Maintenance of rubber tires was based on the study carried out by Giannouli et al. ( 46 ) as shown in Table ESM4. The Ecoinvent database provided data on the quantity of materials and energy usage besides rubber needed to estimate the amount of material required to maintain a specific vehicle amidst those being focused on in this study. Equation 3 was used to calculate the materials needed to maintain the vehicles under study.

where Maintsv is the amount of material besides rubber needed to maintain a specific vehicle, Mainteiv the amount of material (kg) used to maintain the Ecoinvent vehicle to be modified, Wtsv the weight of a specific vehicle among those considered in this study, Wteiv the weight of the vehicle (in the Ecoinvent database) to be modified.
Vehicle End of Life
Once a bus, motorcycle, or car has completed its useful life, it is going to the waste treatment/disposal stage called end of life (EoL). In the EoL, fluids, batteries, and other hazardous materials are removed. It is hauled to the scrap yard without its dangerous constituents. In the scrap yard, workers dismantle the vehicle completely with the aid of hydraulic tools. Material fractions are divided into metals, recyclable polymers, glass, and non-recyclable constituents during disassembly. Vehicle metallic and dismantled constituents that require shredding, such as rubber and plastic, are conveyed to a shredding mill where they are grinded into smaller pieces. These parts are mainly separated automatically with the aid of magnets and air currents. Magnetic metals and heavy materials are recycled. The remaining constituents, which cannot be recycled, are hauled to landfills for final disposal. Dismantling, shredding, and separating processes consume electricity as input and produce steel, iron, aluminum, polymers, and other materials as output.
In this study, it was assumed that 95% of steel, 85% of polymer, 95% of aluminum, 95% copper and 90% of the glass was recycled based on studies ( 46 , 47 ). The remaining percentages of the materials mentioned were landfilled. Manual disassembly of the 29-passenger minibus, 14-passenger minibus, autorickshaw, and motorcycle required 133.6 kWh, 65.7 kWh, 14.1 kWh, and 3.9 kWh, respectively. Shredding and separation required 370.0 kWh, 182.0 kWh, 38.8 kWh, and 10.8 kWh for the 29-passenger minibus, 14-passenger minibus, autorickshaw, and motorcycle, respectively. Data on manual dismantling and separation of vehicle components were collected from the past studies’ literature. The background system, such as transportation, fuels, recycling, electricity, storage, and avoided burden processes, has been quantified using data from the Ecoinvent database v3.3. At this stage, the benefits of recycling and the effects of dismantling, shredding, and separation are also considered. The benefits of recycling have been subtracted from the total value of the effects of other stages of the considered vehicle life cycle. While dismantling the vehicles, Table ESM5 shows the amounts of material that can be recycled and the amounts that can end up in landfills. The data for the motorcycle were entirely based on the study by Tasala Gradin et al. ( 47 ). Vehicle disassembly and material separation processes are usually energy-intensive, the amounts of energy required to carry out these activities are shown in Table ESM6.
Life Cycle Impact Assessment (LCIA)
The evaluation of the inventory results was made with SimaPro 9.1.0. Ph.D. software using CML-IA baseline v3.03/World 2000 impact assessment method. The impact categories under investigation include the depletion of abiotic resources on an elemental basis (ADP, kg Sb eq.), fossil fuel-based abiotic resources depletion (ADPff, MJ), global warming potential (GWP100, kg CO2 eq.), acidification potential (AP, kg SO2 eq.), eutrophication potential (EP, kg PO4−3 eq.), human toxicity potential (HTP, kg 1,4-DB eq.), toxic effect on the freshwater ecosystem (FAETP, kg 1,4-DB eq.), toxic effect on the land ecosystem (TEP, kg 1,4-DB eq.), photochemical oxidation potential (POP, kg C2H4 eq.), and ozone layer depletion potential (ODP, kg CFC-11 eq.).
Life Cycle Cost (LCC)
This study considered the costs during the whole service life of transporting passengers using motorcycle, autorickshaw, 14-passenger, and 29-passenger minibus. The system boundaries include the vehicle acquisition, the operation, and the maintenance stage. Figure 3 shows the LCC system boundaries. This study was carried out following the guidelines of Petrauskienė et al. ( 30 ). The acquisition stage included the cost of a vehicle purchase; the operation stage included the costs of fuel consumption, municipality fees, stage registration fee, passenger service license fees, and salaries for drivers. The maintenance stage included the costs of tire changes and the costs of periodic maintenance service. The LCC analysis was implemented using data compiled from diverse sources and additional information is given in the section of the LCC supplementary information file.
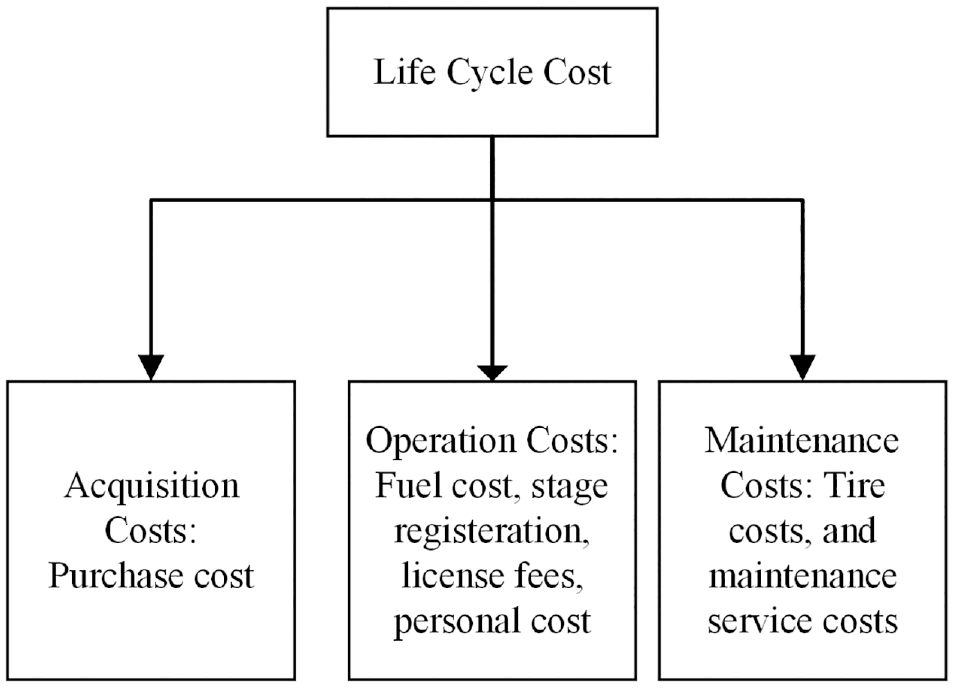
Life cycle cost analysis (LCC) system boundary.
Inventory for LCC Analysis
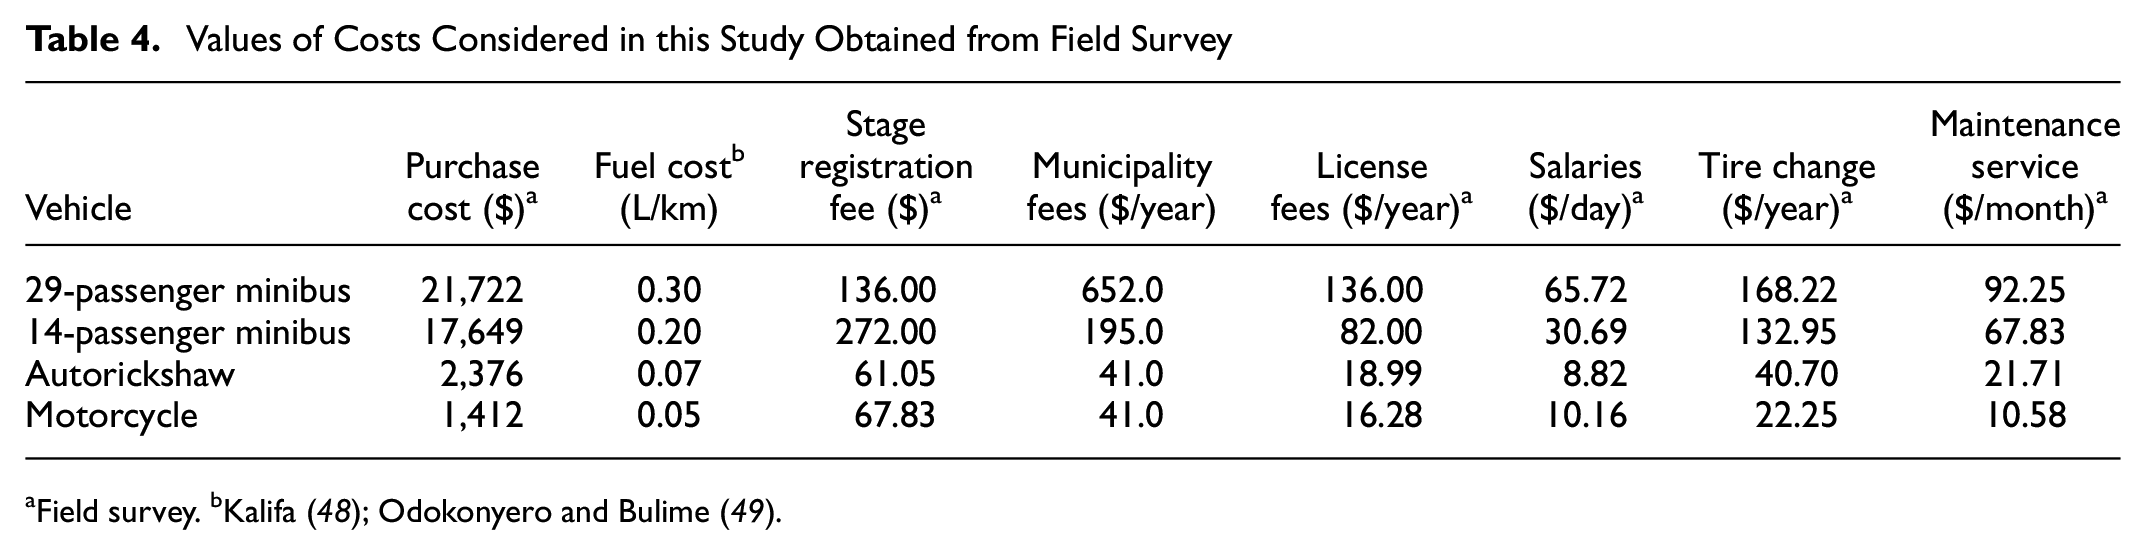
The same vehicles were used in both LCA and LCC analysis; their lifetimes were also kept the same. Field surveys were carried out in Kampala city where the four modes of transport operate. The questionnaire method was used to gather all the information concerning the costs involved in passenger transportation. To improve data accuracy, a large sample of vehicle operators was interviewed, and their responses were recorded, analyzed, and used in this study. Detailed information from the field survey of each cost is shown in Table 4.
Values of Costs Considered in this Study Obtained from Field Survey
Conversion of Total Costs to Cost per pkm
In the present study, the vehicle purchase cost and the stage registration fee are one-time costs. All the other costs considered were calculated relating to the vehicle’s lifetime. Subsequently, the values were converted into costs that reflect the contribution of an individual passenger that travels using a specific vehicle. The conversions for all the costs were executed using the Equation 4.
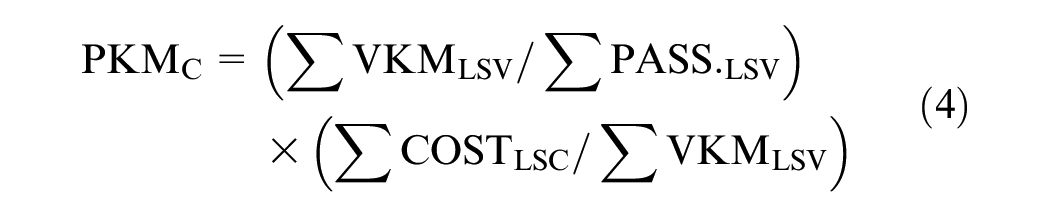
where PKMC means the cost of passenger per km using a specific vehicle, ∑VKMLSV means total lifetime km of a specific vehicle, ∑PASS.LSV means total number of passengers transported by a specific vehicle throughout its lifetime and, ∑COSTLSC means total value of a specific cost throughout the lifetime of a specific vehicle.
Results and Discussions
Life Cycle Impact Assessments
The results of passenger transportation which operates at 100% occupancy level are presented in Table 5. According to the characterization results, the 29-passenger minibus option for public transportation has lower environmental damage than the 14-passenger minibus, autorickshaw, and motorcycle in all impact categories except for abiotic depletion. Figure 4, a to d, presents the percentile contribution of the characterization results into processes in the life cycle (from cradle to grave) of passenger transportation using each vehicle to each impact category. The X-axis shows the percentile contribution of processes (as manufacturing, operation, maintenance, transport, and end-of-life) to passenger transportation options, while the Y-axis represents analyzed environmental impact categories.
Characterization Results with Reference to Passenger-km (pkm) for Vehicles
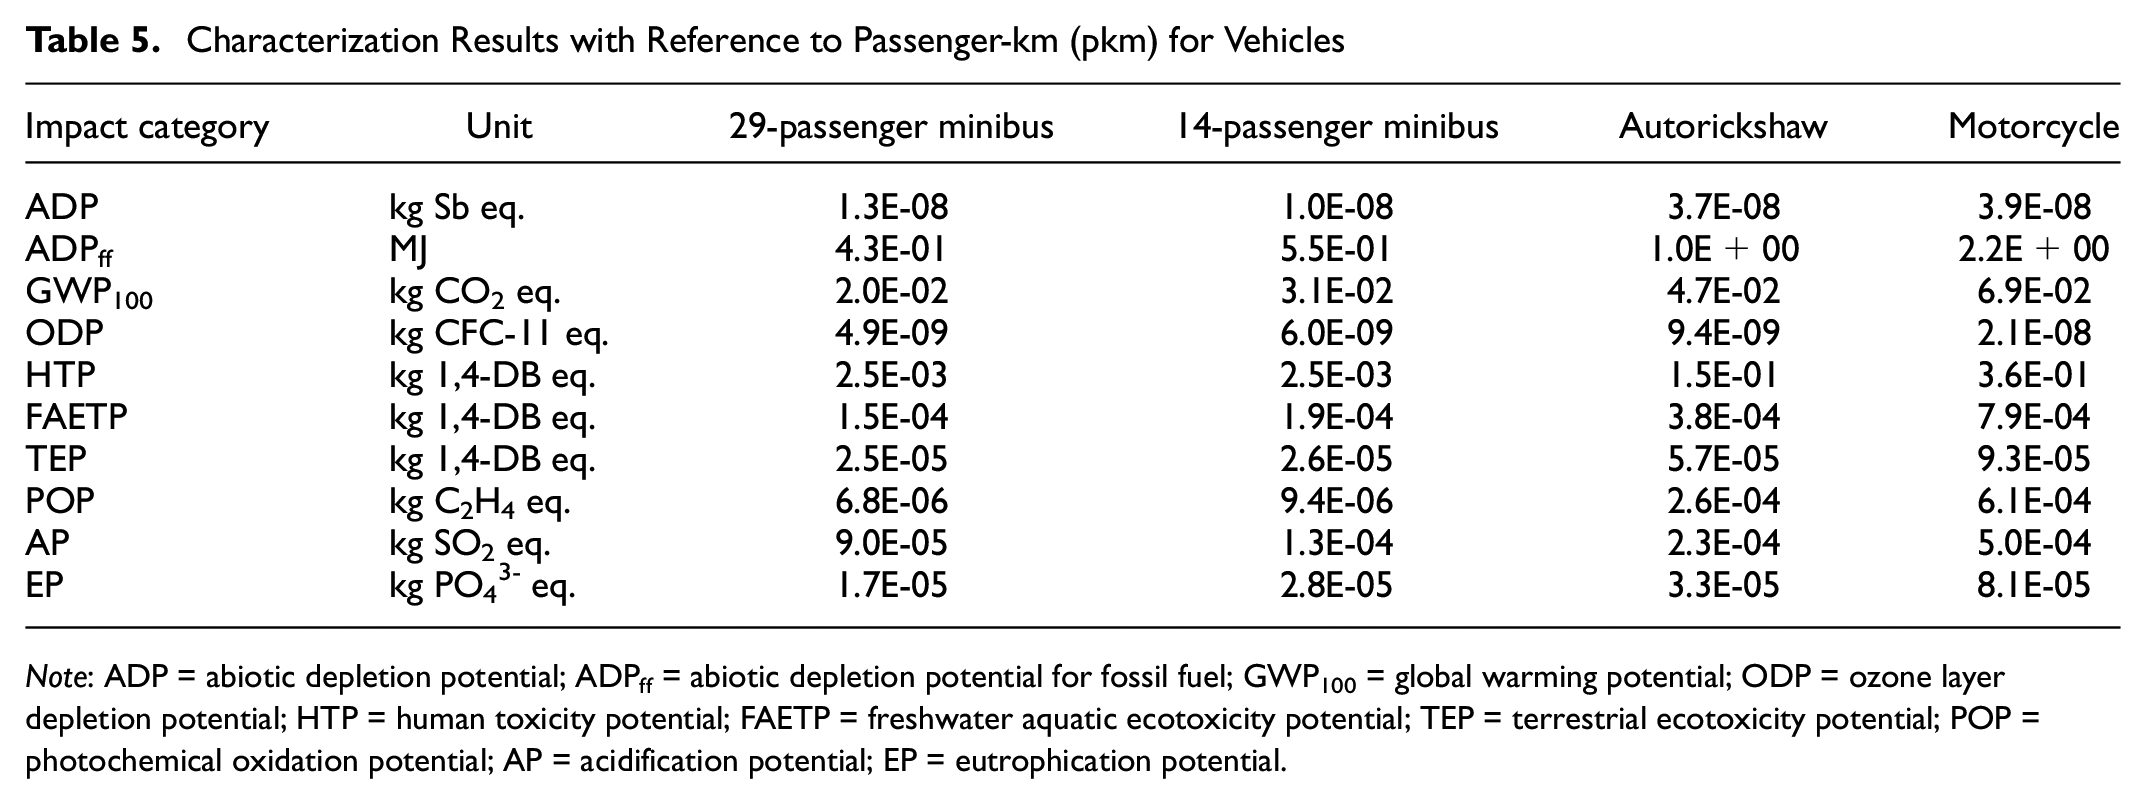
Note: ADP = abiotic depletion potential; ADPff = abiotic depletion potential for fossil fuel; GWP100 = global warming potential; ODP = ozone layer depletion potential; HTP = human toxicity potential; FAETP = freshwater aquatic ecotoxicity potential; TEP = terrestrial ecotoxicity potential; POP = photochemical oxidation potential; AP = acidification potential; EP = eutrophication potential.
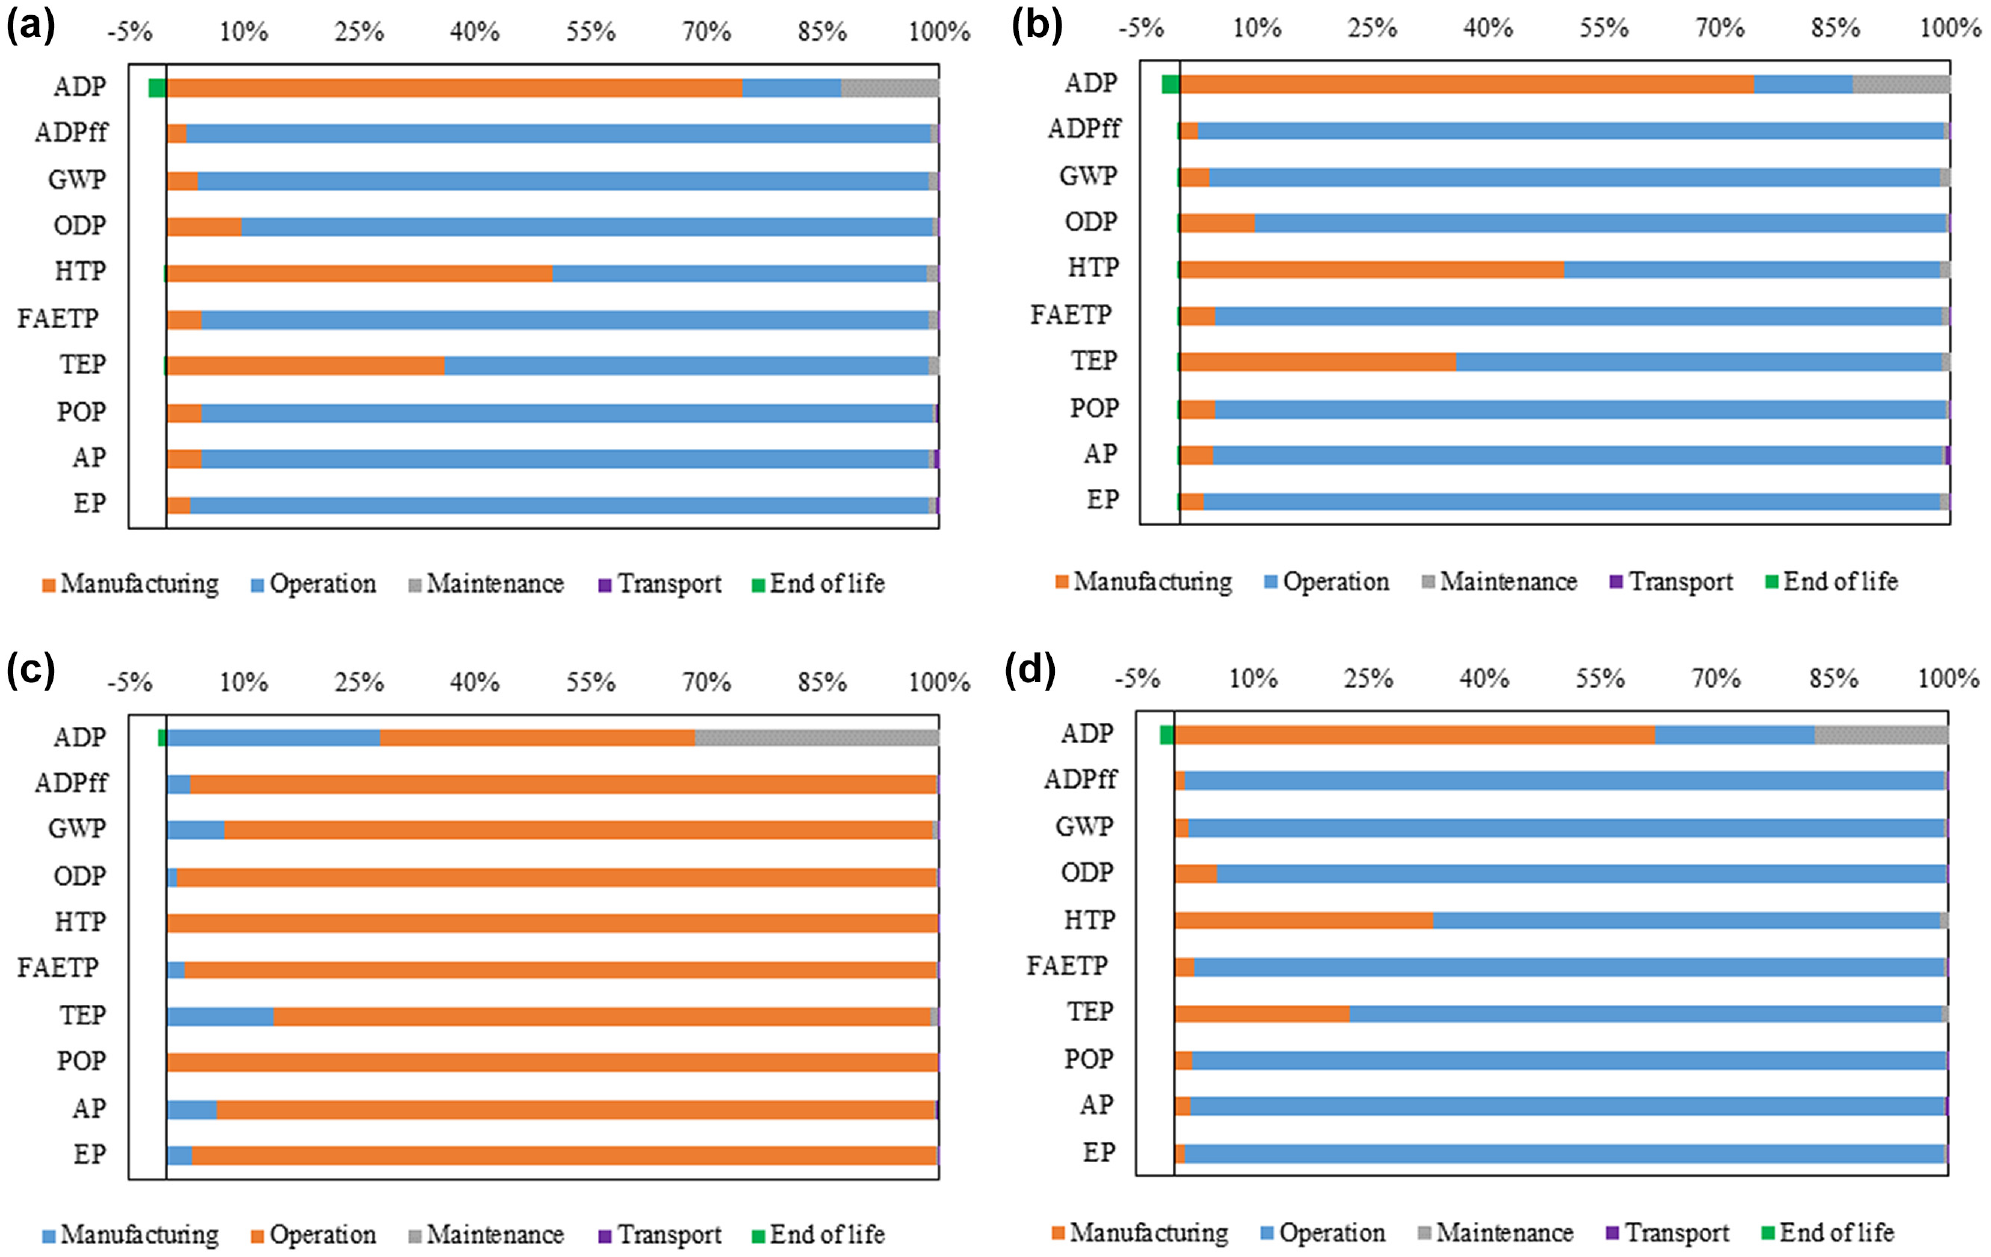
Percentile distribution of the impacts into processes in the life cycle of the passenger transportation: (a) 29-passenger minibus, (b) 14-passenger minibus, (c) motorcycle, and (d) autorickshaw.
For the 29-passenger, 14-passenger minibus, and autorickshaw models, there is an impact of more than 60% from the vehicle manufacturing stage abiotic depletion potential (ADP). The cause of such a scenario is thought to be the consumption of lead, chromium, and copper in vehicle manufacturing and fuel production processes. While the vehicle operation stage has a more than 90% effect on abiotic depletion potential for fossil fuel (ADPff), there is an effect of less than 10% from vehicle manufacturing, shipment, maintenance, and end-of-life stages. The consumption of crude oil, natural gas, and coal during the fuel production process is thought to be the cause of this situation. The depletion of various resources affects the ability of future generations to enjoy its benefits. Over-exploitation of a specific resource may not necessarily deplete it, but the reduction in its amount may make it scarce and thus expensive to access.
Furthermore, the global warming potential (GWP100) impact is calculated as 0.02, 0.031, 0.069, and 0.047 kg CO2 eq./pkm for the 29-passenger minibus, 14-passenger minibus, motorcycle, and autorickshaw, respectively. It can be seen in Figure 4, a to d , that the vehicle operation stage has a highest impact on GWP100. This observation is believed to have been brought about by carbon dioxide emissions whose largest percentage is because of vehicle fuel combustion processes. When there is a significant rise in global temperatures, abnormal weather conditions can happen in form of storms and cyclones. Hot temperatures can also contribute to desertification and rise in sea levels, which result in unbearable disasters. As for ODP, crude oil production and natural gas transport contribute approximately 99% to the formation of pollutants such as bromotrifluoromethane, bromochlorodifluoromethane, tetrachloromethane, and 1,2-dichlorotetrafluoroethane or Halon 1301, Halon 1211, CFC-114, and CFC-10, respectively. Depletion of the ozone layer in the atmosphere caused by the emission of chlorofluorocarbons, hydrochlorofluorocarbons, and halons allows the passage of greater levels of ultraviolet from the sun, causing skin cancer, damage to the immune system, and altered crop yields. For a 29-passenger minibus, approximately 50% of total HTP emissions are produced during production and 49% of total HTP emissions are produced during operation. The FAETP is caused by the barium, formaldehyde, zinc, and copper emissions mainly generated by fuel production processes during the vehicle operation stage. Terrestrial ecotoxicity potential (TEP) is because of energy production, distribution, and consumption processes during fuel production (vehicle operation) and steel, zinc, and copper production (vehicle manufacturing). Chemicals emitted into the environment have the potential to cause toxic impacts on humans, including cancer and various non-cancer effects, leading to damage to human health. Furthermore, toxic substances like heavy metals in water can be transferred to animals such as mollusks, which are consumed by humans. They can also spread to drinkable water sources, to the soil through irrigation, and from the soil to crops. This results in food security problems and human health challenges.
POP and AP are also noteworthy. The POP effect is given in milligrams C2H4 equivalent for this study, and it is found out that the POP effect of the 29-passenger minibus, 14-passenger minibus, motorcycle, and autorickshaw is 6.8, 9.4, 606.2, and 263.3 mg C2H4 eq./pkm, respectively. The POP impact of autorickshaw and motorcycle per pkm is 100 times as much as that of 29-passenger minibus and 14-passenger minibus. Roughly 95% of the POP emissions originate from the 29-passenger minibus operation and 5% originate from the 29-passenger minibus manufacturing processes. Impacts related to vehicle operation for a 14-passenger minibus, motorcycle, and autorickshaw have a percentage contribution to POP of 97, 100, and 99 respectively. It is believed that carbon dioxide emissions generated because of vehicle fuel combustion processes during the vehicle operation stage caused this environmental impact. Ozone leads to chemical smog that affect human health, food crops and the ecosystem in general. Similarly, AP is expressed in kg SO2 equivalent. In a motorcycle, it is found out that in a 29-passenger minibus, 14-passenger minibus, motorcycle, and autorickshaw the vehicle operating stage has a bigger impact on AP than vehicle manufacturing, shipment, maintenance, and EoL stages. After a critical analysis, the results show that fuel production and vehicle fuel combustion processes generate enough sulfur dioxide and nitrogen oxides to cause the acidification effect. The reaction of sulfur dioxide and nitrogen oxides in the atmosphere results in the formation of acid rain. Acid rain raises the acidity of water bodies and soil which affects animals on land and in water bodies thus reducing the quality of different ecosystems. Plants, humans, and other living organisms live mainly on land or in water and they depend on each other. For example, if acid rain alters the quality of soils it can lead to food insecurity thus affecting the welfare of humans and other living organisms like plants. Sulfur dioxide has the potential to worsen asthma and other respiratory diseases in humans. Acidification of water bodies like oceans has the potential to lead to the extinction of corals, some fish species and oysters which affects the food chain.
After analyzing the urban passenger transport in as far as eutrophication potential (EP) (kg PO4 equivalent) is concerned, its effect is calculated as 33 mg PO4 eq./pkm for autorickshaw, 81 mg PO4 eq./pkm for motorcycle, 28 mg PO4 eq./pkm for 14-passenger minibus, and 17 mg PO4 eq./pkm for the 29-passenger minibus. Nitrogen oxides, mostly from vehicle fuel combustion processes and phosphates from fuel production processes had a major impact on eutrophication potential. When there are high levels of phosphates and nitrates in water bodies plants like algae grow at a high rate which reduces oxygen levels in water. The low oxygen levels not only put the existence of aquatic plants and animals at risk but also affect the quality of water for human consumption.
In many environmental impact categories, the motorcycle appears to be the worst performing mode to transport a passenger for 1 km, this is because much as the materials required to enable a motorcycle to move from place to another are low in quantity or amount, the single passenger (for the studied functional unit) transported by the motorcycle bares all the environmental burdens that result from the transportation service. On the other hand, in modes such as the 29-passenger minibus the burden of environmental and economic impacts that result from the movement of the vehicle for a kilometer are shared by all the 29 passengers which significantly reduces the value of the impact of transporting an individual passenger. The trend in which the motorcycle appears to be the worst performer is observed in all the impact categories which include ADP, ADPff, GWP100, ODP, HTP, FAETP, TEP, POP, AP, and EP. However, in ADP the value of the environmental impact of an autorickshaw and the motorcycle appear close to each other because in this study, it was assumed that materials used in manufacturing both of these vehicles are not so different. This is also observed in the case of the two types of minibuses considered in this study. The quantity of materials used in manufacturing and maintaining them is close. Besides, the ADP impact categories, the operation stage of all the vehicles under study appears to have the greatest impact in all the environmental impact categories. This is because the operation stage involves consumption of fuel and other natural resources both renewable and nonrenewable resources. This phase of fuel consumption contains most of the stages involved in fuel production and fuel transportation up to the fuel filling stations. This stage is also the source of most pollutants in form of emissions and wastes. As vehicles burn gasoline or diesel to accelerate, numerous pollutants are produced and emitted to air, water, and land. Most of the impact categories in this study are measured by monitoring the concentrations (amounts) of specific pollutants in the environment for example the amount of CO2 emissions produced as a result of operating a vehicle is used to measure its GWP100.
Sensitivity and Uncertainty Analysis
A sensitivity analysis was performed to assess the impact per pkm of percentage vehicle occupancy on the cradle to the grave emissions of passenger transportation. Besides, the analysis results showed that the operation stage of passenger transportation contributes to most of the environmental impact categories. In this study, the sensitivity analysis was carried out by four different occupancy levels (±25 and ±50%) against the 100% occupancy level. The results of the analysis are shown in Table ESM7.
In poor and underdeveloped countries, the demand for transport services changes with time. The demand is usually high during morning hours when people are going to work and during the evening hours when they are going back home. In hours of very high demand, vehicles usually overload or carry passengers beyond their licensed capacity. In relation to this, a motorcycle may carry two or three passengers, which translates into a 50% increase in its licensed capacity of one passenger. Furthermore, an autorickshaw can carry six passengers, which also translates into a 50% increase in its licensed maximum passenger capacity of three passengers. It is important to note that in this study, motorcycles and autorickshaws are vehicles that can reach 125% or 150% occupancy levels. Conversely, during midday hours, people travel less, and vehicles load 25% or even 50% fewer passengers than their licensed carrying capacity. In relation to this, a 29-passenger minibus may carry 14 passengers while a 14-passenger minibus may carry seven passengers. This is a realistic situation, and it translates into a 50% decrease in the number of passengers transported. The decrease in the percentages of passenger occupancy levels is usually experienced in the minibuses. This makes the 25% and 50% increase and decreases in the passenger occupancy levels a realistic situation in an informal low-capacity transport system often found in poor and underdeveloped countries.
It is shown that the change in the percentage of passenger occupancy influences the environmental impacts per pkm of passenger transportation. According to the findings, impacts per pkm have a very high sensitivity when the occupancy level is below 100%. Above 100% occupancy level, the sensitivity is moderate. This trend is observed in all the vehicles evaluated in this study. When the occupancy level decreases by 25% and 50% during the operation phase, the environmental loads of passenger transportation increase by 78.0 ± 0.6 and 300.0 ± 1.0%, respectively. In case of an increase in the same ratio of occupancy level (25%–50%), these loads are decreased by 36.1 ± 0.3% and 55.4 ± 0.1%.
The data that made up the inventory of this study occurred from different sources both primary and secondary. The data related to our topic of study were not fully available at the geographical scope and technological level, and this study was carried out by relying on certain scientific assumptions to compare the various modes of transport to overcome these limitations. However, there is a possibility of undervaluing or overvaluing different parameters considered in this study. Therefore, Monte Carlo simulations make it possible to compare different products or services by creating scenarios where the values for parameters are altered several times. For instance, a parameter which is given a high value by the researcher is scrutinized by Monte Carlo simulations to find out whether it still gives the same impact to the analysis results even if its value is reduced. Monte Carlo simulations or uncertainty analysis makes it possible to find out whether the impact of the parameter is significant or insignificant when its value is altered several times. Therefore, uncertainty analysis enables decision makers to find out the closeness of their findings to the reality which determines whether their data are reliable, or if further analysis is needed.
In this study, Monte Carlo simulation was carried out at 95% confidence interval and 1,000 runs by using both uncertainty analysis option that is embedded in the SimaPro 9.1.0. Ph.D. version software and CML-IA baseline v3.03/World 2000 impact assessment method. Simulations focusing on a single vehicle and simulations focusing on a comparison of two different vehicles among those considered in this paper were executed. The results of the Monte Carlo simulation are given in Table ESM8 of the supplementary material. The results of simulations for each passenger transportation reveal non-fossil fuel-based ADP and POP as the categories with the highest uncertainty for 29-passenger minibus. For 14-passenger minibus and motorcycle, the impact categories with the highest uncertainty are POP and ozone layer depletion while for autorickshaws it is POP and FAETP. The findings of the Monte Carlo simulation are presented in Figure 5, a to c . Moreover, the uncertainty analysis reveals in this study that no matter the changes (insensitivity situation) in the values of the parameters during the vehicle manufacturing stage, the 29-passenger minibus has a higher abiotic depletion potential than the 14-passenger minibus. Conclusively, the findings of the uncertainty analysis do not reveal any unexpected results. This shows that the data used in this study were robust enough to support strong recommendations to the stakeholders in the transport sector.
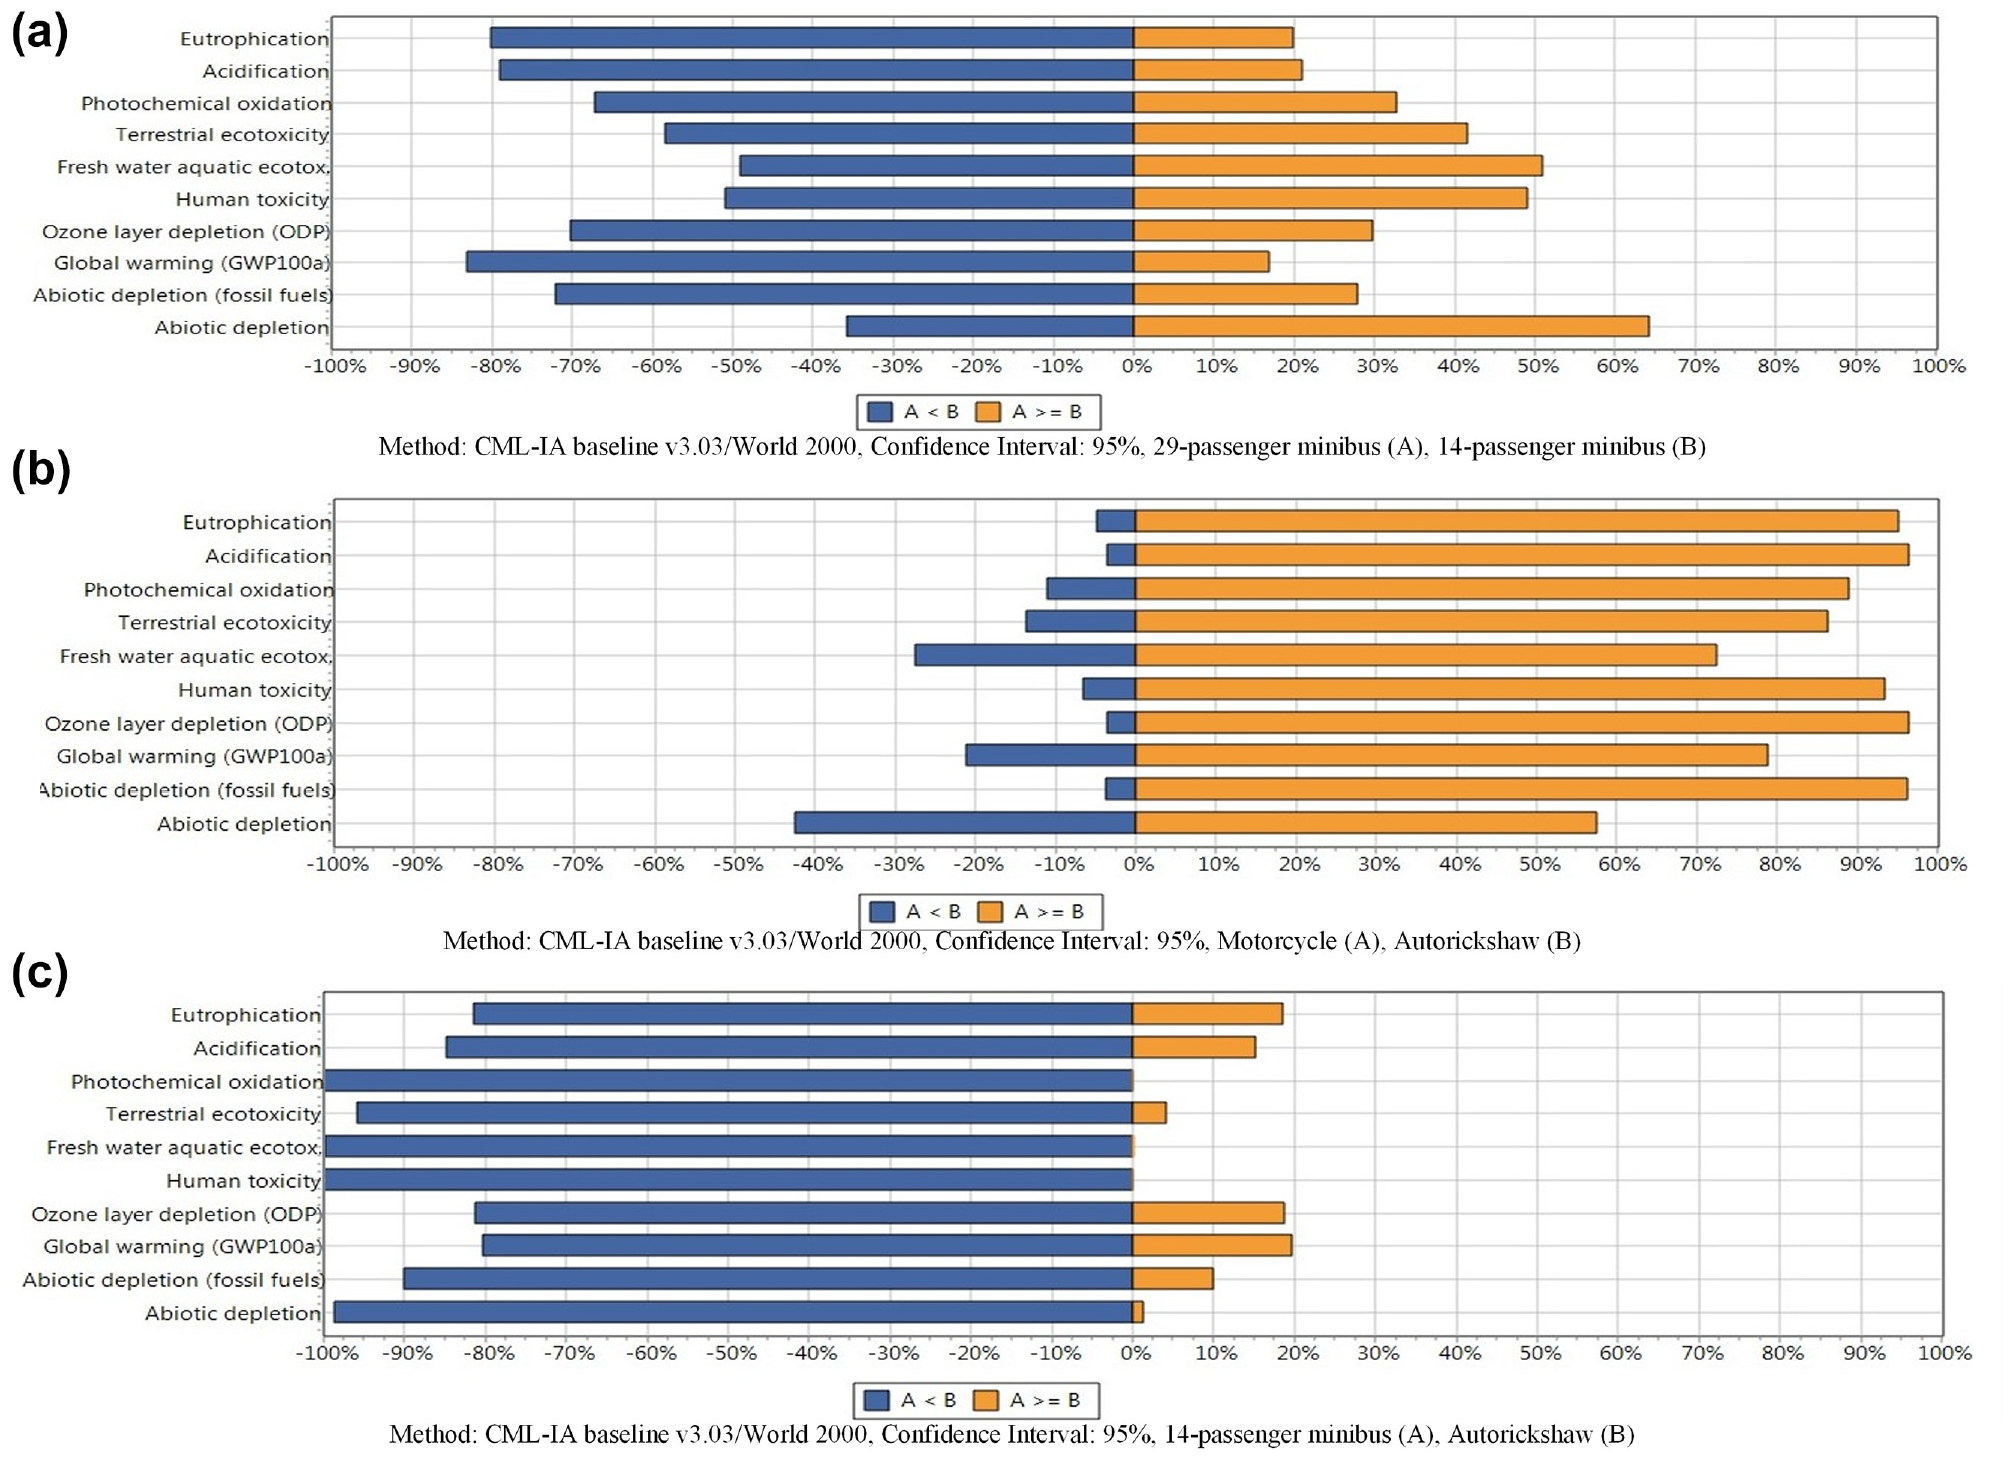
Monte Carlo simulation results: (a) 29-passenger minibus vs 14-passenger minibus, (b) Motorcycle versus autorickshaw, and (c) 14-passenger minibus versus autorickshaw.
Comparison of the Results with the Literature
Comparing the results of our LCA study with studies in the literature presents a big challenge because of the differences in the purpose, system boundaries, and scope of each study. However, similar types of vehicle transportation are still comparable to each other concerning their environmental impacts. The results of this study are compared with literature studies as shown in Table 6. In the table, studies which had at least two impact categories similar to those covered in the present study were considered. Such studies were not many and the few which were found, discussed the impact categories presented in the table. Other than being hard to access, the data used to analyze the environmental impacts of using a 14-passenger minibus and autorickshaw for passenger transportation were very hard to model and this is believed to be the main cause of the wide differences between results obtained in the studies compared in this paper.
Comparison of the Results with the Literature
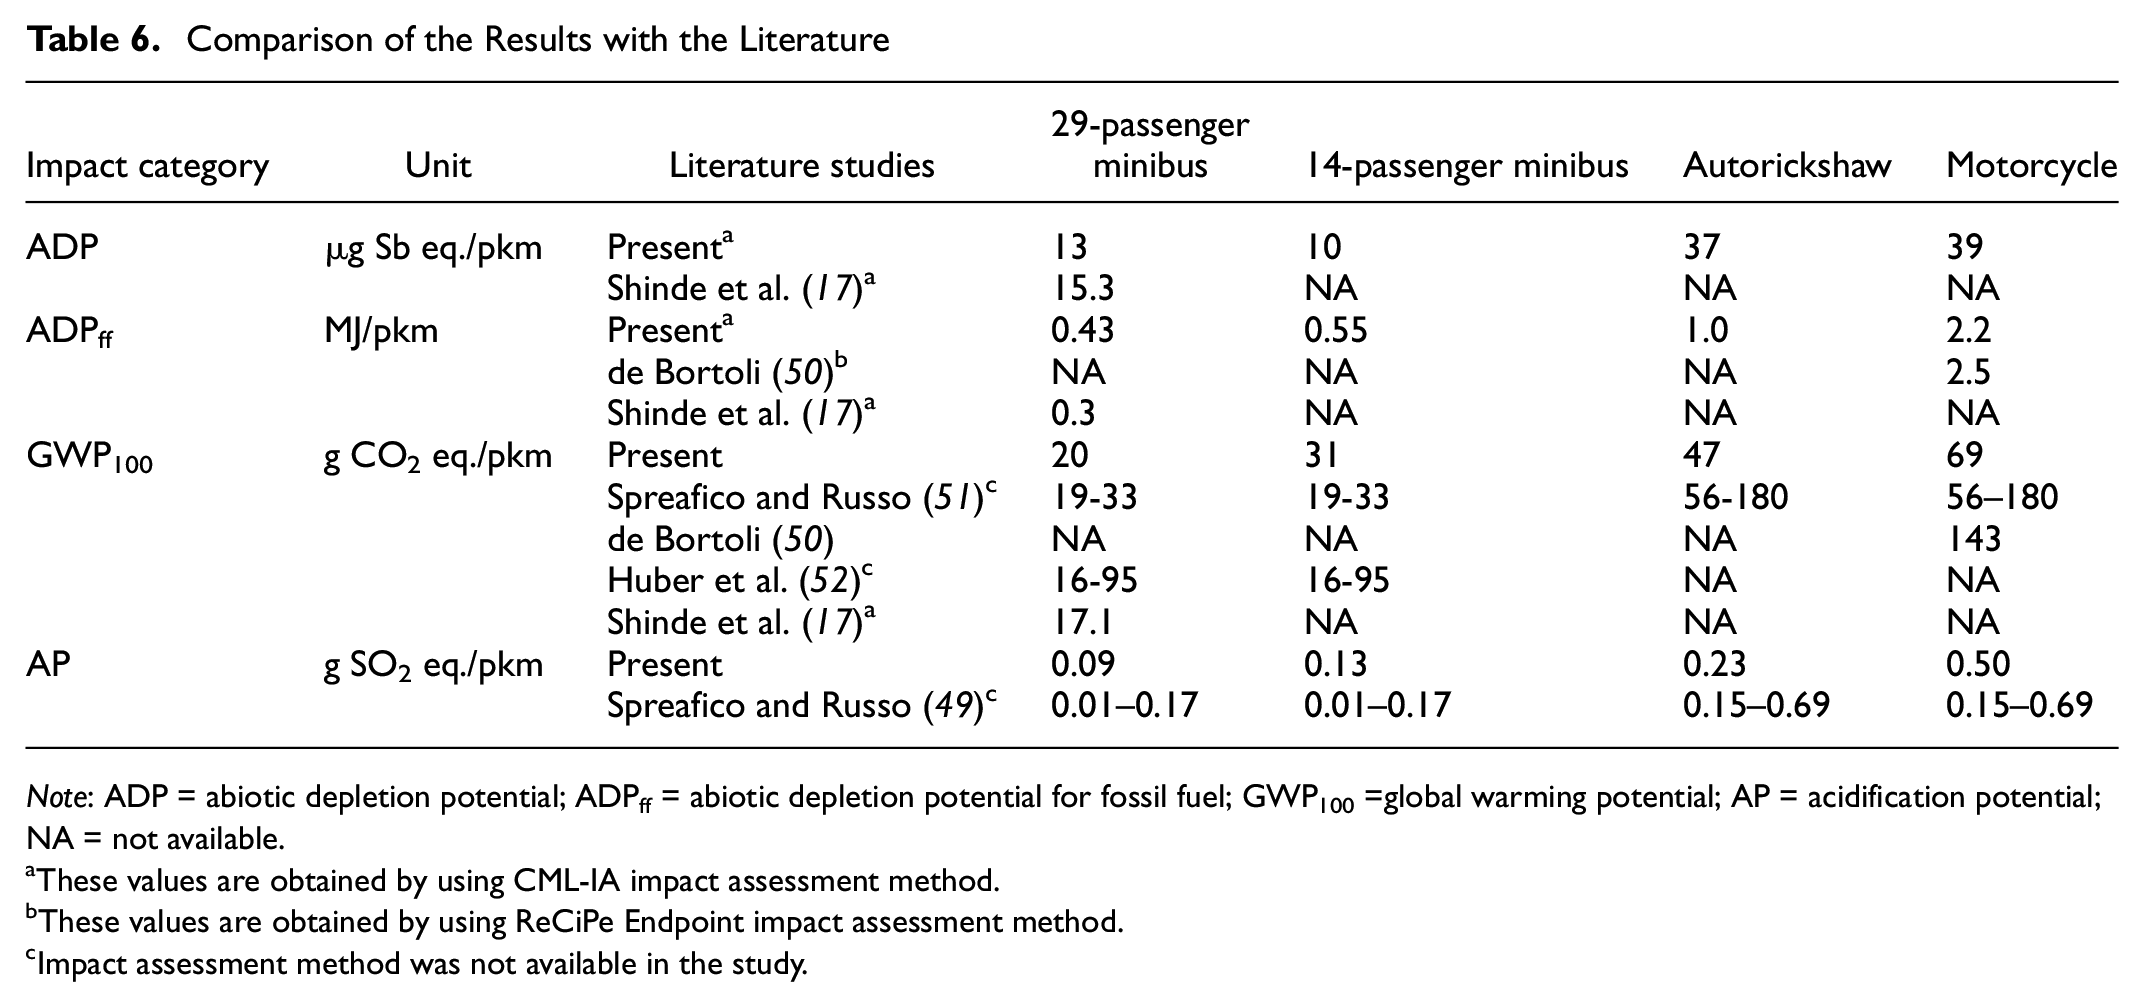
Note: ADP = abiotic depletion potential; ADPff = abiotic depletion potential for fossil fuel; GWP100 =global warming potential; AP = acidification potential; NA = not available.
These values are obtained by using CML-IA impact assessment method.
These values are obtained by using ReCiPe Endpoint impact assessment method.
Impact assessment method was not available in the study.
Huber et al. ( 50 ) based their study on primary data on vehicle components provided by vehicle manufacturers which enhanced the quality of the study results unlike in the present study where most of the data was based on assumptions and secondary data from numerous sources. Besides, Shinde et al. ( 17 ) used primary data obtained from vehicle manufacturers which ensured accuracy in the amount of material consumed in manufacturing the vehicles under study unlike in this study where three methods were used to modify and come up with estimates which are prone to mistakes and inaccuracy. Therefore, it is believed that these data sources might create a difference between our study and the studies carried out by Shinde et al. ( 17 ) and Huber et al. ( 50 ). Again, Spreafico and Russo ( 49 ) based their analysis on the European electricity mix for the electric vehicles and European fossil fuels distribution network while the Chinese electricity mix for vehicle manufacturing and Ugandan electricity mix for vehicle maintenance and vehicle EoL stage were considered in our study. This created a significant difference in the values of vehicle manufacturing stage, maintenance, EoL in relation to energy consumption which was reflected in the final performance of the vehicles under study. Spreafico and Russo ( 49 ) also excluded the transportation of raw materials from extraction points to manufacturing sites and transportation related to distribution while in this study the transportation was considered.
LCC Results
Figure 6 shows the comparison of transporting a passenger using four different modes of transport. The total life cycle costs of the motorcycle, 14-passenger minibus, 29-passenger minibus, and autorickshaw were calculated as 0.764, 0.450, 0.427, and 0.363 $/pkm, respectively. According to these results, the motorcycle and the 14-passenger minibus have the highest overall costs per pkm because of the fuel cost, which contributes approximately 50% and 64% of the overall costs for the motorcycle and the 14-passenger minibus, respectively. The total LCC cost of transporting a passenger using an autorickshaw is roughly 52.5% less than that of a motorcycle, and it has the lowest overall cost. The fuel cost and the salaries are the most significant costs across all types of vehicle transportation. The high fuel cost and salaries are the main reason why passenger transportation with a motorcycle is the least effective alternative. The LCC results express that the purchase costs of these vehicles are in the range of 3 to 7% of total overall costs per pkm and the maintenance costs are 2 to 6% of total costs.
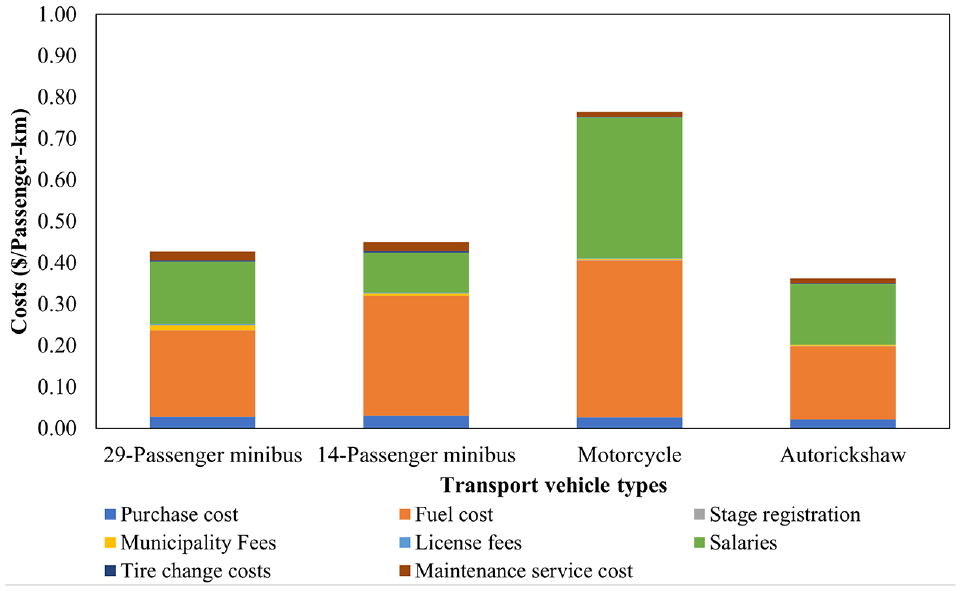
Life cycle cost analysis (LCC) results of transport vehicle types.
According to the LCA and LCC results, motorcycles have the worst performance both environmentally and economically owing to their consumption of gasoline. Environmentally, gasoline produces more carbon dioxide than diesel, this explains why the GWP of motorcycles is higher than that of other vehicles. In addition, the price of gasoline is higher than that of diesel. A significant cost is incurred on the fuel, which increases the operation costs of motorcycles and gasoline-consuming vehicles. Therefore, vehicles running on diesel such as the 29-passenger minibus should be preferred to provide transportation services. In as far as the economic and environmental performance of passenger transportation is concerned, the type of fuel is a major factor since it determines the GWP and the operating cost of passenger transportation. Furthermore, the fuel production processes have a big impact on the ecotoxicity potential of passenger transportation. The toxicity is a result of barium, zinc, and other elements that are produced while gasoline and diesel are being produced.
Conclusion
In this study, the informal low-passenger-capacity transport system has been evaluated from an environmental and economic perspective (by using the LCA and the LCC methodologies) to fully understand and compare the effects of each type of transportation used in the underdeveloped regions of the world.
Both the LCA and LCC results indicated that the operational stage, specifically fuel consumption, has the highest impact on the environment and economy. Therefore, the operation stage was the most vital step in the vehicle’s lifetime with reference to both environmental and economic impact and if decision makers reduce the impacts of this stage, the impacts of passenger transport can be remarkably reduced.
Besides, LCA results showed that a 29-passenger minibus shows significantly higher emissions per pkm when its occupancy level is below 50%, in such conditions low-capacity vehicles at their 100% occupancy present low emissions per pkm. Accordingly, LCA results suggest that to achieve a scenario with the lowest environmental impacts, a 29-passenger minibus and 14-passenger minibus should therefore only operate when the passenger load is assumed to be over 50%. In situations when the number of passengers is below 50%, passengers in need of transport should be served by autorickshaw and motorcycle. Based on these findings about occupancy level of these transport modes, policymakers may consider focusing their efforts on enhancing the performance of fixed-route transport modes, which could involve measures such as increasing route frequency, adjusting routes, coordinating timetables, and exploring the implementation of demand-responsive systems. This approach would aim to optimize and improve the efficiency of public transportation, aligning with the identified areas for potential improvement while considering the economic and environmental implications.
The LCC results also show that the autorickshaw has the lowest cost impact, and 29-passenger minibuses have the second lowest cost impact throughout all life cycle stages. The operational stage of all vehicles has been determined to have a significant impact on the overall life cycle owing to fuel and personnel costs. Additionally, there was approximately a 5% difference in the LCC analysis per pkm between the 29-passenger minibus and the 14-passenger minibus. Compared with the autorickshaw, the 14-passenger minibus could be considered a viable option in public transportation owing to its lower environmental impacts.
Moreover, what-if in an underdeveloped country, approximately 250,000 passengers use various public transportation options daily. In this case, the transportation system would consist of 29-passenger minibuses, 14-passenger minibuses, autorickshaws, and motorcycles, with passenger utilization rates of 10%, 70%, 16%, and 4%, respectively. To address this case and mitigate environmental impacts, especially GWP100, a reduction of about 10% can be achieved. This reduction can be realized by implementing a 50% decrease in the number of passengers who choose the combined use of motorcycle (by 8%) and autorickshaw (2%), and a 12.5% increase in the number of passengers who opt for the combined use of a 29-passenger and 14-passenger minibus (with the values being adjusted by 15% and 75%). Again, when examining the same scenario through the LCC analysis, the potential economic improvement may be significant, with an expected gain of 5% compared with the current situation. This suggests that the financial benefits of the proposed changes might be relatively modest in the context of a comprehensive cost analysis.
The following policies might be adopted for improving the environmental and economic performance of the informal transport system.
Both LCA and LCC results show that improving energy efficiency in fuel consumption in the scope of the operational stage in these transportation types can be a significant option to mitigate environmental impacts and economic costs. Accordingly, both environmental and economic benefits can be achieved through improving fuel economy and reducing fuel use, especially when it’s jointly implemented with regulations.
LCC results indicated that personnel costs (such as salaries), purchase costs, and maintenance costs are other significant factors. Here, increasing government incentives or subsidies in underdeveloped countries for the high-cost purchase of public transportation vehicles can enable both a reduction in vehicle costs, repair expenses and an indirect improvement in maintenance.
Additionally, governments in underdeveloped countries should provide incentives to encourage informal transport operators to acquire new emission control technology like catalytic converters. They should also impose taxes on the drivers of old vehicles at the time of permit renewal with the objective of encouraging them to buy new vehicles. The combination of these policies significantly reduces emissions in the environment.
Using electrical vehicles to replace current types (diesel or gasoline) might be an effective measure to reduce the environmental impact, therefore electricity production should be carried out by using more greener options compared to fossil fuels. However, it should be remembered that the old and worn-out vehicle batteries should be treated in an effective manner.
It is important to note that much as the autorickshaw performs poorly environmentally, its economic costs are the lowest among the four modes under study. In addition, autorickshaws have proved to be the easiest modes to operate efficiently on environmentally friendly energy such as electricity. This means that their environmental impacts can be reduced significantly. This makes it possible to adopt a transport system where autorickshaws can be used to reach remote areas of the city and bring passengers to stations where the 29-passenger minibuses can pick them up. Such a system can enable the informal low-capacity passenger transportation system to perform better environmentally and economically.
Until efficient and suitable public transport systems are developed in the cities of underdeveloped countries, the informal public transport means should continue to be the main modes. When advanced systems are developed, the informal modes should act as feeders to the advanced system through reaching the locations that are not served by the main formal public transport system.
One of the limitations of this study is that LCA analysis was conducted with secondary data for the manufacturing of vehicles. The authors used various methods to approximate the values of the various parameters considered when carrying out the LCA. The authors believe that there are weaknesses in the validity of the data used in this study. To overcome this limitation during the LCA analysis, certain various methods to approximate the values of the parts of manufactured vehicles were considered. Secondly, the authors believe that if the operation stages of vehicles in this study were examined in the laboratory for various parameters such as operating period, the findings would have been easy to justify. However, since the authors did not have the equipment to carry out laboratory examinations, it was convenient for them to use approximations. The various types of minibuses, autorickshaw, and motorcycles—many of which are ill-equipped and old—cause serious environmental pollution issues. Using the insufficient data available on these vehicles, the authors carried out the LCA and the purpose of this study was almost achieved. The authors conducted a LCA on vehicles whose data are unavailable in the certain databases. Therefore, to obtain the values of different parameters, this study was based on approximations.
The LCC approach in this study can be applied to assess other transportation systems with different vehicles or modes by simply modifying the parameters used in this study or adding more parameters such as insurance costs, discounts, depreciation, and others.
Ultimately, this study can assist policymakers and public transport planners in making more efficient decisions and taking actions to promote sustainable transport modes in the future. There might be continued work to evaluate the social performance of these transportation modes in underdeveloped countries.
Supplemental Material
sj-docx-1-trr-10.1177_03611981231224745 – Supplemental material for Life Cycle Comparison of the Environmental and Economic Performance of an Informal Low-Capacity Passenger Transport System
Supplemental material, sj-docx-1-trr-10.1177_03611981231224745 for Life Cycle Comparison of the Environmental and Economic Performance of an Informal Low-Capacity Passenger Transport System by Muhammad Kalifa, Alp �zdemir and M�fide Banar in Transportation Research Record
Footnotes
Author Contributions
The authors confirm contribution to the paper as follows: study conception and design: M. Banar and A. Özdemir; data collection: M. Kalifa and A. Özdemir; analysis and interpretation of results: M. Kalifa, A. Özdemir, and M. Banar; draft manuscript preparation: M. Kalifa, and A. Özdemir. All authors reviewed the results and approved the final version of the confirmed.
Declaration of Conflicting Interests
The authors declared no potential conflicts of interest with respect to the research, authorship, and/or publication of this article.
Funding
The authors received no financial support for the research, authorship, and/or publication of this article.
Data Accessibility Statement
Data, associated metadata, and calculation tools are available from the corresponding author (alpozdemir@eskisehir.edu.tr)
Supplemental Material
Supplemental material for this article is available online.
References
Supplementary Material
Please find the following supplemental material available below.
For Open Access articles published under a Creative Commons License, all supplemental material carries the same license as the article it is associated with.
For non-Open Access articles published, all supplemental material carries a non-exclusive license, and permission requests for re-use of supplemental material or any part of supplemental material shall be sent directly to the copyright owner as specified in the copyright notice associated with the article.