
Abstract
To analyze the influence of subgrade form on the aerodynamic characteristics of the overhead contact system (OCS) positive feeder in the gale area of the Lanzhou–Urumqi high-speed railway, based on the aerodynamic theory, the flow field calculation model of the OCS positive feeder under different embankment forms is established, and the aerodynamic characteristics of the OCS positive feeder under various embankment forms are simulated and analyzed. The research shows that the embankment height significantly influences the aerodynamic characteristics of the OCS positive feeder. The aerodynamic coefficient of the positive feeder with an 8 m embankment height is 1.3 times that of the 4 m embankment height. The higher the embankment height, the greater the influence on the aerodynamic characteristics of the positive feeder. When the embankment slope rate is 1:1.5, the aerodynamic coefficient of the positive feeder is smaller than that of other slope rates. In the bridge structure, when the windshield height is greater than 4 m, the aerodynamic coefficient of the positive feeder rises obviously. Therefore, when the windshield is set, the height of the windshield is not too high. The research results can further clarify the mechanism of the OCS positive feeder galloping of the Lanzhou–Urumqi high-speed railway and provide a theoretical basis for the prevention and control of OCS positive feeder galloping, as well as the construction of railway windproof engineering.
The Lanzhou–Xinjiang high-speed railway in northwestern China passes through special terrains such as the Gobi Desert and valleys, and it is constantly plagued by wind disasters. The windy areas along the line mainly include the Anxi windy area in Gansu, as well as the Baili, Yandun, Sanshili, and Dabancheng windy areas in Xinjiang ( 1 – 3 ). In areas with strong winds, the wind speed and velocity are high, the wind period is long, and the wind seasonality is strong. Strong winds transport track sand, which hinders the train’s movement and causes travel inconvenience to passengers. In severe cases, accidents such as trains overturning or derailments occur ( 4 , 5 ). Therefore, a windbreak wall is installed along the windy section of the Lanzhou–Xinjiang high-speed railway to ensure safe and stable train operations. The windbreak setup is illustrated in Figure 1.
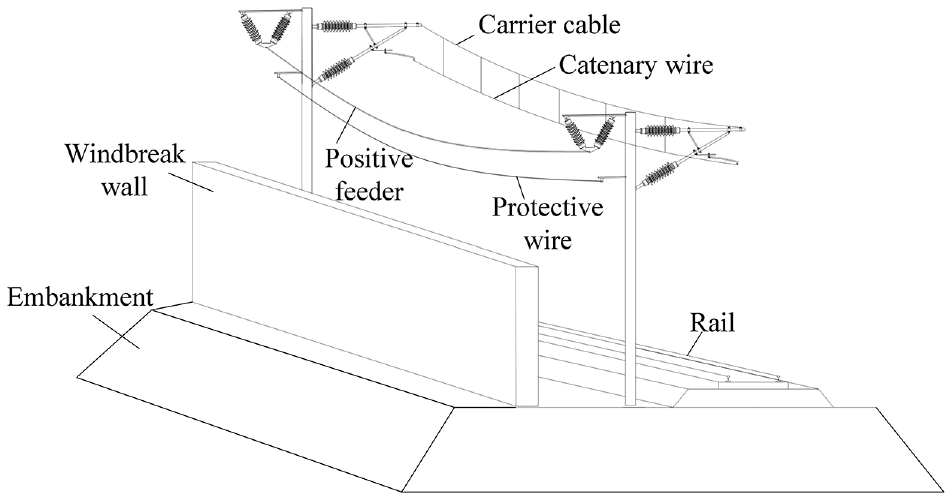
Schematic of the Lanzhou–Urumqi high-speed railway overhead contact system (OCS) structure.
Although the windbreak wall can prevent the movement of the track sand and the overturning of trains, it also causes the wind to rise along the embankment slope and over the windbreak wall. This rising wind is accelerated onto the overhead contact system (OCS) positive feeder of the windbreak wall, inducing a galloping phenomenon in the feeder ( 6 , 7 ), as illustrated in Figure 2. The galloping caused by strong winds results in significant wear of clues and fittings; moreover, an insufficient distance between the positive feeder and protective line causes discharge tripping accidents ( 8 ) and consequently serious safety hazards in the normal operation of high-speed railways.
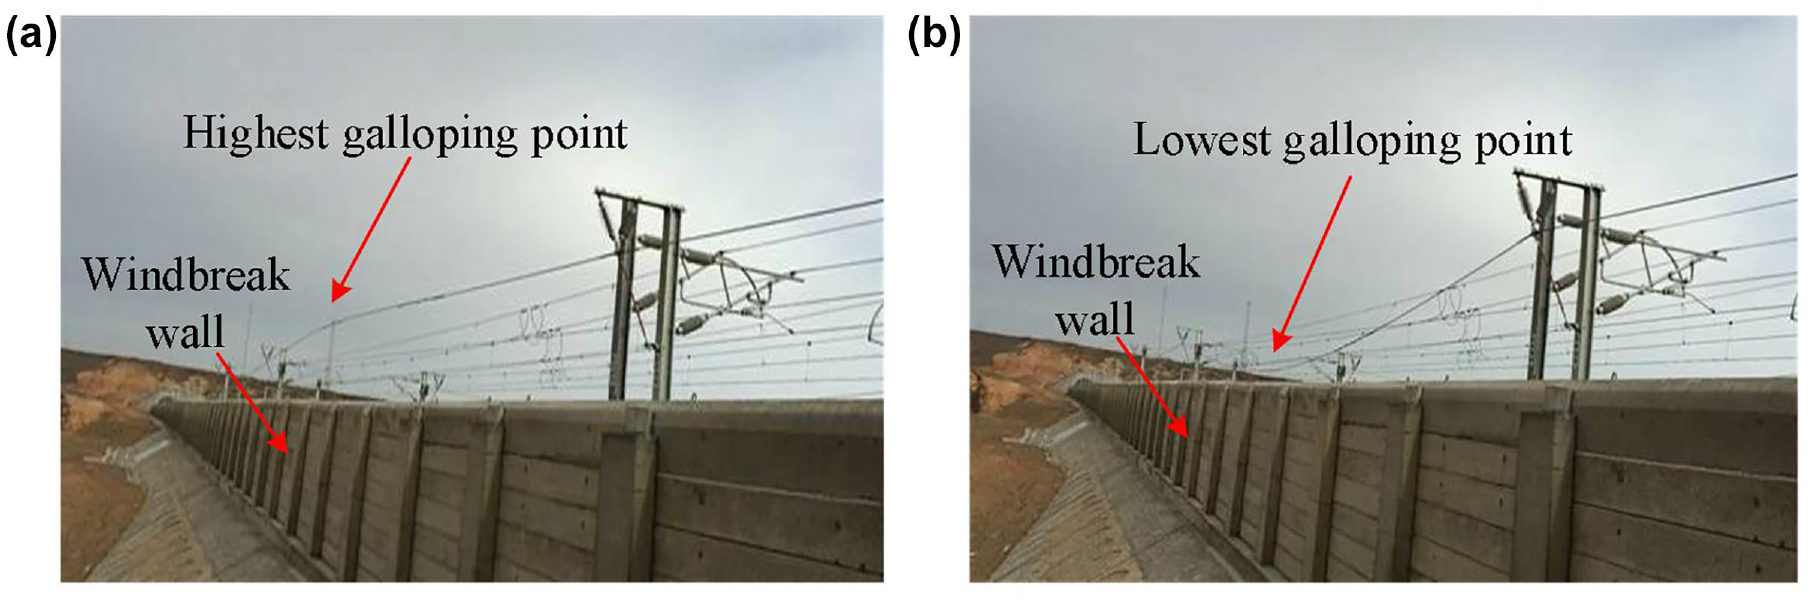
Scene of overhead contact system positive feeder galloping in the gale area of Lanzhou–Urumqi high-speed railway: (a) highest galloping point and (b) lowest galloping point.
Several scholars have proposed anti-galloping measures for railway overhead conductors. Widely recognized conductor galloping mechanisms include the transverse galloping mechanism ( 9 ), the torsional galloping mechanism ( 10 , 11 ), and the inertial coupling mechanism ( 12 ). The aerodynamic characteristics of wires in special environments, such as windy areas, have been extensively investigated. Stickland et al. ( 13 , 14 ) analyzed the aerodynamic characteristics of the contact wire, calculated the Den Hartog coefficient using the resulting aerodynamic coefficient, evaluated the aerodynamic stability of the wire’s cross-section, and studied the galloping phenomenon of the wire from a mechanical damping perspective. Pombo et al. ( 15 , 16 ) proposed a method for determining the dynamic characteristics of the pantograph and the interaction between the pantograph and contact wire system under aerodynamic forces. The authors examined the quality of contact between the pantograph and contact wire and determined the external factors affecting the contact quality. Tomasini et al. ( 17 ) experimentally investigated the aerodynamic effects of different windbreak walls on trains. The results showed that windbreak walls reduce the pressure on the side facing the train and change the wake at the rear of the train. Kozmar et al. ( 18 ) studied the windproof performance of viaduct wind barriers in wind tunnel tests using particle image velocimetry technology for measuring the time-averaged velocity field and vorticity field. The author also used a hot wire and pitot tube to measure the incoming flow velocity. The results showed that installing wind barriers can influence a train’s airflow and reduce the train’s wind load. Chu et al. ( 19 ) studied the aerodynamic effects of three types of windbreak walls with different porosities under crosswinds. The wind tunnel test and numerical simulation showed that the porous windbreak wall reduces the lateral force coefficient of the train. Mohebbi and Rezvani ( 20 ) used the lattice Boltzmann method to study the aerodynamic performance of a train with baffles on both sides under crosswinds. The results showed that a baffle with a 15% porosity was more effective in improving the aerodynamic performance of the train. Zhang and Deng ( 21 ) studied the influence of the windbreak wall position and height on the wind speed and blowing angle at the contact line under different wind speeds and at an embankment height of 2 m. Using the results of the wind deviation equivalent method at the height of the contact line and a load-bearing cable, Liu ( 22 ) and Tian ( 23 ) calculated the design wind speed acting on the contact line and influenced by the windbreak wall and windshield, but they ignored the wind speed effect on the positive feeder. Zhang et al. ( 24 ) conducted experiments using a windshield with a ventilation rate of 30% on the bridge structure. They examined the relationship between the windspeed at the contact line and the windshield height, considering the non-windshield, unilateral windshield, and bilateral windshield. Li et al. ( 25 ) optimized the shape of the high-speed railway perforated windbreak wall on the embankment, determining how the aerodynamic performance of electric multiple unit (EMU) is influenced by the shape of the opening, arrangement of the holes, hole opening rate, and aperture. Gao and Duan ( 26 ) used a two-dimensional model to study how single and bilateral windbreak walls of different heights affect the aerodynamic performance of trains. Han et al. ( 27 , 28 ) analyzed the wake field of the positive feeder and protection line, and they observed wake galloping in the overhead conductors and proposed corresponding anti-galloping measures. Zhang et al. ( 29 , 30 ) studied the influence of the windbreak wall of the Lanzhou–Urumqi high-speed railway on the positive feeder, focusing on factors such as the height and width of the windbreak wall as well as the position of the positive feeder; they ignored the influence of the embankment form on the positive feeder but found that the anti-galloping measures of the oblique insulator were effective.
Overall, previous studies on anti-galloping measures for railway overhead conductors have mostly focused on the influence of embankment windbreak walls and bridge windshields on the aerodynamic characteristics of the OCS. At a given wind speed, the embankment windbreak wall (bridge windshield) has a more significant acceleration effect on the airflow at the positive feeder, which has no compensation tension and undergoes more serious galloping. However, a few studies have examined the galloping caused by sudden changes in the aerodynamic characteristics of positive feeders, which results from the convergence of windbreak walls and windshields under different subgrade forms. Taking Lanzhou–Urumqi high-speed railway as the research object, we analyzed the influence of embankments of different heights and slope rates on the aerodynamic characteristics of the OCS positive feeder under the condition of a windbreak wall. A bridge simulation model was established to analyze the aerodynamic characteristics of the positive feeder with and without a windshield, as well as to analyze the influence of the form of the windshield on its aerodynamic characteristics. The results of this study provide significant insight into the galloping mechanism of the OCS positive feeder of the Lanzhou–Urumqi high-speed railway. The results also clarify the influence of subgrade form on positive feeder galloping and provide a theoretical basis for the prevention and control of OCS positive feeder galloping and the construction of railway windproof engineering.
Computational Model and Grid Distribution
The railway subgrade bears the weight of the moving train, supporting the smooth and safe operation of the train. The Lanzhou–Urumqi high-speed railway has various subgrade structures, such as flat ground, embankments, and bridges. The subgrade structure and OCS positive feeder are complex slender structures. To reduce the number of grids required for the model and the number of calculations and calculation time, we used ANSYS, a finite element software, to perform a two-dimensional modeling analysis based on the size of the cross-section of the Lanzhou–Urumqi high-speed railway line.
Model Selection
The windbreak wall is set according to the aerodynamic principle. The incoming wind separates and adheres to the upper and lower interference airflows behind the wall. The wind speed and turbulence of the attached airflow are significantly reduced, and the eddy current is eliminated. The separated airflow rises along the wall, forming aerodynamic lift and unstable wake behind the wall, causing the positive feeder to gallop sharply. The airflow distribution at the windbreak wall is shown in Figure 3.
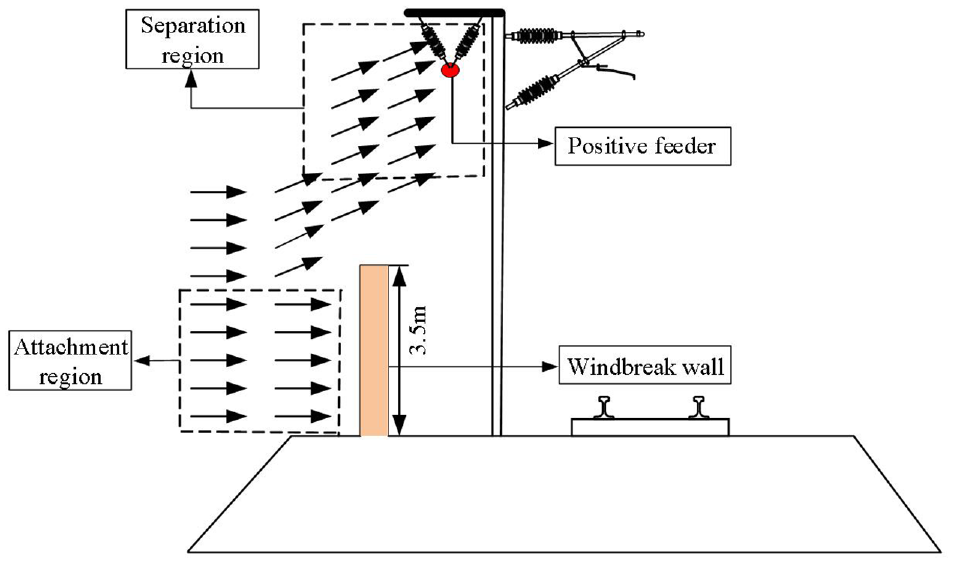
Airflow distribution at the windbreak wall.
An aerodynamic load diagram of the positive feeder under wind load is shown in Figure 4. After ignoring the torsional force, it mainly includes the aerodynamic lift FL perpendicular to the wind speed direction and the aerodynamic drag FD horizontal to the wind speed direction.
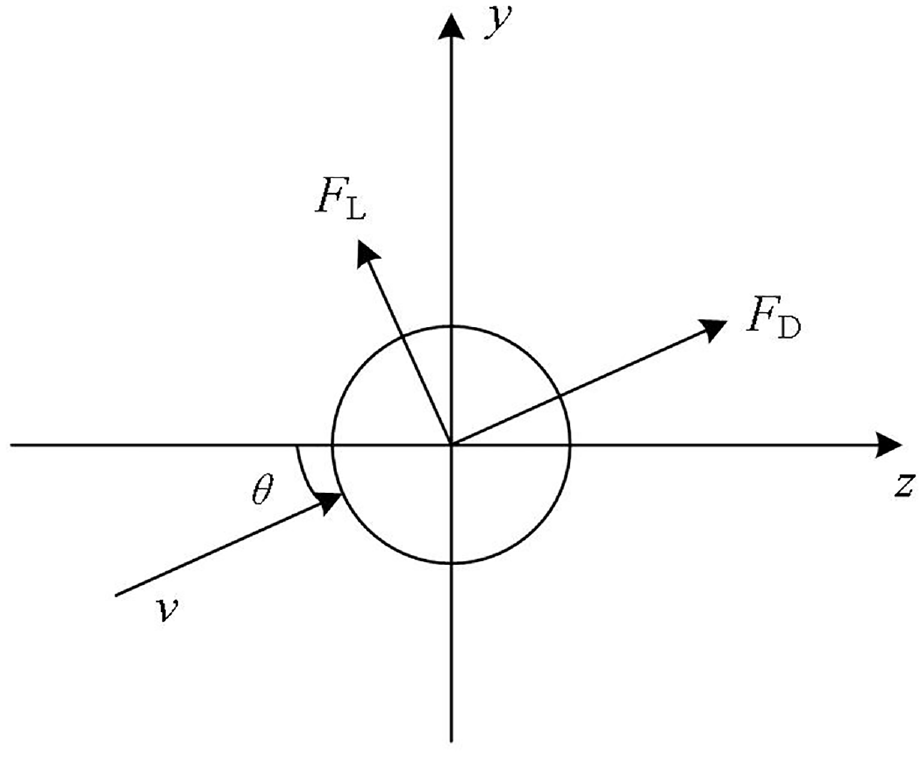
Positive feeder aerodynamic diagram.
In simulating the flow around the circular cylinder, the Transition SST model effectively captures the flow characteristics of the near-wall region of the wake of the circular cylinder; it also shows the changes in velocity, pressure gradient, and flow separation. Therefore, the Transition SST model was selected as the turbulence model in this study ( 31 ). The SIMPLEC algorithm was used for coupling velocity and pressure. The time step was 0.005 s, the calculations involved 1000 steps, and the simulation time was 5 s.
Define the lift coefficient as follows:

and drag coefficient as follows:

where FL and FD are the aerodynamic forces of the positive feeder in the vertical and horizontal directions, respectively; ρ is air density; U is wind speed; D is positive feeder diameter. The aluminum-clad steel strand (LGJ-300/25) was used as the positive feeder, with a diameter of 23.76 mm and a calculated cross-sectional area of 333.31 mm2.
Grid Distribution and Independence Verification
The embankment slope ratio of the Lanzhou–Urumqi high-speed railway is 1:1.5, the height of the windbreak wall is 3.5 m, the width is 0.4 m, the distance between the positive feeder and embankment is 7.2 m, and the horizontal distance between the positive feeder and the inner side of windbreak wall is 1.05 m. Taking the 4 m high embankment as an example, the embankment model and grid division around the positive feeder are illustrated in Figures 5 and 6, respectively. The computational domain boundary was set as follows: the left-hand side is the velocity inlet boundary, the airflow enters vertically from left to right, the right-hand side is the pressure outlet boundary, and the positive feeder surface is the non-slip wall boundary.
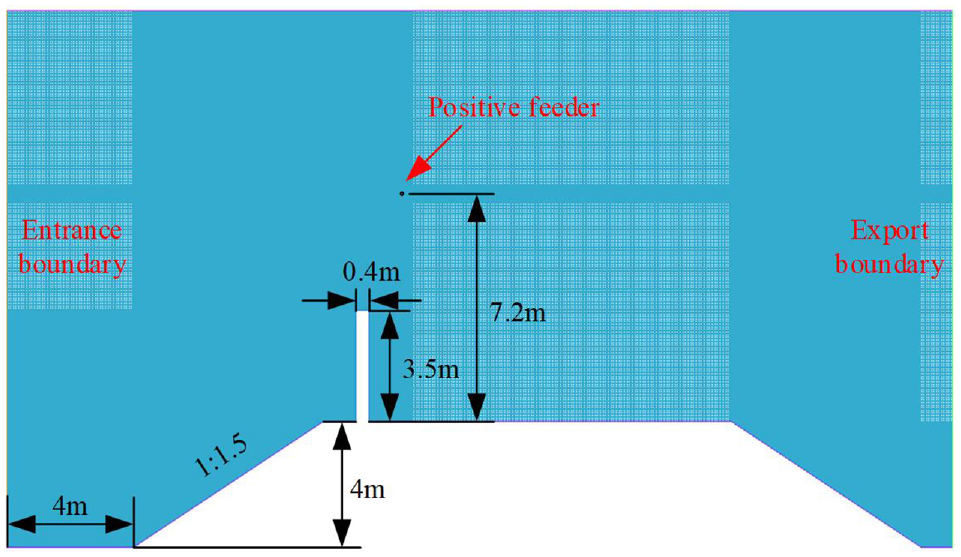
Computational domain grid of the 4 m high embankment.
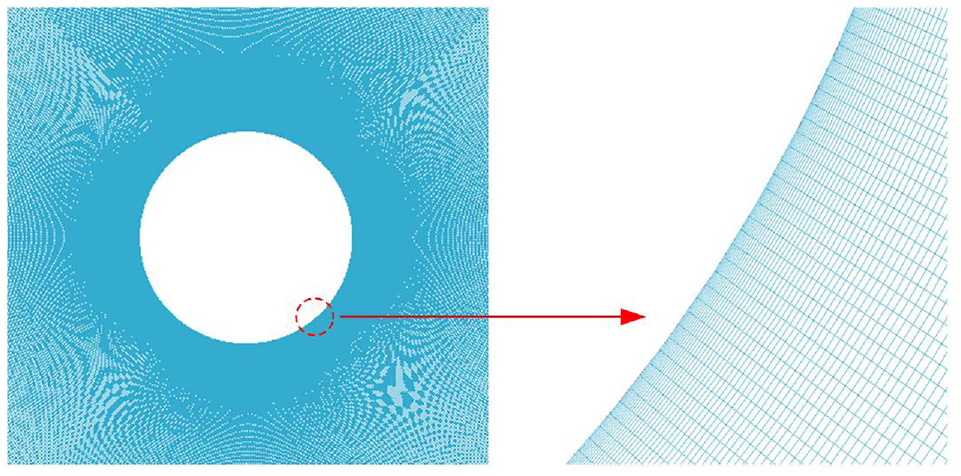
Computing domain grid around the positive feeder.
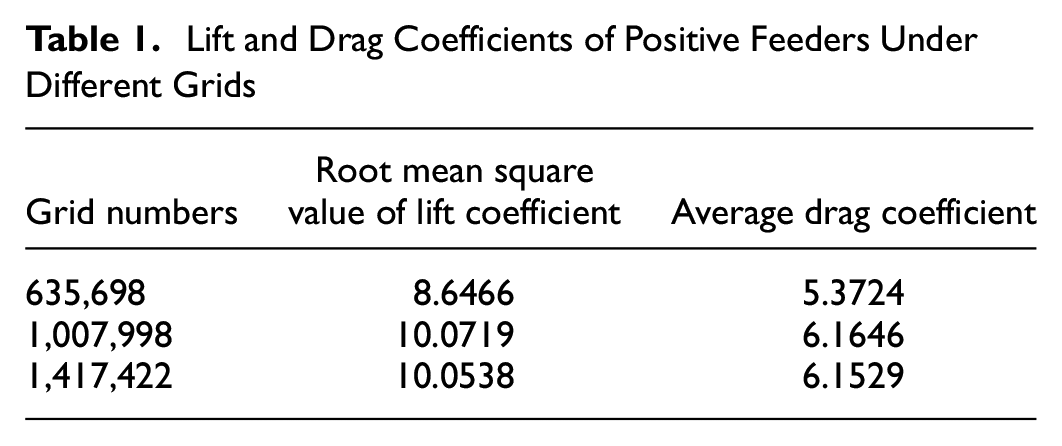
To address the problem of grid independence, the aerodynamic characteristics simulation of the positive feeder under the condition of embankment height of 4 m and wall with wind speed of 15 m/s is taken as an example. Table 1 shows the aerodynamic coefficients of the positive feeder under different grid numbers. Table 1 shows that the calculation results of the grid number of about 1.4 million are similar to the calculation results of about 1.01 million, indicating that calculation accuracy has been achieved when the number of grids is 1.01 million. To improve calculation efficiency, this paper uses 1.01 million grids. The computational fluid dynamics (CFD) simulation workflow is shown in Figure 7.
Lift and Drag Coefficients of Positive Feeders Under Different Grids
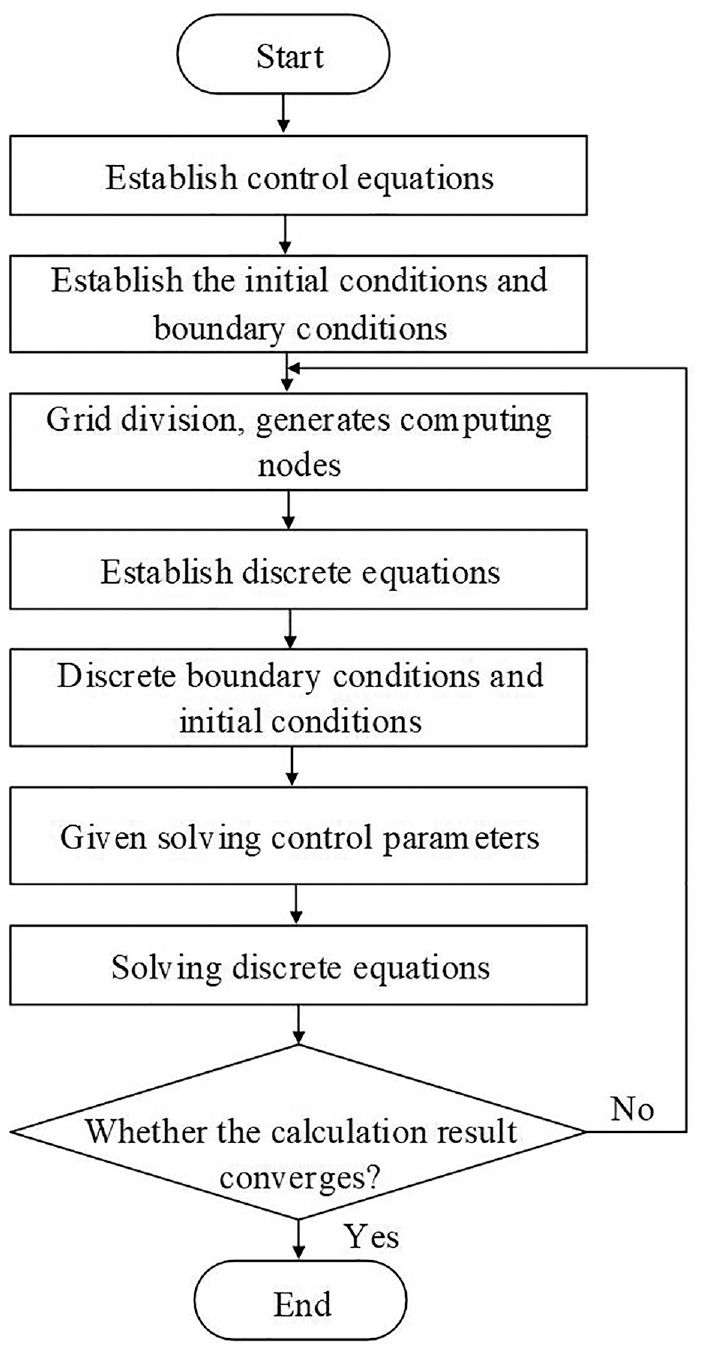
Computational fluid dynamics numerical simulation workflow.
Wind Tunnel Test and Simulation Verification
According to the similarity principle, a wind tunnel test device was designed and manufactured to measure the wind speed at the rear of the windbreak wall, and a model of the same size as that of the wind tunnel test was established for simulation analysis ( 32 – 34 ). The established wind tunnel model is a typical open-circuit wind tunnel consisting of a fan section, a large opening angle section, a stable section, a contraction section, an experimental section, and a diffusion section. The wind tunnel test device is shown in Figure 8.
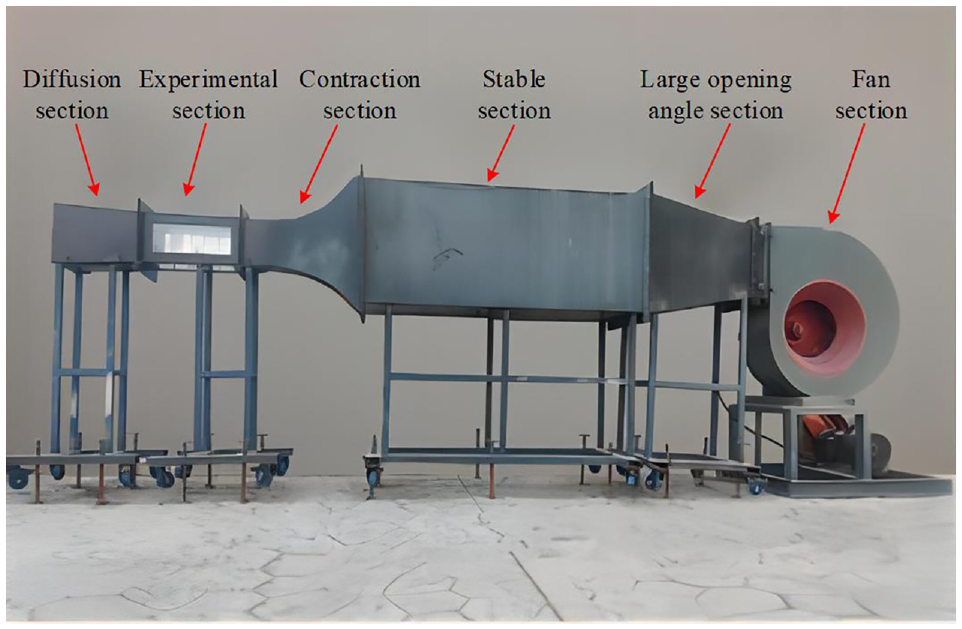
Wind tunnel test device.
The working principle of the test device is as follows: firstly, the fan section is the power section, and the frequency modulation of the fan provides the airflow that can control the wind speed. The airflow first flows through the large opening angle section of the test device, and the separation network in the large opening angle section makes the air generated by the fan more uniform. Then, the airflow flows into the next stable section of the test device, and there is a honeycomb in the stable section. The honeycomb device can guide the inflow gas so that the inflow gas in the stable section can flow into the contraction section in parallel along the axis of the test model. The airflow in the contraction section is accelerated and converged through the contraction port to achieve the required wind speed for the test. Finally, the stable and accelerated airflow will enter the working section. In the working section, a windbreak wall model consistent with the actual field is set up, and the corresponding test operation is carried out in the experimental section. The geometric similarity of the wind tunnel test section model mainly includes the similar design of the windbreak wall and the similar design of the OCS positive feeder. Considering the size limitation of the wind tunnel test section, the geometric similarity ratio of the whole model is finally determined to be 1:59. For example, the height of the windbreak wall in the wind tunnel test is 59.2 mm, and the height of windbreak wall in the actual site is 3500 mm:

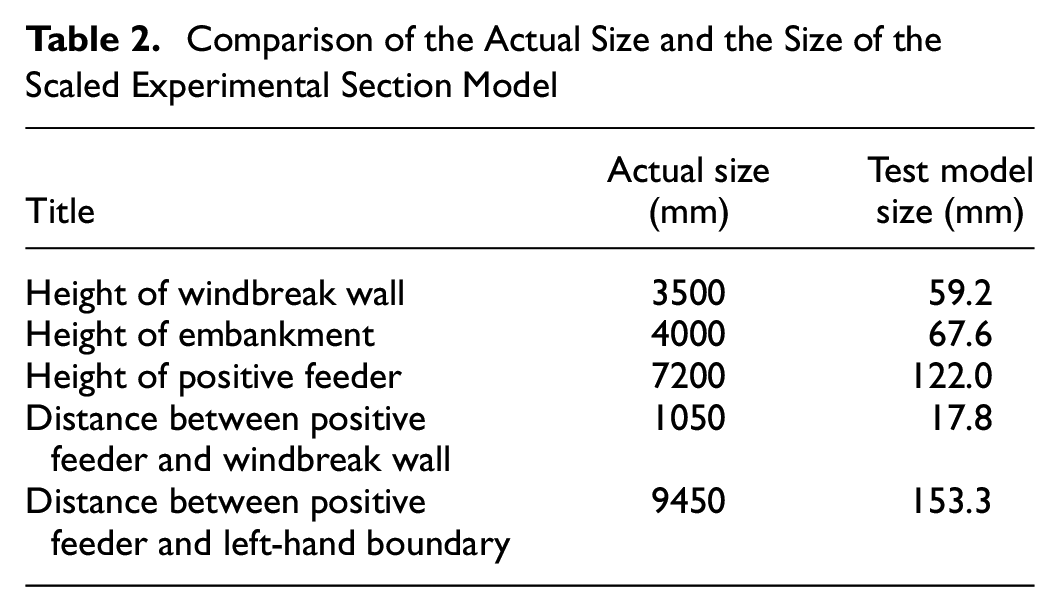
A comparison of the actual size and the size of the scaled experimental section model is shown in Table 2. The inlet wind speed is controlled by adjusting the frequency of the converter. Because the manual adjustment cannot accurately control the wind speed at a constant value, the relevant test data are measured and counted in the experimental section of the test device. The fluid simulation calculation sets the wind speed at the positive feeder position. The monitoring target point detects the wind speed at the wire position after the inlet wind speed passes through the windbreak wall acceleration. A fluid simulation model with the same size as the wind tunnel test is established and the wind speed at the positive feeder position is calculated by simulation. By comparing the experimental results with the fluid simulation results, the correctness of the fluid simulation method is verified. Figure 9 shows the wind tunnel test model, and Figure 10 shows the wind speed measuring instrument. In the test, the wind measuring outlet is fixed at the position of the positive feeder. During the experiment, the wind speed measuring instrument's wind speed detection port is fixed at the position of the positive feeder to ensure the accuracy of the measured wind speed. The test results and simulation results are shown in Table 3.
Comparison of the Actual Size and the Size of the Scaled Experimental Section Model
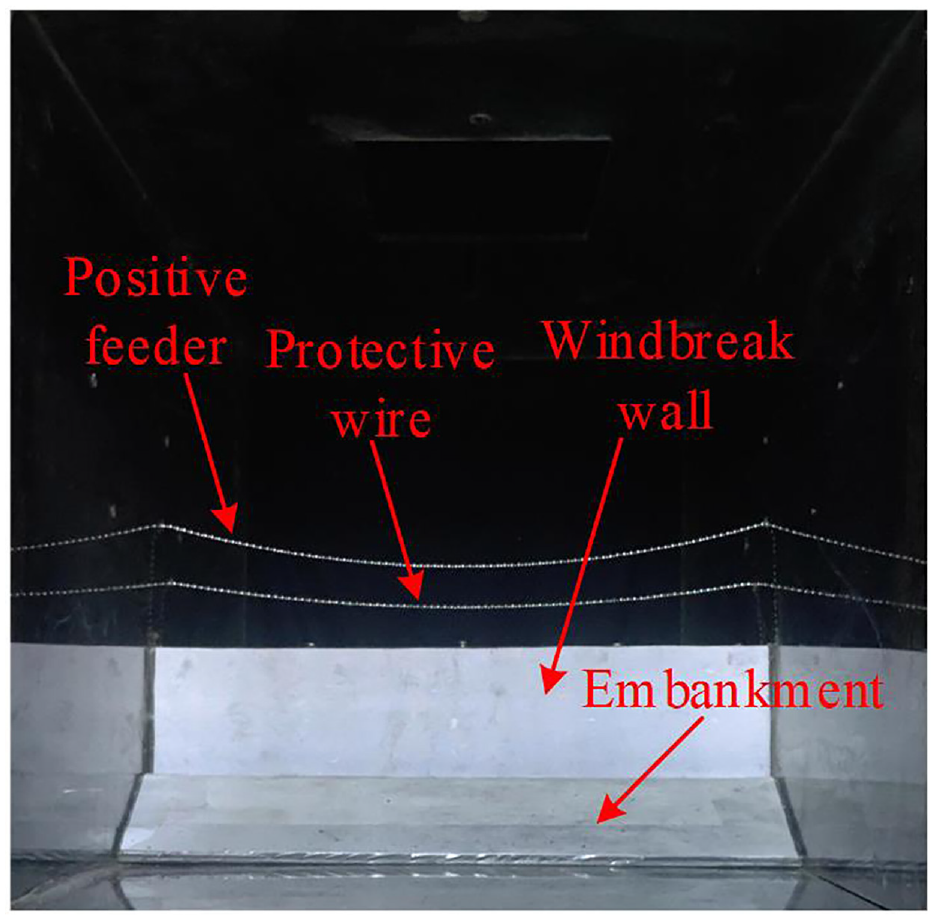
Wind tunnel test section model.
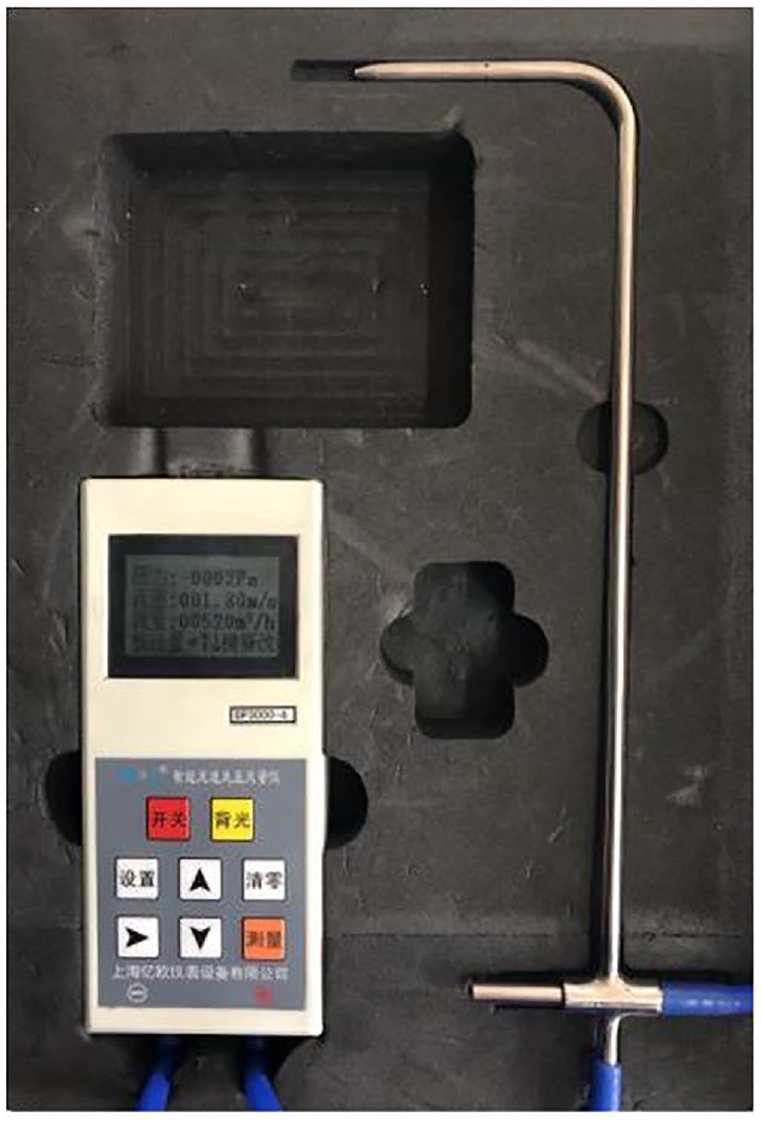
Wind speed meter.
Comparison of Wind Speed Test and Simulation Results at the Positive Feeder Under the Scale Model
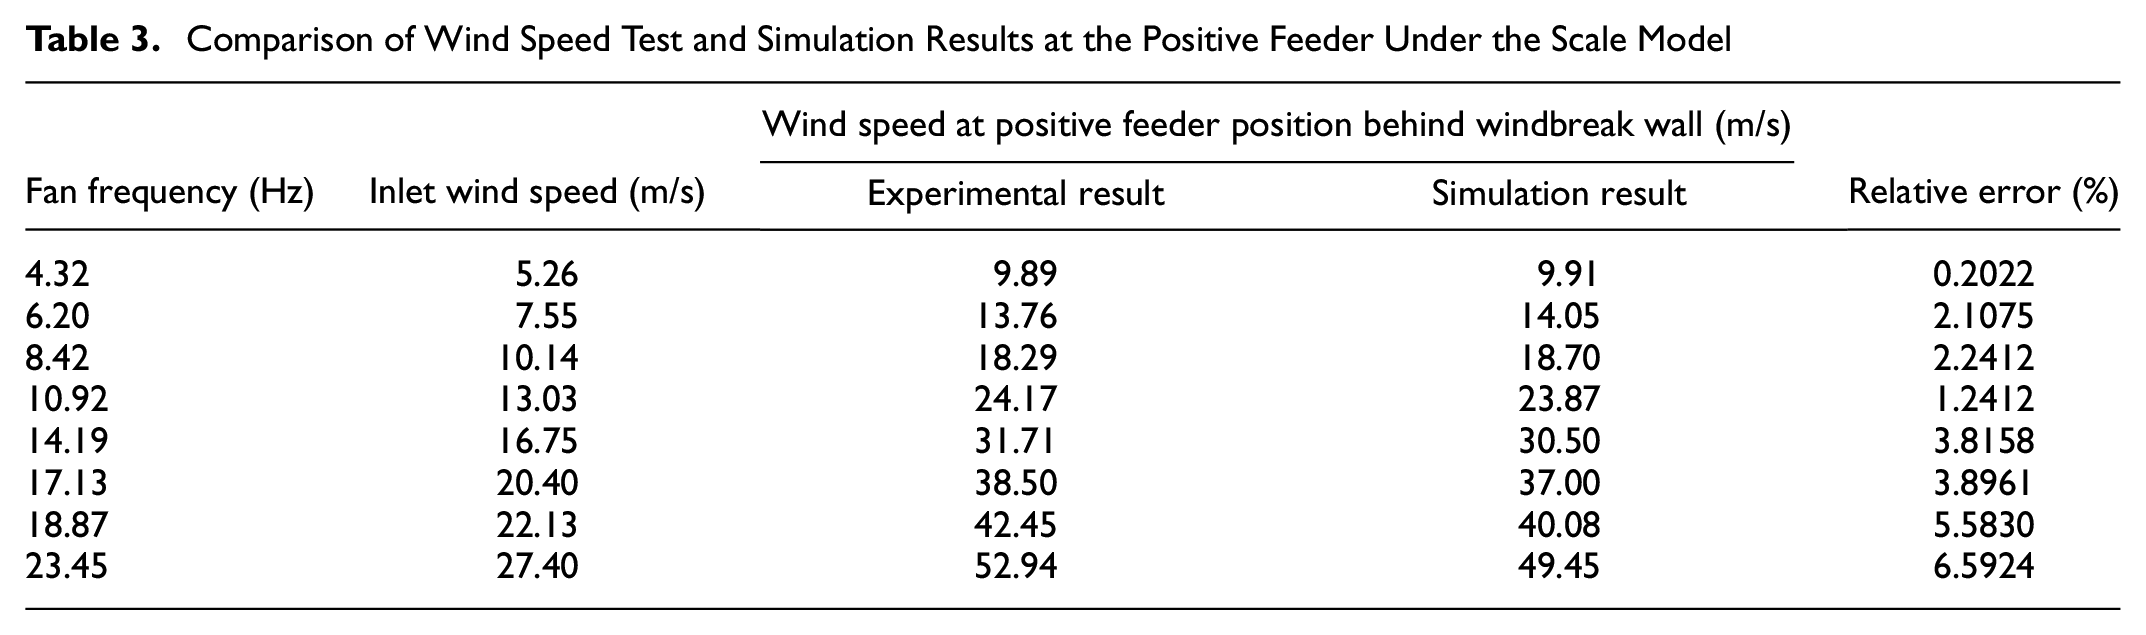
It can be seen from Table 3 that the wind speed obtained by the test results and the simulation results is about two times the inlet wind speed, but there is a certain error between the test results and the simulation results. Considering the air tightness of the test device and other factors, the error is within the allowable range. The above research shows that the fluid simulation method used in this paper can reasonably reflect the influence of the windbreak wall on the airflow at the position of the positive feeder in practice. Thus, the correctness and feasibility of the fluid simulation method used in this paper are verified, providing a reliable basis for studying aerodynamic characteristics in full-scale fluid simulation research.
The experimental data of the aerodynamic coefficient of the positive feeder are compared with the numerical calculation results in this paper, and the comparison results are shown in Figure 11. It can be found from the figure that the changing trend of the numerical calculation results is consistent with the changing trend of the experiment, which shows the accuracy of the numerical method in this paper and lays a solid foundation for the follow-up research.
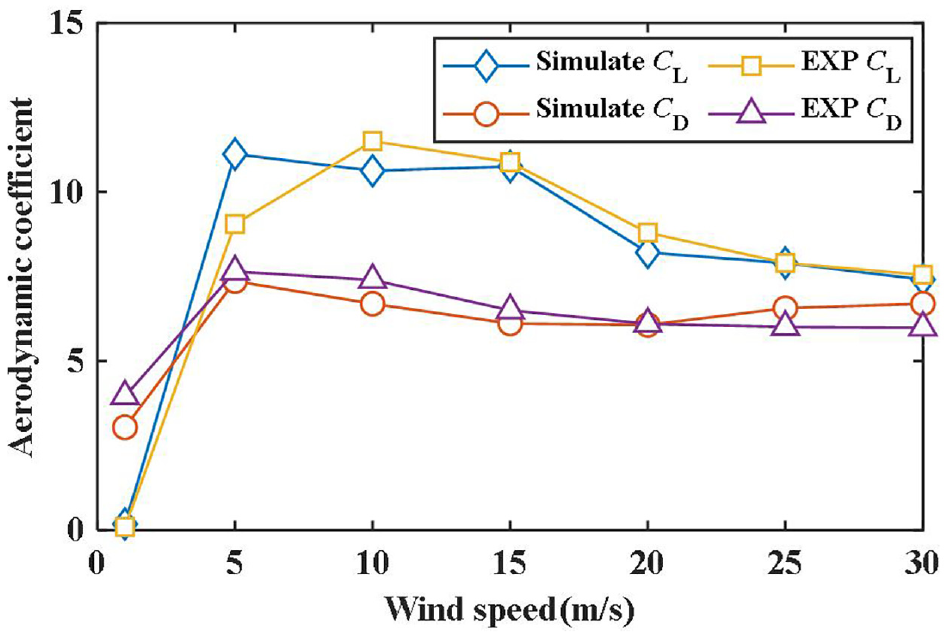
Comparison of experimental results.
Influence of Train Wind on the Aerodynamic Characteristics of the Overhead Contact System Positive Feeder
A comparison of the aerodynamic coefficient of the positive feeder with and without the train is shown in Figure 12. The figure shows that when the train passes through, the train wind has little effect on the aerodynamic lift coefficient of the positive feeder, and the changing trend is almost the same as that without train wind. The aerodynamic drag coefficient of the positive feeder with train wind is slightly smaller than that without train wind. This is mainly because the direction of the train wind is opposite to the direction of the incoming flow when the train passes, so the train wind has a certain inhibitory effect on the aerodynamic drag coefficient of the positive feeder. In general, whether there is train wind or not, the overall change trend of the aerodynamic coefficient of the positive feeder does not change. The aerodynamic coefficient of the positive feeder is not much different when there is train wind and no train wind, indicating that the train wind has little effect on the aerodynamic of the positive feeder. Therefore, the influence of the train wind on the aerodynamic of the positive feeder can be ignored in the numerical calculation process.
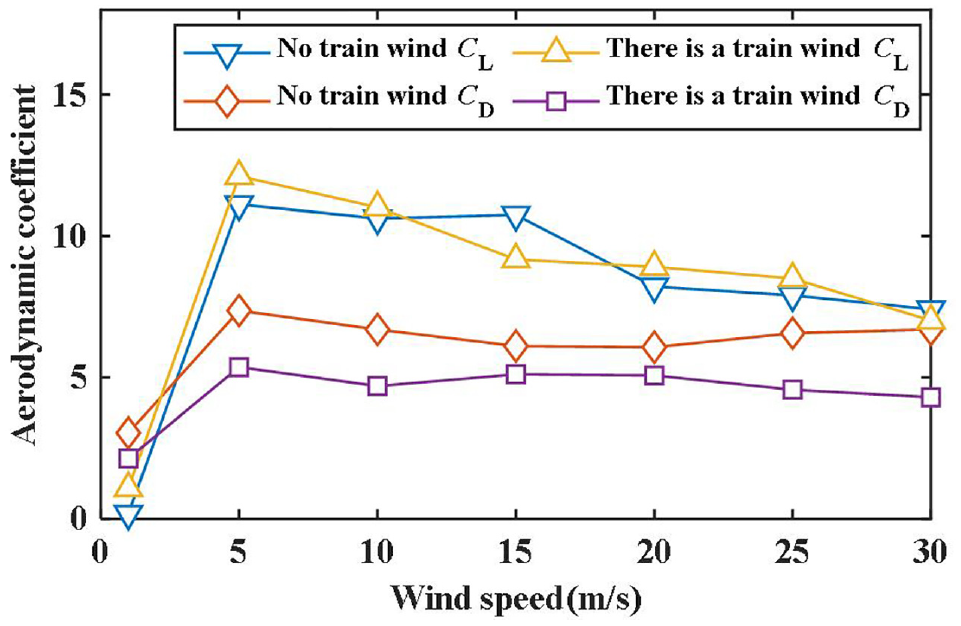
Comparison of aerodynamic coefficients with and without a train.
Influence of Embankment Structure on the Aerodynamic Characteristics of the Overhead Contact System Positive Feeder
Influence of the Windbreak Wall on the Positive Feeder
The embankment was 4 m high, and the windbreak wall was 3.5 m high and 0.4 m wide. The influence of the windbreak wall on the aerodynamic characteristics of the positive feeder was studied and analyzed at different inlet wind speeds. Figure 13 shows the positive feeder velocity cloud diagram with and without a wall at a wind speed of 1 m/s; the lift and drag time histories are illustrated in Figure 14.
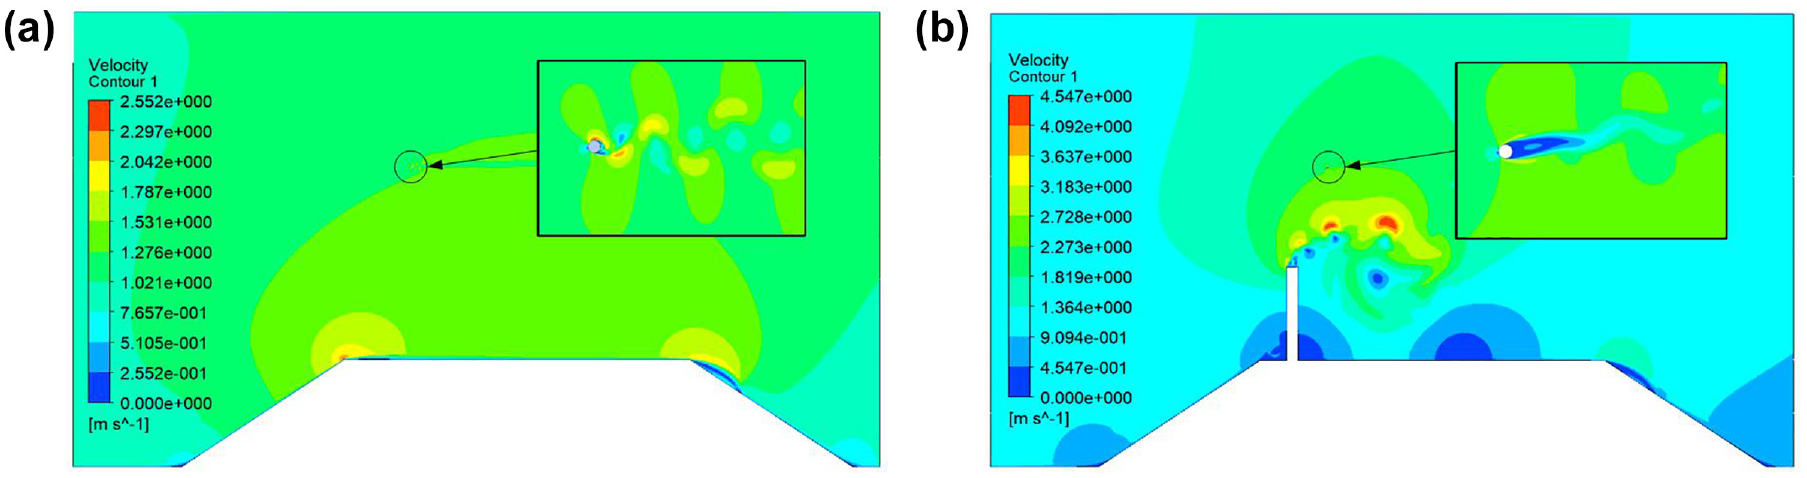
Velocity contour around the positive feeder at a wind speed of 1 m/s: (a) positive feeder speed cloud diagram without a wall and (b) positive feeder speed cloud diagram with a wall.
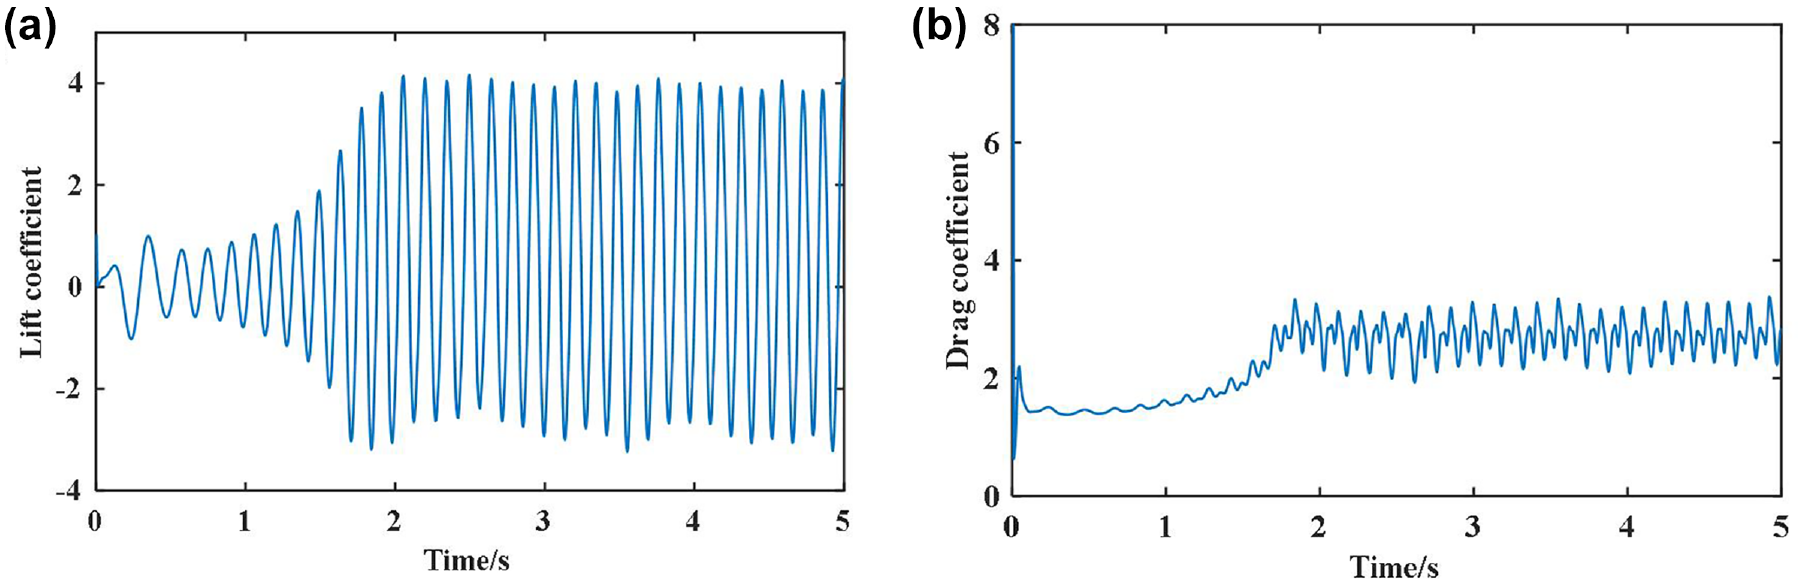
Time histories of positive feeder lift and drag coefficients without walls at a wind speed of 1 m/s: (a) lift time history without a wall and (b) drag time history without a wall.
Figure 13 shows that when the inlet wind speed is 1 m/s, the Reynolds number is small, and the aerodynamic characteristics of the positive feeder are similar to the flow characteristics around the cylinder without a windshield wall. The Karman vortex street phenomenon appears at the tail of the positive feeder, and the vortex alternately falls off. With the presence of a windbreak wall, vortex shedding mainly occurs behind the windbreak wall because of the windbreak wall obstruction to incoming airflow, whereas no obvious vortex shedding occurs at the positive feeder. As shown in Figure 14, the lift coefficient of the positive feeder mainly changes regularly between −4 and 4, and the drag coefficient also fluctuates alternately about 3 after approximately 1.5 s of stability.
The lift and drag time histories of the positive feeder are illustrated in Figure 15, given a wind speed of 15 m/s, with and without a windbreak. A comparison of both time histories shows that with the increase in inlet wind speed, the tail of the positive feeder begins to develop turbulence, and both time histories undergo gradual irregular oscillation. Without a windbreak wall, the lift coefficient time history fluctuates alternately between −8 and 8, whereas that of the drag coefficient fluctuates alternately between 0 and 5. When a windshield wall is present, the lift coefficient oscillation interval gradually increases to −30 to 30, while that of the drag coefficient increases to −10 to 30; the increase in both interval widths is because of the growth effect of the windshield wall. The results show that the growth effect of the windbreak wall significantly increases the lift and drag coefficients of the positive feeder compared to the case without a windbreak wall. Because the lift coefficient undergoes positive and negative alternating changes, the root mean square value is used for characterizing the behavior. Although the drag coefficient changes alternately, it is mostly positive. Therefore, the average value accurately characterizes its behavior.
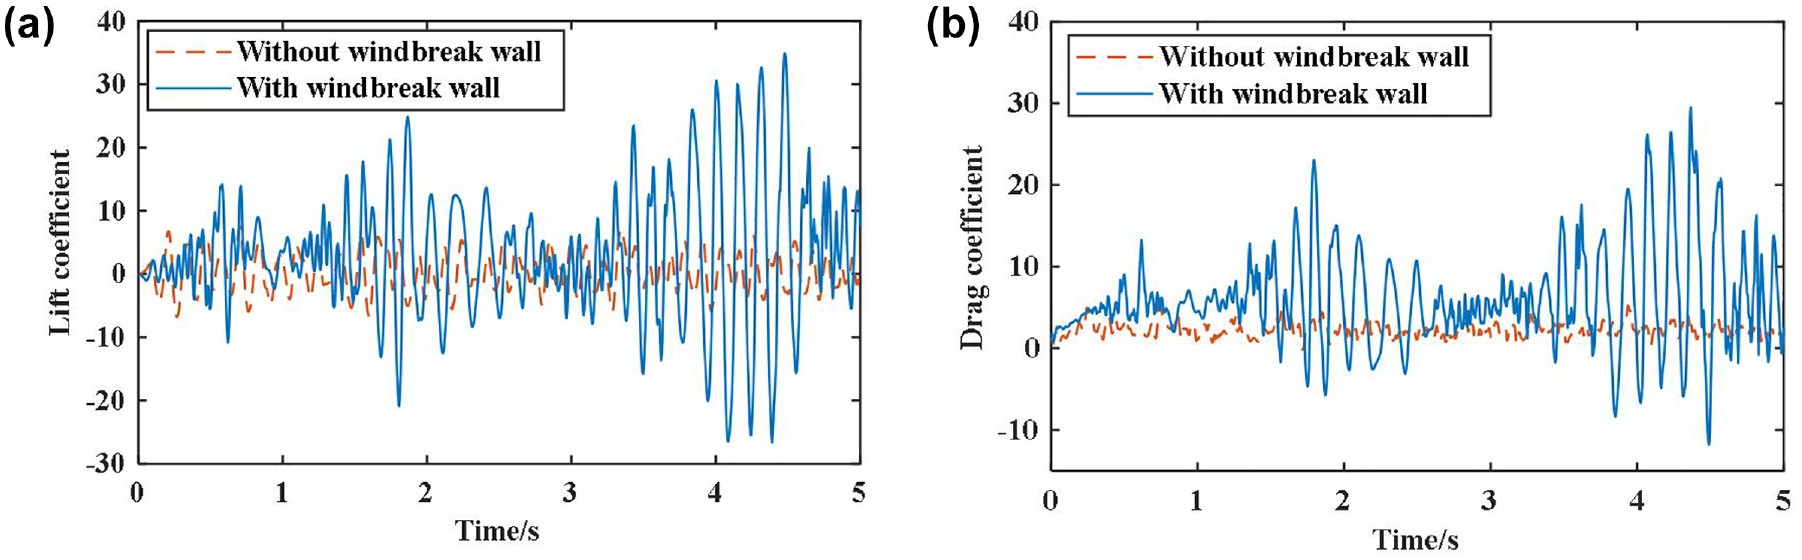
Time histories of positive feeder lift and drag coefficients at a wind speed of 15 m/s: (a) lift time history and (b) drag time history.
Figure 16 illustrates the aerodynamic behavior of the lift and drag of the positive feeder under different inlet wind speeds, with and without a wind wall. A comparison of the aerodynamic coefficient curves for cases with and without a wall shows that with the increase in the inlet wind speed, the lift and drag coefficients increase and subsequently decrease, and the lift and drag coefficients peak when the wind speed is 15 m/s. When the inlet wind speed is greater than 5 m/s, the aerodynamic lift and drag of the positive feeder in the presence of a wall are greater than those without a wall. When the inlet wind speed is 15 m/s, the lift coefficient in the case of a windbreak wall is 3.45 times that without a windbreak wall, and the drag coefficient with a windbreak wall is 2.67 times that without a windbreak wall. The lift coefficient is 2.81 times the value of the case of a 25 m/s wind speed, and the drag coefficient is 2.67 times the value of the case of a 15 m/s wind speed. In summary, the convergence effect of the windbreak wall has a certain effect on the aerodynamic lift and drag coefficients of the positive feeder located behind it.
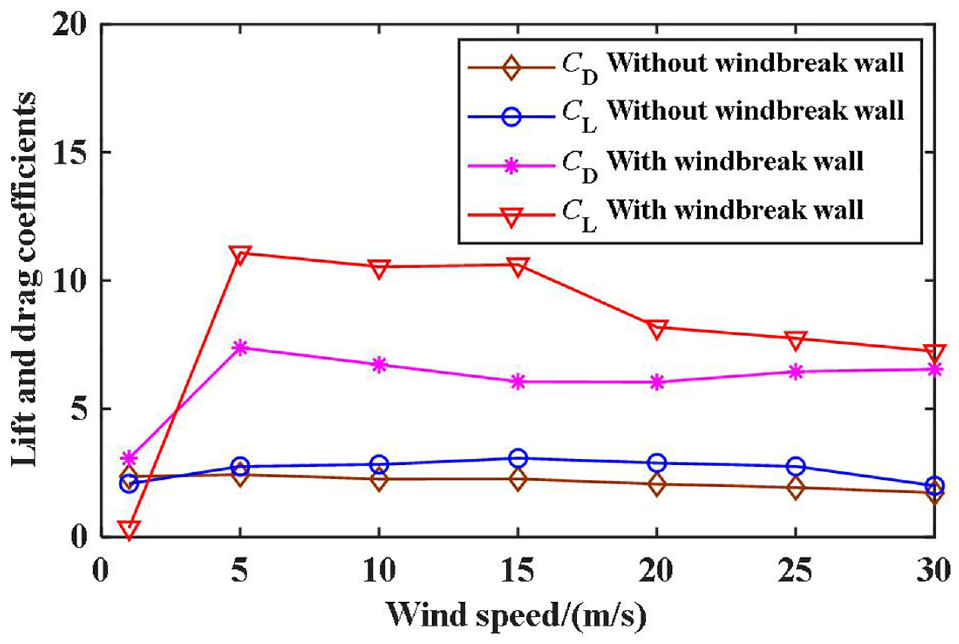
Lift and drag coefficients without and with a windbreak wall.
Influence of Straight Ground on the Aerodynamic Characteristics of the Positive Feeder
The windbreak wall with a height of 3.5 m and a width of 0.4 m was used to simulate the aerodynamic force of the OCS in the straight-ground section. We studied the aerodynamic force changes in the respective inlet wind speeds of 1, 5, 15, 20, 25, and 30 m/s. Figure 17 illustrates the variation law of the lift and drag coefficients of the positive feeder for straight ground.
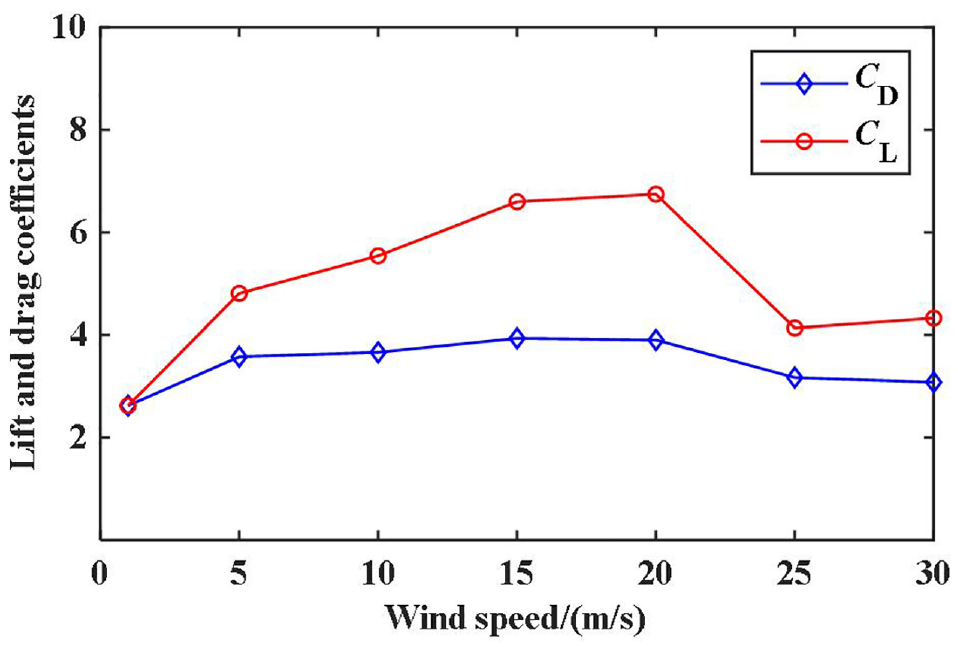
Coefficient of lift and drag of the positive feeder on flat ground.
Given the straight ground, the changing trend of the aerodynamic coefficient of the positive feeder under different wind speeds shows that the lift and drag coefficients increase and then decrease with increasing wind speed. The values peak when the wind speed is 20 m/s, but the lift coefficient decreases more significantly, and the drag coefficient decreases less and tends to be steady.
Influence of the Embankment Height on the Aerodynamic Characteristics of the Positive Feeder
Unlike the case of flat ground, the higher the embankment height is, the longer the windward surface. Owing to the climbing effect of the embankment and the convergence effect of the windbreak wall, the airflow has a specific influence on the wind speed at the positive feeder. An analysis of the influence of embankment height on the positive feeder shows that the embankment height H is 1 to 8 m ( 35 ), the interval is 1.0 m, the embankment slope rate is 1:1.5, the height of the wind wall is 3.5 m, and the width is 0.4 m. We analyzed the difference and variation of the aerodynamic characteristics of the positive feeder under different wind speeds.
We considered the aerodynamic lift and drag coefficients at the positive feeder at a wind speed of 15 m/s and embankment heights of 4 and 8 m. Compared with the values at the flat ground (embankment height of 0 m), the influence of changes in embankment height on the positive feeder of the OCS can be better understood through a comparative analysis. The aerodynamic lift and drag coefficients are presented in Table 4.
Positive Feeder Lift and Drag Coefficients at Different Embankment Heights
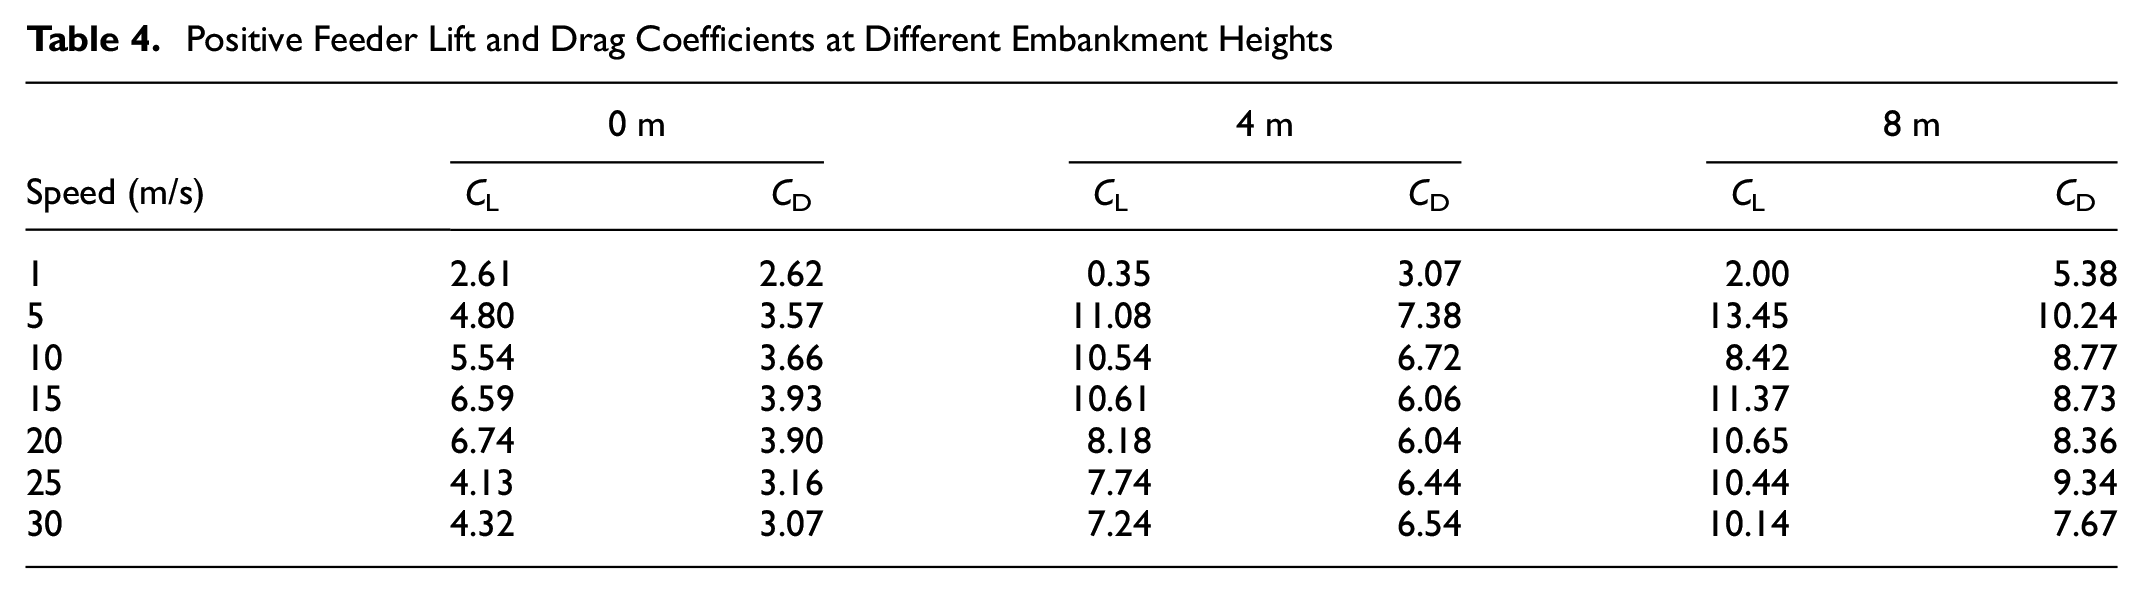
Table 4 shows that when the wind speed is 10 m/s, the lift coefficient of the positive feeder when the embankment height is 8 m is 0.80 times that when the embankment height is 4 m, which is 1.52 times that of the lift coefficient when the embankment height is 0 m. The drag coefficient of the positive feeder is 1.30 times that of the 4 m embankment and 2.40 times that of the flat ground. When the embankment height is 4 m, the lift coefficient of the positive feeder is 1.90 times that of the straight ground, and the drag coefficient of the positive feeder is 1.84 times that of the straight ground. When the wind speed is 20 m/s, the lift coefficient of the 8 m high embankment is 1.30 and 1.58 times that of the 4 m high embankment and straight ground, respectively, and the drag coefficient is 1.38 and 2.14 times that of the 4 m high embankment and straight ground, respectively. In summary, as the embankment height gradually increases, the positive feeder’s lift coefficient and drag coefficient gradually increase.
The variation trend of the lift and drag coefficients of the positive feeder with different embankment heights at 15 m/s wind speed is illustrated as a line chart in Figure 18. The figure illustrates the influence of the change in embankment height on the aerodynamic characteristics of the positive feeder. As the trend diagram shows, although the aerodynamic lift and drag coefficients fluctuate at some embankment heights, they generally increase with increasing embankment height. The aerodynamic lift coefficient peaks at a 5 m embankment height and then gradually decreases with the increase in embankment height, whereas the drag coefficient gradually increases after a large fluctuation at a 4 m embankment height. These results show that the increase in embankment height and the convergence of the windbreak wall can increase the aerodynamic lift and drag coefficient at the positive feeder, resulting in galloping.
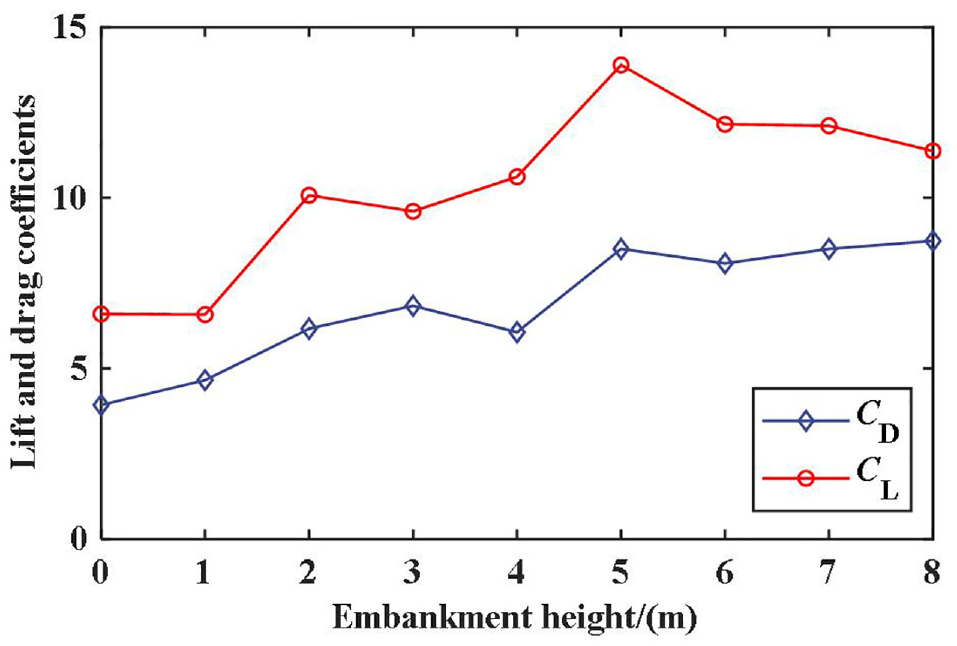
Coefficient of lift and drag of the positive feeder under different embankment heights.
Influence of the Embankment Slope Ratio on the Aerodynamic Characteristics of the Positive Feeder
To study changes in the aerodynamic parameters of the positive feeder under different slope ratios, the embankment height H is fixed and the embankment slope ratio 1:α is varied by changing the width L of the embankment slope. The embankment model is illustrated in Figure 19, a comprehensive calculation of seven types of embankment slope widths (or rates) ( 36 ). To study the influence of the embankment slope on the flow field around the positive feeder, we took the 4 m high embankment as an example: the height of the fixed windbreak wall is 3.5 m and the width is 0.4 m. The slope rate α values of the embankment slope are 0.5, 0.75, 1.0, 1.25, 1.5, 1.75, and 2.0, respectively, corresponding to the width of the seven embankment slopes of 2, 3, 4, 5, 6, 7, and 8 m. The variation trend of the aerodynamic lift and drag coefficient of the positive feeder when the crosswind speed is 15 m/s is shown in Figure 20.
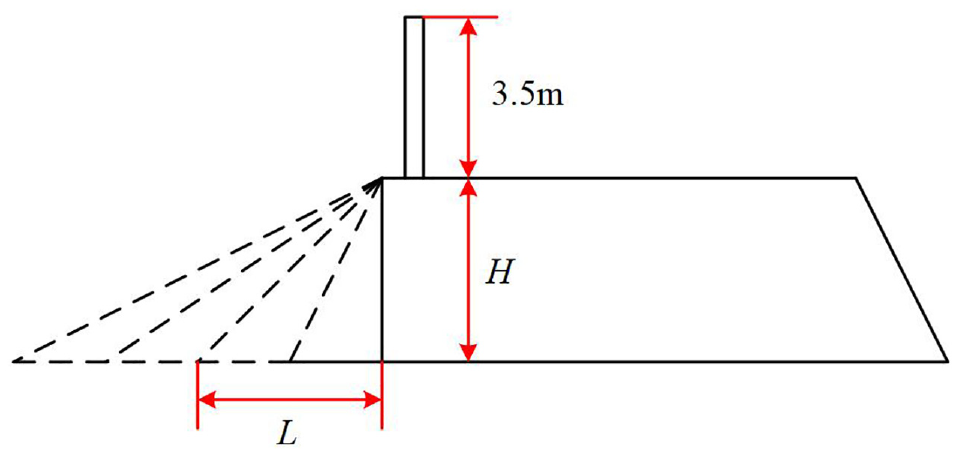
Embankment slope model diagram.
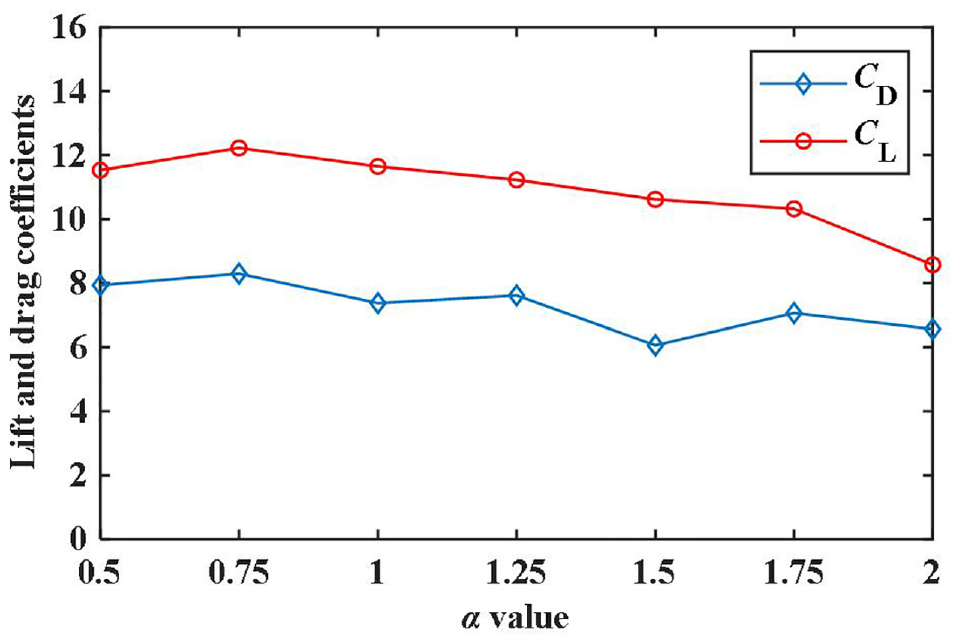
Aerodynamic coefficient of the positive feeder under different embankment slopes.
Figure 20 shows obvious differences in the aerodynamic characteristics of the positive feeder obtained by the models with different embankment slope ratios. As the α value in the embankment slope ratio gradually increases, that is, when the embankment slope gradually slows down, the aerodynamic lift coefficient of the positive feeder gradually decreases, and the lift coefficient reaches the minimum when the embankment slope ratio is 1:2. The aerodynamic drag coefficient decreases and increases, and the drag coefficient reaches a minimum when the embankment slope ratio is 1:1.5. This result occurs because when the wind passes through the embankment slope, the wind flows upward along the embankment slope because of its blocking convergence effect. The steeper the embankment slope, the more obvious the climbing convergence effect of the airflow, which intensifies the wind speed at the positive feeder behind the windbreak wall. Therefore, to reduce the influence of the embankment slope, the embankment slope rate should range between 1:1.5 and 1:2.0.
Influence of the Bridge Windshield on the Aerodynamic Characteristics of the Overhead Contact System Positive Feeder
The Lanzhou–Urumqi high-speed railway passes through Gansu, Qinghai, and Urumqi provinces. The total length of the line is approximately 1776 km, of which the length of the windy area is 579.6 km, accounting for 32.6% of the total length of the line. Because of the geographical conditions along the Lanzhou–Urumqi high-speed railway, many bridge structures have been built along the line. The windy section of Gansu and Qinghai contains 16 bridges and has a total length of approximately 36 km. The windy area of Urumqi contains 121 bridges and has a total length of approximately 66.3 km ( 37 ). Therefore, it is necessary to analyze the influence of the windshield on the aerodynamic characteristics of the positive feeder on the bridge structure.
Influence of the Windshield on the Positive Feeder
Most of the windbreak walls used on the embankment are wide, and the bridges are mostly light and thin. The windshield is 4.0 m high and 0.08 m wide. Because of the influence of the windshield on the incoming flow, the crosswind forms a vortex structure with uneven distribution as it flows through the bridge. Figure 21 shows a speed cloud diagram of the bridge with and without a windshield when the wind speed is 1 m/s.
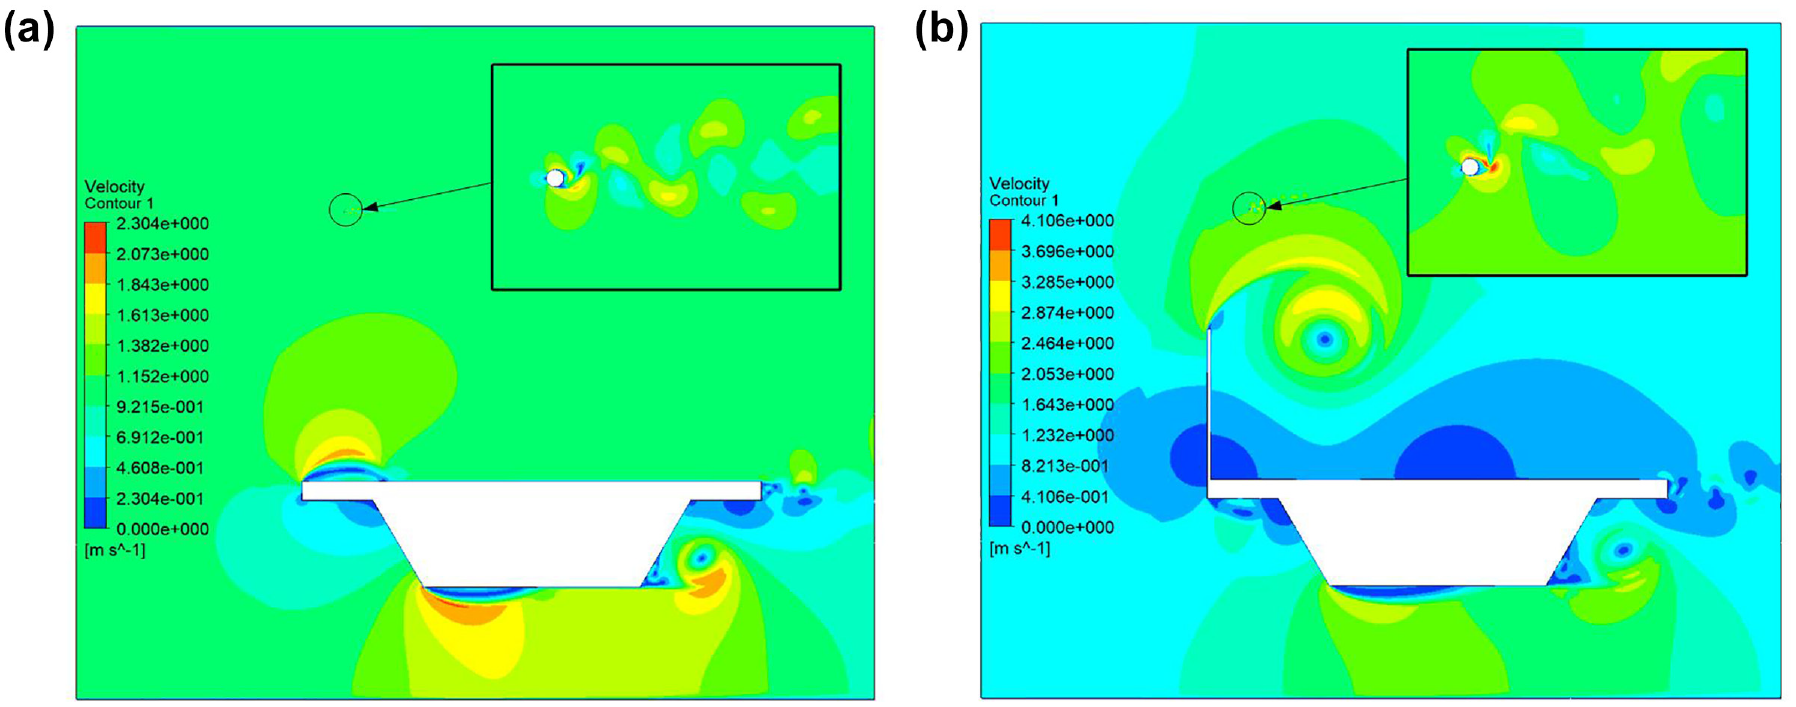
Velocity contour around the positive feeder with and without a windshield at a wind speed of 1 m/s: (a) bridge velocity cloud diagram without a windshield and (b) bridge speed cloud diagram with a windshield.
A comparison of the bridge with and without a windshield is illustrated: when no windshield crosswind flows close to the bridge deck through the rear of the positive feeder Karman vortex street phenomenon, the vortex alternates up and down. After the windshield is installed on the bridge, the crosswind direction is forced to rise because of the convergence of the windshield, and the positive feeder is located in the growth area behind the windshield, resulting in an increase in wind speed at the positive feeder.
To fully study the influence of the windshield structure on the aerodynamic performance of the positive feeder, we simulated the non-windshield and 4.0 m high windshield structures under wind speeds of 1, 5, 10, 15, 20, 25, and 30 m/s. Figure 22 illustrates the time history of lift and drag without a windshield and with a 4.0 m high windshield at a 15 m/s wind speed.
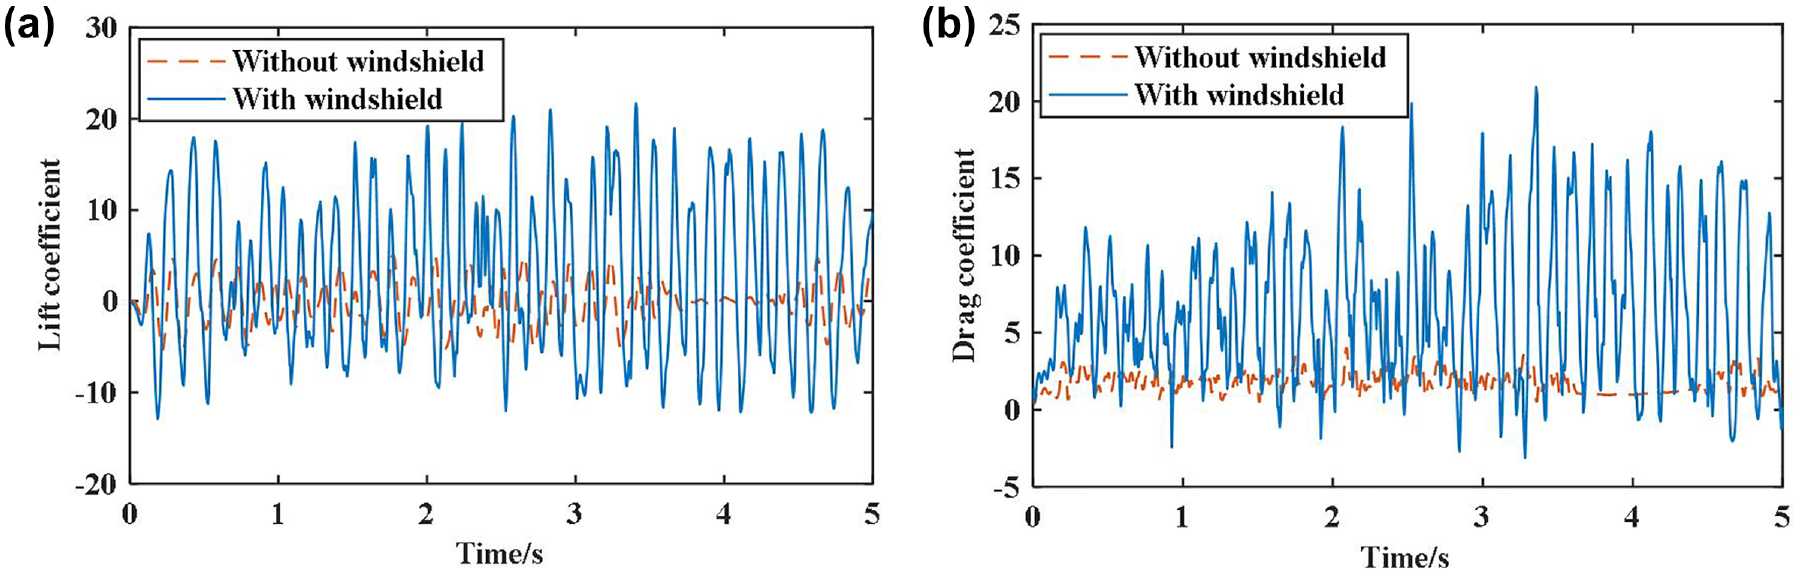
Time history of positive feeder lift and drag coefficients with and without a windshield: (a) positive feeder lift time history diagram and (b) positive feeder drag time history diagram.
Figure 22 shows that the lift coefficient of the positive feeder changes alternately between positive and negative values. Without a windshield, the change range of the lift coefficient is mainly between −4 and 4, while the positive and negative half regions are symmetrical. At a constant wind speed, the amplitude change range of the lift coefficient with a windshield is from −10 to 20, whereas the amplitude change range of the lift coefficient without a windshield is from −6 to 6. The lift coefficient with a windshield is much larger than that without a windshield, and the curve is mostly in the positive region. The drag coefficient is positive without a windshield, and the amplitude range is between 0 and 4; with a windshield, the coefficient is negative, and the variation range is larger, which is from −5 to 20. The variation curve of the lift and drag coefficients of the positive feeder under different wind speeds without and with a windshield is shown in Figure 23.
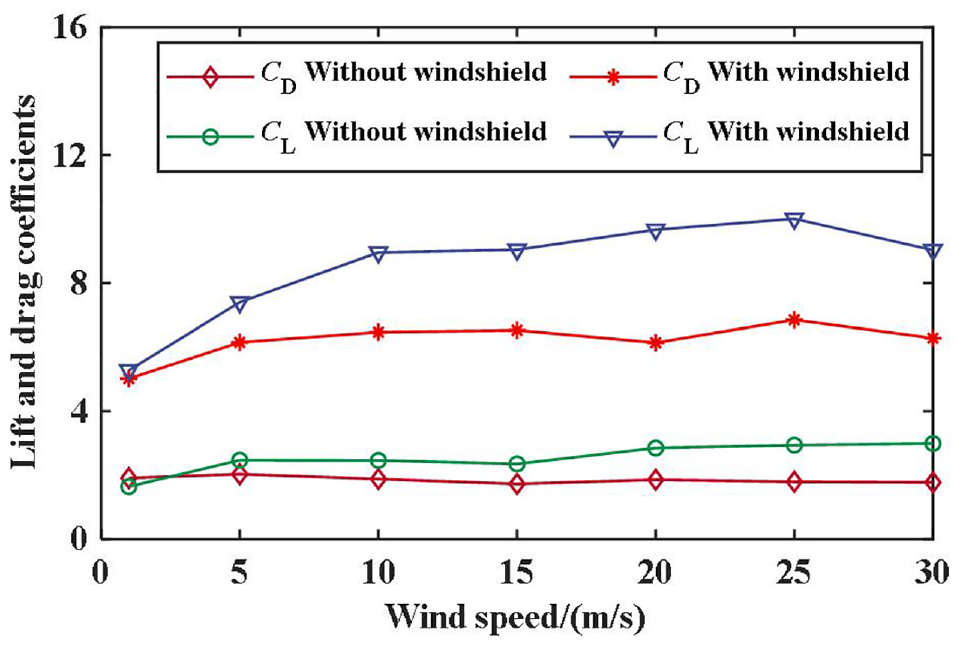
Coefficient of lift and drag of the positive feeder with and without a windshield.
We compare the aerodynamic lift and drag coefficients of the positive feeder of the bridge with and without a windshield under different inlet wind speeds. In the windshield case, the maximum multiple of the aerodynamic lift coefficient of the positive feeder is 3.84 times the value when the wind speed is 15 m/s, and the minimum multiple is 2.99 times that when the wind speed is 5 m/s. The maximum multiple of the positive feeder aerodynamic drag coefficient is 3.81 times the value at a 25 m/s wind speed, and the minimum multiple is 2.62 times the value at a 1 m/s wind speed. At a given inlet wind speed, both the aerodynamic lift and drag coefficients of the positive feeder are larger than those without a windshield. This result shows that the existence of a windshield considerably influences the change in the aerodynamic force of the positive feeder.
Influence of Windshield Height on the Aerodynamic Characteristics of the Positive Feeder
To further study the influence of the windshield height on the aerodynamic characteristics of the positive feeder, five structures with windshield heights of 2.5, 3.0, 3.5, 4.0, and 4.5 m were selected to simulate the aerodynamic performance under the wind speed of 15 m/s. The results are illustrated in Figure 24.
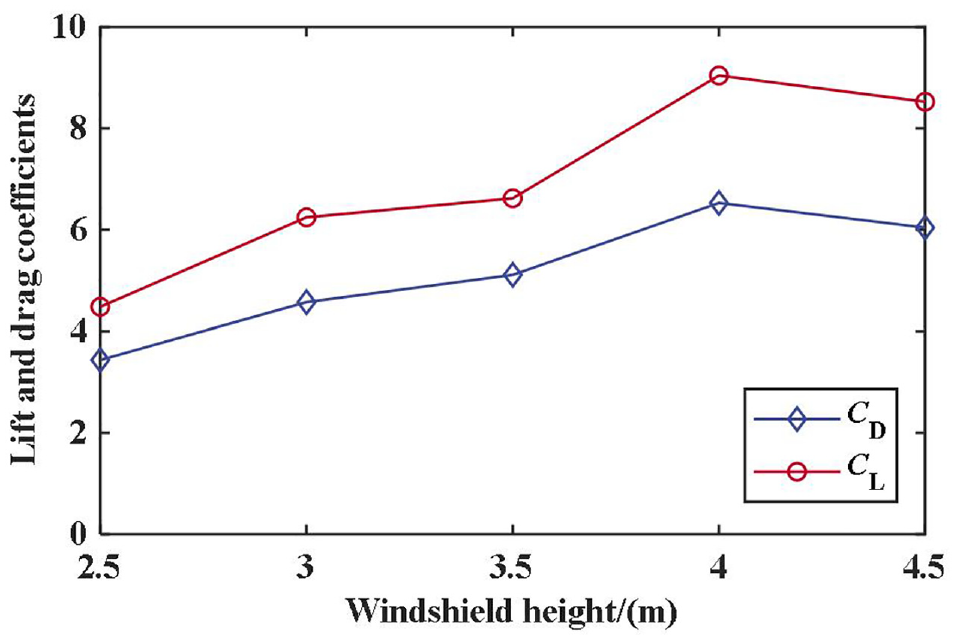
Coefficient of lift and drag of the positive feeder with different windshield heights.
Figure 24 shows that the aerodynamic lift and drag coefficients of the positive feeder increase and decrease with the increasing height of the bridge windshield; the coefficients peak at a windshield height of 4 m. At this point, the lift coefficient of the positive feeder is 2.01 times that of the 2.5 m high windshield, and the drag coefficient of the positive feeder is 1.90 times that of the 2.5 m high windshield. When the height of the windshield increases from 2.5 to 3.5 m, the lift and drag coefficients have a slower rate of increase. When the windshield height increases further from 3.5 to 4 m, the lift and drag coefficients change substantially; when the windshield height is less than 3.5 m, the influence on the positive feeder of the OCS is small.
We compare the aerodynamic lift and drag coefficients of the positive feeder given a 4 m high embankment and bridge structure at a wind speed of 15 m/s, as well as a windbreak wall and windshield of 3.5 m high. The lift coefficient of the positive feeder given a 4 m high embankment is 1.60 times that given a bridge, and the drag coefficient of the positive feeder is 1.19 times that given a bridge. This phenomenon is largely because of the particularity of the bridge structure. Compared with the case of the embankment structure, the convergence of the slope and the windbreak wall forces an upward airflow on the windward side of the embankment, changing the upper blowing angle of the incoming flow and enhancing the airflow effect at the positive feeder of the OCS. For the bridge structure, the airflow can not only occur above the windshield of the bridge, but can also occur from below the bridge. The airflow at the positive feeder is only affected by the convergence of the windshield, weakening the influence of the airflow to a certain extent.
The windshield was originally set to prevent the train from overturning in a strong-wind environment. The higher the set height, the lower the possibility of the train overturning under the influence of strong wind, and the greater the galloping probability of the positive feeder. Therefore, considering the influence of the windshield height on the aerodynamic performance of the train and the positive feeder, a reasonable windshield height should range from 2.5 to 3.5 m.
Conclusions
This paper establishes the flow field calculation models of different embankment heights and slope rates of the OCS positive feeder and analyzes the influence of embankment height and slope rate on the aerodynamic characteristics of the positive feeder. The embankment height and slope rate significantly influence the aerodynamic characteristics of the positive feeder. The main conclusions are as follows.
(1) The train wind has little effect on the aerodynamic lift of the positive feeder, and its variation trend is almost the same as that without train wind. The aerodynamic drag coefficient is slightly smaller than that without train wind, indicating that the train wind has a certain inhibitory effect on the aerodynamic drag coefficient of the positive feeder. In general, the train wind has little effect on the aerodynamic coefficient of the positive feeder. Therefore, the influence of the train wind on the aerodynamic coefficient of the positive feeder can be ignored in the numerical calculation process.
(2) When there is no windbreak wall in the railway embankment, after the wind flows through the positive feeder, it is easy to form a vortex shedding phenomenon in the rear, and the vortex alternates up and down. The aerodynamic lift and drag coefficients of the positive feeder increase first and then decrease with the increase of wind speed. When the embankment has a windbreak wall, because of the convergence effect of the windbreak wall on the incoming flow, the aerodynamic lift and drag coefficients are larger than those without a windbreak wall, which easily causes positive feeder galloping.
(3) The embankment form has a great influence on the aerodynamic characteristics of the positive feeder. When the embankment height is 8 m, the aerodynamic coefficient is 1.3 times that of the 4 m embankment height. With the increase in embankment height, the positive feeder's aerodynamic coefficient is also greater. When the height of the embankment is constant, the aerodynamic coefficient of the positive feeder changes with the slope rate of the embankment. The larger the slope rate α, the smaller the aerodynamic force on the positive feeder.
(4) In the bridge structure, the higher the windshield height, the greater the aerodynamic coefficient of the positive feeder. When the windshield height reaches 4 m, the aerodynamic coefficient of the positive feeder reaches the maximum because of the convergence effect of the windshield on the airflow. Therefore, when setting the windshield, the height of the windshield is reasonably set because of the comprehensive consideration of the influence of the windshield on the aerodynamic characteristics of the positive feeder.
In this study, we analyzed the influence of embankments and windshields with different heights and slope ratios on the aerodynamic characteristics of OCS positive feeders; the time history of specific structural models was also analyzed. Although we analyzed the influence of embankment form and windshield height on the aerodynamic characteristics of the OCS positive feeder, the differences in aerodynamic characteristics were analyzed in steady state without considering the fluctuation characteristics of the flow field and the influence of geomorphic roughness on the flow field. Therefore, it is necessary to conduct subsequent research by varying different parameters.
Footnotes
Author Contributions
The authors confirm contribution to the paper as follows: study conception and design: Y. Liu; data collection: S. Zhao; analysis and interpretation of results: Y. Liu, S. Zhao, T. Zhang, Y. Zhang, S. Wang, Y. He; draft manuscript preparation: Y. Liu. All authors reviewed the results and approved the final version of the manuscript.
Declaration of Conflicting Interests
The author(s) declared no potential conflicts of interest with respect to the research, authorship, and/or publication of this article.
Funding
The author(s) disclosed receipt of the following financial support for the research, authorship, and/or publication of this article: This work was supported by the Natural Science Foundation of China (51867013).
Data Accessibility Statement
The data used to support the findings of this study are included in the article.