
Abstract
Frequent incidents of parking fare evasion pose ongoing challenges, placing parking management departments under pressure as a result of reduced parking revenues. The causal mechanisms behind parking fare evasion, as identified in existing studies, remain incompletely explained. To address this gap, our study utilized empirical data from Nanjing, China, employing a random forest methodology to elucidate the intricate and non-linear relationships among parking site attributes, weather conditions, and the built environment concerning curb parking fare evasion behavior. Additionally, we used the Shapley Additive Explanations method to clarify the pertinent variables. Our empirical findings emphasize the significant impact of parking site attributes, including departure time, parking space availability, and occupancy, on evasion behavior. Notably, our results underscore the necessity of strategically managing parking near scenic spots and points of interest (POIs) associated with accommodation during weekends. Conversely, on workdays, there is a need for strategic oversight of parking fees in the vicinity of government institutions, scenic spots, and workplace-related POIs. These research outcomes make valuable contributions to the existing literature on curb parking and provide actionable insights for improving urban parking management.
Keywords
Curb parking is a type of parking behavior that responds to drivers’ needs, typically addressing their short-term parking requirements. Generally, curb parking allows drivers to reduce the distance between the parking spot and their destination, thus minimizing walking time. However, curb parking behavior does have some impact on road traffic capacity. Therefore, governments often implement parking fees to encourage drivers to vacate their parking spaces promptly, rather than allowing them to park for extended periods at the roadside. This is done to reduce the impact on road traffic capacity and alleviate traffic congestion ( 1 , 2 ). In recent years, the effectiveness of parking fees as a demand regulation mechanism has been hindered by instances of parking fare evasion. Fare evasion in parking refers to individuals or drivers who do not pay the parking fee. Because they are not bound by this parking fee mechanism, they disregard the fee-based regulation, leading to prolonged curb parking without considering the initial purpose of providing this service by the government. Furthermore, fare evasion can result in substantial loss of revenue and adverse social norms ( 3 , 4 ).
At present, the majority of research on fare evasion is concentrated on the incidence within public transportation systems, including buses and subways. These inquiries have explored the intricate interplay between fare evasion and socioeconomic factors (such as age, gender, and income), transportation preferences (including car ownership and frequent mode choices), and social perceptions (such as attitudes toward public transport charges, fare evasion checks, and associated penalties) ( 5 , 6 ). Furthermore, investigations have delved into the associations between bus-specific attributes, such as occupancy levels, time of day, and passenger boarding and alighting rates, and the incidence of evasion ( 7 ). Some studies have also approached this phenomenon from the vantage point of passenger psychology, exploring potential correlations between passenger satisfaction during bus rides and instances of fare evasion ( 8 ). Satisfaction has the potential to significantly reduce the probability of severe fare evasion, and vice versa with dissatisfaction ( 3 , 9 , 10 ). The relationship between satisfaction and fare evasion varies among different demographic groups ( 11 , 12 ). However, it is notable that there is a considerable gap in research on fare evasion with regard to parking fare evasion. A substantial body of research on curb parking management has predominantly focused on aspects such as pricing, space allocation, and infrastructure ( 13 ). In-depth research on fare evasion behavior in curbside parking is lacking.
Moreover, the current research on the relationship between general fare evasion behavior, encompassing public transportation like buses and subways, and factors influencing it predominantly relies on statistical models, including negative binomial regression, structural equation models, and logistic regression models ( 5 , 6 , 8 ). Statistical models often hinge on linear assumptions, which may limit the scalability of individual environmental factors and obscure vital information pertaining to the impact of policy changes ( 14 ). Even when researchers emphasize local variations, they frequently employ preemptive variable segmentation, such as categorical variables, to examine regional impact disparities. However, this artificial segmentation introduces the possibility of model bias. Furthermore, the influence of factors such as temporal distribution on fare evasion is seldom explored by categorizing time variables into 12 classes to investigate the non-linear relationship between time and fare evasion. This is because time does not follow a simple linear pattern and is closely linked to drivers’ travel purposes. In summary, these statistical methods may not be suitable for data-driven analysis. Data-driven analysis seeks to discover robust correlations from the multifaceted interactions between fare evasion behavior and influencing factors. Statistical models often necessitate manageable datasets with fewer attributes ( 15 ), and employing numerous input variables can lead to larger standard errors, wider and less precise confidence intervals ( 16 ), and may weaken genuine associations or even yield spurious correlations.
Additionally, while the existing literature has explored the interactions between the built environment and factors like population health, pedestrian activities, and commuting habits ( 14 , 17 ), the link between the built environment and drivers’ involvement in evading parking fees requires further investigation. The influence of built environment characteristics on behavior may vary within different ranges ( 18 ). For built environment variables, their effect on parking fee evasion behavior may not be constant but rather more intricate, that is, non-linear. Machine learning-based models exhibit superior performance. These models operate without preconceived associations and assumptions, relying solely on data-driven insights, and are better equipped to capture non-linear relationships and threshold effects between independent and dependent variables. For example, the random forest model ( 19 , 20 ) has seen wide application across various transportation domains, investigating factors like jogging behavior, pollutant emissions in public transportation, and elements influencing ride-sharing demand ( 18 , 21 ).
In this context, this study aims to address the following questions: (i) What are the primary influencing factors of fare evasion behavior in curb parking? Which factors hold greater significance? (ii) How do parking site attributes, weather conditions, and the built environment intersect and affect drivers’ engagement in curb parking fare evasion? Are the relationships between these variables linear or non-linear? (iii) What are the differences in evasion behavior between workdays and weekends? (iv) What strategic interventions should decision makers implement to improve this situation? To address these questions, we employed ArcGIS to process multi-source data, including weather conditions data, road network information, and parking site attributes. Subsequently, we utilized the random forest algorithm to construct regression models for both weekend and workday scenarios. This facilitated the identification and analysis of factors influencing fare evasion behavior. Furthermore, by applying the Shapley Additive Explanations (SHAP) methodology, we examined the intricate non-linear relationships and distinct consequences linking curb parking fare evasion behavior to parking site attributes, weather conditions, and built environment in both scenarios. Therefore, this study introduces several novel aspects compared with previous research: 1. It presents a pioneering examination of curb parking fare evasion behavior using machine learning techniques in the context of parking fare evasion to explore influencing factors and non-linear relationships. 2. It integrates weather and built environment variables into the fare evasion investigation. 3. It reveals variations in factor importance between the two scenarios, driven by substantial differences in travel purposes during weekends and workdays. This study not only enhances the existing research landscape but also advances the application of partial dependency graphs within data mining algorithms for traffic research.
This paper is structured as follows. The next section briefly reviews research on fare evasion in transportation and methodologies. The third section introduces the data processing methods and model methods used in the study. The fourth section discusses the results and data analysis. The final section summarizes the main findings and proposes some relevant policy implications.
Literature Review
In this section, we primarily review fare evasion behavior, with a focus on public transportation as the representative objective. Currently, research on fare evasion predominantly centers around public transportation, paying limited attention to fare evasion in curb parking. Studies on curb parking management have primarily concentrated on pricing, space allocation, and infrastructure aspects ( 13 ), leaving fare evasion as a relatively underexplored domain. Drawing from the research by Ayal et al., fare evasion behavior exhibits a structure akin to dishonest conduct ( 22 ). Whether in the context of public transportation or curb parking, fare evasion can be construed as a form of dishonest behavior, though it should be noted that unintentional fare evasion may occur to some extent. Given this perspective, we primarily delve into a selection of literature related to public transportation fare evasion in our literature review, offering insights and references that may be useful in understanding curb parking fare evasion behavior.
Fare Evasion in Transportation
The existing literature on fare evasion has grown significantly across various academic disciplines. It is primarily clustered in the domains of research centered on fare evaders, criminology, economics, technological innovations, and operations research. Research centered on fare evaders, in particular, encompasses investigations into the characteristics, attitudes, motivations, and behaviors of fare evaders. For instance, fare evasion tendencies are more pronounced among certain demographics, including young individuals, men, students, and immigrants ( 23 ). Additionally, it is more prevalent for passengers on shorter trips to engage in fare evasion than those on longer journeys ( 23 ). Moreover, income level, educational attainment, and occupational status emerge as notable determinants in the profiles of individuals who evade fares ( 5 , 24 ). Fare evasion is closely tied to public dissatisfaction. Satisfaction can reduce the likelihood of engaging in serious fare evasion behavior, as compared with dissatisfaction ( 3 , 9 , 10 ). It is worth noting that the relationship between satisfaction and fare evasion varies across different demographic groups ( 11 , 12 ). Additionally, factors such as bus occupancy rates and departure frequencies may influence satisfaction with public transportation services ( 25 ). These factors exhibit a range of correlations. From an economic perspective, research into fare evasion behavior primarily focuses on fines, inspections, fare collection systems, and management measures for addressing fare evasion. For instance, Troncoso et al. ( 26 ) found a negative relationship between fare prices and fare evasion behavior; an increase in fare prices leads to a higher fare evasion rate. An increase in inspection rates results in a decrease in fare evasion rates. For light rail systems, rear-door boarding leads to an increase in fare evasion ( 4 ).
Generally, fare evasion research tends to consider passengers as rational actors who seek to maximize their utility by weighing the cost of paying the fare against the cost of being caught without paying ( 27 ). As a result, previous fare evasion models primarily categorize deterrence methods into two classes: fines and inspections. Inspection methods often revolve around measures and actions that increase the likelihood of detecting fare evaders (e.g., recruiting more inspectors, investing in detection or surveillance technology) and the severity of penalties when fare evasion is detected (e.g., increasing fines, establishing a register of fare evaders, publicly disclosing fare evader profiles) ( 28 , 29 ). However, in some countries, passengers who evade the fare and drivers who engage in illegal parking may be fined if caught. Fined passengers or drivers often fail to pay the fines, rendering increased fines or additional inspectors ineffective, as they incur no losses and, thus, do not attempt to evade inspection. Consequently, addressing this issue requires more than fines; it necessitates the effective implementation of physical punitive measures to further deter fare evaders and promote the effective enforcement of fare policies.
The implementation of such deterrent measures therefore becomes paramount. Research from the field of criminology posits that fare evasion constitutes a criminal act, prompting considerations from a criminological standpoint as to the deterrence, enforcement, and preventive measures (both physical and psychological) and safety studies related to fare evasion behavior. Studies indicate that potential fare evaders are more concerned about the likelihood of being detected than the subsequent penalties they may face ( 30 ). In other words, appropriate inspections can reduce fare evasion behavior to a certain extent ( 31 ). Technological innovations introduce new methods for fare evasion, such as ticket system upgrades, smart cards, and electronic tickets ( 32 , 33 ). Operations research, on the other hand, analyzes patrol scheduling, security personnel allocation, and resource distribution from the perspective of inspection management planning ( 34 , 35 ). For instance, Barabino and Salis ( 36 ) considered maximizing system-wide profit when fare evasion occurs and proposed an accurate economic framework to determine the optimal number of inspectors within long time windows. Alshawish et al. ( 37 ) transformed the interaction between inspectors, security officers, and fare evaders into a game theory model using random probability distributions, and then derived the optimal cost effectiveness and inspection schedules. Certainly, recent research has begun to quantify fare evasion risk. For example, Barabino et al. ( 9 ) have integrated a fare evasion factor prediction model, introducing a novel risk-based approach to quantify fare evasion risk in public transit networks.
Methodologies
Evasion behavior undergoes analysis through diverse methodologies. Guarda et al. ( 7 ) constructed a negative binomial regression model to elucidate the relationship between independent variables, such as inspection level, bus occupancy, and passenger boarding and alighting counts, and fare evasion behavior. González et al. ( 38 ) employed K-means clustering to classify individuals as evaders or non-evaders, subsequently subjecting them to statistical comparisons using proportional tests. Barabino et al. ( 39 ) employed logistic regression models to analyze operational data from Italian bus companies, utilizing probabilities to estimate evaders’ inclinations. Broadly, the prevalent analytical approaches within the pertinent literature encompass negative binomial regression models, logistic regression models ( 5 ), variance analysis, structural equation models ( 6 ), ARIMA models ( 12 ), and time series methods ( 26 ), among others.
The majority of analogous methods in these studies are primarily adept at estimating the mean of a global variable, while encountering challenges in apprehending localized variations, thereby assuming static attributes across the entire area. The model’s reliability is compromised if it fails to encompass specific local dynamics. Interestingly, the proposition of a linear relationship hypothesis between independent and dependent variables, albeit commonplace, proves unsuitable for localized analyses ( 40 ). Furthermore, a substantial portion of the pertinent investigations predominantly revolve around public transportation systems, such as buses and subways. Directly extrapolating these findings to the parking domain is intricate. As a response, this paper opts to leverage machine learning techniques to capture the intricate non-linear relationship between curb parking fare evasion and its influencing factors. These aspects warrant further scrutiny to elucidate the nuances and intricate connections between them, subsequently yielding precise recommendations for urban parking planning and management.
Data and Methodology
Study Area and Data Source
Nanjing, located in eastern China, is a place of significant importance, covering an area of 6,587.02 square kilometers and housing a resident population of 9.42 million. It holds the status of a national new district in China. The focus of this study, as illustrated in Figure 1, is centered within the boundaries of the Jiangbei New District, which includes 55 curb parking street sites with a total of 7,715 parking spaces. In Figure 1 (right), the dull pink areas represent curbside parking zones, while the black lines within them depict the streets designated for curbside parking.
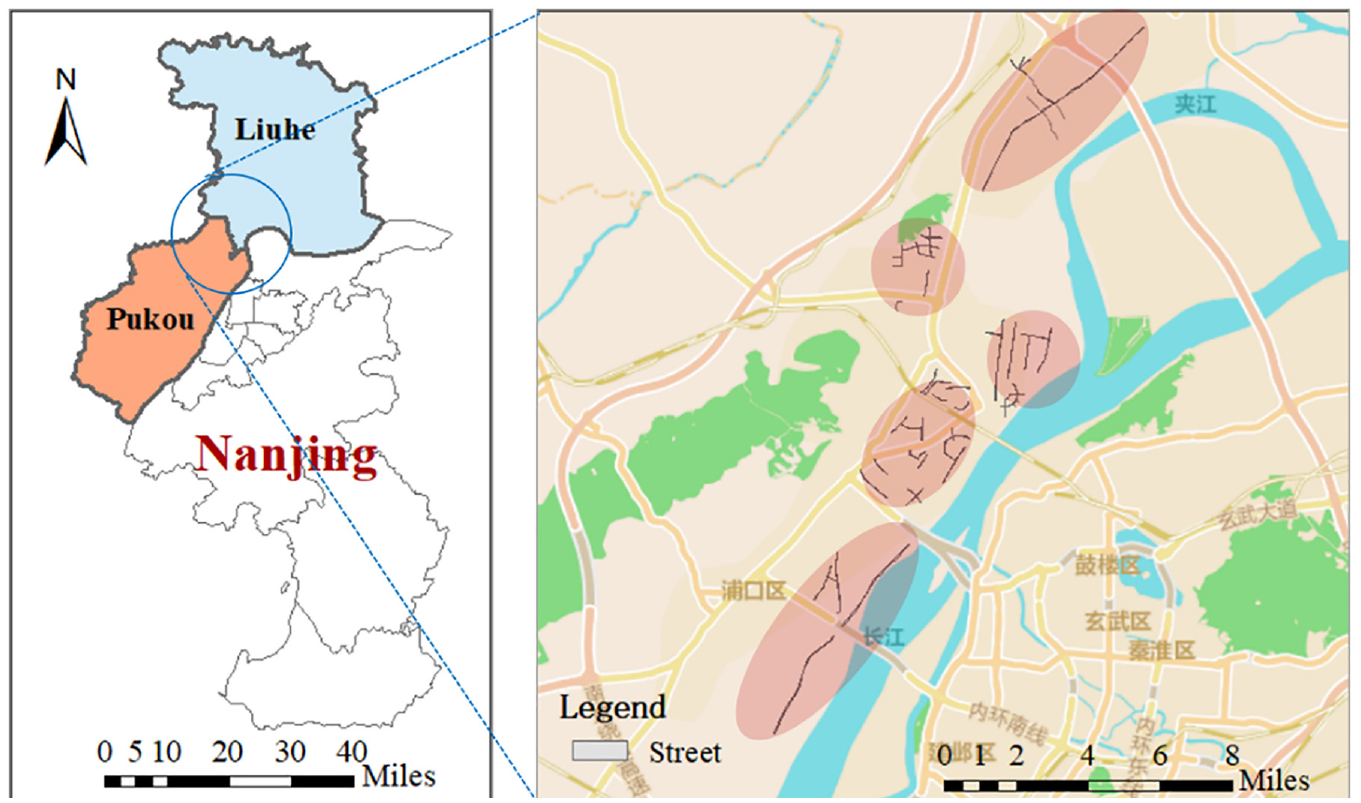
Schematic diagram of the study area.
This study employs various data types, including curb parking records, fare evasion records, built environment data, weather conditions data, and road network data. Specifically, the research integrates records of curb parking and associated fare evasion records obtained from the Jiangbei New District Parking Company. The data collection period extends from May 5 to May 31, 2022, covering a total of 19 working days and eight non-working days. It is worth noting that our research focuses on vehicles parked at curbsides, and we employ a combined approach that involves manual inspection and smart billing for the collection of fees. In this method, each attendant is responsible for supervising a specific area of curbside parking. When they observe a vehicle parking in their designated zone, the attendant uses a Personal digital assistant (PDA) to input the license plate number (vehicle identification), recording the road parking fee information into the system. As the vehicle is about to depart, a fee receipt is issued to the vehicle’s driver, who can make payment using either cash or online methods. For vehicles that leave without making a payment, we categorize this as evasion behavior. It is important to note that the fare evasion behavior in our research data is categorized as “total fare evasion.” This is because, with our combined approach of manual patrols and smart billing, payments by drivers are typically completed under the supervision of attendants, resulting in a relatively low incidence of partial fare evasion. Additionally, our PDA system for inputting parking information can only distinguish between “paid” and “unpaid” statuses. Therefore, when we refer to fare evasion in our study, we are encompassing “total fare evasion.” As depicted in Figure 2, a comprehensive parking record and fare evasion record encompasses nine distinct fields: vehicle identification (ID), parking space number (NO.), site name, street location, parking duration, price, entry time, departure time, and state (paid and unpaid).
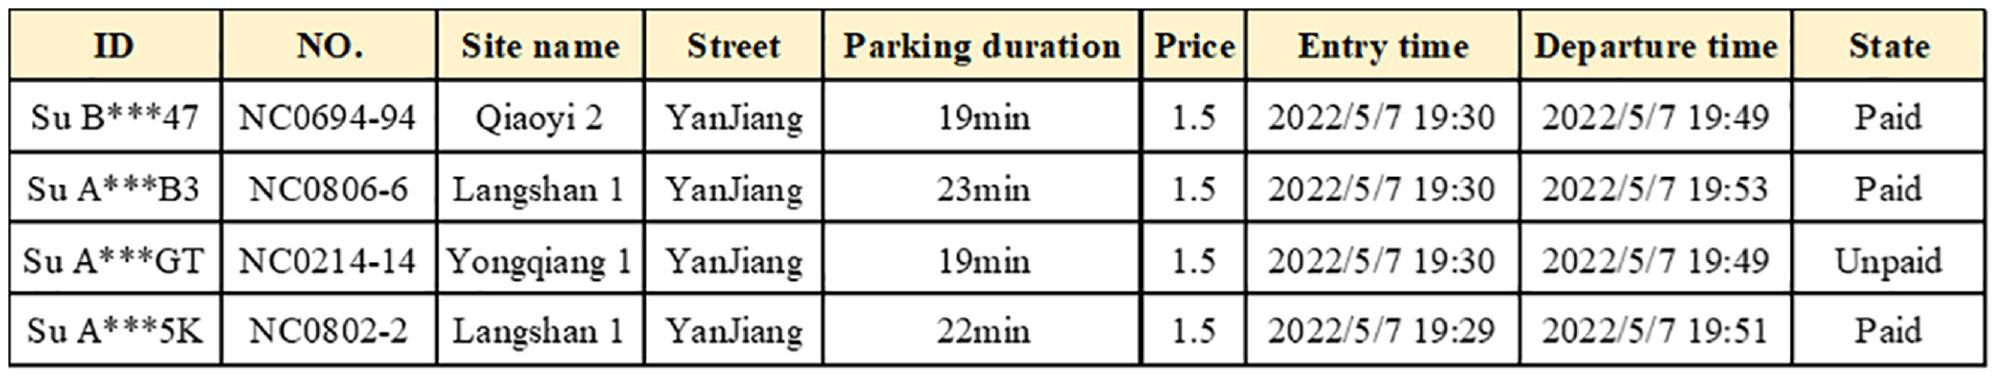
Examples of parking records and fare evasion records.
The original data underwent cleansing through the implementation of the following procedures: (i) removal of duplicate records with missing information and (ii) alignment of entry and departure times for adjacent vehicles occupying the same parking space. This second step encompassed the extraction of data instances where a negative time interval existed between the departure time of the preceding vehicle and the entry time of the succeeding one. This involved matching the license plate numbers of the two records, merging duplicate data, and eliminating data for the rear vehicle without duplicates. Following this cleaning process, the dataset was refined, resulting in 230,381 valid curb parking records and 63,608 fare evasion records. Notably, this yielded a fare evasion rate of 27.6%, underscoring the significance of the issue.
As previously outlined, this study is dedicated to examining the factors influencing curb parking fare evasion and its intricate effects. As a result, we propose the following hypotheses: H1. The attributes of parking sites (occupancy rate, price, number of parking spaces, departure times, and house prices in the neighborhood) exhibit non-linear effects on curb parking evasion rates, with distinctions between workdays and weekends. H2. The surrounding built environment of parking sites (attributes of working, accommodation, catering, attributes of leisure and entertainment, scenic spots, schools, medical services, government organizations, life services, science, education and culture, subway, bus stations, and land use mix) demonstrates non-linear impacts on curb parking evasion rates, with variations observed between workdays and weekends. H3. Weather conditions (temperature, humidity, wind speed, and precipitation) have non-linear effects on curb parking evasion rates, with differences between workdays and weekends.
Python software was utilized to collect built environment data from both the Pukou District and the Liuhe District in Nanjing. This data collection involved the use of the application programming interface (API). The comprehensive points of interest (POIs) dataset includes crucial attributes such as address, longitude, latitude, and POI category. Furthermore, weather data were obtained from the Weather Underground website, encompassing four primary hourly indicators: temperature, humidity, wind speed, and precipitation. This data was specifically retrieved for the city of Nanjing during the period spanning from May 5 to May 31, 2022.
Data Processing and Variables
The study period was partitioned into 12 time intervals, specifically: 08:00–09:00, 09:00–10:00, 10:00–11:00, …, 17:00–18:00, 18:00–19:00, and 19:00–20:00, taking into account the research objectives and the parking fee schedule during this investigation. The hourly evasion rate

where
Parking site attributes, built environment, and weather are the main independent variables. Parking site attributes include hourly occupancy, departure time, the number of spaces, and price. The hourly occupancy

where
Based on the parking purpose, the built environment variables were divided into the following categories: attribute of working, accommodation, catering, attributes of leisure and entertainment, the subway and bus stops, scenic spots, medical services, government organizations and 13 other categories. Taking 500 m as the buffer zone, the built environment data in the parking site area were counted, as shown in Table 1. Temperature, humidity, wind speed, and precipitation are included in the weather index. Additionally, we intentionally use house prices in the surrounding area as an independent variable since socioeconomic information may affect the driver’s payment psychology. House price information was obtained by Python crawler and Baidu API from Lianjia, as shown in Table 1.
Descriptive Statistics of the Dependent and Independent Variables
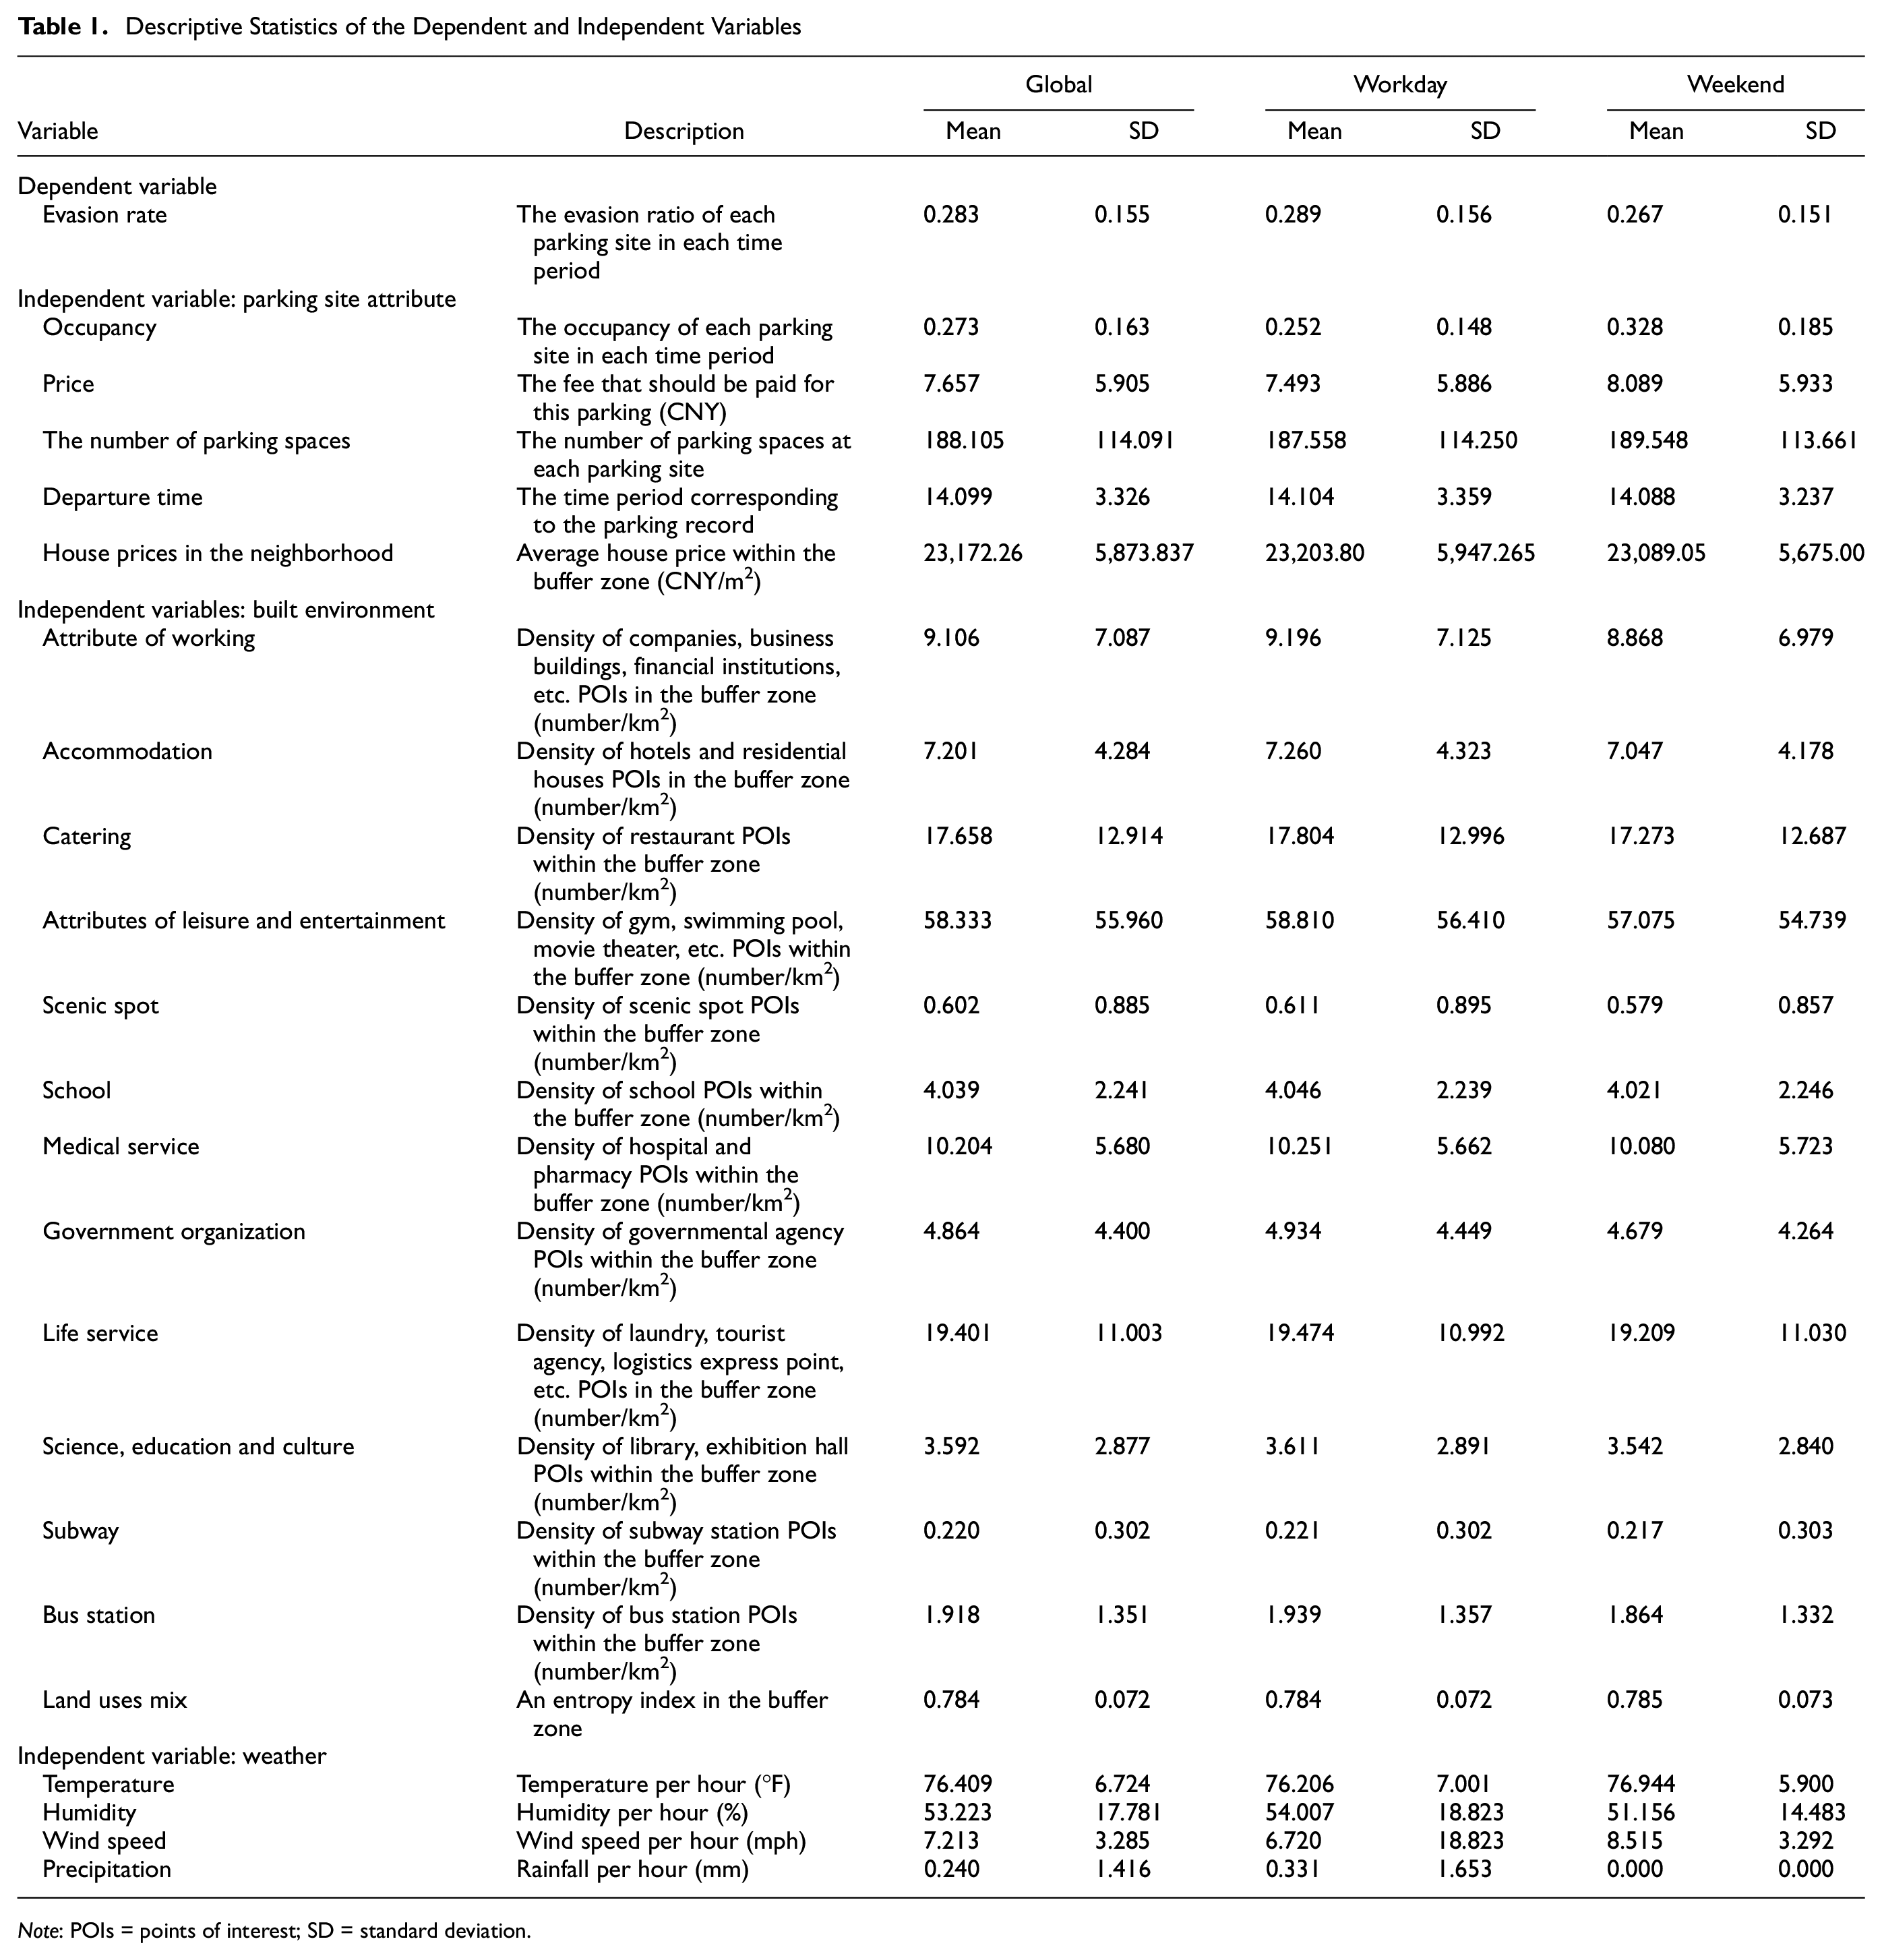
Note: POIs = points of interest; SD = standard deviation.
Methodology
Random forest is a method that integrates many decision trees into a forest and uses it to predict the final result ( 41 ). It is a typical bagging algorithm in ensemble learning, and its specific operation process is shown in Figure 3. This bagging algorithm can be combined with other classification and regression algorithms to improve accuracy and stability, and avoid the occurrence of over-fitting by reducing the variance of the results. Second, the randomness and non-parametric nature of random forest plays a key role in overcoming the spatial autocorrelation of independent variables to some extent ( 42 ). And the ensemble learning method of random forest can characterize the complex non-linear relationship between independent variables and dependent variables. Traditional regression methods usually assume that there is a linear relationship between independent variables and dependent variables. Such analysis results may cover up some important local information, resulting in deviations in conclusions. So we use the method based on random forest to reveal the non-linear relationship between curb parking fare evasion and the attributes of parking site, built environment and weather.
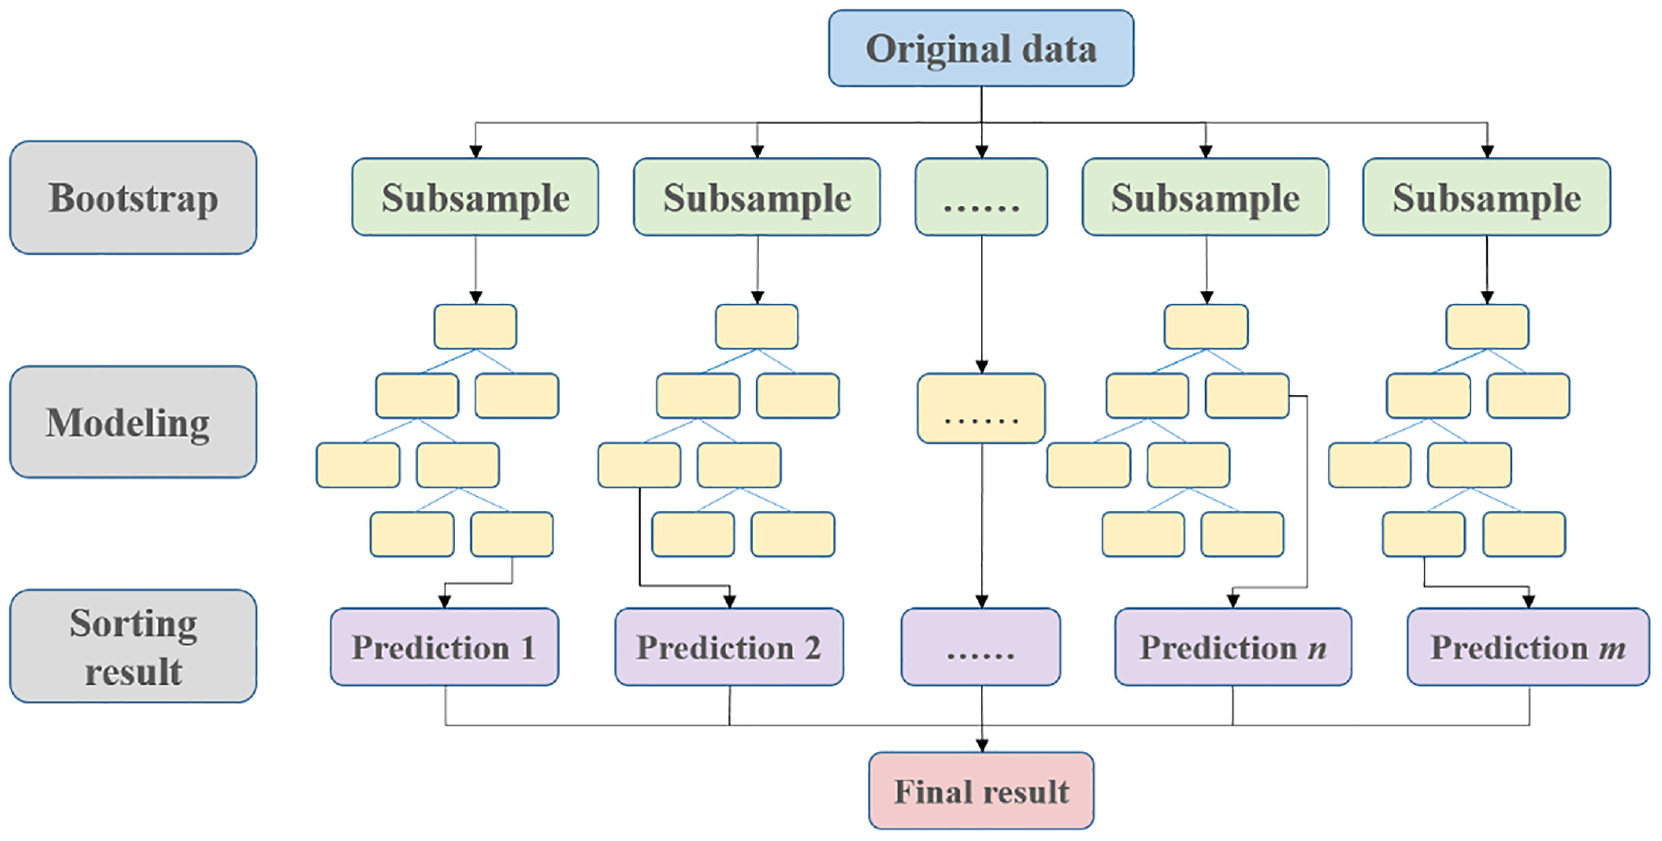
Illustration of the random forest method.
We did this by applying the random forest model in the Python environment. Before building the final model, we used the grid search method ( 43 ) combined with the 10-fold cross validation method to search for the optimal values of the five parameters: n_estimators, max_depth, min_samples_leaf, min_samples_split, max_features in the random forest model. Finally, the parameter value with the highest score in grid search was used as the final model parameter. Specifically, for workdays, n_estimators = 79, max_depth = 8, min_samples_leaf = 10, min_samples_split = 2, max_features = 13. For the weekend, n_estimators = 175, max_depth = 16, min_samples_leaf = 10, min_samples_split = 2, max_features = 10. The random forest models attained R-squared values of 0.581 for workdays and 0.626 for weekends, it demonstrating its strong predictive performance.
Model Interpretation with SHAP Method
SHAP is a solution to the interpretability of machine learning models (
44
). SHAP is based on Shapley value, and Shapley value is a game theory concept developed by economist Lloyd Shapley. This is a game where there are multiple individuals, and each individual wants to maximize their outcome. The Shapley value is used to calculate the contribution of each individual in the cooperation, so as to determine the importance of the individual. Subsequently, this method was introduced to the field of machine learning to quantify the contribution of each feature to the model’s output, known as the SHAP method. Simply put, the SHAP value of each feature represents the average marginal contribution it makes when participating in different combinations with other variables. The SHAP method represents the SHAP value as an additive feature attribution method, which interprets the predicted value of the model

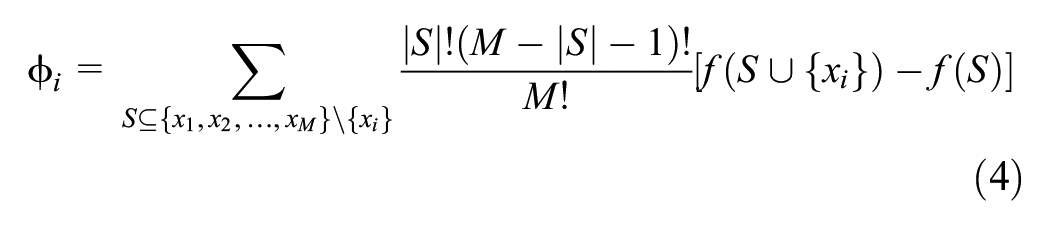
where f is the interpreter of the model, which refers to the random forest model. M is the number of input features;
In this study, we used the SHAP package in the Python environment to explain the random forest model. The SHAP package embeds an improved TreeExplainer method to effectively derive the SHAP value. On this basis, the output mode of the random forest model is demonstrated globally and locally. The model summarized the relative importance of the independent variables as a whole, and locally clustered the independent variables in the two scenarios of workdays and weekends, showing the non-linear relationship between the independent variables and the dependent variables.
Results
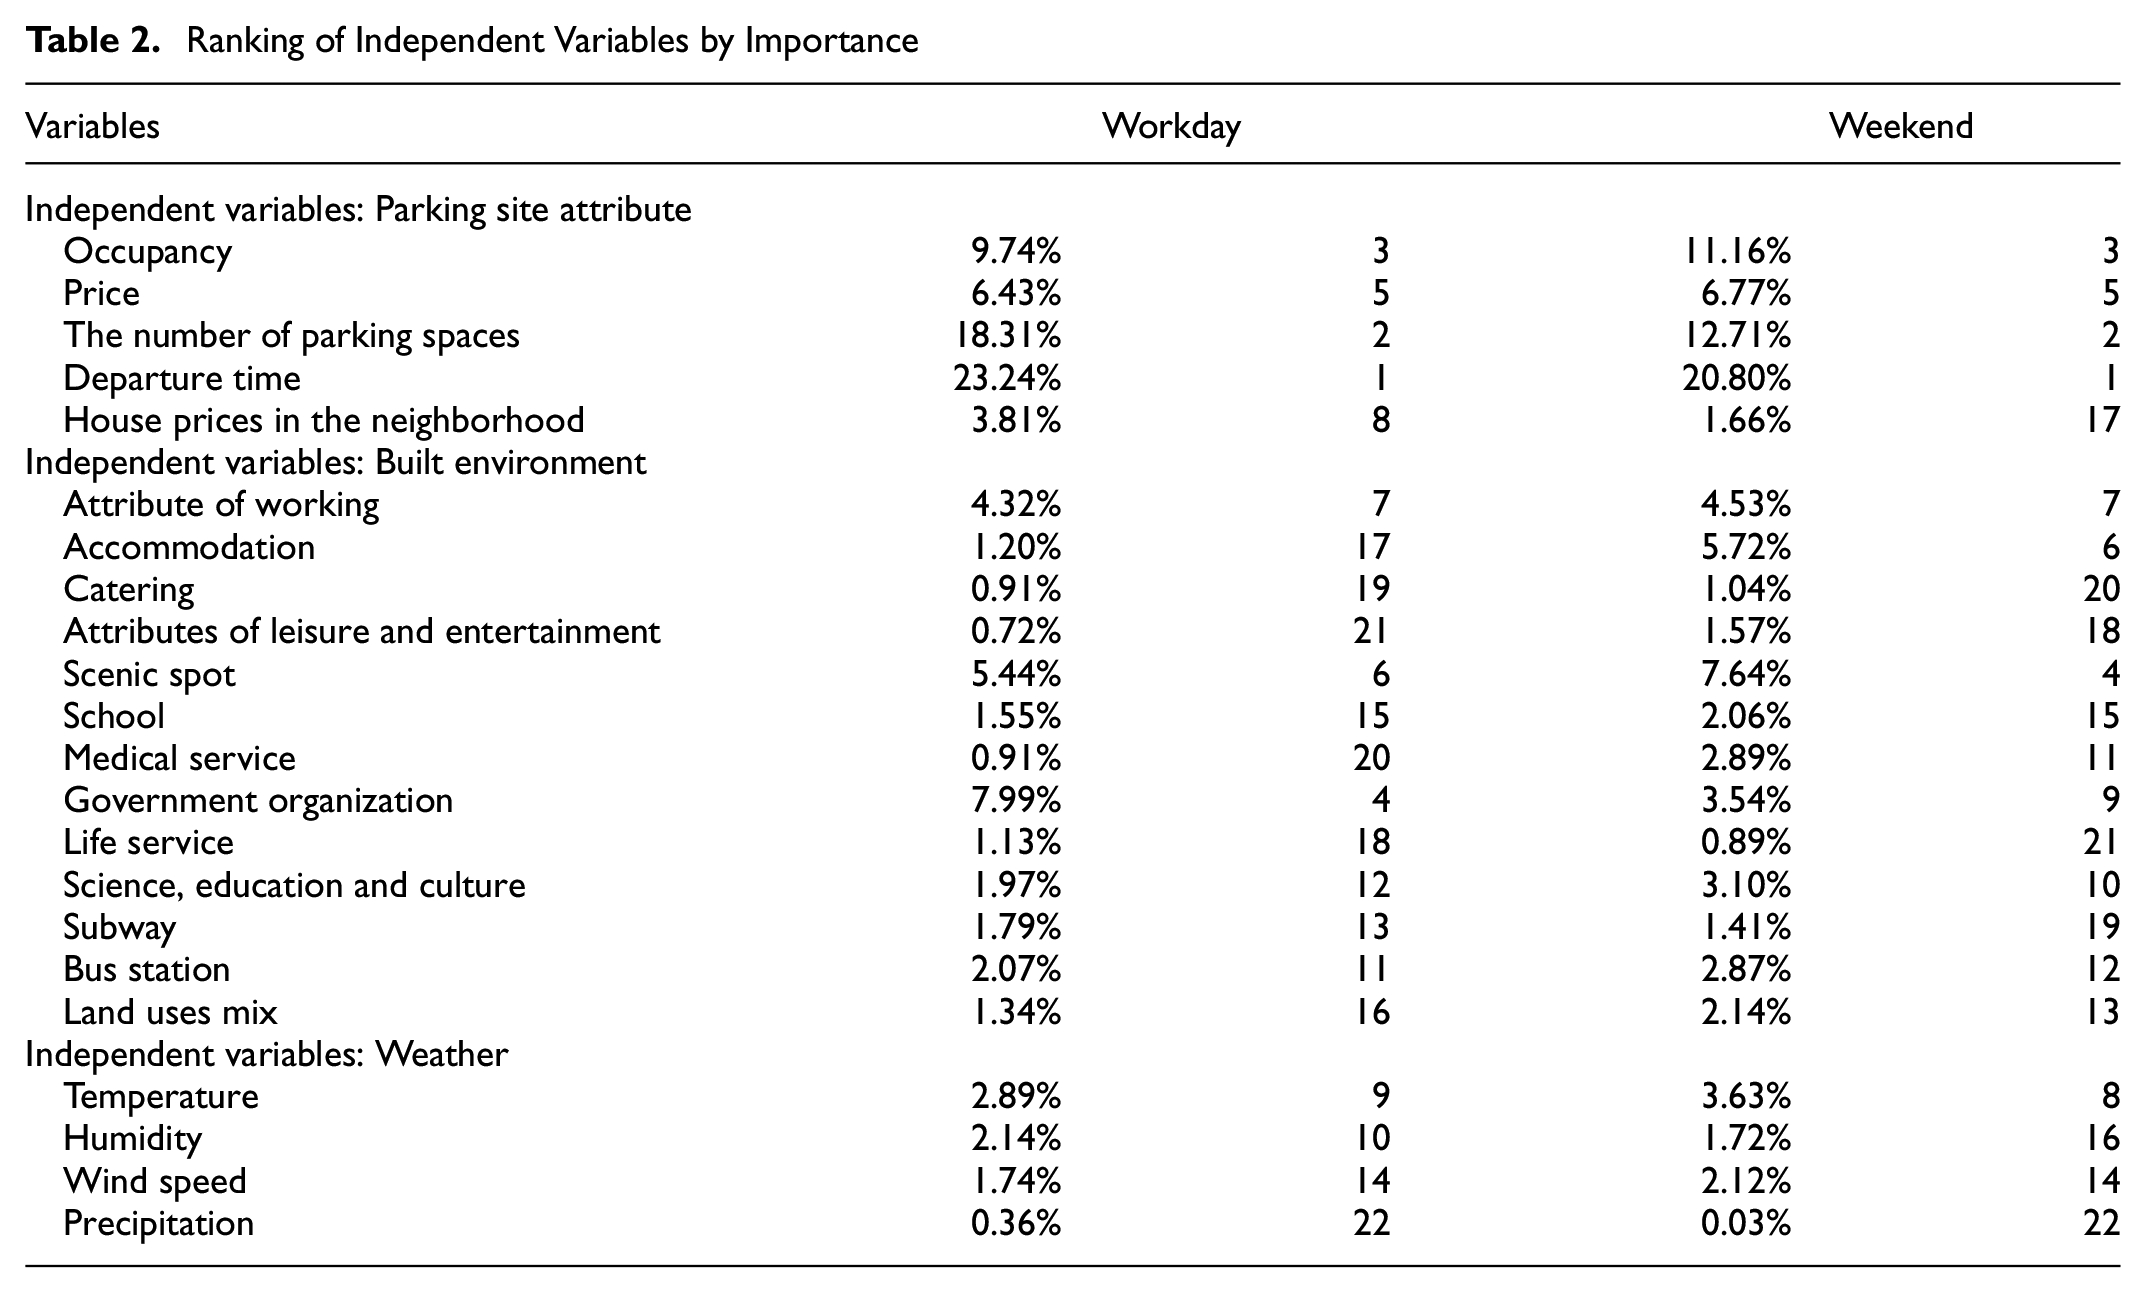
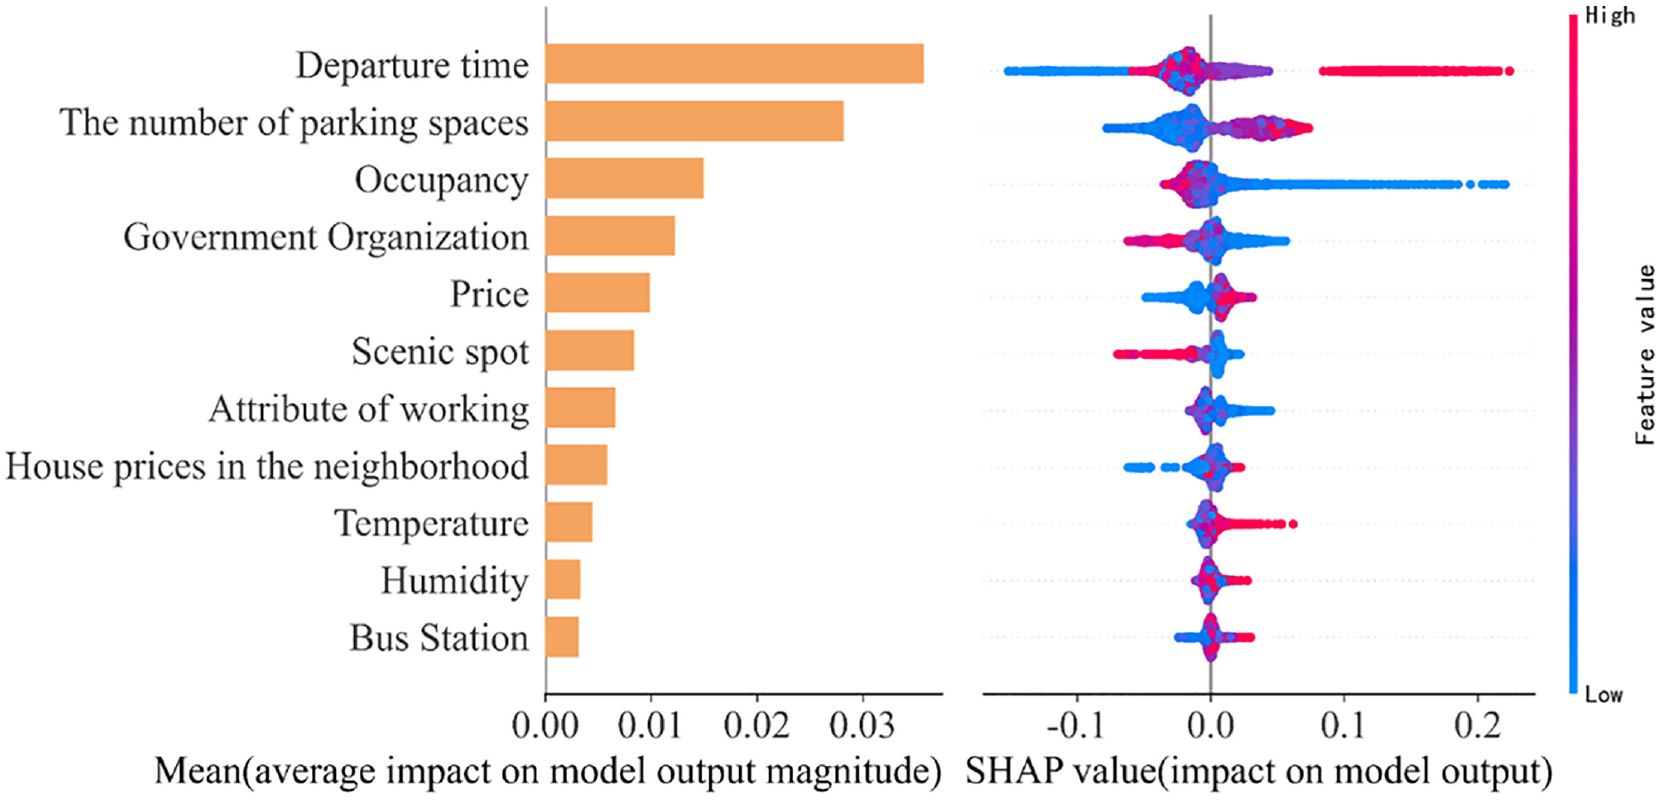
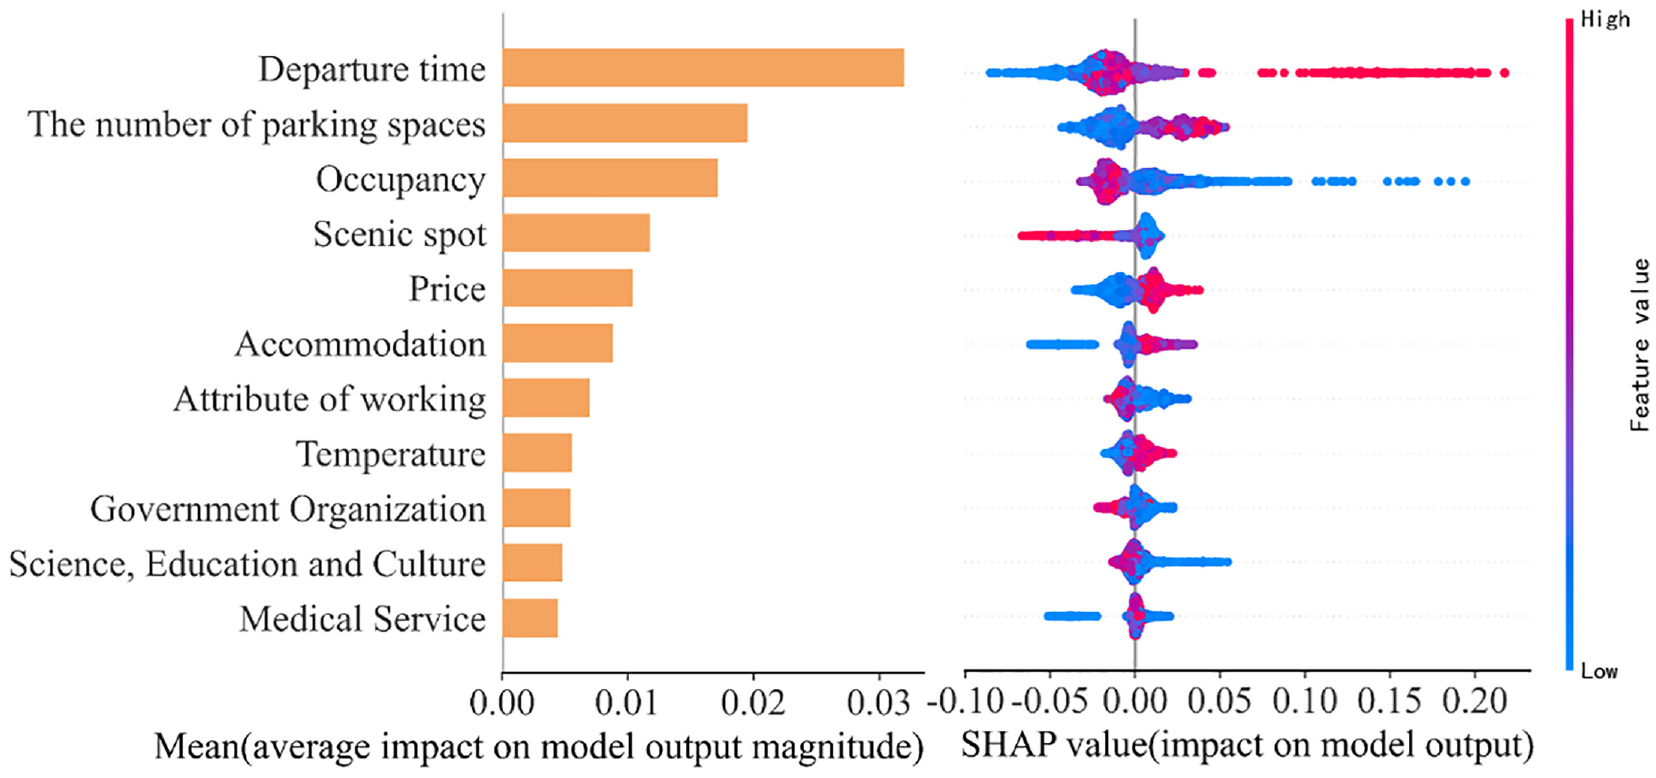
Importance of Independent Variables
Utilizing the random forest model, we leveraged Python’s SHAP package to elucidate the outcomes and assess the importance of individual independent variables, as exemplified in Table 2. Moreover, we computed the global importance through SHAP value calculations for each independent variable, as illustrated in Figures 4 (left) and 5 (left), showcasing each feature’s impact on the predictive outcomes. To visualize the SHAP values for each independent variable sample, we generated scatter plots, assigning distinct colors to represent the values of individual samples, as depicted in Figures 4 (right) and 5 (right).
Ranking of Independent Variables by Importance
Relative importance of independent variables and SHAP value (workday).
Relative importance of independent variables and SHAP value (weekend).
According to the findings presented in Table 2, it appears that departure time is the most important factor in curb parking fare evasion behavior, whether it is a workday or weekend trip. These variations in departure time correspond to changes in curb parking evasion rate of 3.4% and 3.5%, revealing a strikingly close relationship between curb parking evasion behavior and the departure time. This conclusion is not surprising, since it was confirmed that there is a significant relationship between bus fare evasion and the day ( 7 ), and the evasion rate is higher at night ( 25 ). In considering human life and its varied purposes during different time periods, it becomes evident that diverse travel motives and time pressures may contribute to tendencies to curb parking fare evasion. Among the independent variables under scrutiny, the number of parking spaces at the parking site and the occupancy levels during specific time intervals emerge as the second and third most influential factors on both weekends and workdays. It can be deduced that, apart from the surrounding built environment and weather condition factors, parking site attributes significantly affect curb parking fare evasion. Specifically, a 1.9% shift in curb parking evasion rates on weekends is attributed to an increased number of parking spaces, while during workdays, a rise in the number of parking spaces results in a 2.8% alteration in the evasion rate. Notably, the influence of parking space availability affects workdays to a greater extent than weekends. Additionally, occupancy levels prompt a change in evasion rate of 1.7% on weekends and 1.5% on workdays.
Scenic spots emerge as the most pivotal element of the built environment during weekends, exerting a 1.2% influence on evasion rates. Subsequently, accommodation and workplace attributes each contribute to 0.8% and 0.7% changes in the evasion rate, respectively. Notably, pricing constitutes the fifth largest independent variable for weekends, with a 1.1% shift. This underscores the enduring influence of parking fees on evasion behavior, alongside parking site attributes. Temperature fluctuations result in minimal changes in evasion behavior, with a mere 0.6% effect. Generally, the impact of weather conditions on curb parking fare evasion is not among the most prominent. In contrast, government organizations within the built environment assume paramount importance on workdays, contributing to a 1.2% alteration. This suggests that a portion of the primary group of curb parking evaders on workdays may comprise individuals conducting business at government agencies. Typically, such institutions reserve parking facilities for their internal staff, leaving ordinary individuals to seek street or off-street parking options on arrival for business. Many government agencies are centrally located, where parking constraints are prevalent. Consequently, individuals experiencing parking difficulties and extended walking distances to off-street parking locations may encounter reduced satisfaction, potentially prompting fare evasion. Scenic spots and workplace POIs rank second and third in the built environment, causing 0.8% and 0.7% changes, respectively. Notably, the influence of scenic spot POIs on evasion behavior on workdays is slightly less pronounced than during weekends, possibly attributable to the heightened influx of tourists to scenic spots on weekends, with comparatively lower tourist traffic during workdays.
Moreover, SHAP has the capability to offer local interpretability, which illustrates the connection between each sample and its predicted impact through color (Figures 4 and 5, right). In the SHAP value graph, each data point corresponds to a sample, and samples with identical feature importance and SHAP values are presented as vertical stacks. The horizontal axis of the graph represents the magnitude of the SHAP value, while color signifies the feature value. When the SHAP value surpasses zero, it signifies a positive or promoting influence on the curb parking evasion rate. Conversely, a negative SHAP value indicates an inhibitory effect on evasion. As depicted in Figures 4 and 5 (right), there is a notable inhibitory relationship between departure time and the curb parking evasion rate, with earlier departure times exhibiting stronger inhibition. Conversely, the extended red portion signifies that, as time progresses, it leads to an increased promotion of evasion. For occupancy, whether on weekends or weekdays, the prevalence of blue in the right part of the SHAP value diagram suggests that lower occupancy fosters evasion.
Non-linear Impacts of Independent Variables
Parking Site Attributes
In this section, we have selected the SHAP value results for the top four ranked variables within parking site attributes for analysis. These variables include departure time, occupancy rate, the number of parking spaces, and price. In Figure 6, the x-axis of the graph represents the values of the respective independent variable, while the y-axis denotes the magnitude of the SHAP values. Each individual data point is symbolized by a small circle, and when multiple data points share similar attributes and characteristics, they combine to create small vertical bars.
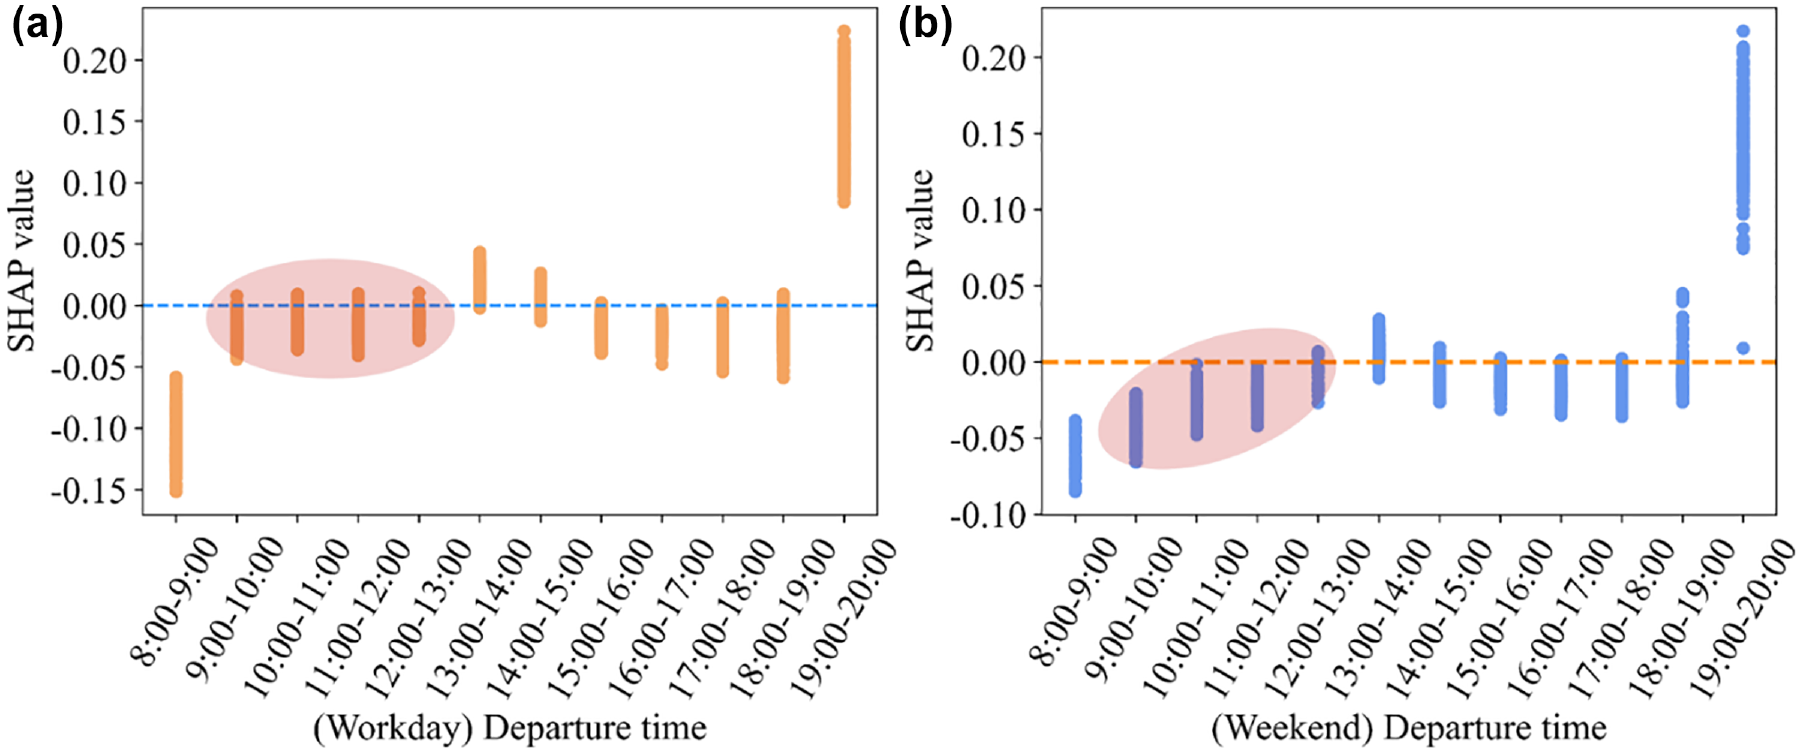
SHAP value plots of departure time and evasion rate: (a) workday, (b) weekend.
Figure 6 illustrates the non-linear relationship between departure time and parking fee evasion rate. It is imperative to recognize that this relationship significantly differs from the relationship between bus fare evasion rates and time periods ( 25 ). Notably, the local influence on the fee evasion rate appears to be at its lowest for departures between 08:00 and 09:00 in the morning, and the nadir on workdays is lower than that on weekends. However, weekends exhibit a more pronounced impact, with local fluctuations being more prominent on weekends than on workdays. During weekends, we observe a gradual weakening of inhibition from around 08:00 to 13:00. Furthermore, there is a positive impact observed between 13:00 and 14:00, followed by a gradual decline and the restoration of an inhibitory effect from 14:00 to 18:00. Subsequently, the evasion rate experiences a sharp increase after 18:00, creating a positive impact, reaching its peak between 19:00 and 20:00. This phenomenon can be attributed to the emergence of peak travel periods at 13:00 to 14:00 and 18:00 to 19:00. Between 13:00 and 14:00 in Nanjing, which is typically the lunch hour, with clear characteristics of dining habits, there is a significant likelihood that fare evasion incidents occur. During this time, inspection personnel may tend to relax their vigilance, either because of their own need for a lunch break or a momentary relaxation. Alternatively, drivers might perceive that inspection personnel are not on duty during this period, leading to increased fare evasion. The evening peak period, between 19:00 and 20:00, coincides with Nanjing’s peak hour for evening travel. There are several factors contributing to the potential rise in fare evasion during this time. On one hand, there may be a higher volume of departing vehicles during this time, possibly because of later arrival times of fee collectors and tight schedules for drivers, resulting in an increase in fare evasion incidents. On the other hand, 20:00 marks the end of the working hours for fee collectors in our study area (where curb parking fees are collected from 08:00 to 20:00). As quitting time approaches, fee collectors may become less vigilant, while drivers may mistakenly assume that the fee collectors have finished their day’s work, leading to instances of fare evasion.
Figure 7 illustrates the non-linear relationship between the number of parking spaces, occupancy, and curb parking evasion rates. Each data point in the figure represents a sample, with the x- and y-axes denoting occupancy and the corresponding SHAP value, respectively. The color of each data point signifies the quantity of parking spaces associated with it, with proximity to red indicating a greater number of parking spaces and proximity to blue indicating fewer parking spaces. The figure also portrays the interplay between the number of parking spaces and the occupancy rate concerning evasion rates.
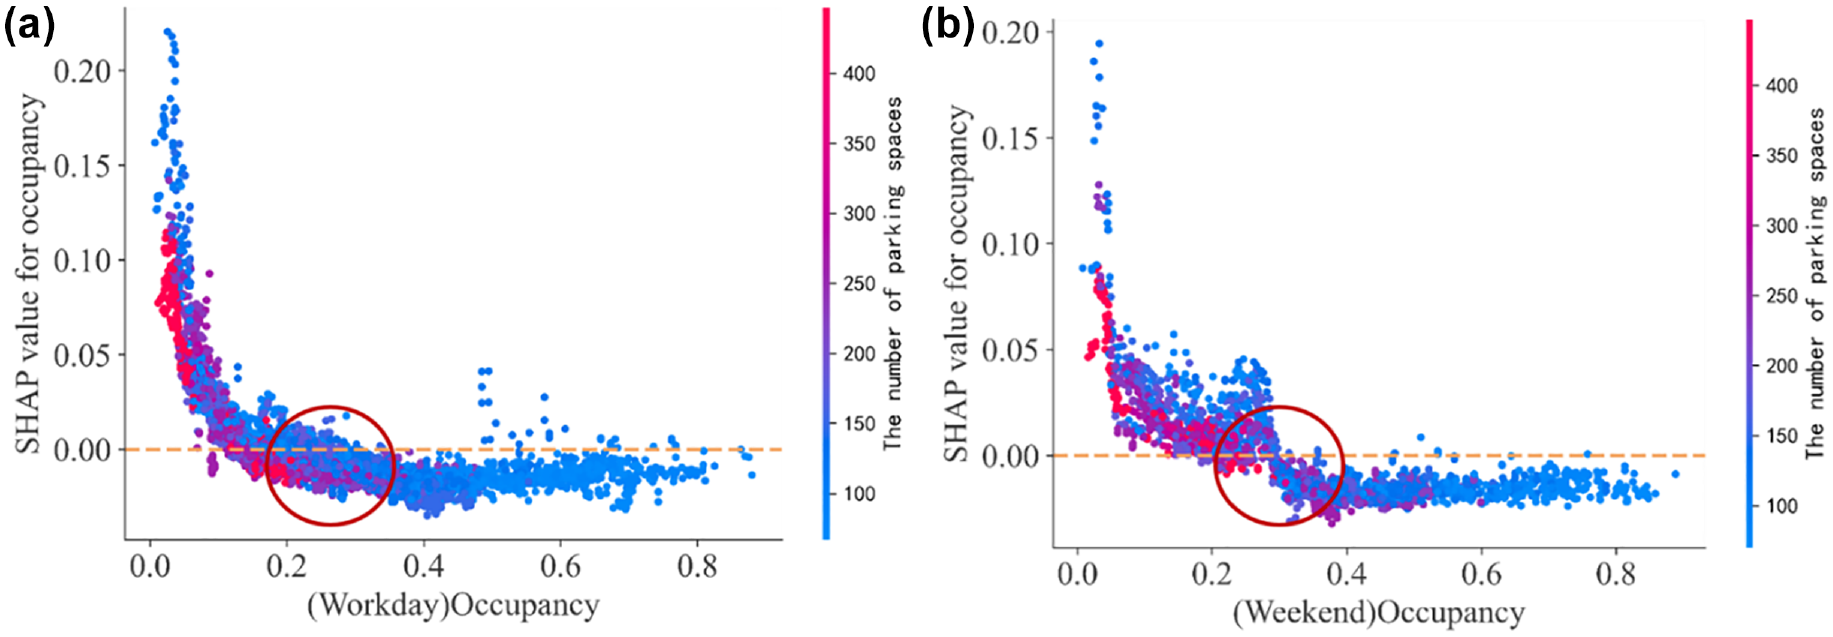
SHAP value plots of number of parking spaces and occupancy and evasion rate: (a) workday, (b) weekend.
As observed in Figure 7, notable inhibition of curb parking evasion occurs when the number of parking spaces at a site is less than 200, with most of these instances exhibiting a positive impact on evasion when the number of parking spaces exceeds 200. Concerning the independent variable of occupancy, it is noteworthy that an occupancy rate exceeding approximately 0.3 results in a more stable inhibitory effect on evasion. When the occupancy rate falls below 0.1 during workdays, a more pronounced positive impact on evasion rates becomes evident. On weekends, the positive impact is more noticeable when the occupancy rate is less than 0.3. The relationship between occupancy and parking spaces reveals an interesting contrast to previous findings concerning bus occupancy and fare evasion. Previous studies have indicated that, for every 1% increase in passenger occupancy on a bus, the evasion rate would rise by 0.8% ( 7 ). However, the results of this study suggest that an increase in curb parking spaces may influence traffic flow, decrease driving vehicle speeds, and lead to increased evasion rates. Blindly increasing parking spaces could result in elevated management costs and a corresponding rise in evasion rates.
For the independent variables, it is evident that the price of parking fees is not the most crucial factor influencing curb parking evasion behavior. Figure 8 illustrates that, during workdays, there is a typical promotion of evasion when the parking fee surpasses approximately 5 CNY. On weekends, a stable promoting effect on the evasion rate is observed when the parking fee exceeds 7.5 CNY. Evasion rates increase during weekends when the parking fee falls within the range of 5 to 7.5 CNY.
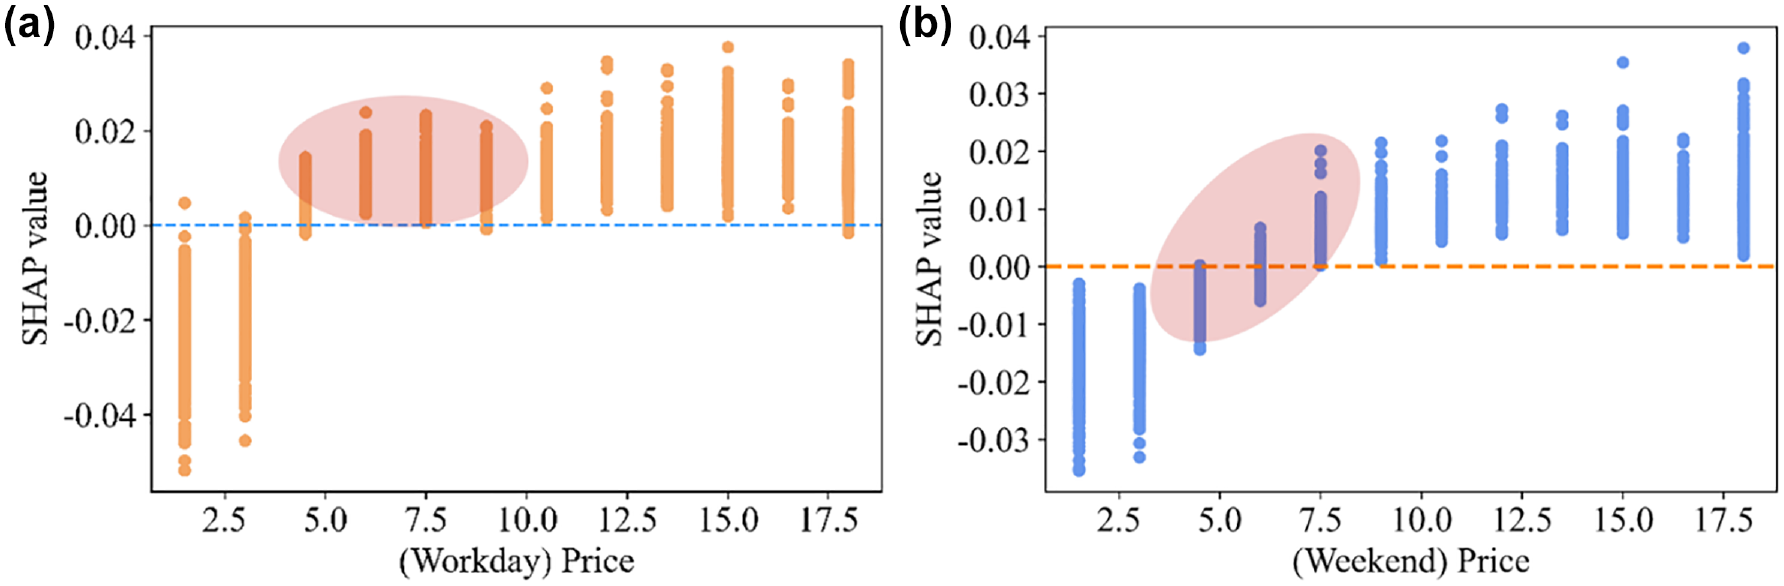
SHAP value plots of price of parking and evasion rate: (a) workday, (b) weekend.
Built Environment
Similarly, for built environment variables, we have showcased the top three variables separately for workdays and weekends. The top three built environment variables for workdays are government organizations, scenic spots, and workplaces, while the top three variables for weekends are scenic spots, accommodation, and workplaces.
Figure 9 illustrates the impact of scenic spots on curb parking evasion rates in two distinct scenarios: workdays and weekends. In the built environment, scenic spots emerge as prominent independent variables, both during the workdays and weekends. Notably, when the density of scenic spots within the buffer zone exceeds a certain number per square kilometer (number/km2), it exhibits an inhibitory effect on parking evasion behavior, whereas when the density falls below this threshold, it exerts a positive influence. This phenomenon can be attributed to the increased standardization of curb parking practices in areas with higher density of scenic spots, leading to a reduction in evasion incidents. Additionally, a majority of the sampled scenic spots exhibit a suppressive impact on the evasion rate, possibly because leisure drivers, who frequent these spots, tend to have more leisure time and generally find themselves in a better mood.
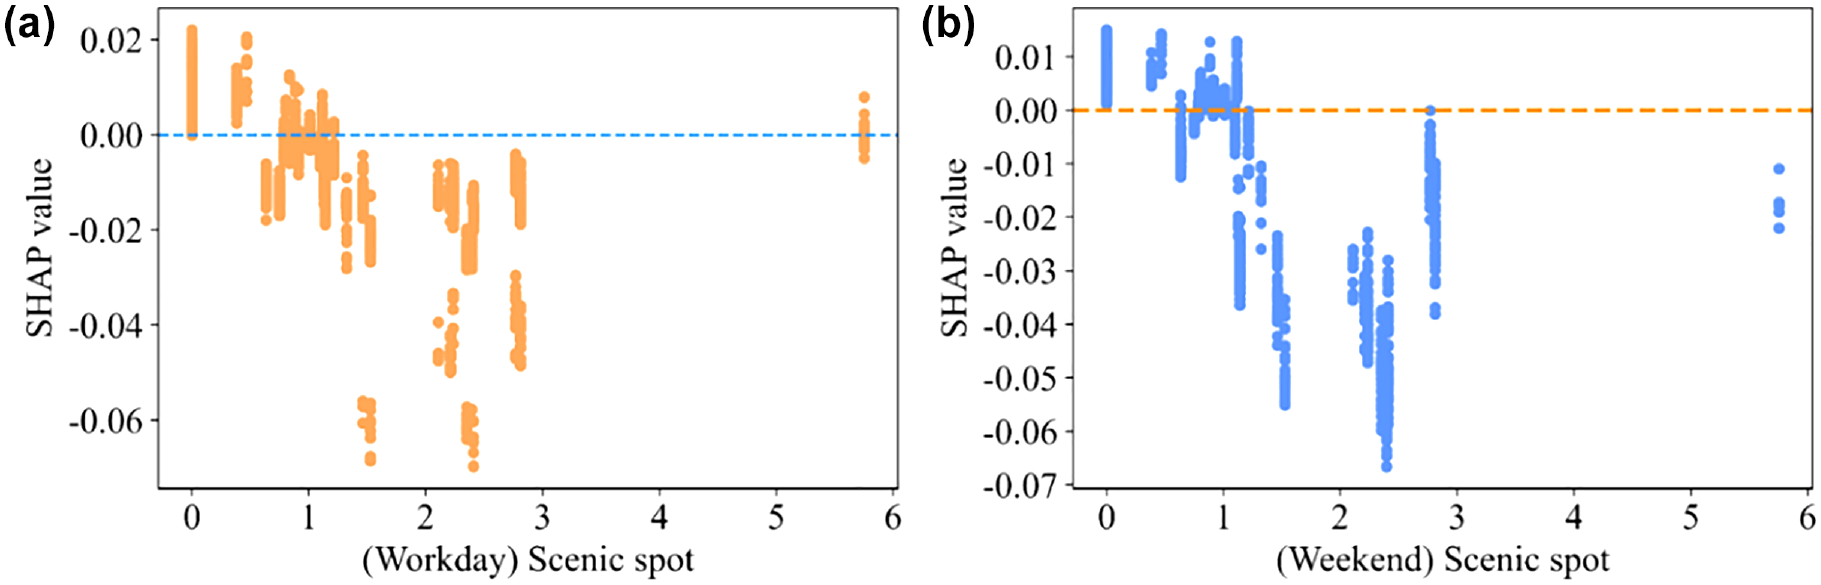
SHAP value plots of scenic spots and evasion rate: (a) workday, (b) weekend.
Figure 10 illustrates the influence of working POIs on curb parking evasion behavior. The proximity of parking to working POIs generally serves two primary purposes. In the first scenario, the parking facilities provided by the respective companies may prove insufficient, necessitating long-term curb parking. The second purpose entails official business activities, leading to short-term parking attributed to communication-related tasks within certain companies. As depicted in Figure 10, on workdays, a gradual transition from positive to negative impact on evasion rates occurs as the density of working POIs increases from zero to 15 POIs/km2. The shift to a negative impact materializes at a density of 13 POIs/km2. These findings underscore the heightened prevalence of evasion behavior around working POIs on workdays. The expansion of POIs to encompass a larger industrial area mitigates this positive impact, enhancing parking management. On weekends, the impact of working POIs is notably reduced. When the density of working POIs surpasses 5 POIs/km2, a negative impact emerges. To curtail evasion, it is advisable to bolster parking management near working POIs during workdays.
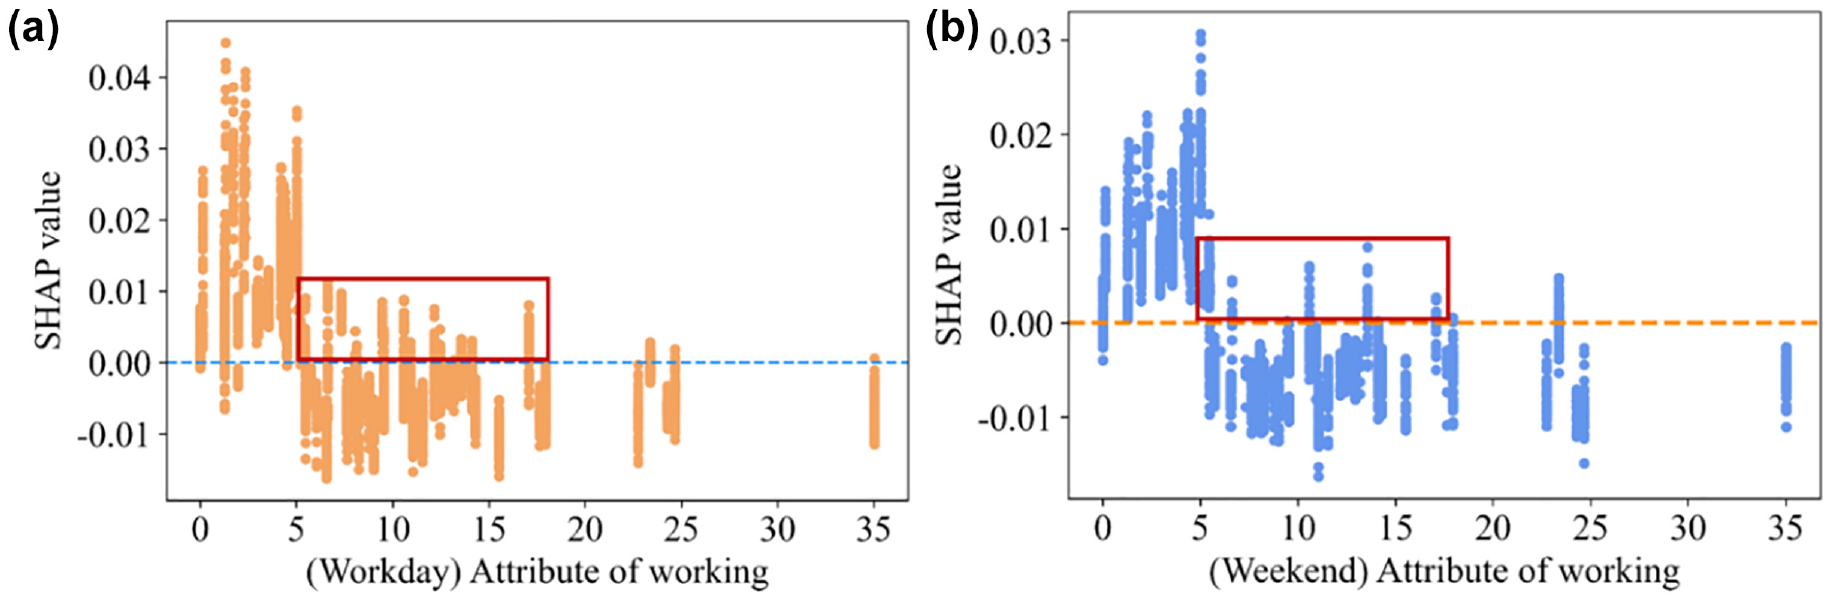
SHAP value plots of working points of interest (POIs) and evasion rate: (a) workday, (b) weekend.
Figure 11 reveals that parking evasion during the workday is influenced by the presence of government organizations. Notably, when the density of government organizations is less than 5/km2, a consistently positive impact is observed. The majority of samples exhibit this positive influence on evasion behavior. This pattern may be attributed to the substantial influx of individuals visiting government organizations for business on workdays. However, it is worth noting that many government organizations restrict access to their off-street parking facilities exclusively to internal employees. Given that government organizations are often located in densely populated areas, parking can be challenging. Individuals who rely on private vehicles for business purposes may encounter frustration because of parking restrictions and the urgency of their tasks, leading to feelings of anxiety, dissatisfaction, and, consequently, evasion ( 39 ). Similar findings relating satisfaction and evasion have been documented in other studies ( 8 ). Notably, evasion during weekends is not significantly influenced by the presence of government organizations. This is partially because most government organizations do not operate on weekends, resulting in reduced parking demand and, consequently, a decrease in evasion. In contrast, accommodation POIs wield a substantial influence on the weekend. As depicted in Figure 11, most accommodation POIs have a positive impact on evasion behavior, indicating a higher prevalence of evasion in proximity to residential areas. Enhancing parking management near accommodation POIs on weekends could prove instrumental in reducing such incidents.
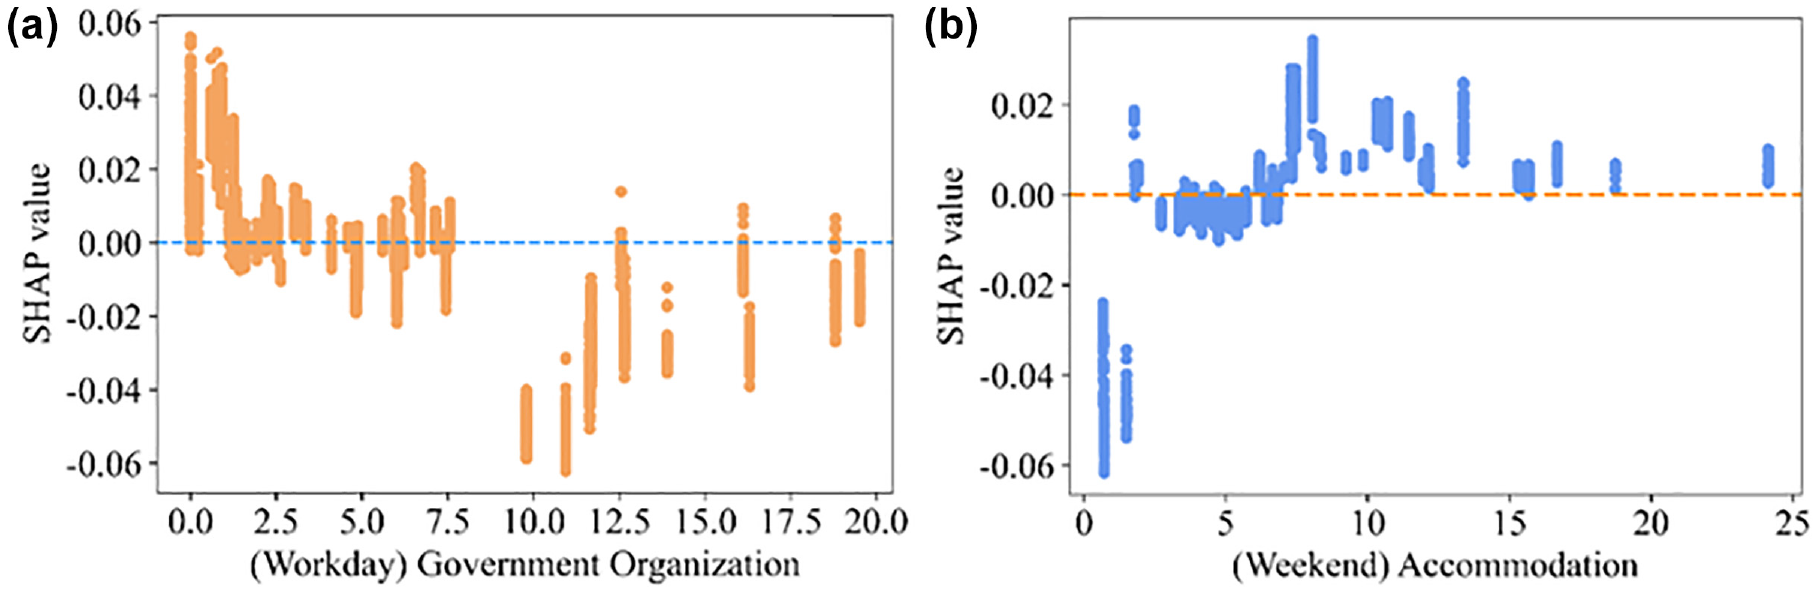
SHAP value plots of presence of government organizations and accommodation and evasion rate: (a) (workday) government organizations, (b) (weekend) accommodation.
Discussion and Conclusion
Based on the data from Nanjing, we utilized the random forest methodology to investigate the influence of parking site attributes, the built environment, and weather conditions on the occurrence of evasions in curb parking behavior. Random forest models were separately established for workdays and weekends. To provide local explanations, we employed the SHAP method. Notably, this marks the pioneering application of machine learning techniques to the analysis of parking evasion behavior. The significance of this discovery extends to various related domains, with particular importance for the management of curb parking.
The analysis revealed that the seven most significant factors contributing to curb parking evasion behavior differed between workdays and weekends. Our established models elucidate the distinct impacts of parking site attributes, the built environment, and weather conditions on parking evasion in varying scenarios. Of the seven factors deemed most important for both workdays and weekends, four pertain to parking site attributes, while three relate to the built environment. Notably, the top three factors within parking site attributes are: departure time, the number of parking spaces, and parking occupancy. It is worth highlighting, however, that the three most critical built environment variables differ. Specifically, during workdays, government organizations, scenic spots, and workplace attributes emerge as the three most significant variables. For weekends, scenic spots, accommodations, and workplace attributes follow as the leading factors. These findings represent innovative contributions to the research field, particularly underscoring the preeminent role of a driver’s departure time in fare evasion. This suggests a close correlation between individual behavior and departure time, indicating that drivers’ evasion decisions may be influenced by travel purposes and time constraints. Furthermore, the number of parking spaces and occupancy levels significantly affect both workdays and weekends, while surprisingly, price does not emerge as a dominant factor in evasion behavior. It can be inferred that fee evasion is often not driven by the fee amount itself but rather by the sense of helplessness stemming from environmental factors. Notably, with regard to the built environment, scenic spots are pivotal on weekends, followed by accommodation. We recommend that parking management departments allocate more attention to scenic and residential areas during weekends. In contrast, government organizations take precedence during workdays, followed by scenic spots and workplace attributes. Consequently, parking management planning should emphasize areas near government organizations and workplaces on workdays. Institutions frequently limit parking lot access to internal staff, resulting in on-street or off-street parking for visitors. It may be necessary to develop some parking spaces for tourists to alleviate the evasion issue. These findings offer valuable insights for decision makers seeking to implement prioritized interventions. Weather conditions was not found to be a significant factor in driver evasion behavior.
The SHAP diagram illuminates the threshold effect of parking site attributes, the built environment, and weather conditions on curb parking evasion behavior. As such, the application of SHAP proves valuable in enhancing decision making for the refinement of curb parking planning and management. This approach aids in reducing parking evasion incidents, enhancing parking management revenue, and promoting sustainable urban development. Furthermore, the results of our models reveal distinct impacts of each independent variable on evasion behavior during workdays and weekends. Notably, specific time intervals stand out as having a pronounced positive influence on evasion, including 13:00 to 15:00 on workdays, 13:00 to 14:00 and 18:00 to 19:00 on weekends, and 19:00 to 20:00 in both scenarios. This underscores the importance of the curb parking management department’s attention to parking management during these critical periods. Additionally, the layout of fare collectors should be enhanced or strengthened during these peak travel times to mitigate evasion and reduce potential revenue losses. The interactive relationship between number of parking spaces and occupancy reveals that locations with more parking spaces tend to exhibit lower occupancy rates, while a scarcity of parking spaces leads to higher occupancy. Higher occupancy levels tend to exert a stable inhibitory effect on the evasion rate, particularly when occupancy surpasses approximately 0.3. This finding suggests the need for decision makers responsible for curb parking to refine parking space planning, recognizing that simply increasing parking spaces may affect traffic flow, vehicle speeds, and evasion rates. Blindly expanding parking capacity can escalate management costs and potentially affect the charging structure. Lastly, the sensitivity of parking fees to evasion differs between workdays and weekends. A fee exceeding approximately 5 CNY results in a normal promotion effect on evasion rates during workdays, while a weekend fee of around 7.5 CNY yields a consistent positive impact. Urban planners should consider industrial parks in urban planning, taking into account the non-linear relationship between working POIs and evasion behavior. When the density of working POIs surpasses 5/km2, it has a stable negative impact on evasion behavior. Parking management strategies should be concentrated around government organizations, recognizing that individuals on business trips may feel compelled to evade fees because of parking issues and work urgency.
For future research, there remain several unresolved issues in our study that require attention. First and foremost, our investigation is confined to the Pukou District and Liuhe District of Nanjing. Subsequent research should endeavor to ascertain whether analogous characteristics manifest in other urban parking locations. Additionally, our study focuses on objective factors, and it would also be a meaningful direction to explore the subjective level from the perspective of people in the future. For instance, there are various factors to consider, such as interpersonal contagion effects. Previous research has confirmed the influence of sociodemographic characteristics on evasion behavior, therefore, we believe that, in future studies, investigating the distinct characteristics of evasion behavior among two distinct groups—local and non-local vehicles—could be an intriguing topic.
Footnotes
Author Contributions
The authors confirm contribution to the paper as follows: study conception and design: X. Zhou, J. Yan, X. Ding; data collection: Y. Ji; analysis and interpretation of results: X. Zhou, J. Yan, X. Ding; draft manuscript preparation: X. Zhou, J. Yan, Y. Ji. All authors reviewed the results and approved the final version of the manuscript.
Declaration of Conflicting Interests
The author(s) declared no potential conflicts of interest with respect to the research, authorship, and/or publication of this article.
Funding
The author(s) disclosed receipt of the following financial support for the research, authorship, and/or publication of this article: This research was funded by the National Key R&D Program of China (2018YFB1600900 and 2018YFE0120100) and China Scholarship Council (202306090195).
Data Accessibility Statement
Because of the nature of this research, the data provider requested that the data be kept confidential, so supporting data is not available.