
Abstract
State-funded local bridge projects face several challenges including but not limited to constrained budgets, increasing burden from state departments of transportation (DOT) staff, and the lack of expertise of some local personnel. By streamlining the delivery and oversight of state-funded projects through delegation, a collaborative and proactive approach can be achieved, ensuring the successful maintenance and development of local low-risk bridges, which are not on the National Highway System and have minimal to no environmental, right of way, utility, or railroad impacts. This paper offers a practical approach to evaluating programs focused on progressing project delivery by delegating specific tasks and responsibilities to local governments. Taken as a study case, Wisconsin Department of Transportation’s low-risk bridge pilot program was evaluated using both a quantitative methodology: data analysis using a data-driven statistical approach involving analysis of pilot and control group data, and an evaluation of the performance metrics developed by the state DOT; and a qualitative approach: a survey of local sponsors and stakeholders about the pilot project. The survey corroborated the findings derived from the data analysis: improved performance in project cost and schedule for pilot projects, highlighting consistency and reliability in the evaluation process. The integration of both methodologies resulted in valuable insights and experiences, providing valuable guidance to other states conducting similar program evaluations.
Keywords
In the United States, about 7% of bridges were in poor condition or structurally deficient in 2021, highlighting the urgency of infrastructure maintenance ( 1 ). Among these bridges are local low-risk structures, which refer to those are not on the National Highway System and are assessed as having minimal risk in relation to environmental, right of way, utility, or railroad impacts. However, they are equally important as they directly affect public safety, economic growth, and community connectivity ( 2 ). However, state-funded local bridge projects face several challenges ( 3 ). Budget constraints and procedural hurdles can result in postponed maintenance, which may hasten the wear and tear of bridges and eventually escalate the expenses for repairs. Moreover, the shortage of state departments of transportation (DOT) staff and the absence of specialized knowledge among local individuals present additional obstacles.
To address these challenges and promote efficient project delivery, delegating certain tasks and responsibilities to local governments could be beneficial. Local authorities have invaluable knowledge about their communities’ needs and priorities, enabling them to adjust projects as needed and engage stakeholders effectively. Empowering local governments could, at first glance, appear to streamline decision making, bolster accountability, and increase cost-effectiveness, which may result in better-planned projects and improved outcomes. However, these potential benefits require further evaluation. Several state DOTs have practices on delegating responsibilities to the local agencies, including but not limited to local bridge projects ( 4 – 6 ). In Iowa, the DOT adopts a supportive role as an adviser and monitor for federal-aid transportation projects carried out by local public agencies (LPAs) ( 4 ). Iowa DOT has adopted innovative contracting methods such as combined projects for LPAs ( 4 ), for example, LPAs would be responsible for the administration and inspection of the construction contract ( 4 ). Michigan DOT allows local agencies to perform construction engineering services for their local projects while offering oversight support to maintain program compliance ( 5 ). Illinois DOT has similar programs involving innovative project delivery and bridge bundling feasibility analysis ( 6 ).
To streamline the delivery and oversight of low-risk local bridge projects, a pilot program was initiated in 2019 by the Wisconsin Department of Transportation (WisDOT) in consultation with the Wisconsin County Highway Association (WCHA) ( 7 ). The state DOT aimed to achieve improvements in its local bridge program, with a focus on cost, schedule, and quality. The pilot projects attempted to achieve improvements by delegating certain project tasks and responsibilities to the local governments while maintaining overall management and oversight by the state. This pilot program focused on low-risk local bridge projects that would be expected to have little or no real estate-, utility-, railroad-, or environmental issues.
The goal of this study was to evaluate the low-risk bridge pilot program and make recommendations to WisDOT before implementation at a program level ( 8 ). This goal was achieved by a quantitative approach: collecting and analyzing data from pilot- and control projects; and a qualitative approach: conducting a survey of local sponsors and stakeholders on their impressions of the pilot projects. This paper summarizes the project evaluation practice and provides recommendations that could be applied to similar projects in other states.
Data Collection and Preparation
In this study, available data on 66 bridge projects were collected, including 16 bridge projects from the pilot program (pilot group), and 50 bridge projects from the control group. Control projects were determined based on similarity to the pilot projects. A map showing the distribution of pilot and control bridge projects is given in Figure 1.

Map of pilot and control projects.
After the identification of pilot and control projects, bridge information and data on the pilot program performance measures were colllected for these projects.
Bridge Information
This study utilized four categories of contributing information: 1) bridge characteristic information, 2) site, utilities, and environmental information, 3) highway design and construction information, and 4) traffic control and detours. Table 1 presents details of the contributing data that were collected and assigned to each of the four categories. The bridge data were collected from the Highway Structures Information System database, project proposal files, and design plans for both the pilot and control projects.
Bridge Contributing Information
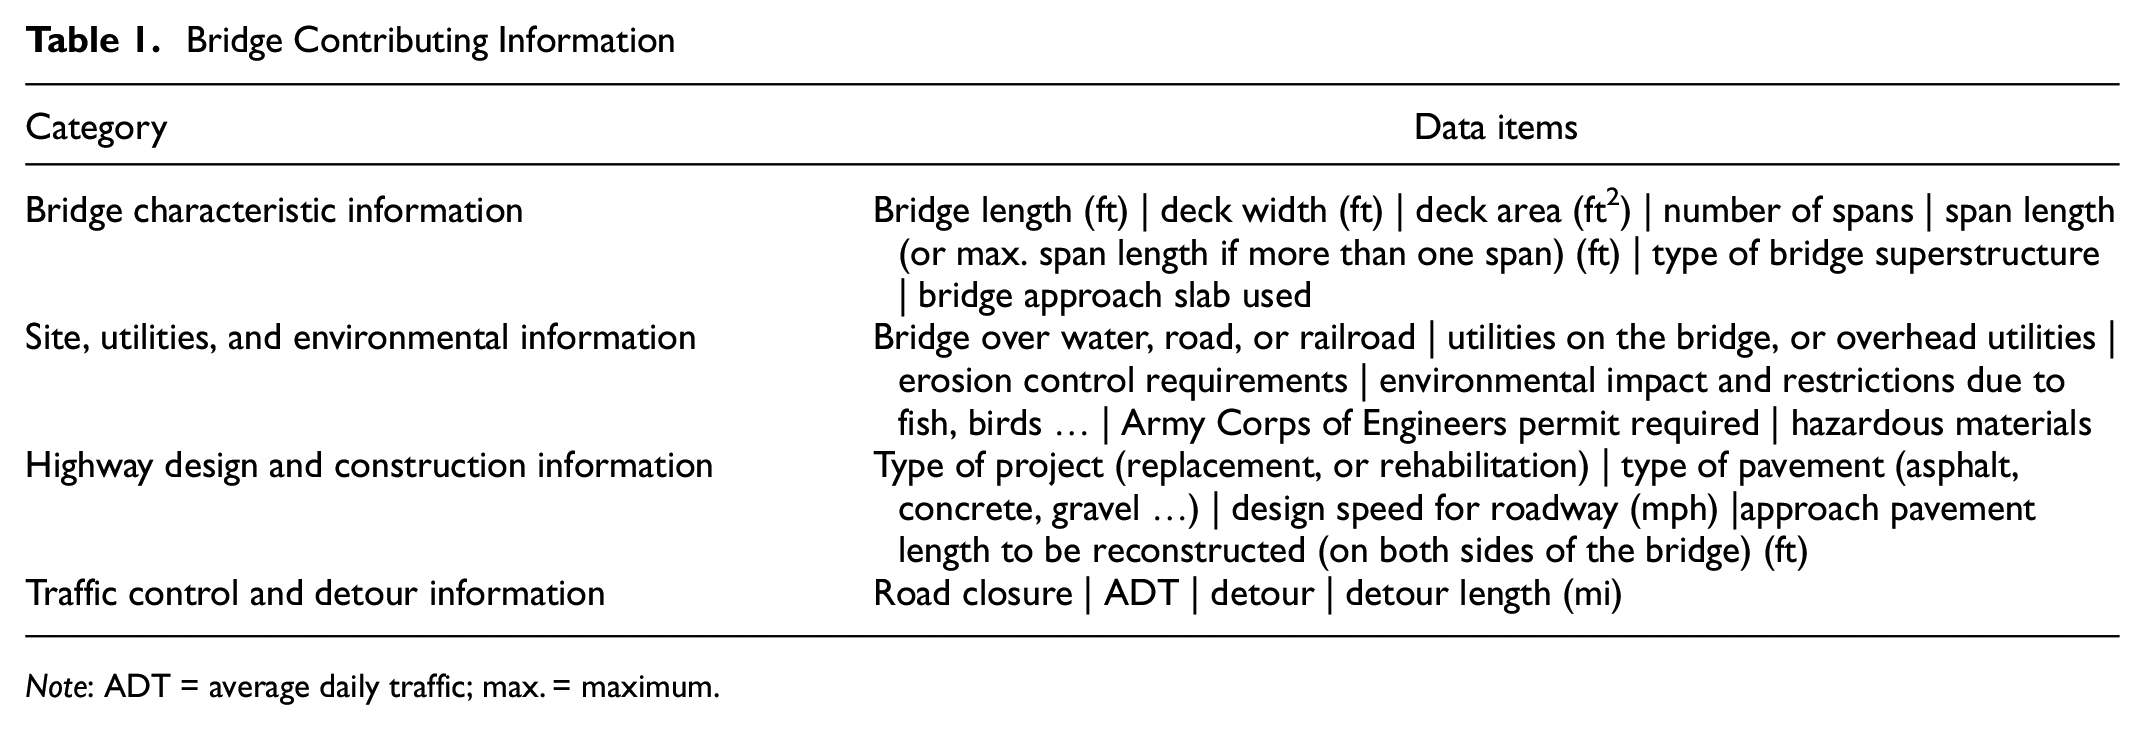
Note: ADT = average daily traffic; max. = maximum.
WisDOT Pilot Program Performance Measures
The performance metrics proposed by the state DOT were either adopted or enhanced. The three categories of performance metrics were 1) budget: project cost and project delivery, 2) schedule: design schedule, delivery schedule, and construction finals, and 3) quality: environmental document reviews, construction contract modifications, and communication of construction contract modifications.
Budget: In “project cost,” the cost per square foot is calculated by using the low bid price for the project and the bridge deck area. In “project delivery,” the total design delivery cost and the total construction delivery cost are calculated by adding the related consultant delivery cost, WisDOT oversight cost, and local government delivery cost for design and construction, respectively.
Schedule: In “design schedule,” the number of days from scheduled plans, specifications, and estimates (PS&E) at project initiation to the actual PS&E delivery is recorded. In “delivery schedule,” the “design delivery time” is counted from the design notice to proceed date to the date that the contract was let. In “construction finals,” the time between the substantial completion date and the date that all records and agreed quantities were submitted to WisDOT for review is compared against a 180-day threshold.
Quality: The “environmental document reviews” track the number of environmental document reviews by WisDOT. “Construction contract modifications” reports the dollar value of construction contract modifications as a percentage of the construction bid cost. “Construction contract modifications–communications” assesses whether the number of construction contract modifications known to the LPA equals the actual number of construction contract modifications. As can be seen, “quality” is a general term that is used to track the complexity of the project and the subsequent communication between state and local agencies.
WisDOT staff from the Bureau of Project Development helped the research team to collect all these performance measure data related to budget, schedule, and quality. To normalize delivery cost by deck area, two new performance metrics were added within the project delivery category: total design delivery cost per square foot and total construction delivery cost per square foot. Table 2 provides details of the performance measures.
WisDOT Performance Measures
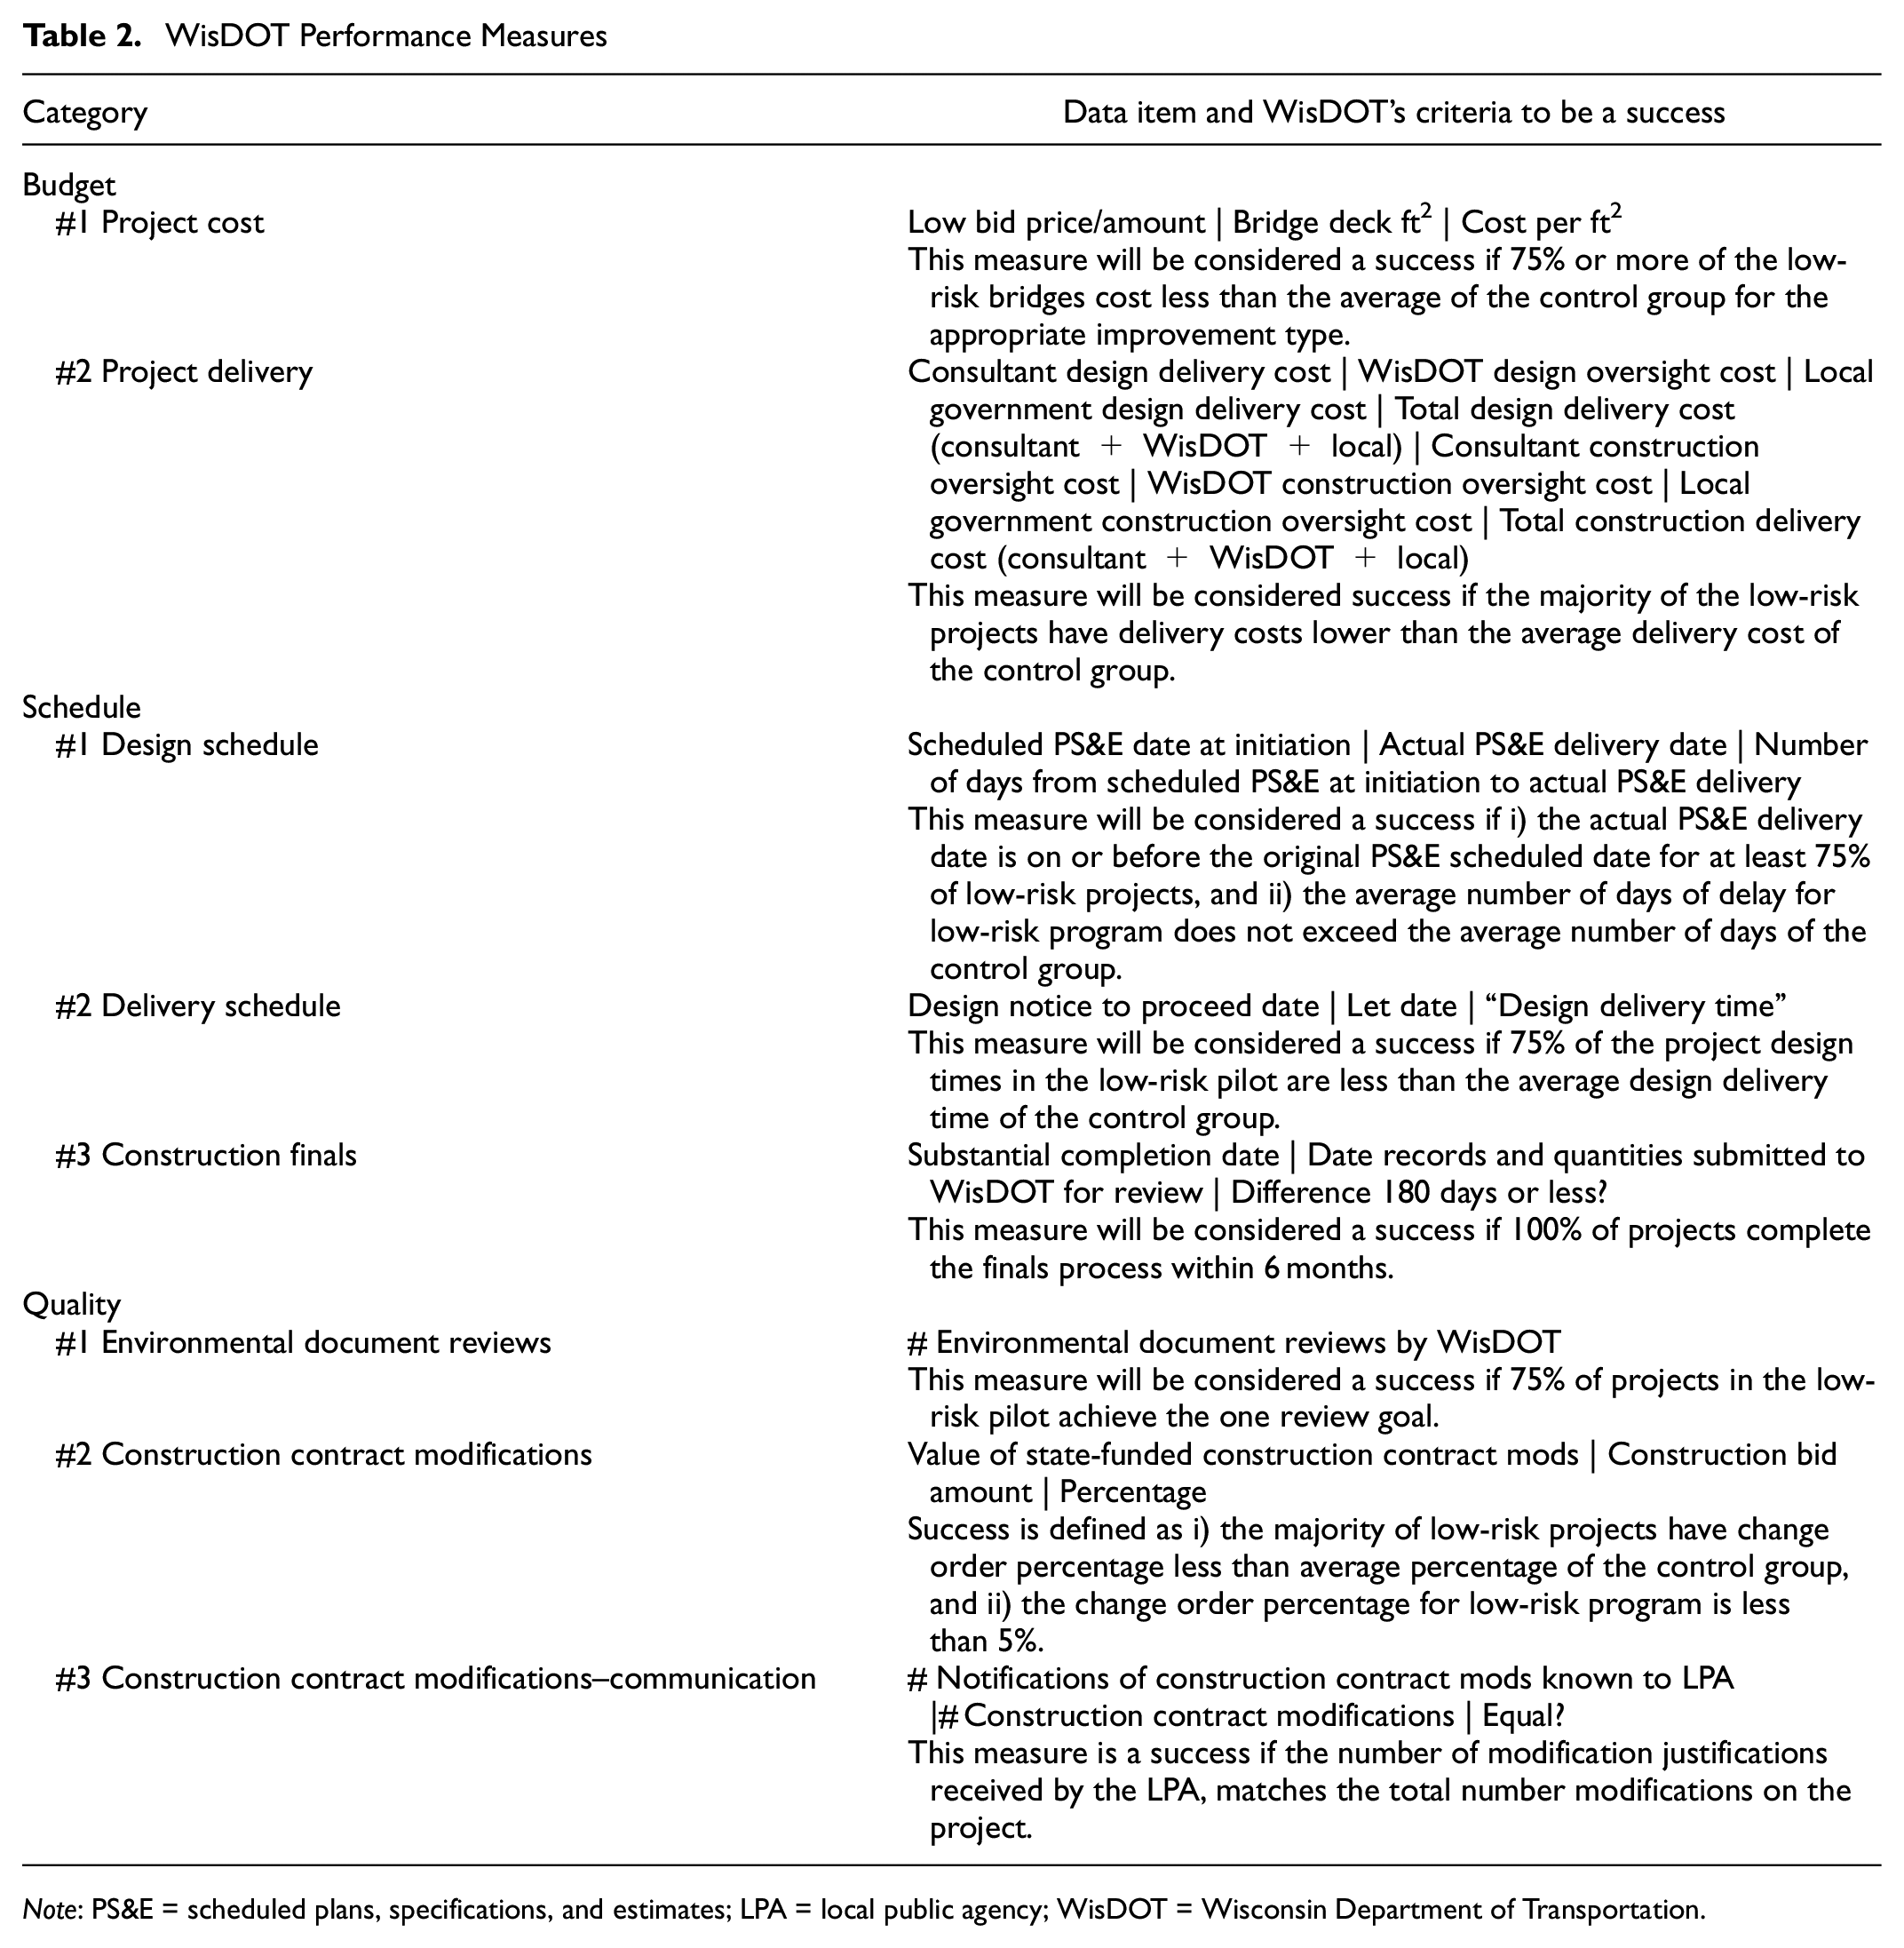
Note: PS&E = scheduled plans, specifications, and estimates; LPA = local public agency; WisDOT = Wisconsin Department of Transportation.
Also listed in Table 2 are the criteria recommended by WisDOT to determine whether the pilot program was successful in each performance metric ( 9 ). For example, Budget #1 (“project cost”) “will be considered a success if 75% or more of the low-risk bridges cost less than the average of the control group for the appropriate improvement type.”
A database (Table 3) of project information from the 16 pilot projects and 50 control projects was developed and the pilot program was evaluated by quantitative data analyses and a qualitative survey.
Sample Database
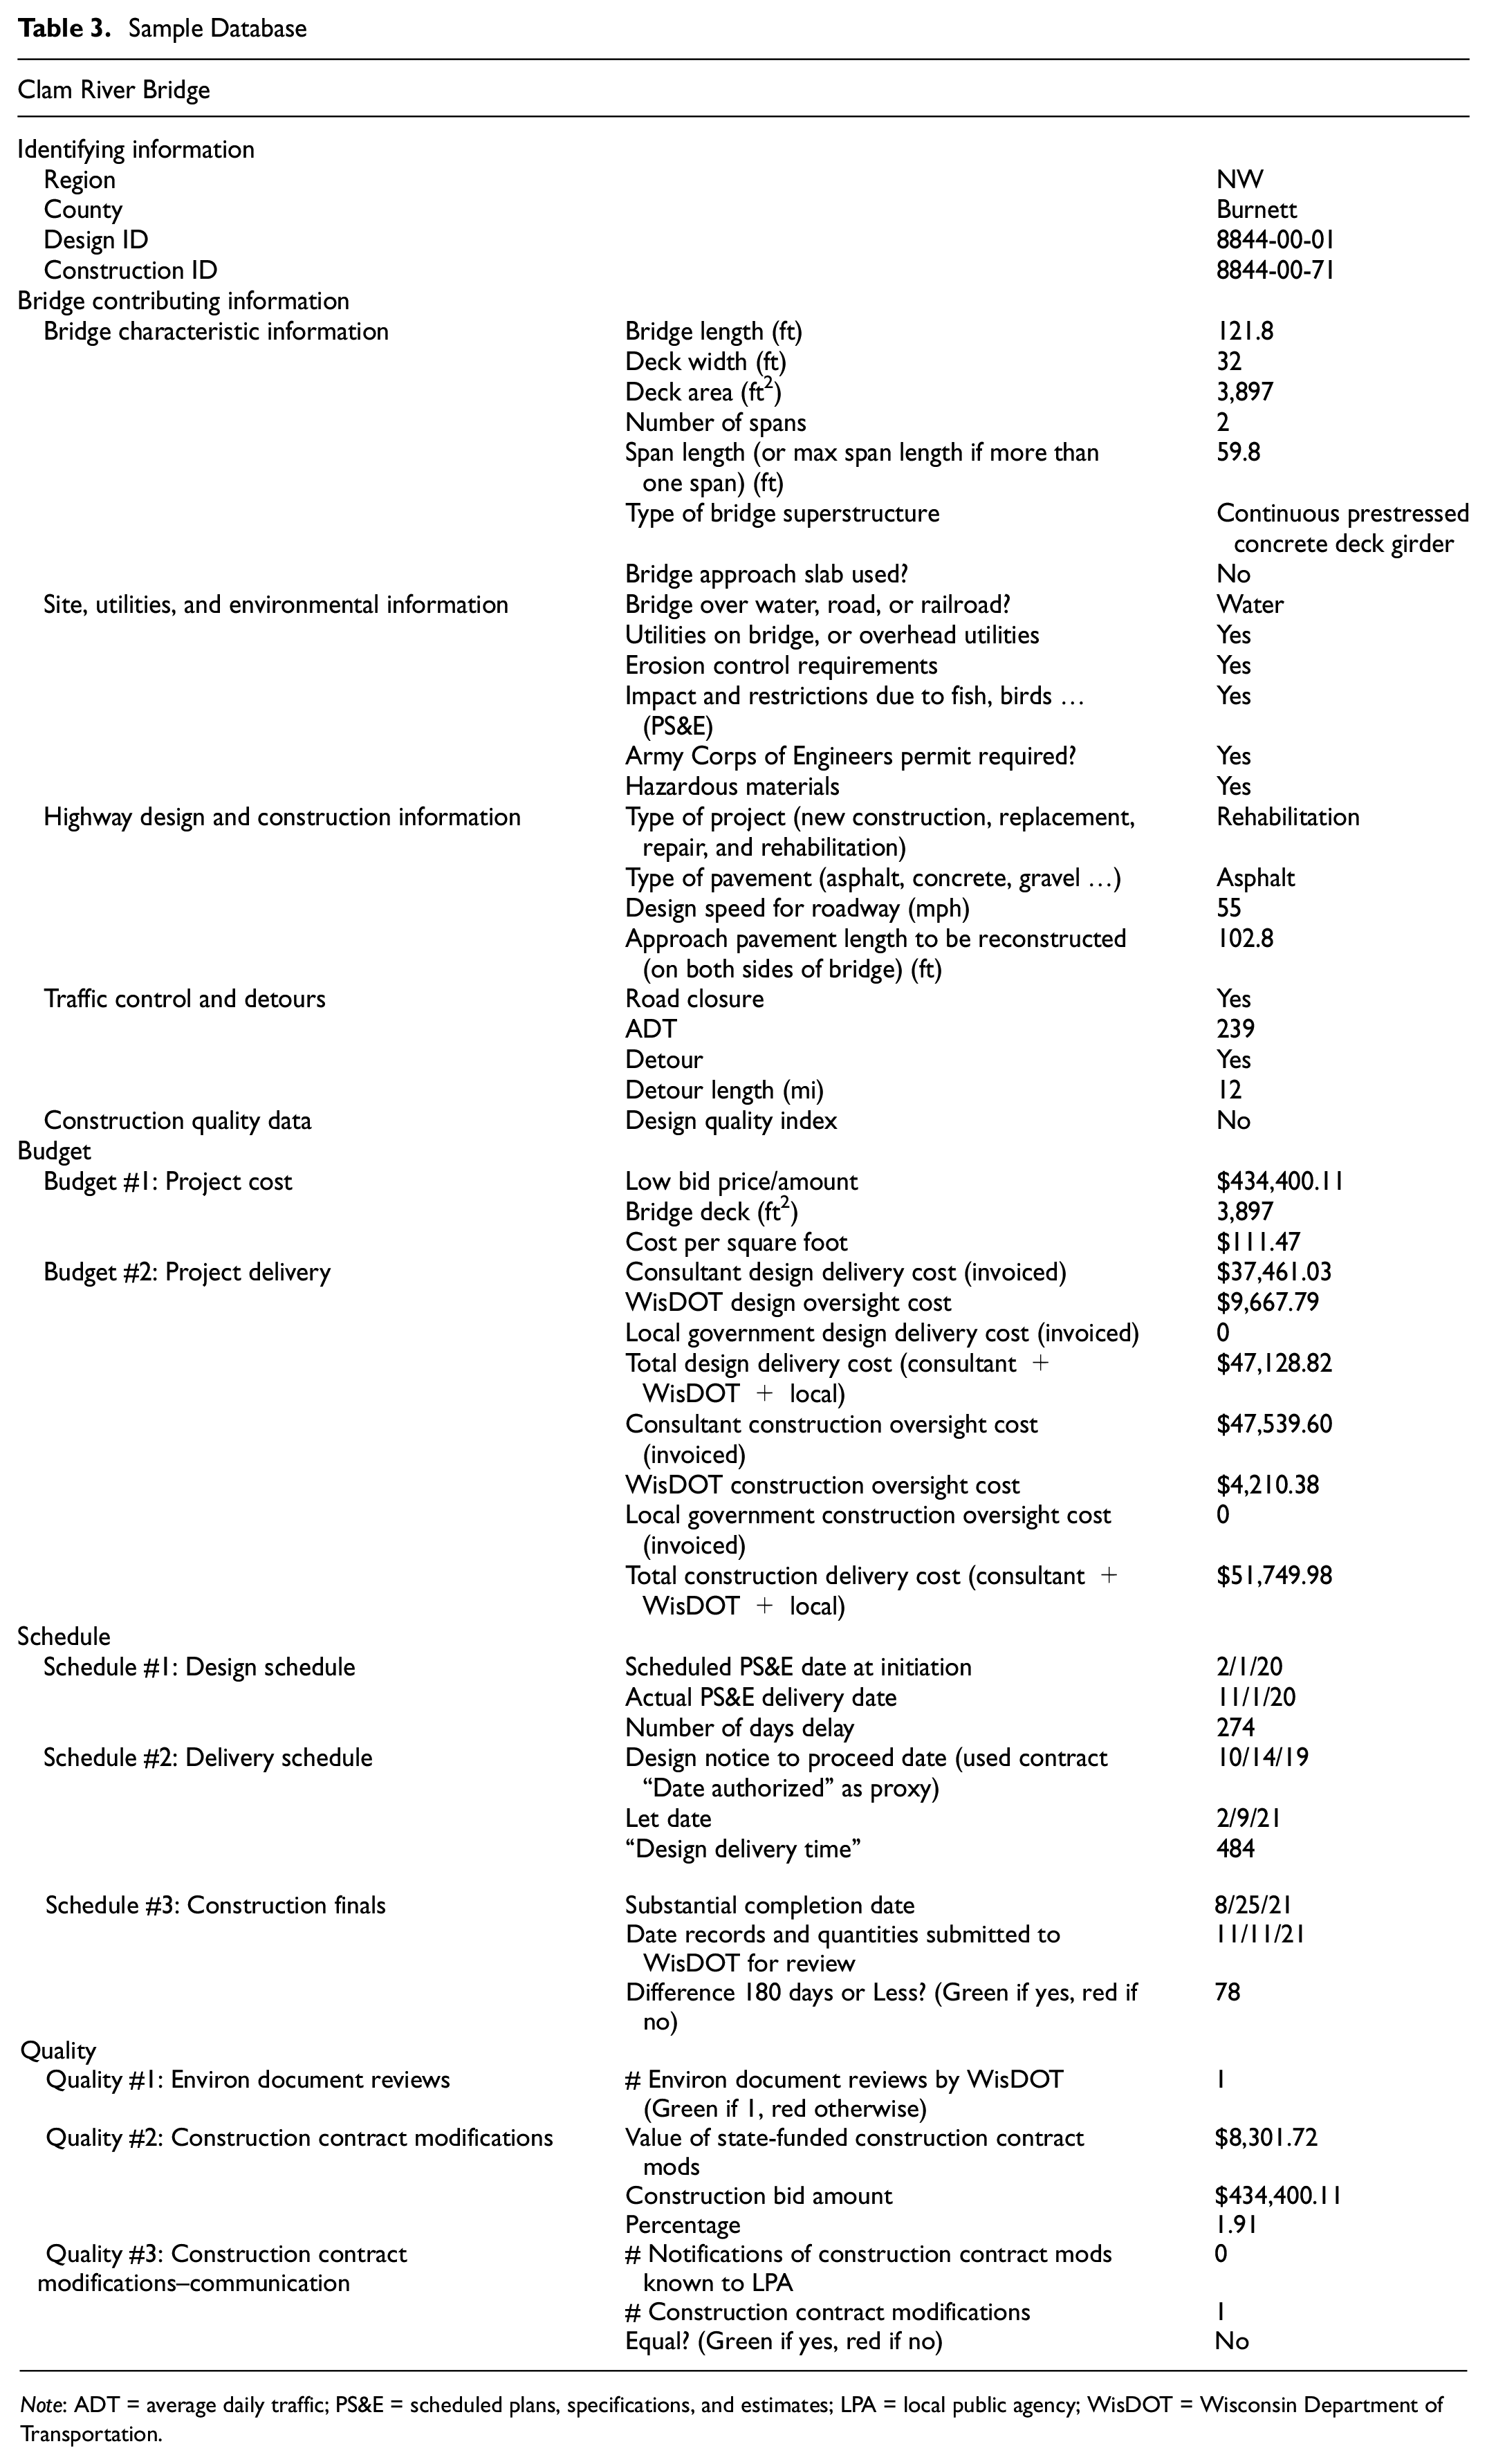
Note: ADT = average daily traffic; PS&E = scheduled plans, specifications, and estimates; LPA = local public agency; WisDOT = Wisconsin Department of Transportation.
Data Analysis and Results
A quantitative assessment was conducted using the collected data items and performance metrics for the selected pilot and control projects. First, descriptive statistics and statistical comparisons were performed on available data for the pilot and control groups. This is designed to show whether the contributing data from the two groups are significantly different and to assess whether the performance metrics from the two groups are comparable. After removing long bridges from the control group, the contributing variables showed no significant difference between the two groups. Then, the performance metrics of the pilot group were evaluated by comparing them to the control group. The statistical comparison shows whether the performance metrics of the pilot projects are improved (with respect to the control group) in a statistically significant manner. Finally, the pilot program was evaluated using the performance criteria developed by WisDOT. The data-driven statistical methods and state DOT’s performance criteria are complementary in the process of evaluating the pilot program.
Analysis #1: Full Data
All data from the 16 pilot projects and 50 control projects were analyzed. The descriptive statistics (mean value, standard error, minimum value, maximum value, and count) of the contributing data items (continuous variables) are shown in Table 4. For example, in the pilot group, bridge length had a mean value of 57.53 ft, a standard error of 7.54 ft, a minimum value of 32.50 ft, and a maximum value of 122.10 ft. On the other hand, in the control group, the bridge length had a mean value of 74.41 ft, a standard error of 8.27 ft, a minimum value of 23.00 ft, and a maximum value of 254.80 ft. Other descriptive statistics for the data items such as deck width, deck area, span length, design speed, approach pavement length, average daily traffic, and detour length can also be found in Table 4.
Statistical Analysis on Contributing Data Items: Full Data
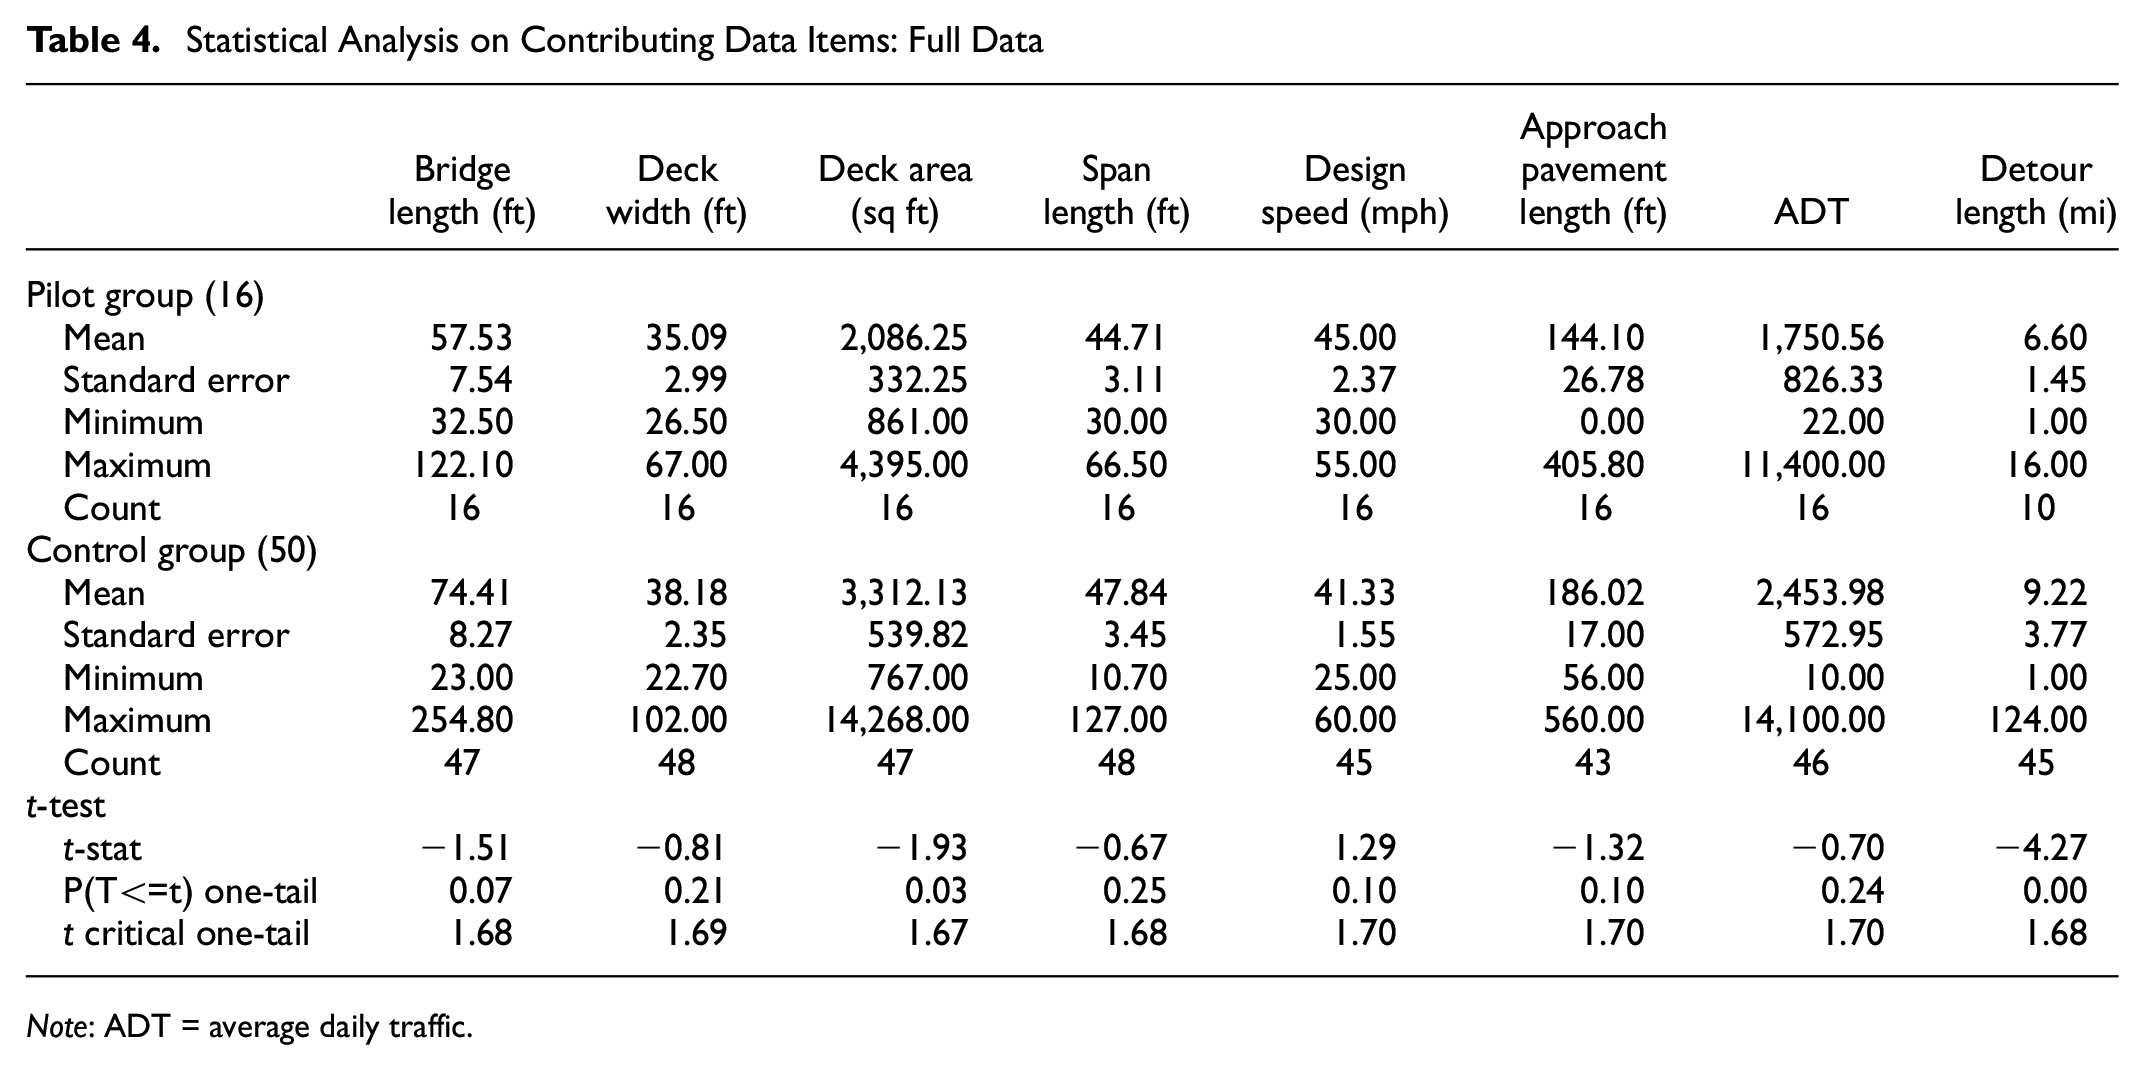
Note: ADT = average daily traffic.
Bridge length and deck area had noticeably larger values in the control group, which means that longer bridges exist in the control group. To measure whether the difference between the two groups was statistically significant, the research team used a t-test to compare the continuous bridge data items including bridge length and deck area. The t-test results are given in Table 4. When the p-value (one-tailed) was less than 0.05, the difference was considered statistically significant. From the table, we can see that the difference in deck area (between pilot and control groups) was statistically significant (p-value = 0.03), whereas the difference in bridge length was close to statistically significant (p-value = 0.07). The differences in the other contributing data items were not statistically significant except for the detour length (p-value was close to zero). In addition, descriptive statistics of the categorical contributing data items were generated. The results indicated that most of the categorical data were consistent between the pilot and control groups.
Analysis #2: Excluding Long Bridges in the Control Group
Statistical analysis of the full data (Table 4) indicated that bridge length was significantly larger in the control group. The long bridges in the control group could have skewed the performance measures. Thus, in this analysis, the research team excluded bridges with lengths greater than 122.10 ft (the maximum bridge length in the pilot group). Out of the 50 control bridges, 7 had a length greater than 122.10 ft and 3 had missing length information. As a result, 16 pilot projects and 40 control projects were used in the analysis.
Descriptive statistics of the contributing data items (continuous variables) are shown in Table 5. This time, bridge length and deck area had similar values between the pilot group and control groups, which was also the case for the rest of the data items. The t-test results in Table 5 also proved that there was no significant difference between the pilot and control groups in the continuous contributing data items (bridge length included). (The difference was not statistically significant as all p-values were large than 0.05.) Therefore, the modified control group in Analysis #2 was more reliable than the original group in relation to statistical comparison.
Statistical Analysis on Contributing Data Items: Long Bridges Excluded
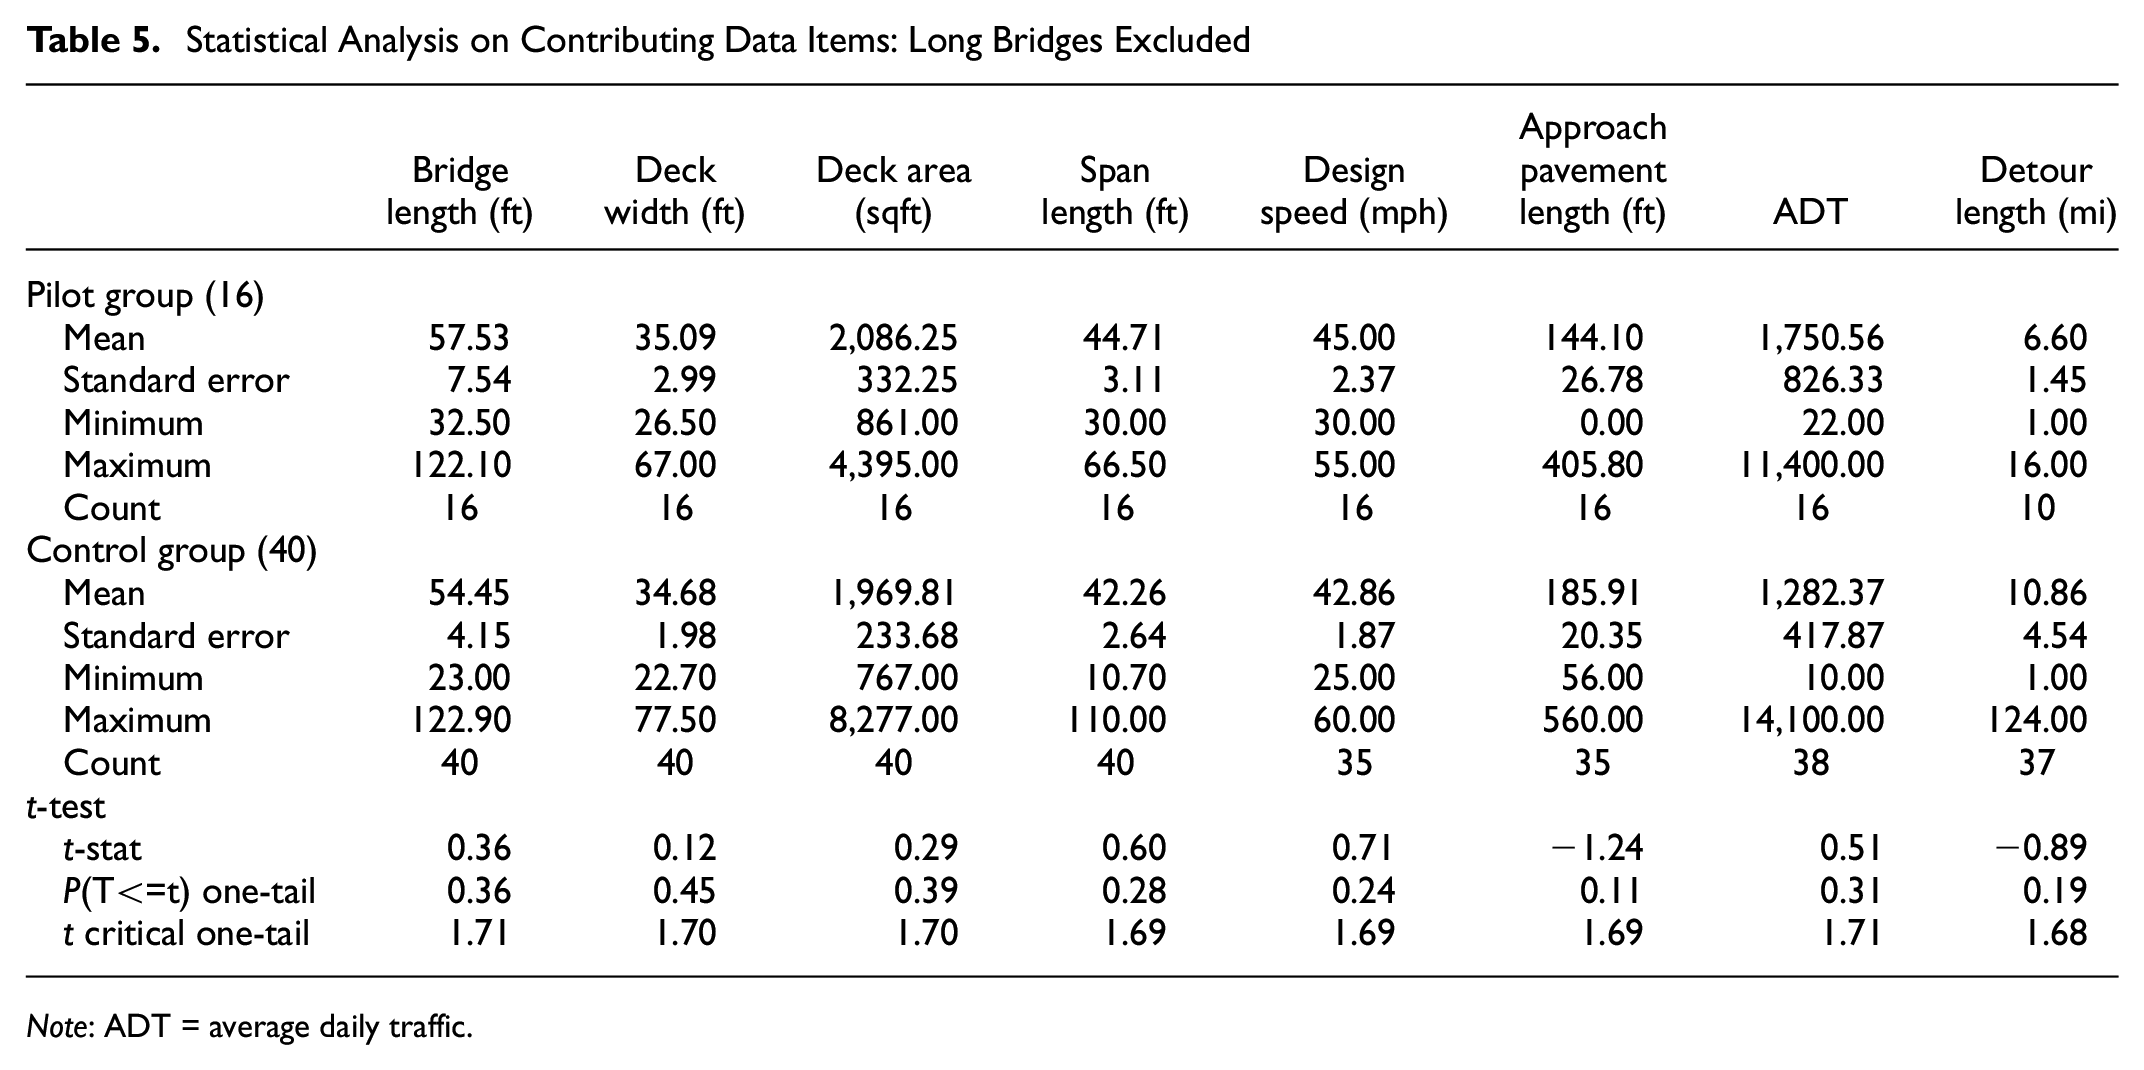
Note: ADT = average daily traffic.
Descriptive statistics of the continuous performance measures are shown in Table 6. All budget measures (cost per square foot, total design delivery cost, total design delivery cost per square foot, total construction delivery cost, total construction delivery cost per square foot) and most schedule measures (number of days from scheduled PS&E at initiation to actual PS&E delivery, “design delivery time”) had better performance (lower mean value) in the pilot group when compared with the modified control group. Only Schedule #3 (number of days from substantially complete to records and quantities submitted) and Quality #2 (percentage of construction contract modification) did not improve in the pilot group (higher mean value). The t-test results validated the improvements noted in the pilot projects as statistically significant (low p-values). The differences noted in Schedule #3 and Quality #2 were not statistically significant.
Statistical Analysis on Performance Metrics: Long Bridges Excluded
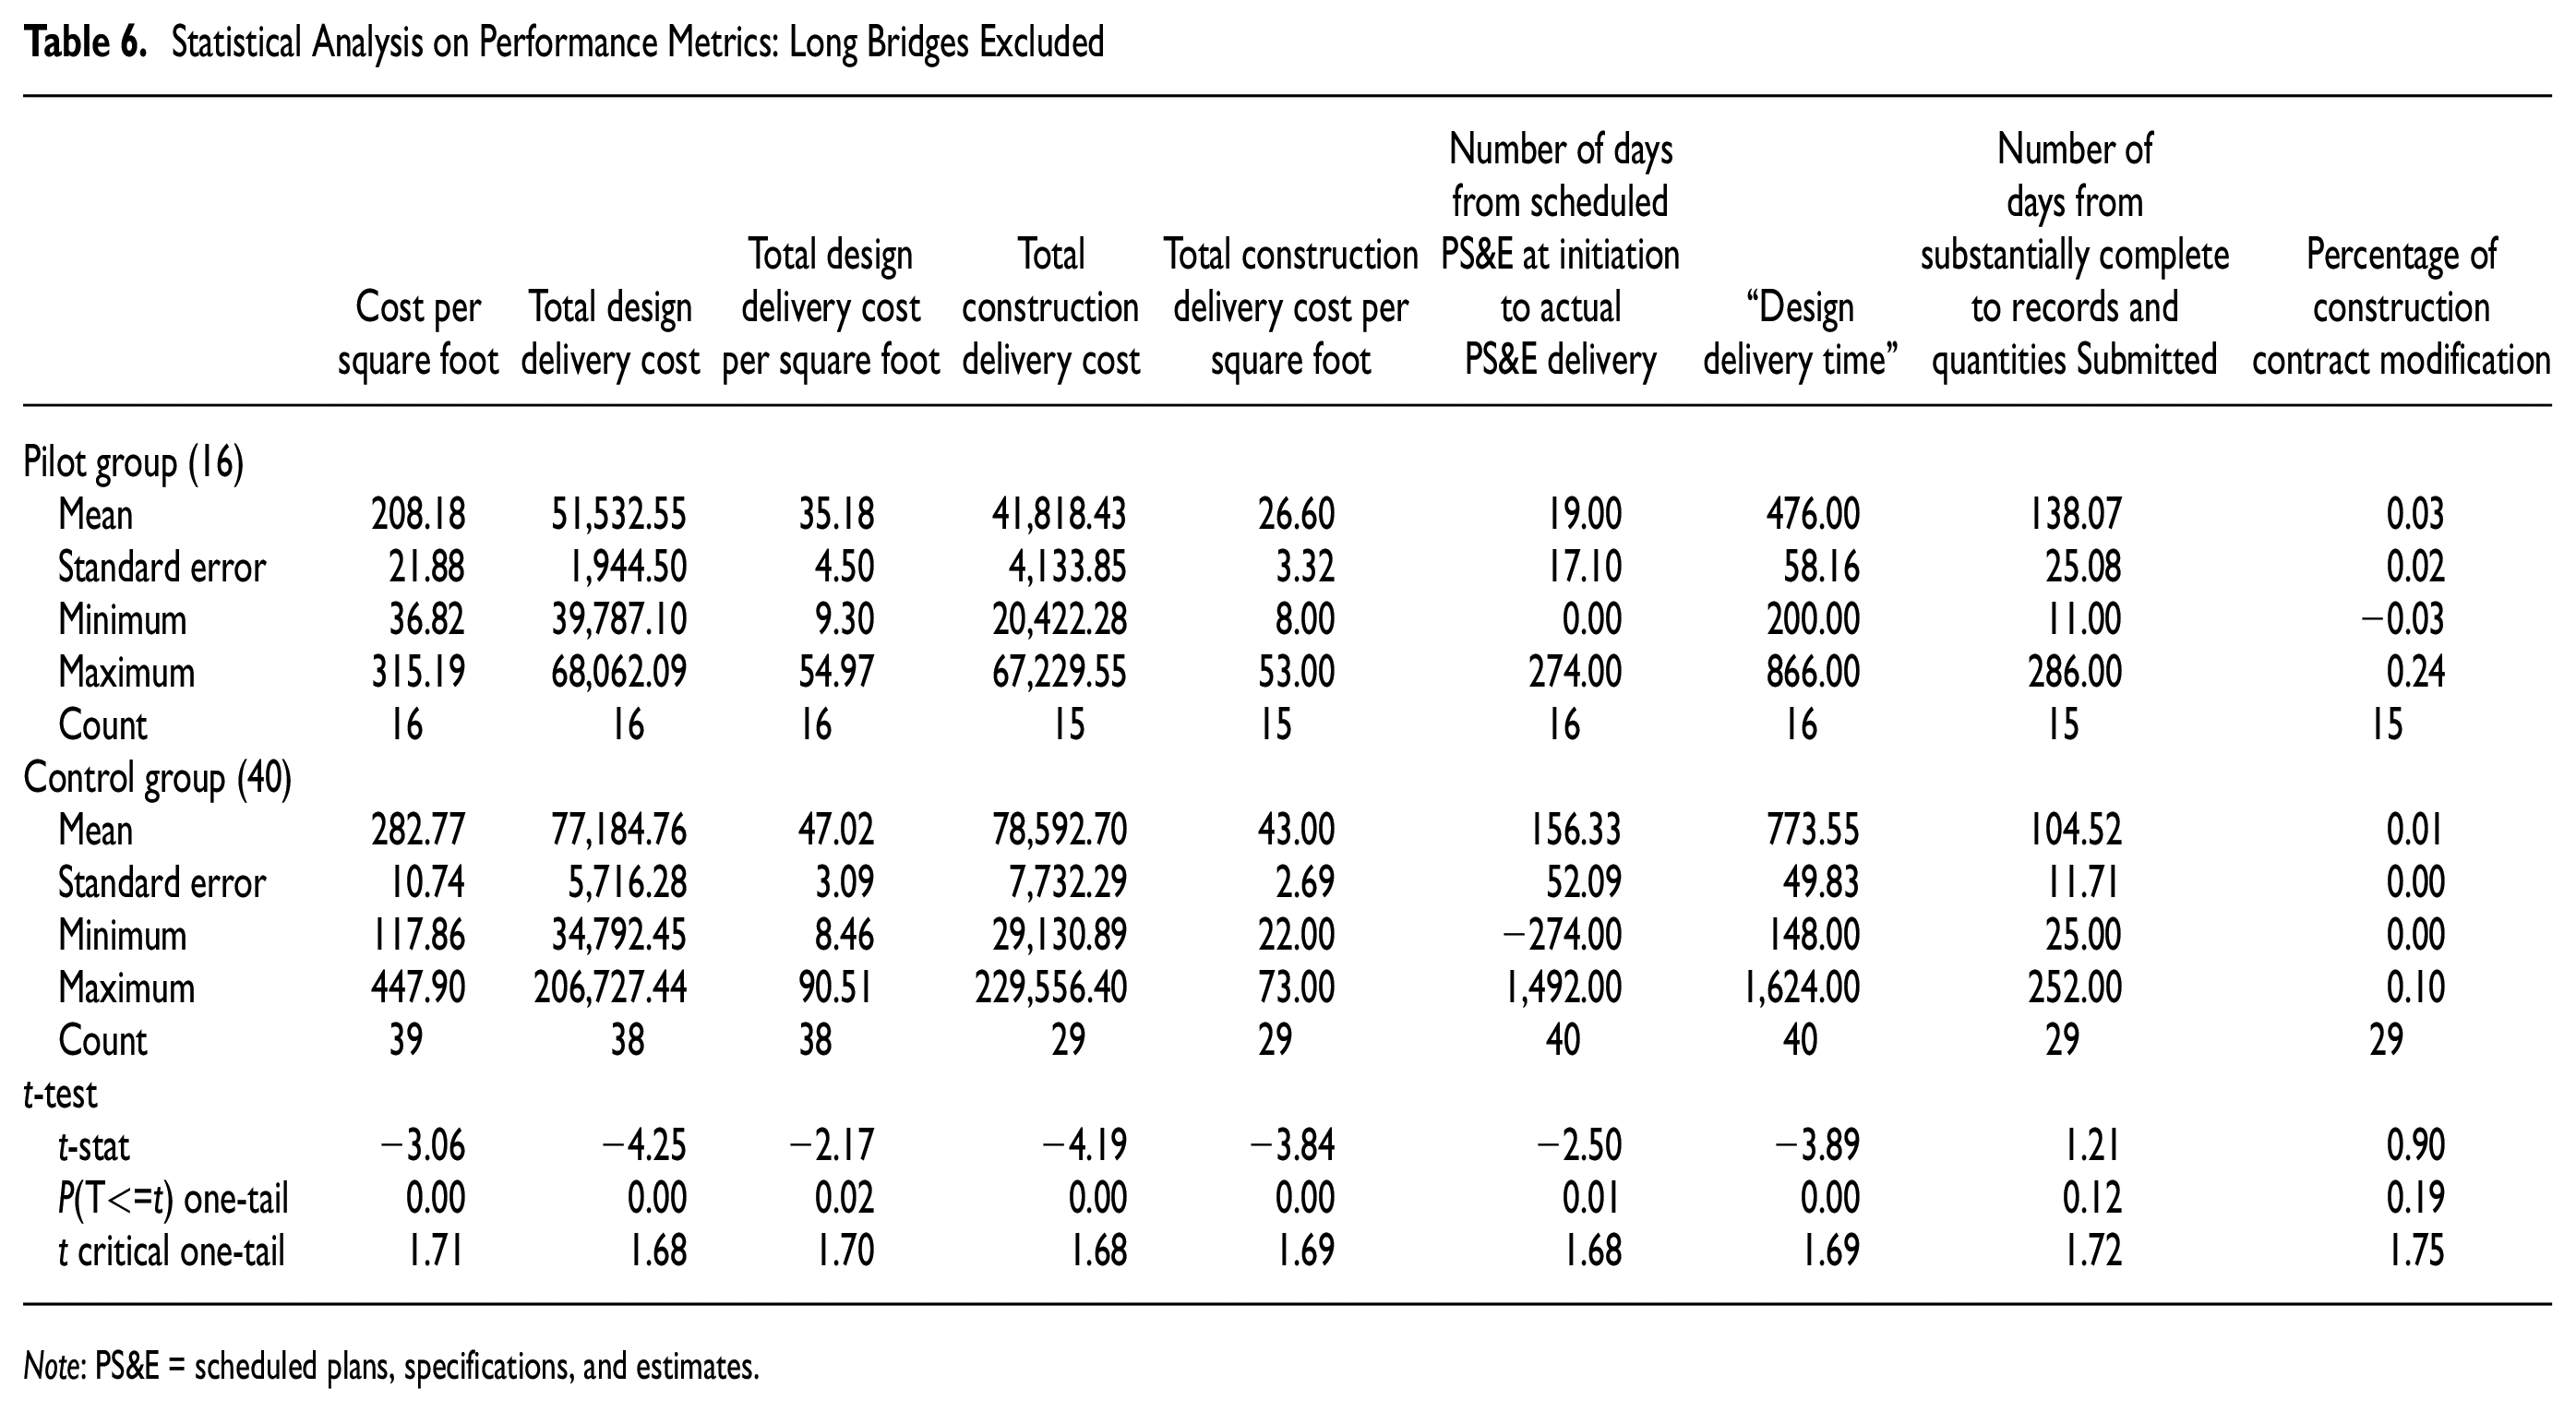
Note: PS&E = scheduled plans, specifications, and estimates.
Descriptive statistics of the two binary performance metrics Quality #1 (environmental document reviews by WisDOT) and Quality #3 (communication of construction contract modification) were evaluated. For Quality #1, 11 out of 16 pilot projects had only one review compared with 11 out of 39 in the modified control group. For Quality #3, 3 out of 10 pilot projects had successful communication compared with 6 out of 13 in the modified control group. Quality #1 performed better in the pilot group whereas Quality #3 did not perform better. The research team used the chi-squared test to compare the binary performance metrics. The p-value for the comparison in Quality #1 was 0.006 (<0.05), indicating that the improved performance in the pilot group was statistically significant. The p-value for the comparison in Quality #3 was 0.42 (>0.05), so the improvement noted for the modified control group with respect to this measure was not statistically significant.
After the statistical evaluation of the pilot project using the available data, the performance measures/criteria developed by the state DOT were also used to assess the pilot program. Note that the criteria used in this study were updated on January 13, 2020 ( 9 ). Future updates may affect the results reported here. Table 7 shows the results based on the state DOT’s performance criteria for budget, schedule, and quality. The green color in the cells indicates that the pilot program met the stated criteria and was therefore considered a success (in meeting the criteria).
Pilot Program Evaluation Using WisDOT’s Performance Criteria: Long Bridges Excluded
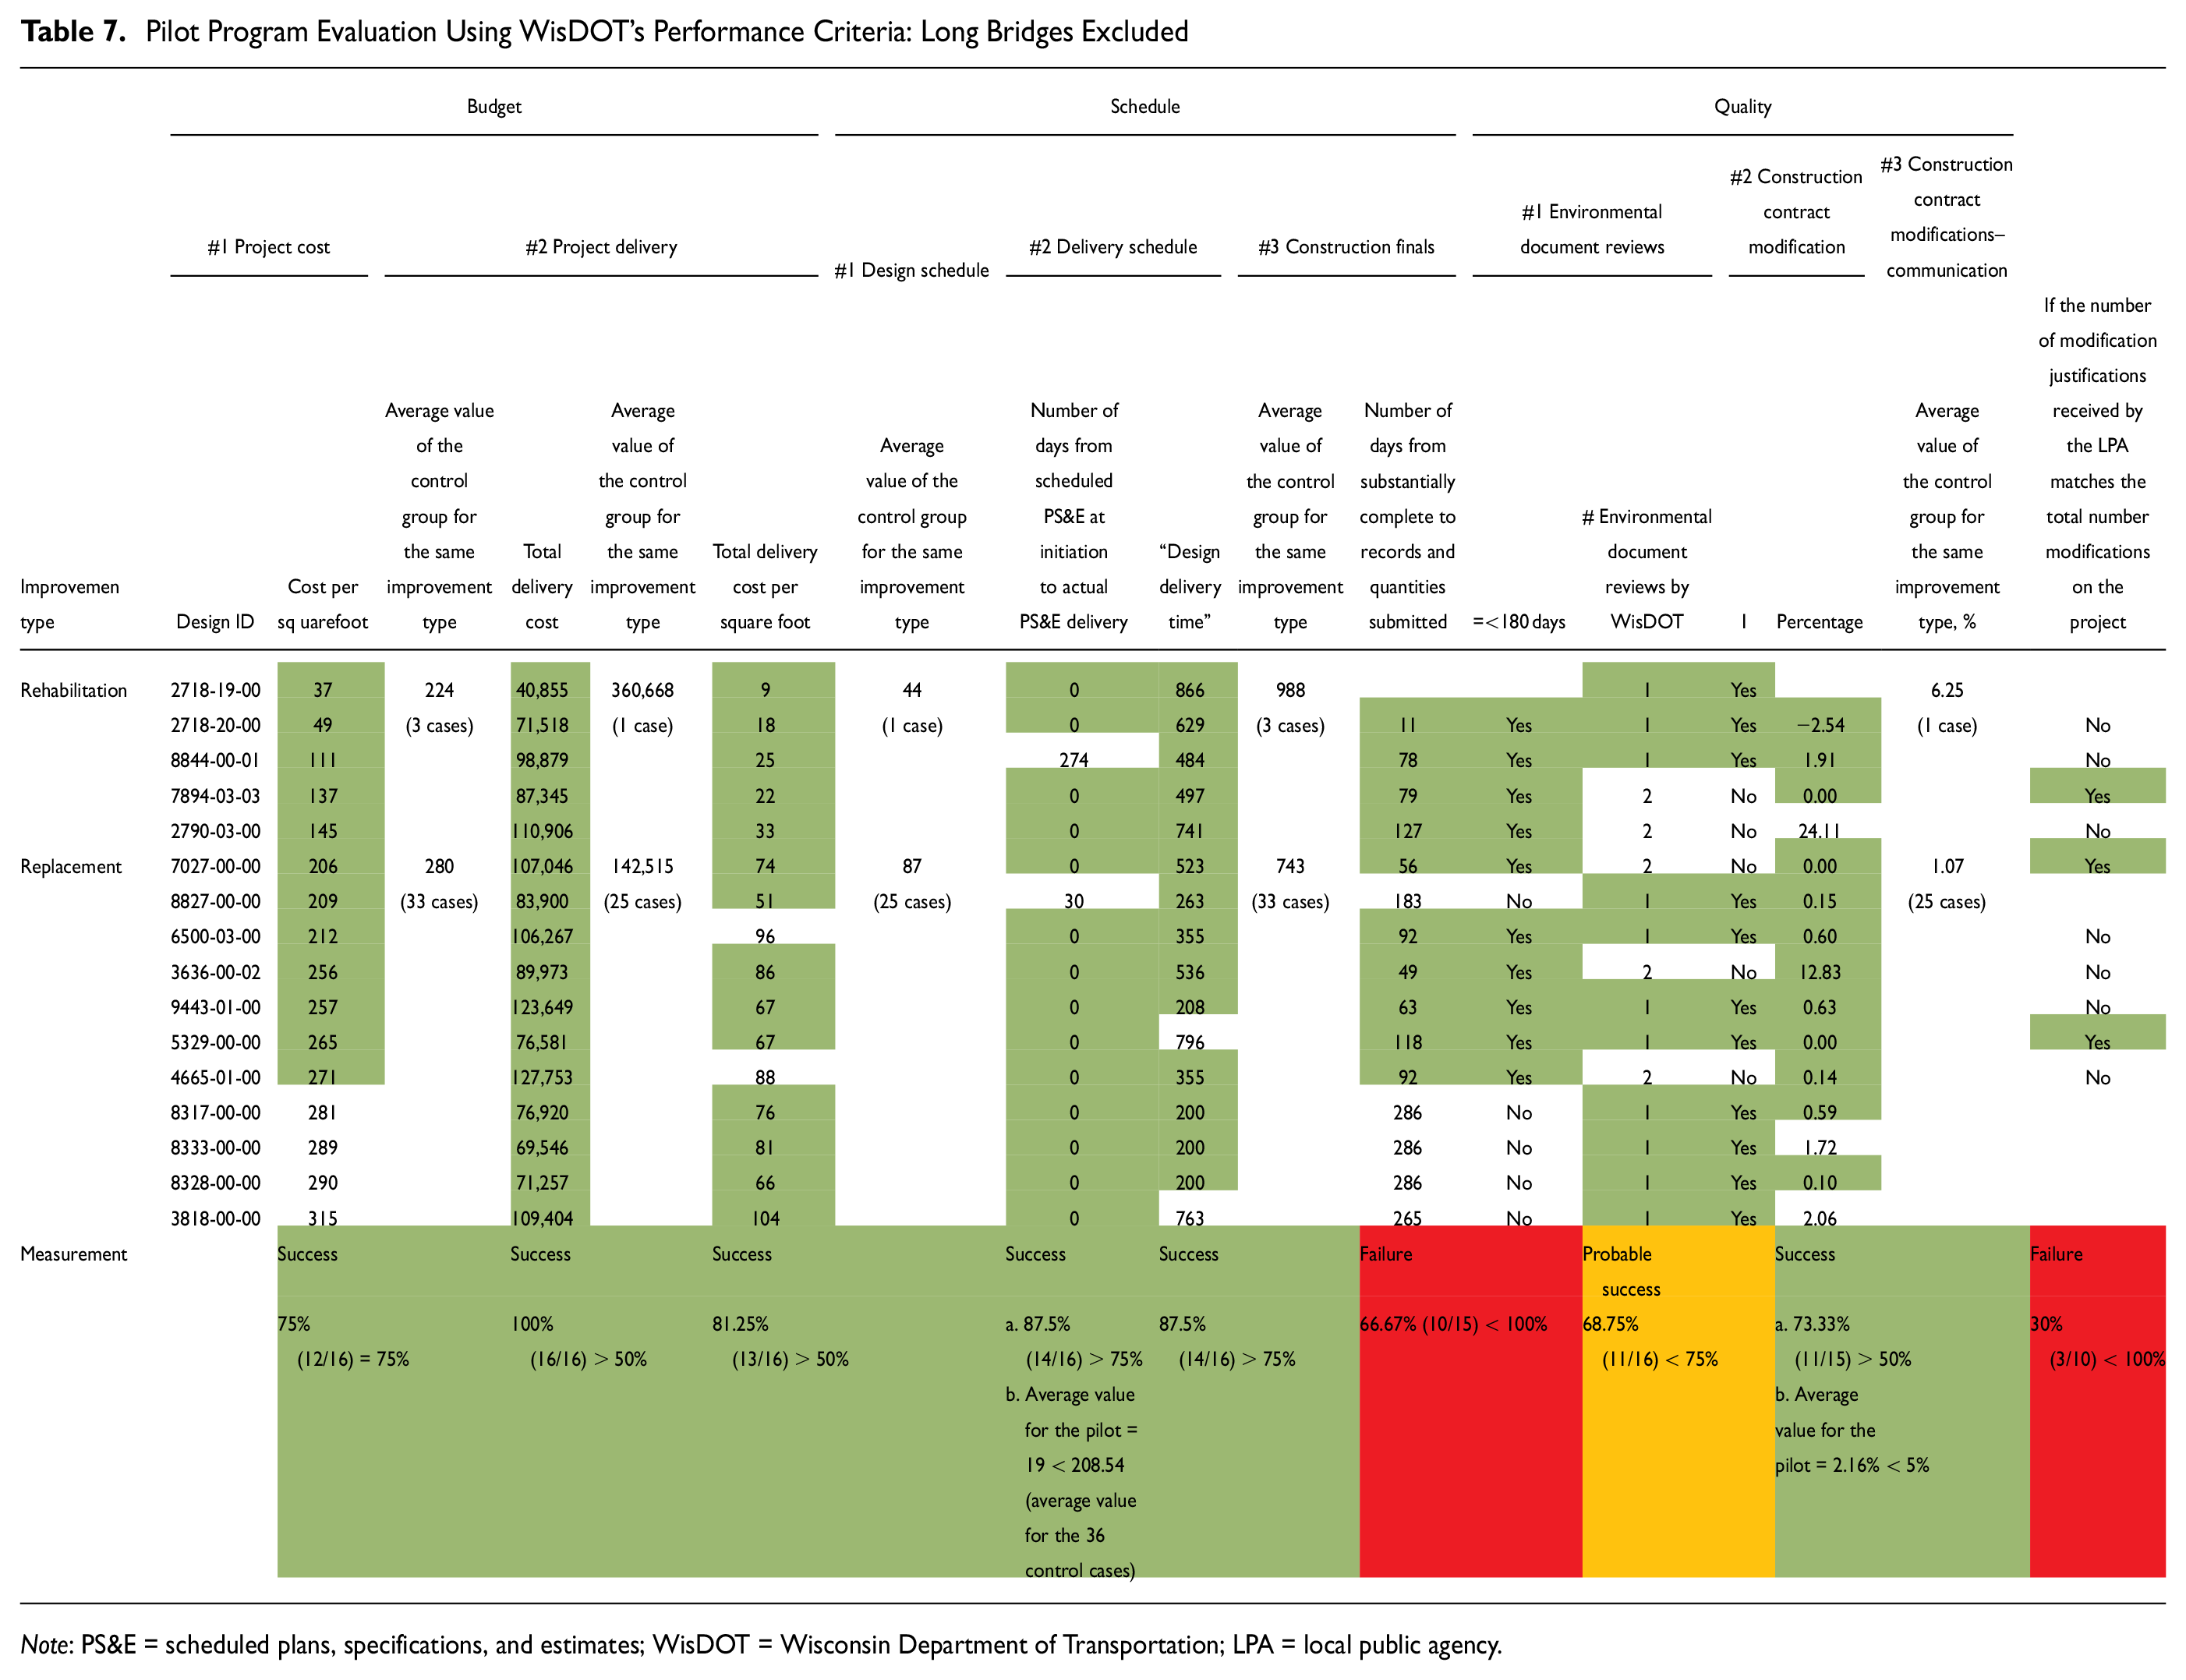
Note: PS&E = scheduled plans, specifications, and estimates; WisDOT = Wisconsin Department of Transportation; LPA = local public agency.
Based on the criteria for Budget #1, project cost will be “considered a success if 75% or more of the low-risk bridges cost less than the average of the control group for the appropriate improvement type.” The average values of the control group for the same improvement type were calculated. Available data from 16 pilot projects and 36 modified control projects (3 rehabilitation and 33 replacement) were used to evaluate Budget #1. This measure can be considered a success since 75% (12/16) = 75% met the stated criterion.
Other performance measures were evaluated using the same approach. Budget #2 can be considered a success since 81.25% (13/16) >50% met the stated criteria. Schedule #1 can be considered a success since both of the following conditions were satisfied: i) 87.5% (14/16) >75%, and ii) average value for the pilot =19 < 208.54 (average value for the 36 control projects). Schedule #2 can be considered a success since 87.5% (14/16) = 75% met the stated criteria. Schedule #3 cannot be considered a success since 66.67% (10/15) <100% did not meet the stated criteria. Quality #1 cannot be considered a success since 68.75% (11/16) <75% did not meet the stated criteria. Quality #2 can be considered a success since both of the following conditions were satisfied: i) 73.33% (11/15) >50%, and ii) average value for the pilot = 2.16% <5%. Quality #3 cannot be considered a success since 30% (3/10) <100% did not meet the stated criteria.
Summary of the Findings
Analysis #1 used all the available data from the pilot and control projects. It was found that, on the whole, bridges in the control group were longer than those in the pilot group. Longer bridges mean higher construction costs and longer project schedules. Therefore, in Analysis #2, long bridges were removed from the control group and the same analysis was repeated. Two additional analyses were performed as a comparison. Analysis #3 further removed super accelerated pilot projects because of the concern that they were bundled together and might have affected the overall evaluation of the pilot program. The control projects utilizing a management consultant were excluded in Analysis #4 to avoid any effects from the additional design oversight cost.
Table 8 gives a summary of the four analyses in which the cells are color coded: green is for a statistically significant improvement or a success, yellow is for a probable improvement (which is not statistically significant) or a probable success, and red means no improvement or a failure. Overall, both the statistical comparisons between the pilot and control groups and the comparison based on the state DOT’s performance metrics showed consistent outcomes in budget and schedule. For Budget #1 and #2 and Schedule #1 and #2, the pilot program significantly improved the project performance, which agreed with the conclusion drawn based on the state DOT’s measures/criteria. For Schedule #3, both methods suggested that the pilot program did not seem to improve project performance.
Summary of Quantitative Evaluation of the Pilot Program
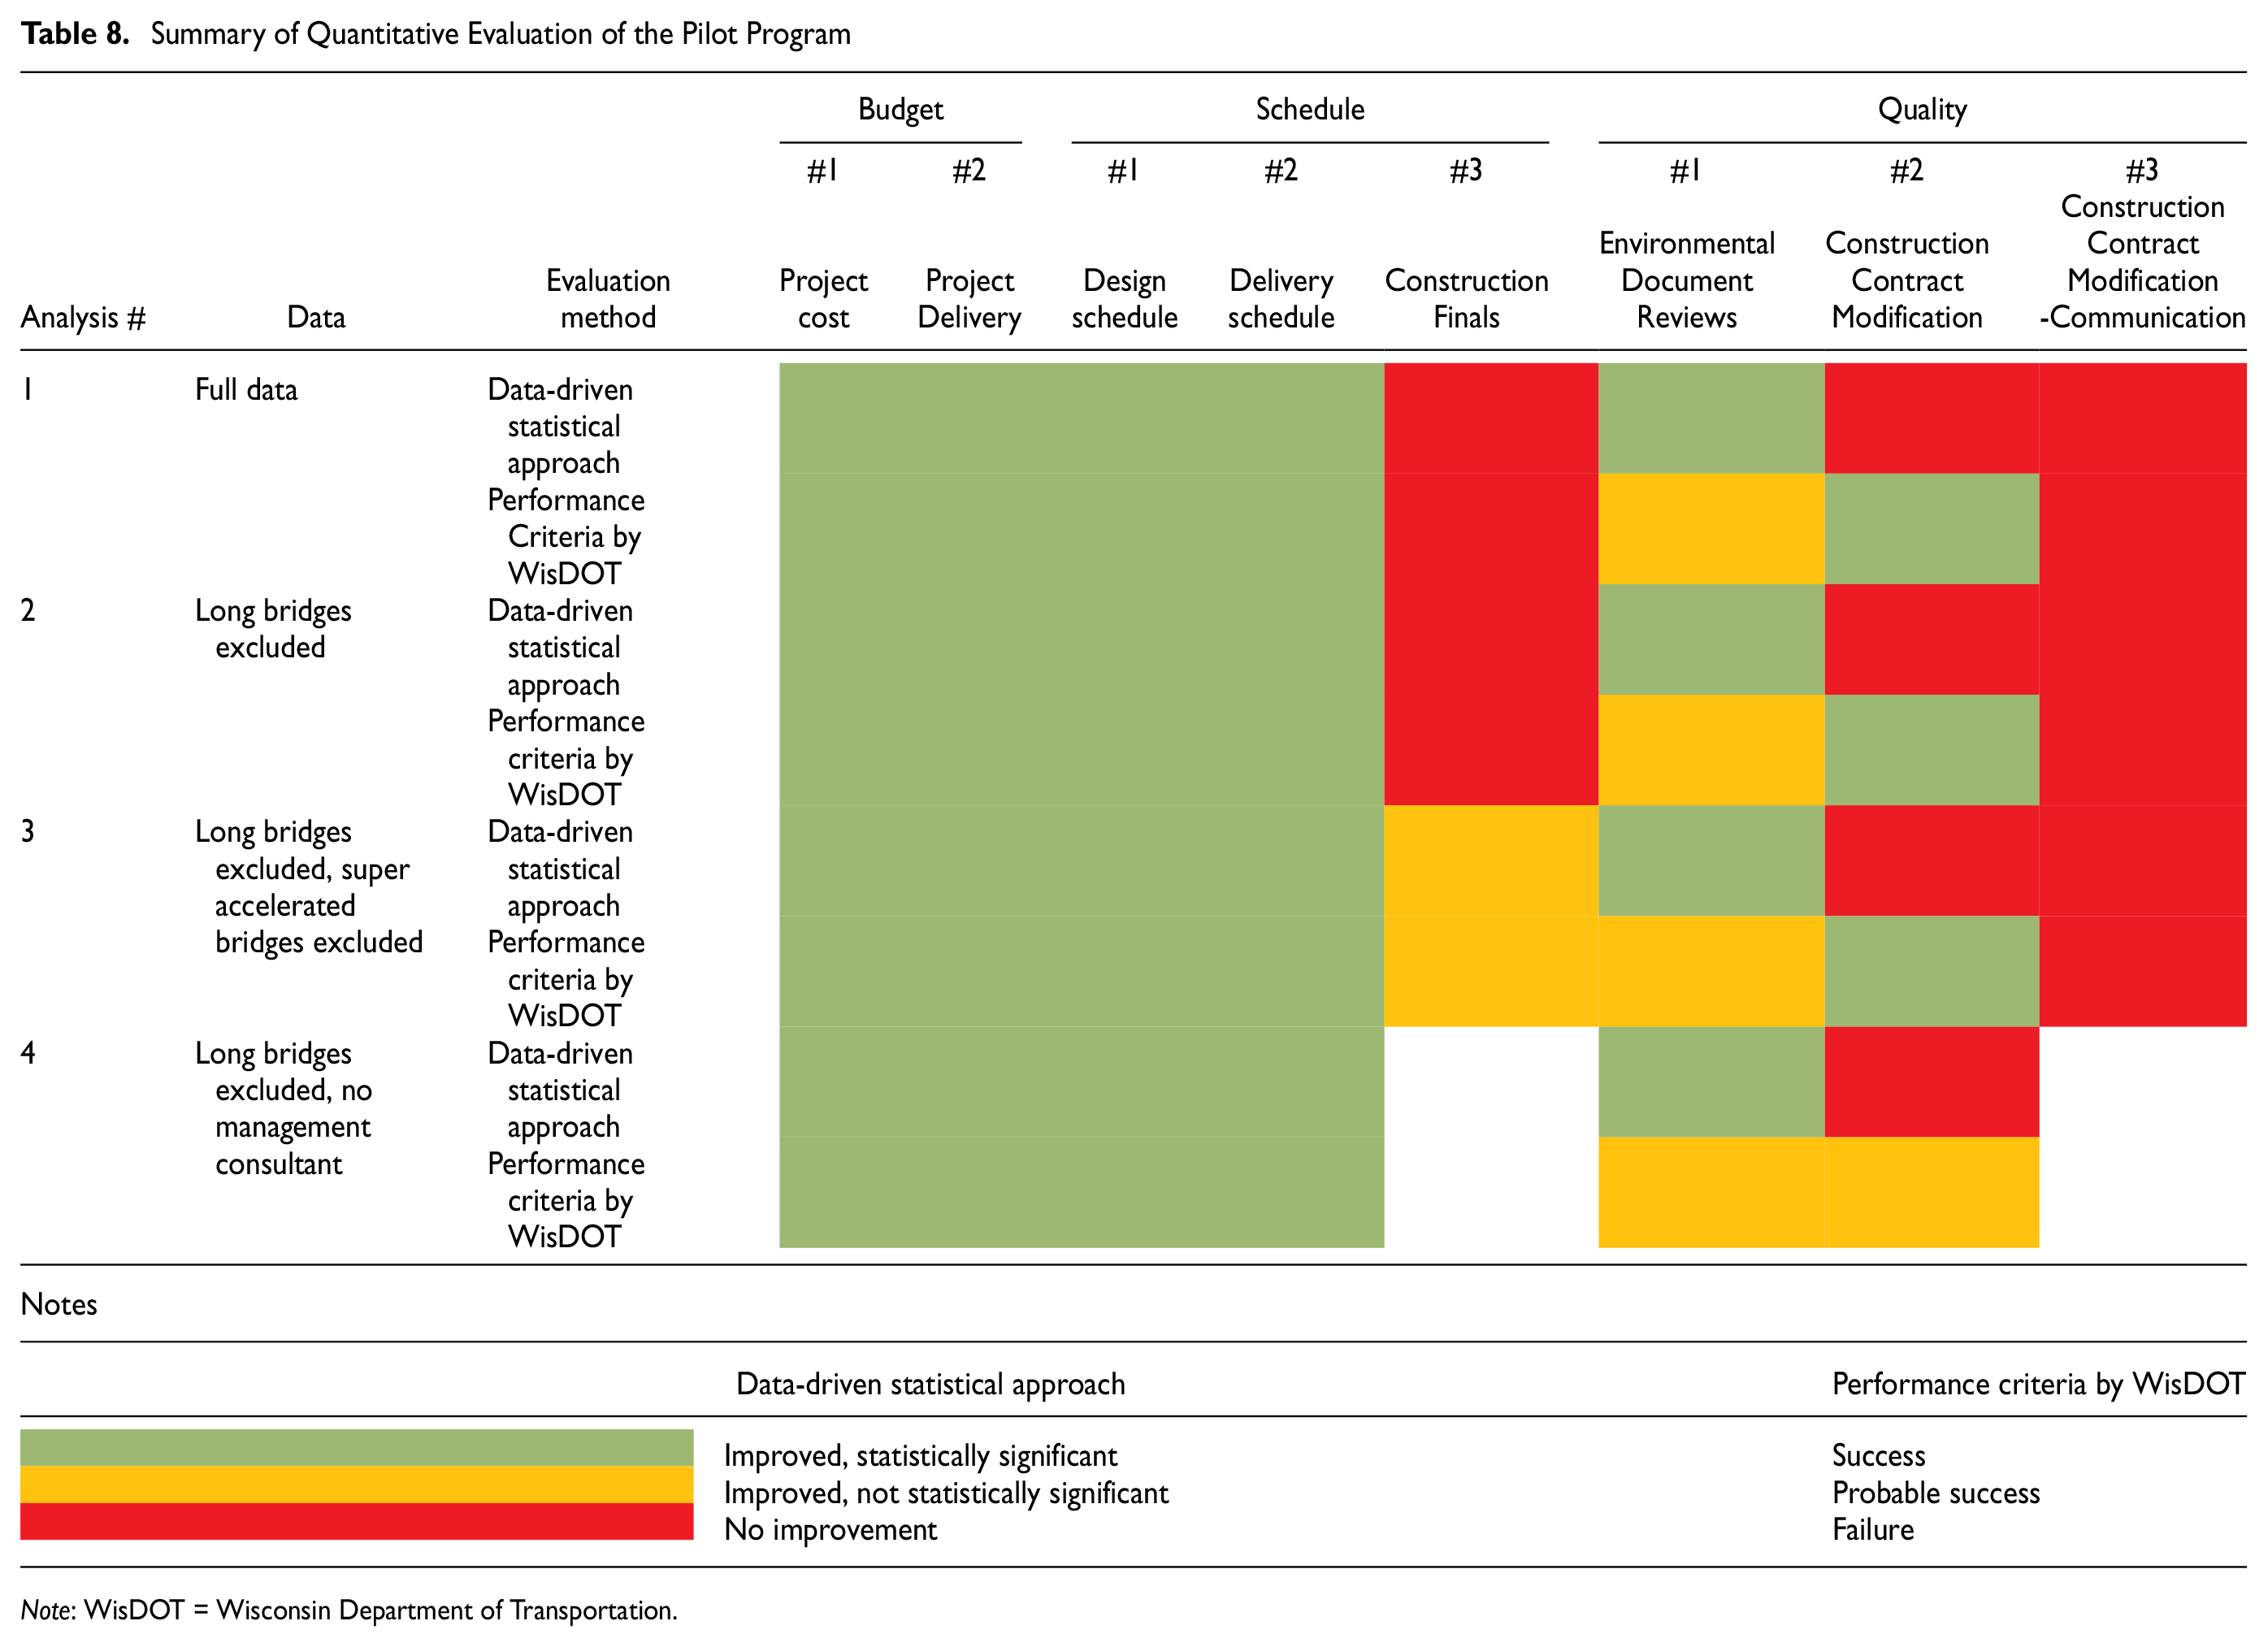
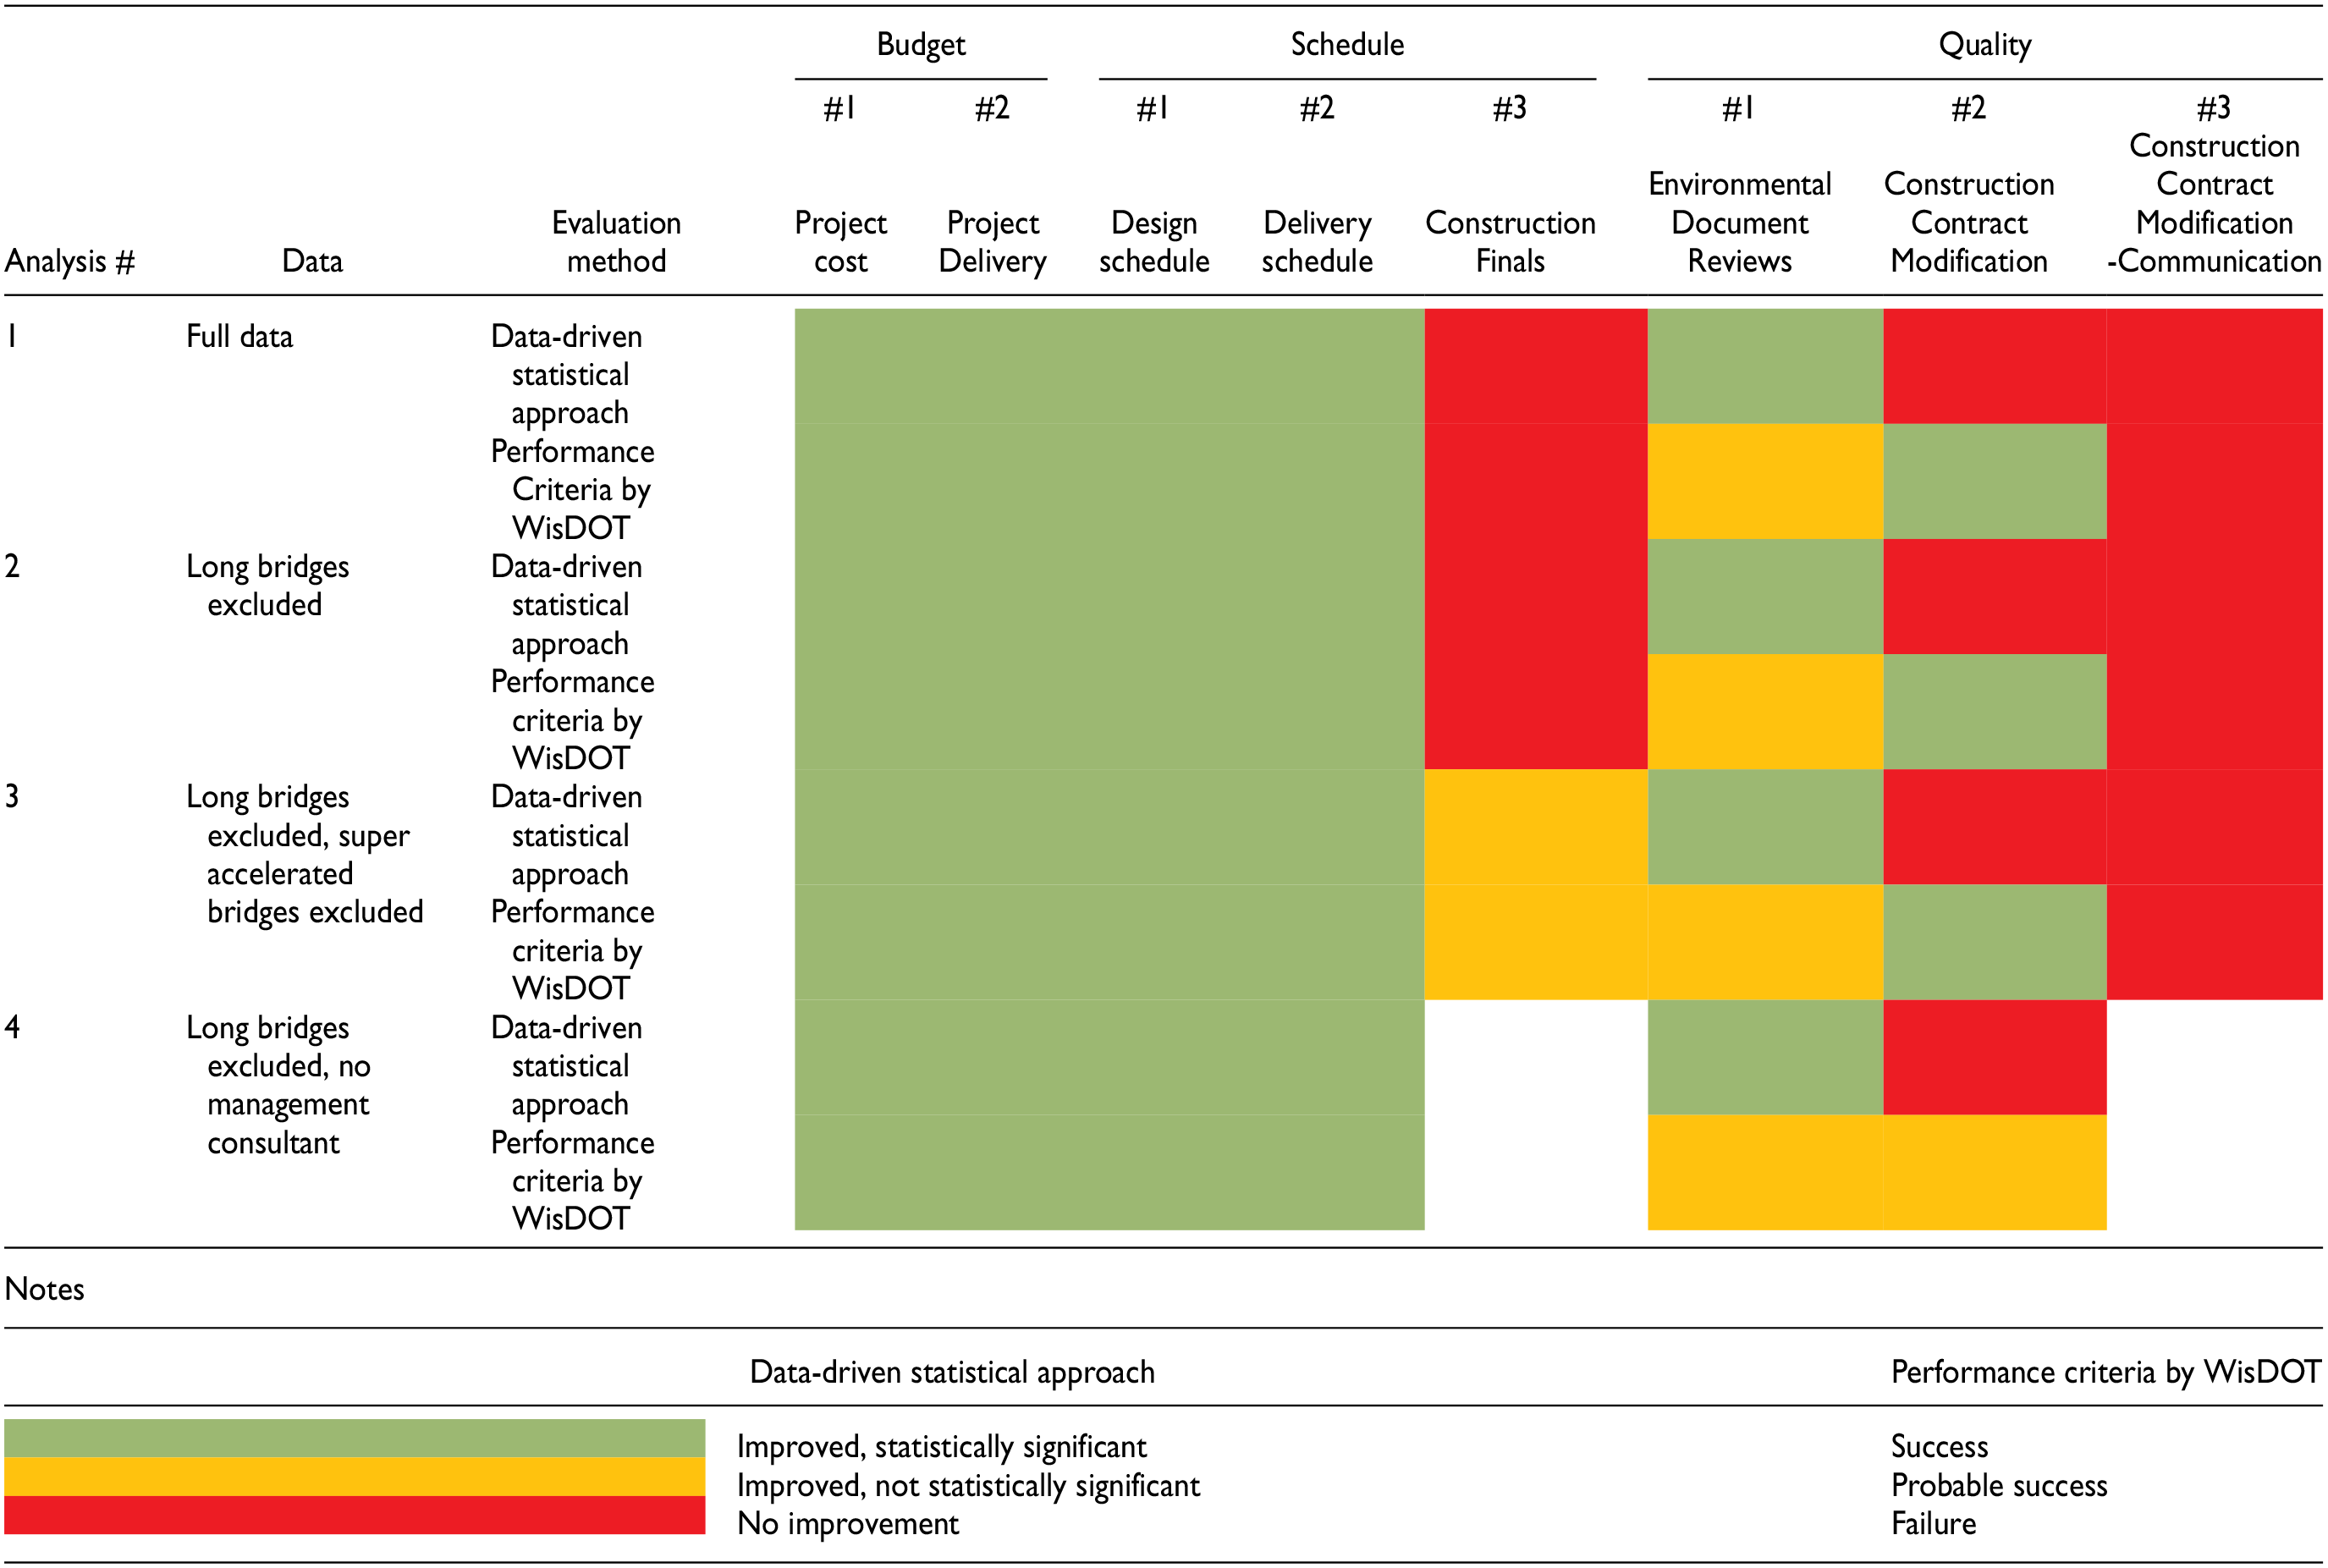
Note: WisDOT = Wisconsin Department of Transportation.
For the quality measures, different outcomes were observed. For Quality #1, the pilot program improved the project performance in a statistically significant manner (based on the statistical analyses) but would not be considered a success based on the state DOT’s performance measures. Although there were more bridges with only one environmental document review in the pilot group than in the control group, the number of bridges still missed the state DOT’s target of 75% to be considered as a success. For Quality #2, the pilot program did not improve the performance based on the statistical analysis, although it met the state DOT’s criterion for success because a few pilot projects had a higher percentage of construction contract modifications (e.g., 24.11%). These projects affected the average performance of the pilot group. For Quality #3, an improvement in the pilot program was not observed. At the same time, this measure was not a success according to the state DOT’s performance measure.
The discrepancies between the performance outcomes were caused by fundamental differences in the two methods. The statistical comparison undertaken by the research team compared the average value of the bridge parameters in the pilot group with the corresponding average value in the control group. It treated bridges as a group. The state DOT’s method, however, compared individual bridge values in the pilot group against the average value of the control group, and then applied a subjective threshold value to determine how many pilot sites exceeded or did not exceed the control group average. If the data points are not too dispersed (i.e., few outliers), the two methods may yield consistent results because the average value is susceptible to outliers. Since the state DOT’s method depends on the choice of pass/fail limits, one can always find a threshold value that results in the same conclusion as the statistical comparison between group values. Therefore, the two methods could be complementary, and thus can provide a robust assessment of pilot programs.
All four sets of data analyses showed similar evaluation results for the pilot program: 1) better performance in budget, 2) better performance in schedule except for Schedule #3: construction finals, and 3) mixed performance in quality, depending on the evaluation method.
Survey of Local Sponsors and Stakeholders
Following the quantitative evaluation, an online survey of stakeholders about the low-risk bridge pilot program was conducted. The stakeholders included WisDOT staff, Wisconsin local government agencies, WCHA, consultants, contractors, and others who might have participated in (or have relevant knowledge of) the pilot program. An online survey questionnaire (Figure 2) was sent out using Qualtrics with follow-up phone calls to obtain additional information based on the answers provided. The survey was intended to collect the respondents’ feedback on project management communications and deliverables.

Survey questionnaire.
Twenty responses to the online survey were received (out of 38 individuals contacted), and 7 out of the 20 respondents agreed to a follow-up phone call. Figure 3 illustrates the results of three key performance measures: budget, schedule, and quality. State DOT personnel mostly anticipated maintaining or reducing costs (maintain/reduce versus increase: 7 versus 2). All county officials believed the program could lower costs. Overall, most respondents, regardless of their role, believed the pilot program could maintain or reduce delivery costs (maintain/reduce versus increase: 12 versus 3). With regard to the project schedule, state DOT personnel were divided, with half considering it maintainable or accelerated (maintain/accelerate versus delay: 5 versus 5), whereas all county officials and the design engineer believed in its potential acceleration. In relation to project quality, most state DOT personnel did not foresee improvements (maintain/improve versus lower: 3 versus 7). Conversely, most county officials believed quality would improve (maintain/improve versus lower: 3 versus 1), and the design engineer expected maintenance of project quality. Although half believed in maintaining or improving delivery quality, the others did not (maintain/improve versus lower: 8 versus 8).
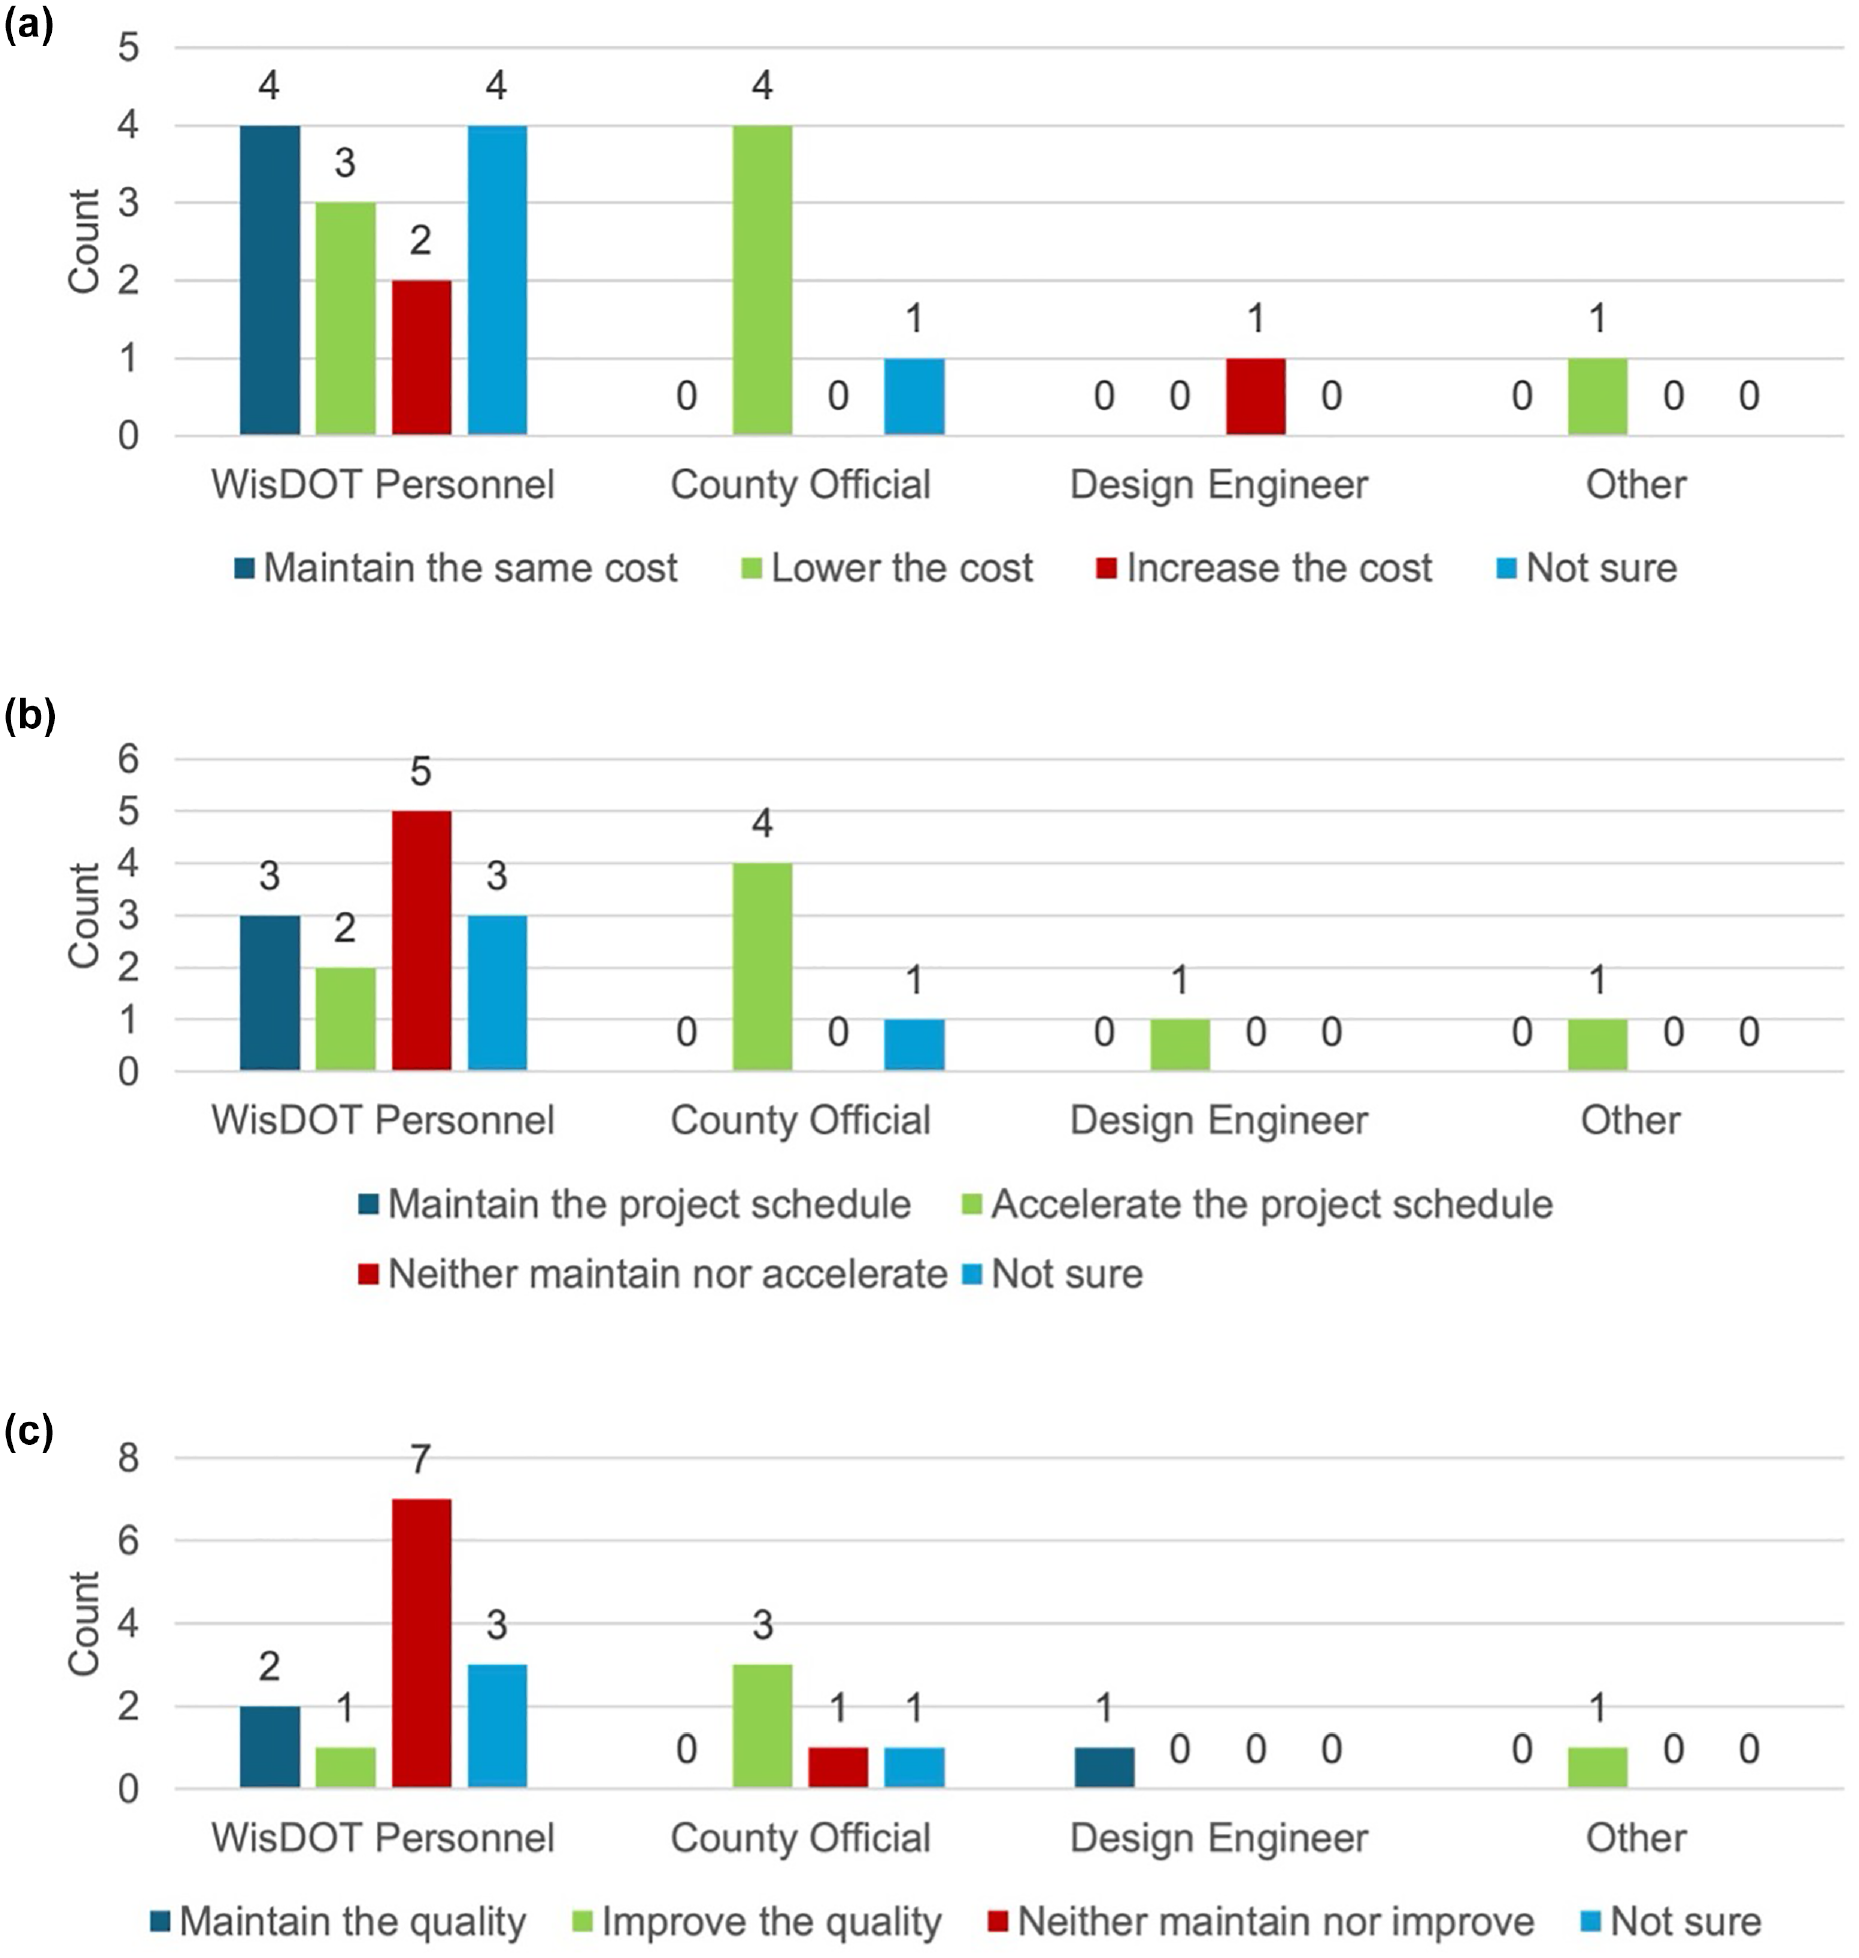
Performance measure of the pilot program by role: (a) budget, (b) schedule, and (c) quality.
In general, the survey results indicated that the low-risk pilot program was considered beneficial and useful by most respondents. All survey findings are summarized into the following categorizes to benefit the state agencies who might implement similar programs.
Impact on cost, project schedule, and quality. Most respondents believed that the pilot program had the potential to keep project costs low. A slight majority of respondents believed that the pilot program had the potential to maintain or reduce the project schedule. There was no consensus on the impact of the program on project quality.
Workload redistribution. A few state DOT personnel had expected that the pilot program would reduce their workload, which in their opinion was not realized. The stated goals of the pilot program were focused on cost (including project, design, delivery, and oversight costs), project time, and project quality. Redistribution of the workload to local governments might be viewed as an expected benefit but it was not a primary goal of the pilot program.
Perception gaps. State DOT and local government personnel viewed the pilot program with differing expectations. Communication issues and issues around project understanding were noted among the two groups. There is a clear need to provide training to address and clarify the goals of the program and the ways to successfully achieve them. Each stakeholder’s tasks and responsibilities should be clearly understood by all parties.
Lack of clarity and consistent expectations of the pilot program. For low-risk bridge projects, some state DOT personnel might not be fully aware of the reduced project requirements, whereas some local government personnel might not be familiar with all the requirements and steps required for successful implementation. Different training programs are needed for both state DOT and local government personnel. This training should clarify the goals and requirements of the low-risk pilot program and delineate the responsibilities and expectations for all sides.
Disparity in experience and technical knowledge of project requirements. Inconsistent technical capabilities and knowledge of the project requirements among local governments create large disparities in program delivery. Some local governments have experienced having personnel available whereas others may not have the in-house staff to address all technical and managerial aspects. A continuation or expansion of the low-risk bridge program should be designed to ensure that the local governments interested in participating in the program receive sufficient training to manage such a program. An appropriate training program should be made available to local governments that are interested in low-risk bridge projects. The local governments should be required to demonstrate that they have staff with the required knowledge of the project requirements and sufficient capability in the management of such projects. In case such qualifications are not established in advance, one option may be for the local government agency to submit the project to the low-risk program after completing the preliminary (30%) plans on its own to demonstrate its capabilities.
The results from the qualitative survey reinforced the conclusions obtained through the quantitative approach. This convergence in findings highlights the consistency and reliability of the evaluation process. By combining both approaches, valuable insights and experiences can be garnered, providing valuable guidance for other states undertaking similar program evaluation work.
Conclusion and Recommendations
This paper presents a comprehensive evaluation of the WisDOT low-risk bridge pilot program, which delegates specific tasks and responsibilities to local governments to progress project delivery. The evaluation utilized both quantitative and qualitative methods. The quantitative methods involved a statistical comparison between group average values for the pilot and control projects as well as assessments of a set of performance metrics developed by the state DOT. The qualitative methods were the online survey and follow-up phone interviews.
The survey results supported the insights obtained from the data analysis, indicating that most respondents believed the pilot program could maintain or reduce project costs, which aligned with the data analysis showing better budget performance for pilot projects. Similarly, the survey showed that a slight majority believed the program could maintain or reduce project time, consistent with the data analysis showing improved project schedule performance, except for Schedule #3 (construction finals). However, the impact on project quality lacked consensus in the survey, with mixed results from the quantitative methods.
To ensure the success of the pilot program, the research team recommends tailored training programs for both state DOT and local government staff. The training should focus on clarifying program goals, stakeholder responsibilities, reduced oversight requirements, and minimum technical qualifications for local government staff participating in the program. Based on the data analysis, modifications to state DOT’s performance measures, particularly the quality performance metrics, are suggested. Determining the thresholds for successful state DOT performance measures is identified as a potential future research topic.
In conclusion, the combined quantitative and qualitative approach underscores the robustness and consistency of the evaluation process. The insights gained and experiences shared provide valuable guidance for other states engaged in similar program evaluations. This integrated approach enhances overall program effectiveness, facilitating informed decision making and promoting a comprehensive understanding of project delivery progress.
Footnotes
Acknowledgements
The authors would like to express their sincere gratitude to Wisconsin Department of Transportation for their valuable contributions and support during the research. Their insights, guidance, and assistance were instrumental in the completion of this study.The authors additionally acknowledge Wisconsin Department of Transportation for the financial support that made this research possible.
Author Contributions
The authors confirm contribution to the paper as follows: study conception and design: Z. He, H. Tabatabai, X. Qin; data collection: Z. He; analysis and interpretation of results: Z. He, H. Tabatabai, X. Qin; draft manuscript preparation: Z. He, H. Tabatabai, X. Qin. All authors reviewed the results and approved the final version of the manuscript.
Declaration of Conflicting Interests
The authors declared no potential conflicts of interest with respect to the research, authorship, and/or publication of this article.
Funding
The authors disclosed receipt of the following financial support for the research, authorship, and/or publication of this article: This research was funded by the Wisconsin Department of Transportation and the Federal Highway Administration under Project 0092-21-63.