
Abstract
This study investigates the variations in performance among mixtures that are designed for use with the same traffic classification and whether a single mixture class index–volumetrics relationship (IVR) can be applied to all mixtures within that classification. Three surface mixtures, which are intended to serve traffic levels of 3–30 million equivalent single axle loads, were sourced from different regions in North Carolina: the coast; Piedmont; and the mountains. Dynamic modulus, cyclic fatigue, and stress sweep rutting tests were conducted using the asphalt mixture performance tester. Pavement performance simulations were performed using AASHTOWare Pavement ME Design for fatigue cracking predictions and FlexPAVE™ for permanent deformation predictions. The findings indicate substantial differences in mechanical properties, performance indices, and pavement performance among the mixtures despite having similar volumetric properties. The study also shows that an IVR calibrated for a mixture cannot be used to predict the performance of other mixtures within the same mixture classification as the tested mixture. This research highlights the need for restructuring the mixture classification system so that it is based on mixture performance rather than on volumetric design, with the ultimate goal being a performance-based or related specification to eliminate the limitations introduced by the use of volumetric properties.
Keywords
State highway agencies (SHAs) and industry continually implement new technologies, test methods, and specifications to improve performance. Several SHAs have begun the process of implementing a cracking test in conjunction with a rutting test in a balanced mix design (BMD) approach. Although there are four potential approaches to implementing a BMD procedure, most states follow Approach A, in which each mix design must meet both the volumetric requirements plus the performance test criteria ( 1 ).
Specimen preparation and testing time have limited the frequency of testing needed for acceptance testing. As a result, most SHAs that currently require performance tests as part of their mix design procedures have not used them for acceptance and those that do are not using them for payment determination ( 2 ). In addition to the testing requirements, many of the methods currently used by SHAs cannot be directly integrated into performance prediction models to estimate the long-term performance of the associated pavements.
To address these shortcomings and to provide a total quality assurance (QA) system that integrates mix design with performance prediction, construction, acceptance, and payment, a performance-related specification (PRS) concept for design and construction of both concrete and asphalt pavements has been pursued since the early 1990s ( 3 , 4 ). The concept of PRS is to measure key material and construction quality characteristics that relate to performance and use the relationships between them to predict performance during both design and construction ( 5 ). According to this concept, acceptance and payment are then based on the difference between as-designed and as-built performance predictions.
One PRS approach integrates the asphalt mixture performance tester (AMPT) and its associated test methods. However, the use of AMPT results for QA testing poses practical problems that are difficult to overcome. For example, the time required to fabricate performance test specimens and conduct all the performance tests is too long for the test results to be used efficiently in typical QA processes. In addition, any adjustments to the mixture during blending should be based on acceptance quality characteristics (AQCs) that can be changed easily. Because of these limitations, the PRS framework should preferably employ AQCs that are commonly used in most SHAs’ QA processes for asphalt pavements (e.g., volumetric properties, in-place density, etc.) ( 6 ).
To leverage these AQCs for PRS (or other) purposes, researchers have recently proposed the development of a performance–volumetrics relationship and an associated index–volumetrics relationship (IVR) ( 7 , 8 ). The idea of these relationships is to pre-calibrate the performance/index property variations as a function of AQCs. For the IVR, two material indices (Sapp for cracking and the Rutting Strain Index [RSI] for permanent deformation) are predicted based on the measurable volumetric properties of asphalt mixtures ( 7 ). The IVR can be developed by conducting performance testing at four different volumetric conditions (referred to as four corners) at the project initiation phase. The IVR can then be used to predict the as-constructed performance indices using the traditional AQCs measured during production. Using IVR, the QA processes currently used by SHAs do not change substantially. Depending on the SHAs, some of the common mixture properties, that is, the asphalt content (Pb), mixture bulk specific gravity (Gmb), and maximum specific gravity (Gmm), are determined and used to calculate air voids at Ndesign (Va), voids in mineral aggregate (VMA), and voids filled with asphalt (VFA). The measured properties (Pb, Va, VMA) of mixtures obtained from the plant along with in-place density values (percent of Gmm) from the roadway are input into the IVR to predict the index values. The difference between as-built performance indices and as-designed performance indices can be used to inform acceptance and payment.
A four-step process is required to develop the IVR: (a) collect material properties; (b) determine four corners; (c) measure the volumetric properties and generate the design volumetric space; and (d) conduct performance tests and calibrate the IVR function. The general form of the IVR function is described in Equation 1 through Equation 3. Further details on the development of the four corners and the calibration of the IVR function are provided elsewhere ( 7 , 8 ).


where Index = material index (Sapp for fatigue cracking and RSI for permanent deformation), β0, β1, and β2 = fitting coefficients, ε = residual of the regression, %Gmm = in-place density, Va = design air void content, VMA = voids in mineral aggregate, VFA = voids filled with asphalt, and IP = in place.
Although the IVR can be useful for PRS (or other) purposes, it still requires experimental characterization, which can be time consuming and unfeasible because the exact mixture to be used on any given project may not be known at the time a construction specification is issued. One solution to this problem is to define the material properties of a “typical” mixture for a set or class of mixtures. The material properties of this “typical” mixture would then be used to calibrate the IVR at the project initiation phase. However, this approach can only be followed if the properties of the mixtures within the same classification are reasonably similar.
Objectives
This paper seeks to address the aforementioned issues by meeting the following objectives:
Assess and report the differences in mechanical properties and pavement performance between mixtures that were designed to serve the same traffic classification, and
Investigate whether a single IVR function can be used for all mixtures within the same traffic classification.
Methodology
Overview
Three standard surface mixtures from North Carolina were sampled and tested. These mixtures were subjected to dynamic modulus testing, cyclic fatigue testing, and stress sweep rutting testing. First, the performance of the mixtures was analyzed to identify the differences. Pavement performance simulations were then carried out using standard pavement structure and representative climate data from North Carolina to evaluate the differences in pavement performance resulting from the differences in the mechanical properties of the mixtures. Finally, the applicability of a single IVR function to a class of mixtures is checked. An IVR function calibrated using a fourth reference mixture with the same traffic classification as the three mixtures studied is considered. The volumetric properties of the three mixtures are used within the IVR function to predict the indices. The percent error between the predicted indices and the measured indices from the performance testing is calculated to evaluate the suitability of using a single IVR function for an entire class of mixtures.
Materials and Naming Convention
The asphalt mixtures used in this study include standard surface mixtures from North Carolina, designated according to North Carolina Department of Transport (DOT) specifications as RS9.5C mixes, in which R stands for recycled, S for Surface, 9.5 for the nominal maximum aggregate size (NMAS), and C for the traffic level. These mixtures are designed with an NMAS of 9.5 mm, with the design number of gyrations being 65, and are meant to serve a traffic level of 3–30 million equivalent single axle loads (ESALs). The required binder performance grade is 64-22, the minimum VMA design requirement is 15.5%, and the acceptable range for VFA is 65–78. North Carolina’s climate is generally segregated into three regions: the coast; Piedmont; and the mountains. For this reason, one mixture from each region was included. Thus, the three RS9.5C mixtures are referred to as CO, PI, and MO. Although there are regional differences in climate, the mixture design specifications are applied equally across the regions. In general, the constituent materials are similar across the three regions, but each is dominated by different contractors. Each mixture was sampled into 5-gal buckets by North Carolina DOT personnel and collected as loose mix material to be compacted in the laboratory for testing. All the mixtures were produced by different contractors.
The blended gradation of the three RS9.5C mixtures is shown in Figure 1, which demonstrates that CO is the finest followed by PI and MO. Mixture design information for the three mixtures evaluated is shown in Table 1. CO is distinct from the other two mixtures because of its higher binder content resulting in a higher effective binder content. Table 1 also contains the mixture design information for a reference RS9.5C mixture from the Piedmont region of North Carolina, specifically, Holly Springs, that was tested and evaluated in another study ( 9 ). The available data set for the reference mix will be utilized to check the predictive applicability of the calibrated IVRs in a later section of this paper. It is worth noting that Table 1 shows a fair amount of difference in volumetrics but more importantly in binder content and effective binder content. In addition, the difference in binder source will play a role (even if minor) in performance. Although the mixtures were being used for the same traffic classification and met the requirements set by the SHA, mix properties do indicate differences.
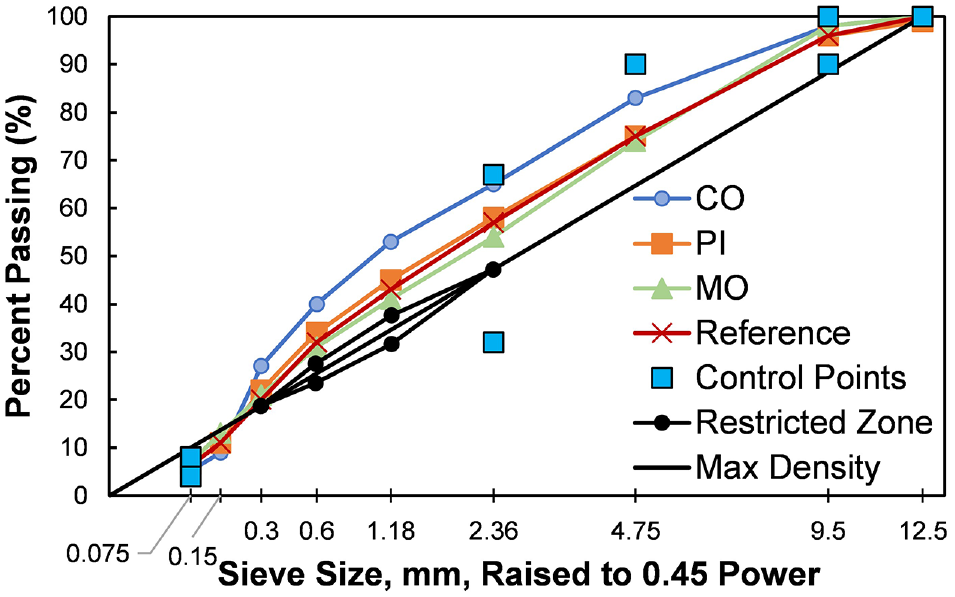
Gradation chart for North Carolina RS9.5C mixtures.
Information on the North Carolina RS9.5C Mixtures as Provided in the Job Mix Formulas Unless Otherwise Noted
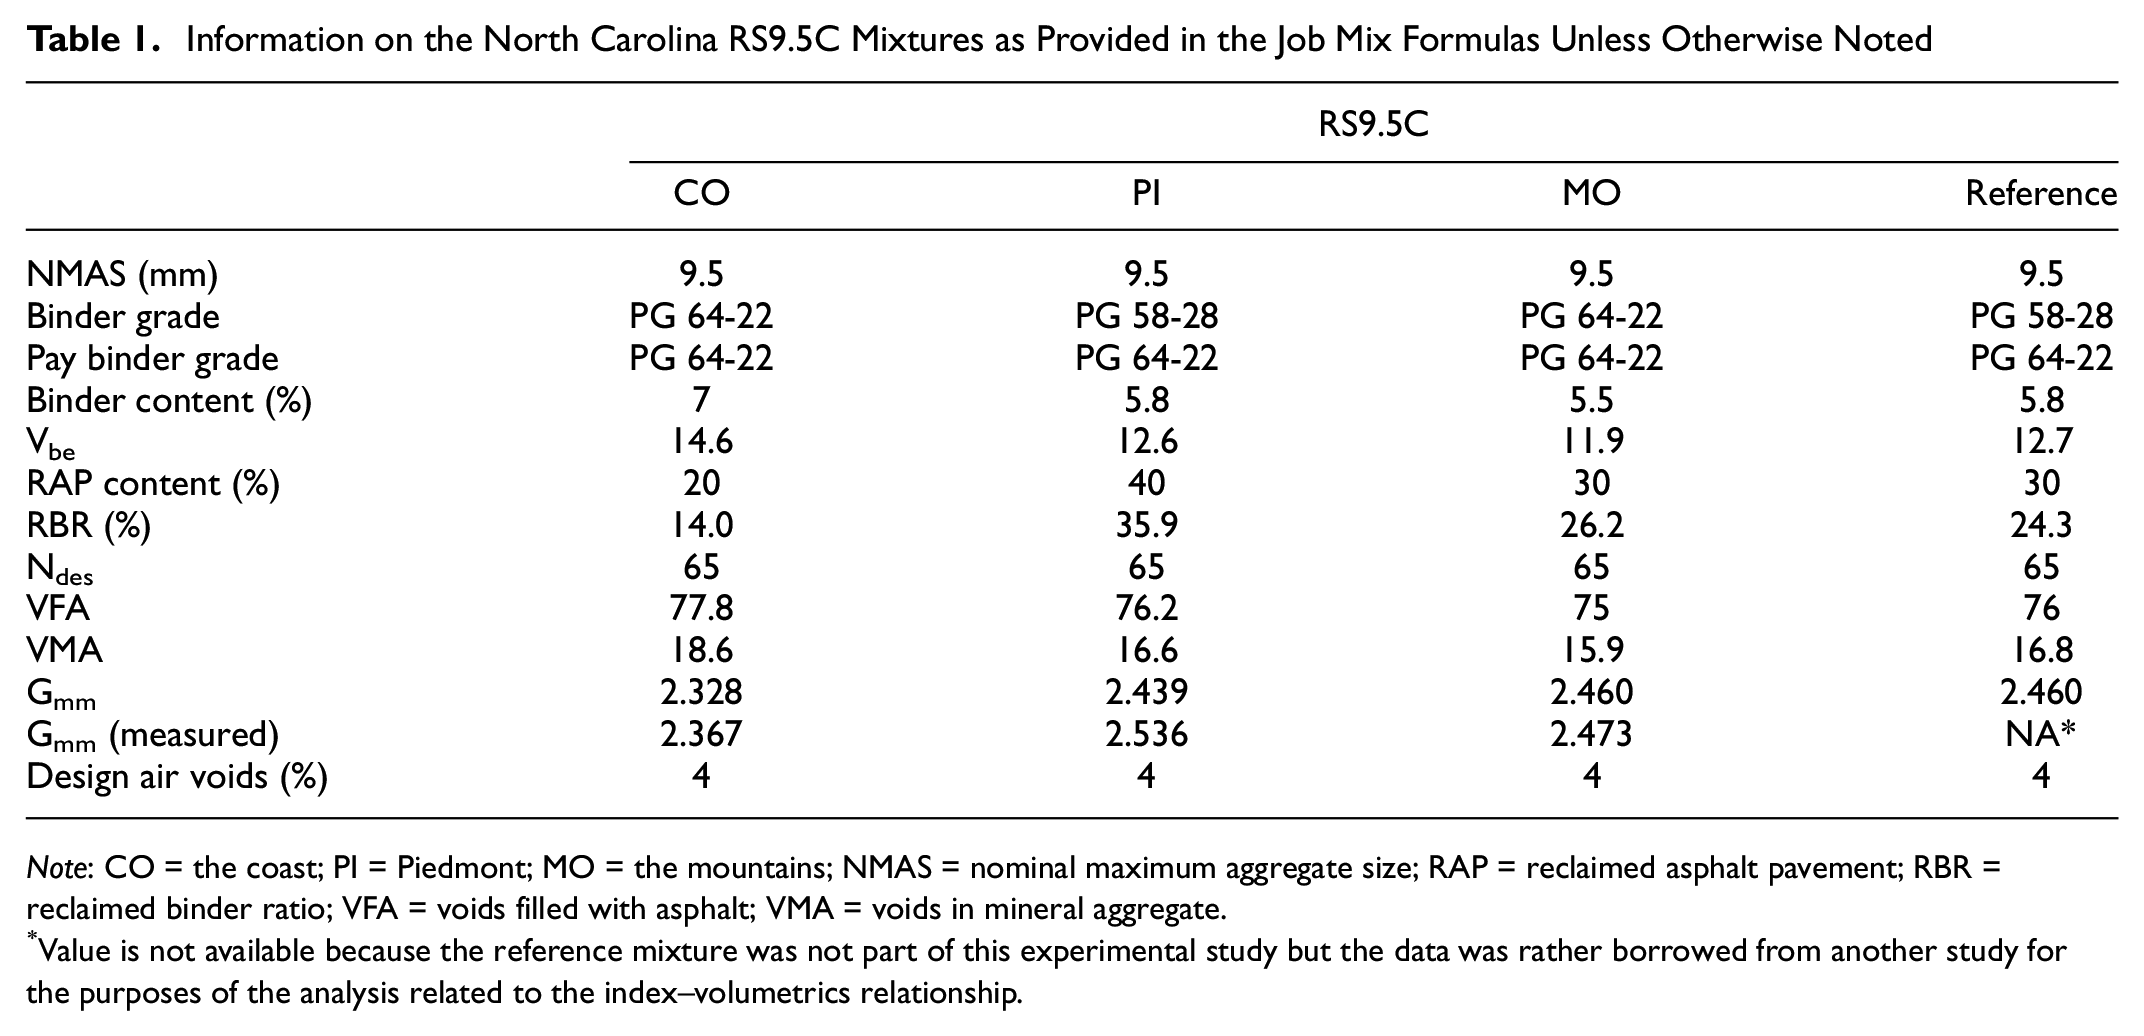
Note: CO = the coast; PI = Piedmont; MO = the mountains; NMAS = nominal maximum aggregate size; RAP = reclaimed asphalt pavement; RBR = reclaimed binder ratio; VFA = voids filled with asphalt; VMA = voids in mineral aggregate.
Value is not available because the reference mixture was not part of this experimental study but the data was rather borrowed from another study for the purposes of the analysis related to the index–volumetrics relationship.
Specimen Fabrication and Test Methods
The mechanical characterization of the mixtures was conducted using the AMPT via dynamic modulus testing (AASHTO TP 132), cyclic fatigue testing (AASHTO T 411), and stress sweep rutting (SSR) testing (AASHTO TP 134). The cyclic fatigue test temperature considered for all mixtures was 18°C. The dynamic modulus tests were conducted on 38 x 110 mm specimens, whereas the SSR test was conducted on 100 x 150 mm specimens. The low SSR test temperatures for CO, PI, and MO were 29°C, 29°C, and 18°C, respectively. The high SSR test temperatures for CO, PI, and MO were 52°C, 51°C, and 49°C, respectively. The data generated from the AMPT were analyzed using FlexMATTM Cracking and Rutting version v2.1.1.
Included in these three test methods are specifications for specimen preparation (AASHTO R 83 and PP 99), determination of theoretical maximum specific gravity (AASHTO T 209), determination of bulk specific gravity (AASHTO T 166), and determination of percent air voids (AASHTO T 269). The target air voids content for all the mixtures was 5% ± 0.5% for all test specimens. This air voids level was selected for testing in an effort to consider the long-term air voids content. This study tested surface mixtures, which typically end up at around 7%–6% air voids after construction. Based on NCHRP 9-9, surface courses will densify under traffic at approximately 1.5%–2%; therefore, 5% was selected to conduct all the testing in this study.
Pavement Performance Simulations
The AMPT allows the simulation of the mixture’s performance within a pavement structure under simulated traffic and climate conditions. Correspondingly, pavement performance predictions were carried out using AASHTOWare Pavement ME Design v2.6.2.2 and FlexPAVE™ v2.1.6.
The Pavement ME software was selected for bottom-up fatigue cracking simulations because it was locally calibrated for North Carolina mixtures through research efforts under the FHWA\NC\2007-07 project ( 10 ). Furthermore, material-level inputs for Pavement ME can be obtained from dynamic modulus and cyclic fatigue test results. Rutting simulations were carried out using FlexPAVE™ because the SSR test generates the material-level inputs for rutting performance predictions in FlexPAVE™ but cannot be used to simulate rutting performance in Pavement ME.
The simplified viscoelastic continuum damage (S-VECD) model parameters were used to generate the fatigue cracking material-specific parameters (K1, K2, K3) shown in Equation 4 following the approach used in the FHWA\NC\2007-07 project ( 10 ) but adjusting for the more recent fatigue failure definition specified in AASHTO TP 133 (2022). The material factors used to characterize the Pavement ME fatigue model for each evaluated mixture were derived from the cyclic fatigue test results for the respective mixtures, as shown in Table 2. The North Carolina local field calibration coefficients recommended by the FHWA\NC\2007-07 project and shown in Table 3, were also used for Pavement ME performance predictions. C1 and C2 in this table are the local transfer function coefficients.


where Nf = the allowable number of axle load applications, ε t = tensile strain at critical locations and calculated by the structural response model (in/in), |E*| = dynamic modulus of the asphalt concrete (AC) layer (psi), K1, K2, K3 = mix model coefficients derived in the laboratory, βf1, βf2, βf3 = local mixture calibration factors, Vbe = effective asphalt content by volume (percent), and Va = air voids in the AC mixture (percent).
AC Fatigue Model Coefficients Utilized for Pavement ME Simulations
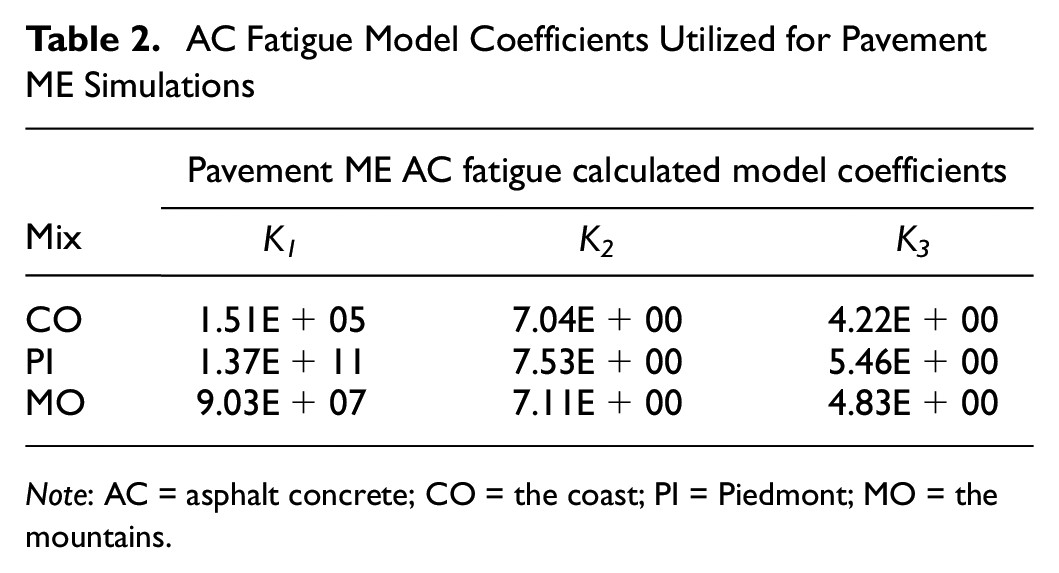
Note: AC = asphalt concrete; CO = the coast; PI = Piedmont; MO = the mountains.
Recommended Local Calibration Factors for North Carolina Mixtures ( 10 )
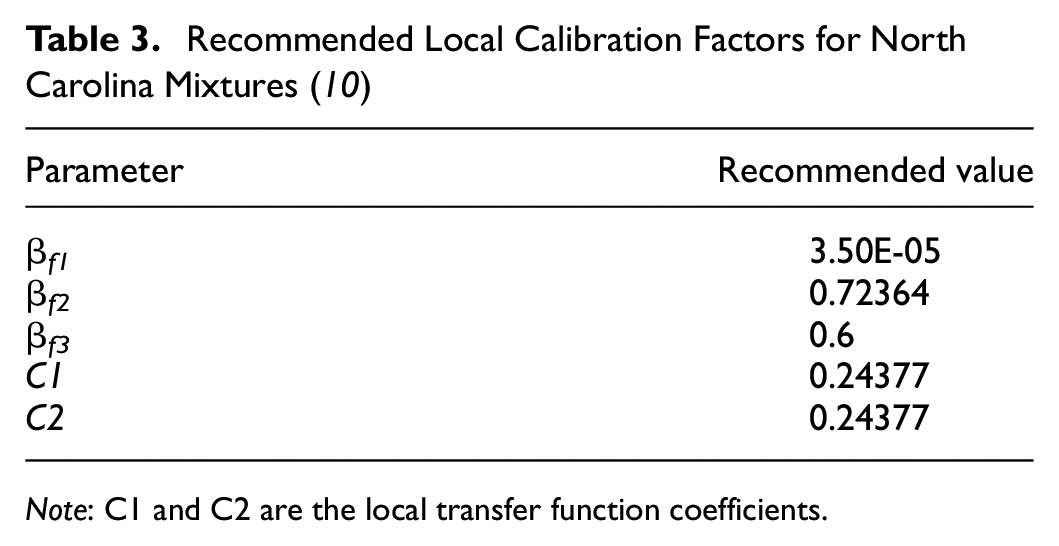
Note: C1 and C2 are the local transfer function coefficients.
The selected traffic level for all the simulations in both Pavement ME and FlexPAVE™ was 30 million ESALs over 20 years, because all the mixtures evaluated were RS9.5C mixtures, which are specified for roads with 3–30 million ESALs according to the North Carolina DOT specification. Two pavement structures composed of an asphalt layer, an aggregate base layer, and a subgrade were used for pavement performance prediction, and these were called “thick” and “thin” depending on the AC layer thickness. Figure 2 presents the two structures for the simulations along with the thickness and Poisson’s ratio of all layers and elastic moduli of unbound layers. The simulations were performed using the mechanical properties of the three study mixtures (i.e., CO, PI, and MO). Climate data for North Carolina obtained from the MERRA climate station 139553 in Piedmont to represent the Piedmont region were utilized for all the pavement simulations.
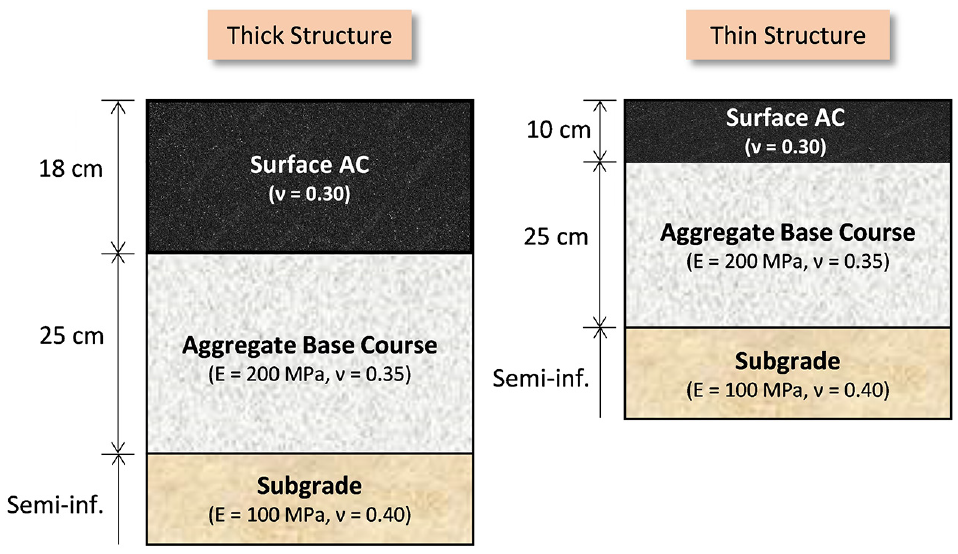
Utilized pavement structures for Pavement ME and FlexPAVETM simulations.
Results and Discussion
Dynamic Modulus Test Results
The dynamic modulus test results for each of the three primary mixtures are shown in Figure 3 and Figure 4. The phase angle results from the dynamic modulus testing are shown in Figure 5. Overall, the modulus of MO is on average higher than PI and CO, and PI looks to have the higher phase angle value of the three mixtures. MO has a coarser gradation than the other mixtures and has the lowest effective binder content, which explains why this mixture has the higher modulus value. The phase angle values follow in that PI has a higher binder content and higher effective binder content. Even though CO has the highest effective binder content, PI has the higher reclaimed asphalt pavement (RAP) percent by 20%. A statistical analysis of the modulus and phase angle values at each temperature–frequency combination showed that the three mixtures are statistically different from each other at 4°C and 20°C. At 40°C, no statistical differences are observed between the modulus values of MO and CO. Nevertheless, the modulus value of PI showed a statistically significant difference compared with the other two mixtures. The statistical analysis was conducted at a 0.05 significance level.
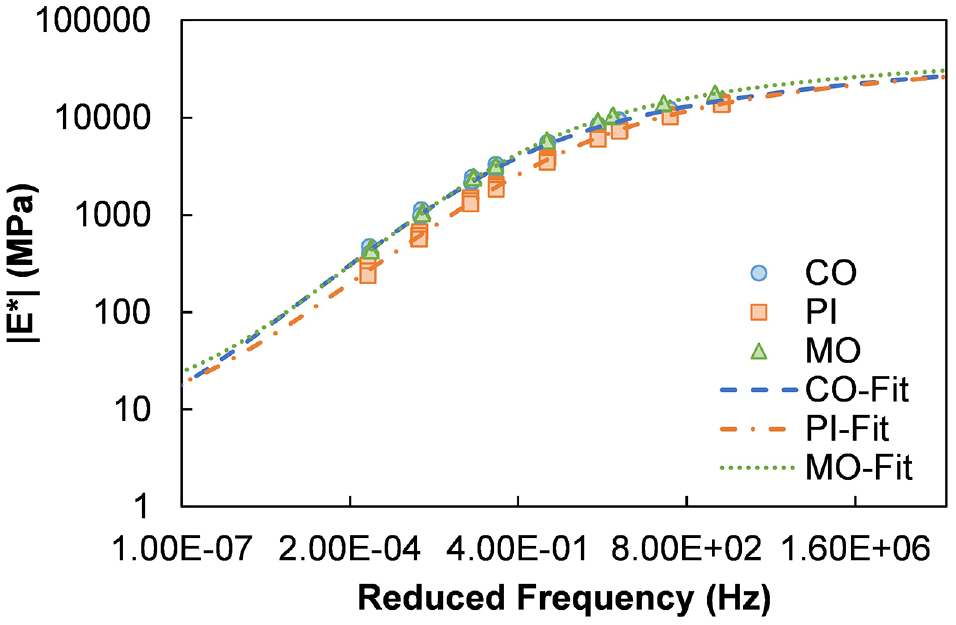
Dynamic modulus test results (log–log plot) for RS9.5C.
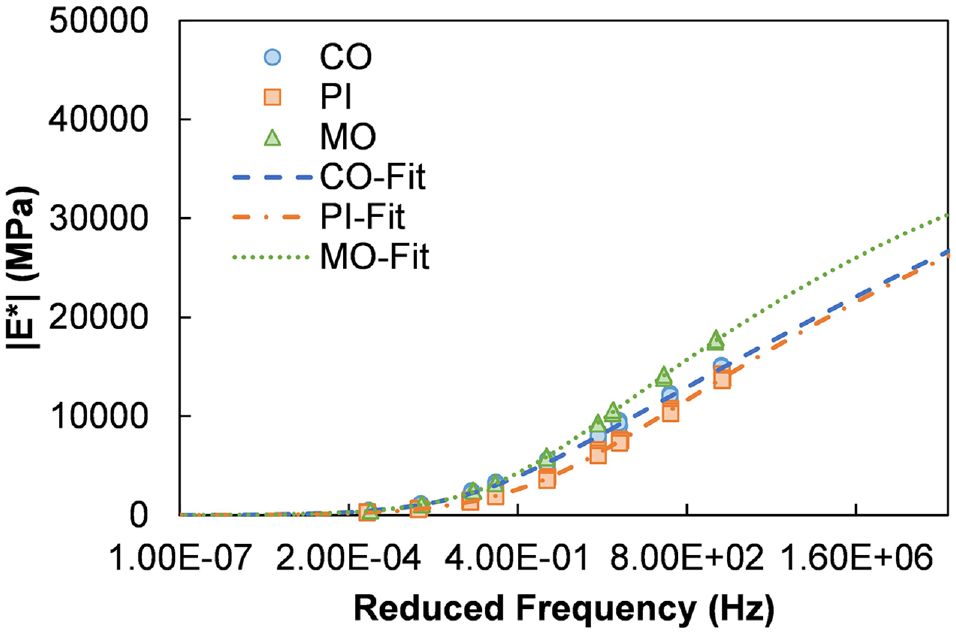
Dynamic modulus test results (semi-log plots) for RS9.5C.
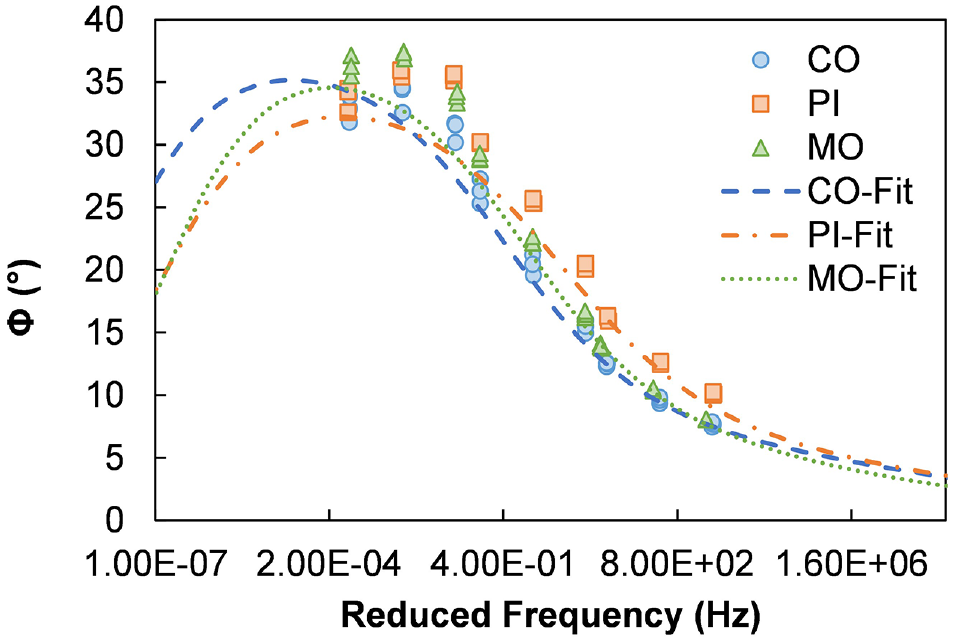
Phase angle test results for RS9.5C.
Cyclic Fatigue Test Results
The primary outcome of the S-VECD model is the damage characteristics curve (C versus S). The curve establishes the relationship between the damage developed within a specimen, S, to C, which is pseudo stiffness. The importance of C is that it quantifies the relationship between stress, σ, and pseudo strain, εR, and starts from 1. A C of 1 represents the intact state of the material that will reduce as a result of fatigue loading. The mechanical responses of any asphalt material under different loading histories can be predicted once the C versus S relationship for that material is developed ( 11 ). As shown in Equation 6, the pseudo stiffness (C) and damage (S) are fitted to analytical forms for obtaining the damage characteristic curves for each mixture that can then be used for predicting fatigue performance ( 11 ).

Sapp, the cyclic fatigue index parameter, has the ability to consider both modulus and toughness in its calculation, these being the two primary factors that describe a pavement’s ability to absorb energy without fracturing ( 9 ). Sapp was developed for situations in which engineers do not need detailed structural analysis to make effective decisions and, instead, merely require an index parameter that relates to the fatigue characteristics of the asphalt mixtures. Sapp can be calculated as shown in Equation 7, and the complete derivation alongside the recommended Sapp range values for different traffic thresholds can be found in Wang et al. ( 9 ).

The cyclic fatigue test data resulting in damage characteristic curves for RS9.5C mixtures are shown in Figures 6 and 7. The damage characteristic curve is a functional relationship between the specimen’s integrity (pseudo stiffness, C) and the amount of damage, S, in the specimen. Figure 6 shows the damage characteristic curves for individual specimens, whereas Figure 7 shows the fitted damage characteristic curves for each mixture. Generally, the damage characteristic curves of higher modulus mixtures tend to be higher than those of other mixtures; however, this outcome does not imply better or worse performance. However, for a given S value, a higher modulus material exhibits a higher C value (higher integrity) and, therefore, the higher modulus material might actually be more brittle and, thus, more prone to damage (i.e., the damage evolution is faster). This phenomenon can be reflected by a higher C value at failure, indicating that the material becomes less tolerant to damage compared with lower modulus materials. In this case, MO has the highest C value throughout and the shortest damage curve. It is also noteworthy that MO had the highest modulus value among the three mixtures.
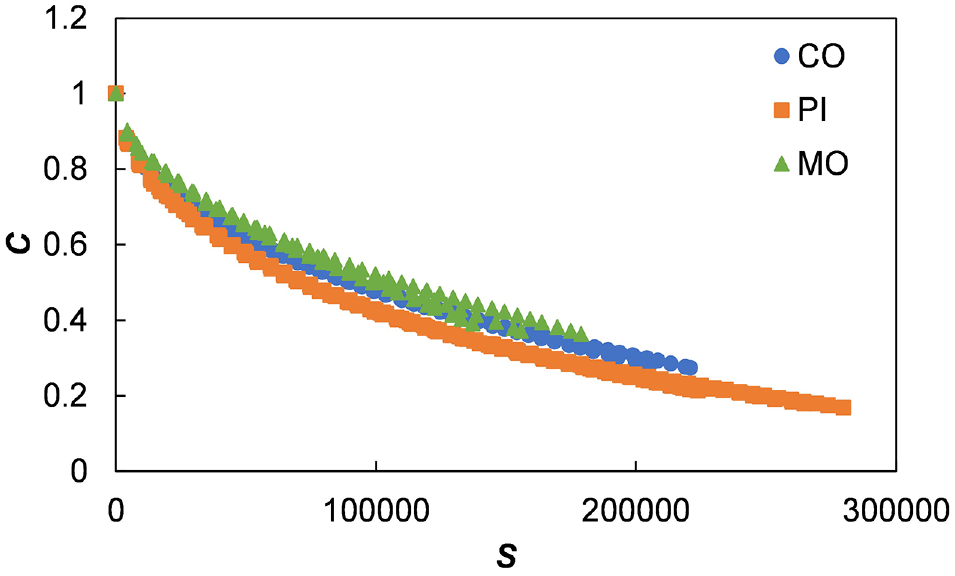
C versus S damage curves (individual specimen values) for RS9.5C.
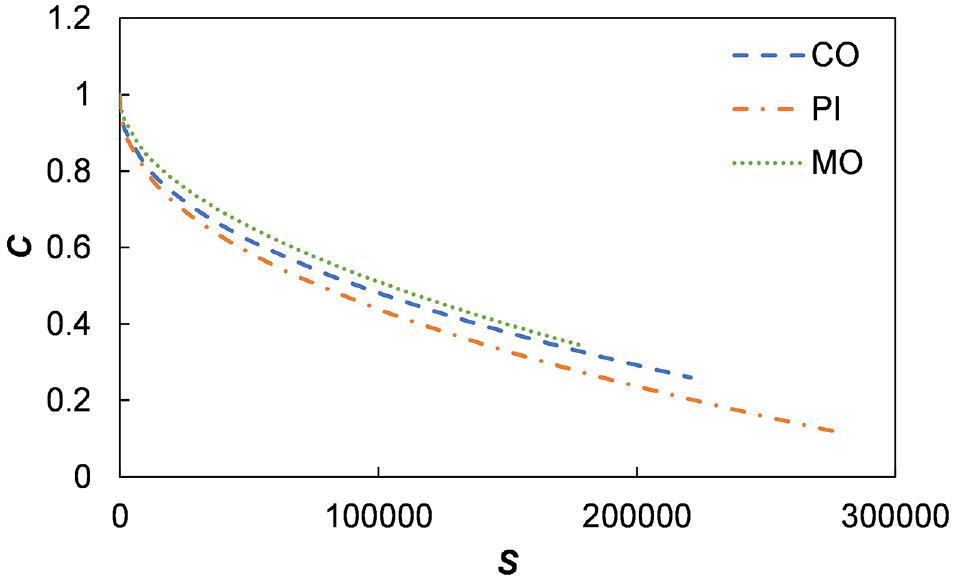
C versus S damage curves (fitted values) for RS9.5C.
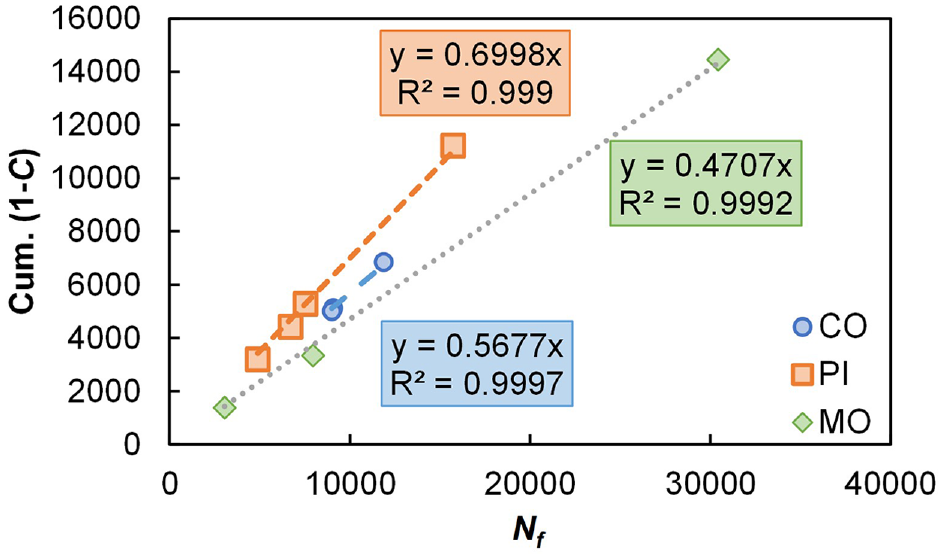
D R, the quantitative failure criterion, is the average reduction in pseudo stiffness up to failure. The derivation of this criterion can be found in Wang and Kim ( 11 ), and is defined as the slope of cumulative (1-C) and the number of cycles to failure, Nf. DR can be calculated using Equation 8.

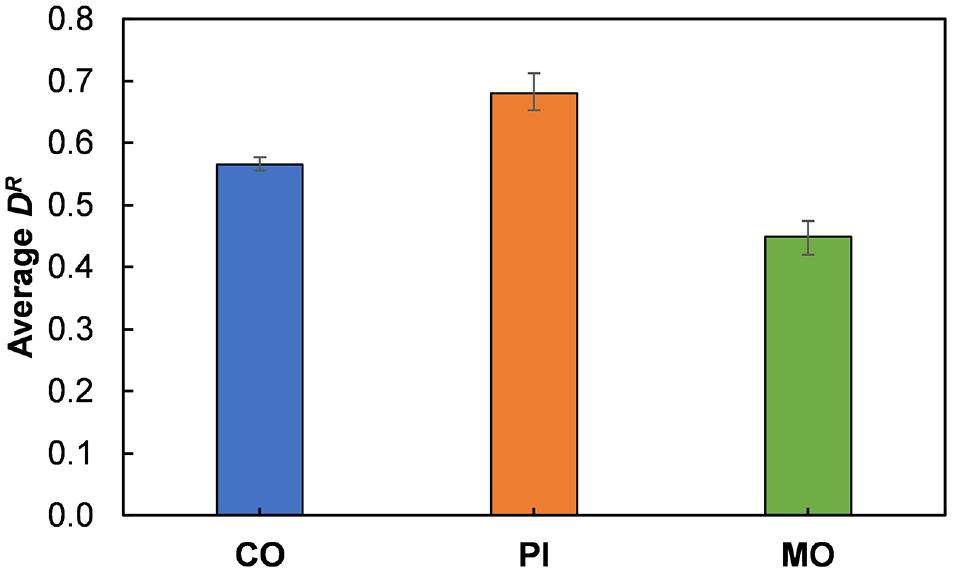
The DR value indicates the material’s diminishing fatigue resistance ( 11 ). The DR failure criterion is the slope of the relationship passing through zero between the average reduction in pseudo stiffness and the number of cycles to failure. Figure 8 shows the individual data points that form the relationship that defines DR. The average DR values from each data point are shown in Figure 9. A higher DR value generally indicates better fatigue resistance compared with a lower DR value. The trend of DR shows that MO is the worst performing, followed by CO and finally PI. A statistical analysis of the DR values shows significant differences among all three mixtures at a 0.05 significance level.
Cumulative (1-C) versus Nf for RS9.5C.
Average DR values for RS9.5C.
However, the performance of the mixture cannot be evaluated solely based on the position of the damage characteristic curves or DR values because both the modulus and inherent fatigue resistance play a role in determining the mixture’s fatigue performance within a pavement. If two mixtures have the same fatigue resistance, but one has higher modulus than the other, the higher modulus mixture will have a longer fatigue life as a result of a lower strain under the same load. Similarly, a more fatigue-resistant mixture will have a longer fatigue life than another mixture of similar modulus but less fatigue resistance. Sapp is an index parameter that was developed to account for these two factors (modulus and fatigue resistance) that affect the cracking potential of a mixture and is based on viscoelastic continuum damage theory ( 9 ). A higher Sapp value generally indicates better fatigue resistance than a lower Sapp value. The Sapp values (calculated at 18°C) are shown in Figure 10. PI has the highest Sapp value followed by CO and then MO. A statistical analysis of the Sapp values shows significant differences among all three mixtures at a 0.05 significance level. The Sapp values shown below make sense because of MO having the lowest effective binder content and coarsest gradation. In this case, the higher modulus mixture translates to a lower Sapp value. As discussed before, PI has a lower dynamic modulus value with a softer binder than the other two mixtures, therefore resulting in better fatigue performance.
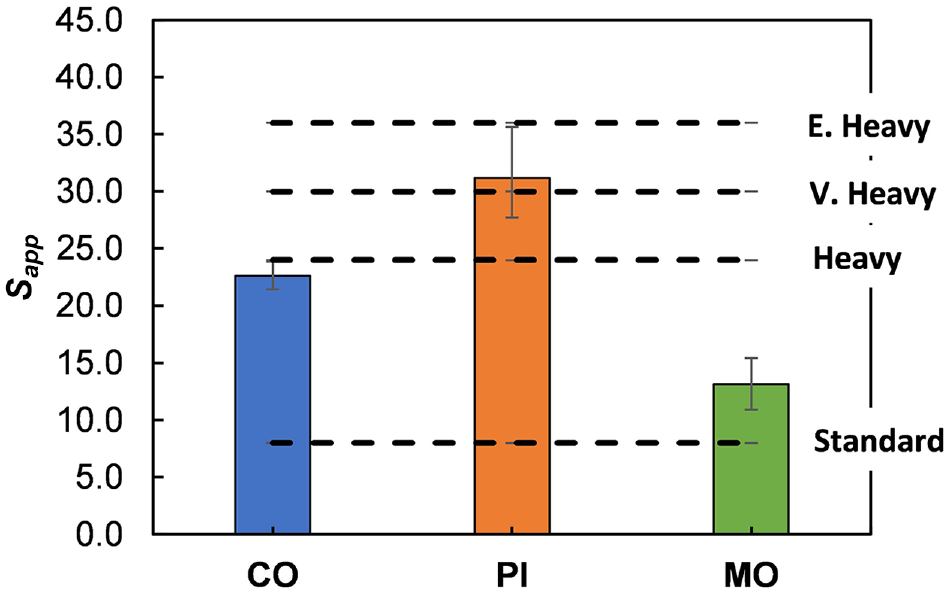
Representative Sapp values for RS9.5C.
SSR Test Results
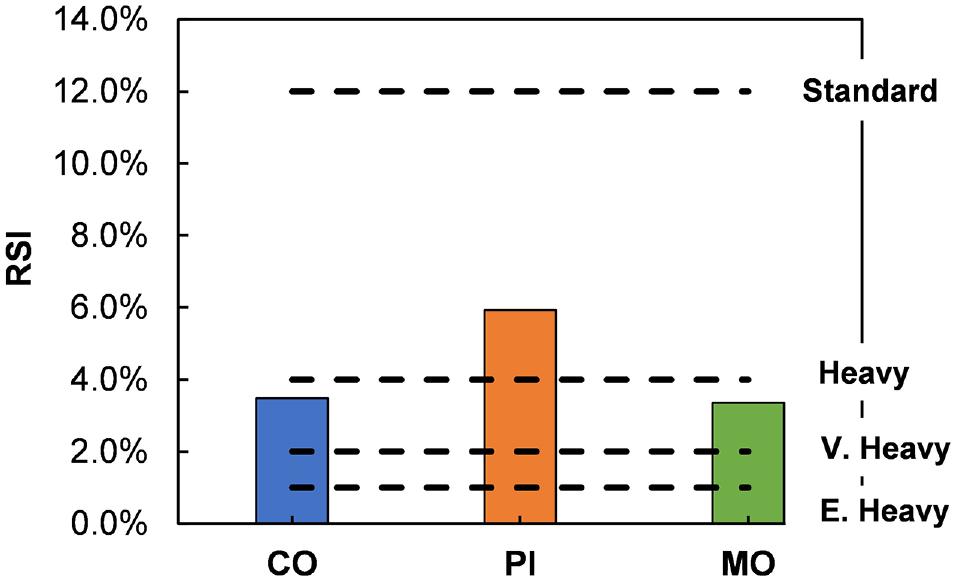
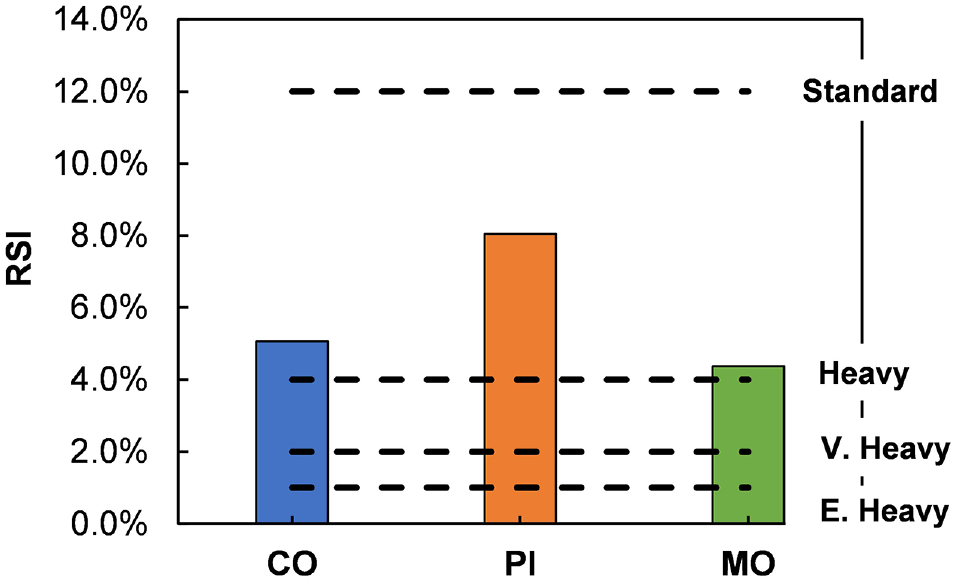
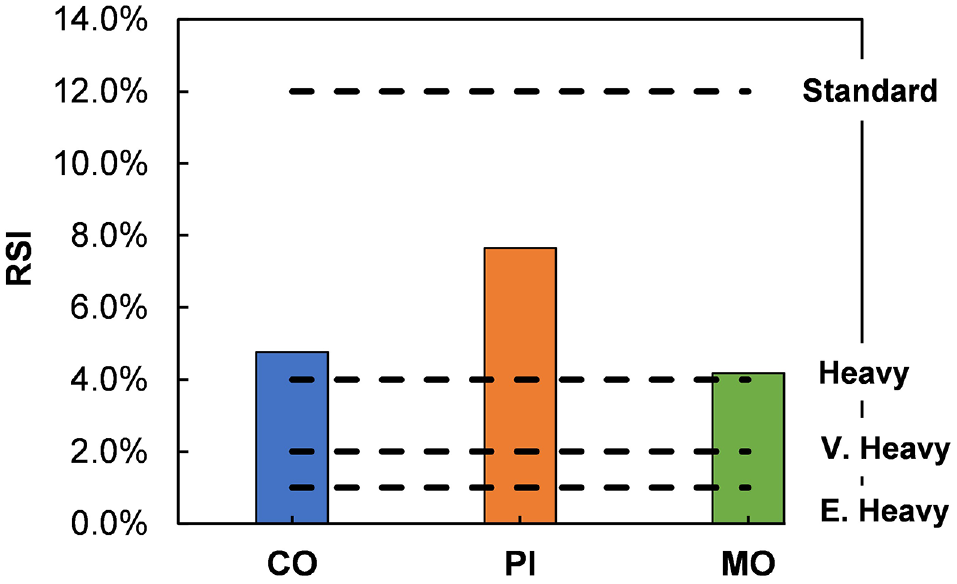
The RSI values for the three RS9.5C mixtures are shown in Figures 11, 12, and 13 and are calculated using the climatic conditions of Wilmington (the coast), North Carolina, Wake Forest (Piedmont), North Carolina, and Asheville (the mountains), North Carolina, respectively. The RSI is the average permanent strain (in percent) and is defined as the ratio of the permanent deformation in an asphalt layer to the thickness of that layer at the end of a 20-year period, over which 30 million 18-kip ESAL repetitions are applied to a standard structure ( 12 ). A mixture with a lower RSI value has more rutting resistance than a mixture with a higher RSI value. Each of the mixtures is from a specific region, therefore the RSI values for three different locations are shown. MO has the best rutting performance of all locations, followed by CO and PI. MO has the lowest effective binder content and the coarsest gradation resulting in this performance. Regardless of the location, a statistical analysis of the RSI values shows significant differences among all three mixtures at a significance level of 0.05.
RSI values (Wilmington, North Carolina) for RS9.5C.
RSI values (Wake Forest, North Carolina) for RS9.5C.
RSI values (Asheville, North Carolina) for RS9.5C.
Traffic Designation Based on Mixture Performance
It is interesting to note from Figures 10 to 13 that for Sapp, PI is classified as “very heavy,” and CO and MO are classified as “standard.” For the RSI, each mixture is classified as “standard” using their location-specific climatic conditions, but they are classified as “heavy” for the other two locations. Therefore, the traffic designation for all three mixtures falls under “standard.” For CO, depending on location, the designation could be controlled by fatigue performance and the same goes for MO. According to the North Carolina DOT Asphalt QMS Manual, these mixtures are classified to handle 3–30 million ESALs. According to the Sapp thresholds defined in the literature ( 9 ), this shows that these mixtures could be classified as “standard” or “heavy.” For Sapp, PI overperforms with a classification of “very heavy.” For RSI thresholds as defined in the literature ( 12 ), all three mixtures meet the category for which they were designed.
Pavement Performance Simulations
As explained in the methodology section, the pavement performance predictions for the mixtures evaluated were generated using the AASHTOWare Pavement ME Design v2.6.2.2 and FlexPAVE™ v2.1.6. The Pavement ME software was selected for bottom-up fatigue cracking simulations because it was locally calibrated for North Carolina mixtures. FlexPAVE™ was used for the asphalt rutting simulations. Specific material factors (K factors), which are needed to characterize the Pavement ME fatigue model for each mixture evaluated, were derived from the respective mixture cyclic fatigue test results and were used in the Pavement ME simulations.
Figure 14 shows the bottom-up cracking results at 90% reliability for both thin and thick sections. CO was the worst-performing mixture, followed by MO. PI was the best-performing mixture with a bottom-up cracking percent that did not exceed 18% and 10% for thin and thick sections, respectively. Increasing the section thickness for MO substantially reduced the bottom-up cracking percent from 61% to 25%. However, this was not the case for CO. The lower decrease in percent damage as a result of increasing thickness may be attributed to MO having a coarser gradation than the other mixtures and having higher moduli values that translate into a better-performing mixture when placed in a thicker pavement section.
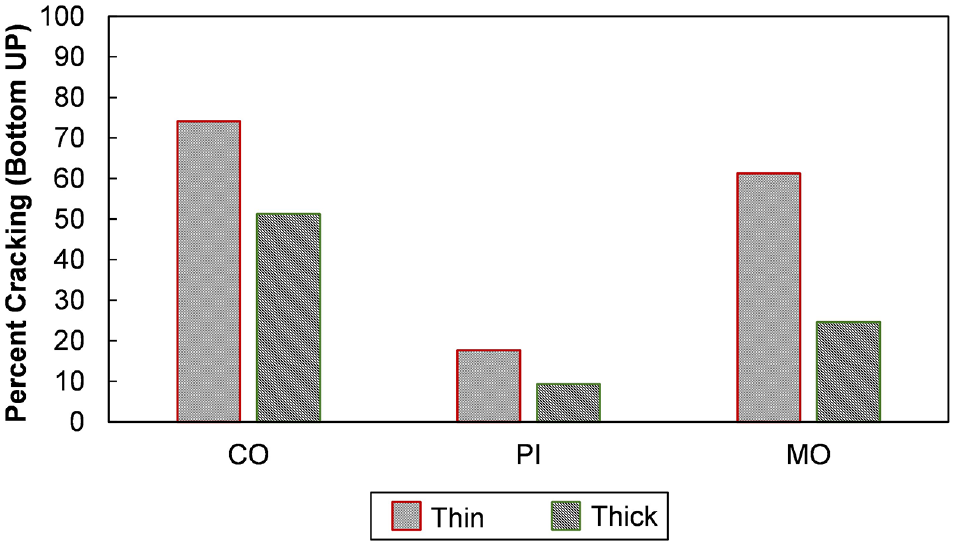
Bottom-up fatigue cracking pavement performance of the simulated thin and thick pavement sections.
Figure 15 shows the asphalt rutting experienced by the thin and thick pavement sections. PI had the highest rut depth values for thin and thick sections. This may be because the PI mixture had higher modulus values than the other mixtures. The CO and the MO mixtures had almost identical rutting performances for thin and thick sections. It is worth mentioning that the mixture rutting performance results (RSI) and the pavement rutting performance results ranked the mixtures similarly.
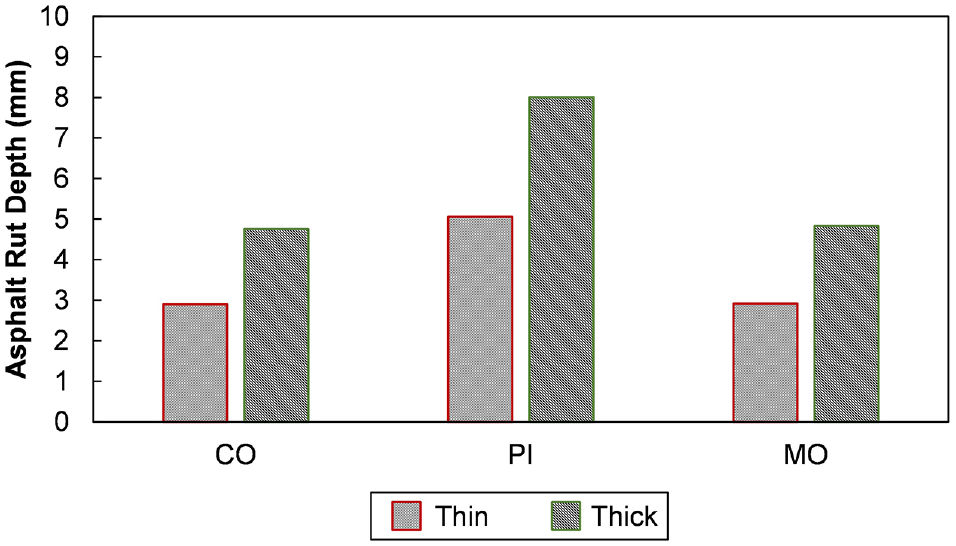
Asphalt rutting pavement performance of the simulated thin and thick pavement sections.
Figures 16 and 17 show the overall pavement performance results for thin and thick pavements, respectively. The figures emphasize the importance of applying the BMD and establishing the links between the mix design and the pavement design. Considering the standard terminal limits for cracking and rutting of 25% and 6.35 mm from Pavement ME, a mixture such as PI, when placed in a thin section (101 mm), would have failed in rutting at the end of 20 years of design life, but about one-third of its cracking capacity would be left unused. In addition, a mixture such as MO, with low effective binder content, coarse gradation, and a high modulus value, showed excellent performance and was more balanced when placed in a thick pavement section. This analysis demonstrated that relying only on mixture volumetrics will not provide an accurate or even close representation of both mixture and pavement performance.
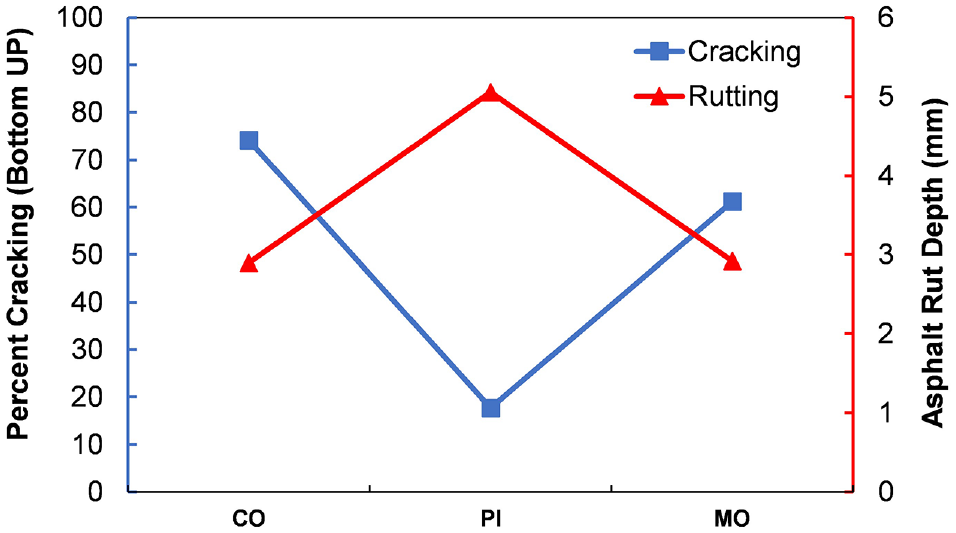
Overall pavement performance of the simulated thin pavement sections.
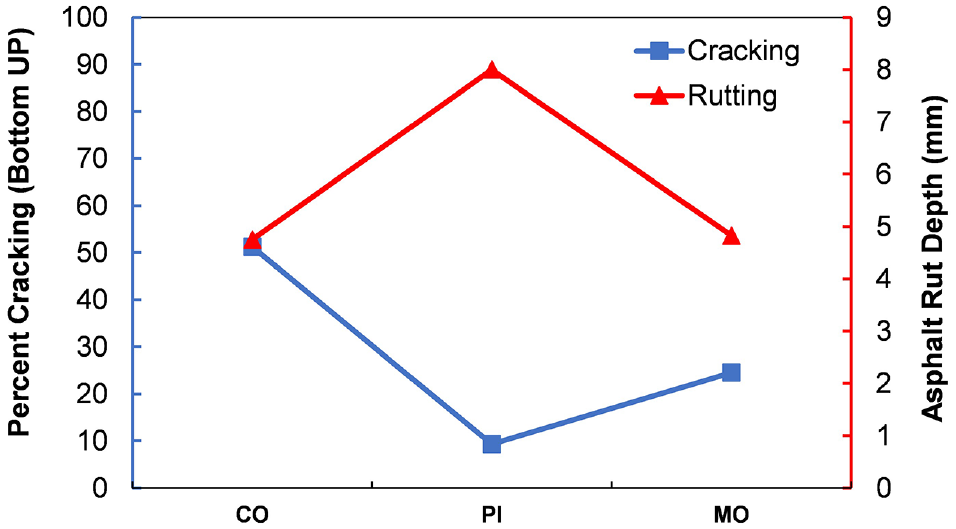
Overall pavement performance of the simulated thick pavement sections.
IVR Validation
Even though performance indices and mechanical properties were compared to examine differences between mixtures of the same classification, as shown in the previous section, this process does not show the practical significance of the differences in the mixtures with respect to defining a mixture-specific IVR function. PRS utilizing IVR can provide a means of predicting the performance indices of asphalt mixtures using only volumetric properties. As described above, this process takes time and effort: four corners have to be established and then numerous performance tests at each volumetric condition have to be conducted to calibrate the IVR function. If this process is done for every mixture, time and resources will be strained, even at the project initiation phase. The goal with PRS and the IVR function is possibly to establish mixture class IVR functions. This way, not only will the IVR of a single mixture be established but that of multiple mixtures too.
This section presents a comparison between the measured indices for the MO, PI, and CO mixtures and those predicted from an IVR calibrated using the reference mixture. The coefficients obtained for this IVR function were used to predict the index parameters for MO, PI, and CO. The measured and predicted indices were then plotted against one another to compare and evaluate the efficacy of using a mixture class-specific IVR function when applied to mixtures designed using a mixture design method based on volumetrics only.
Development and Verification of IVR Using the Reference Mix
The IVR calibrated using the reference mixture is shown in Equation 9 and Equation 10 for Sapp and RSI, respectively. The details in relation to the process of calibrating the IVR function are provided elsewhere ( 7 , 8 ).
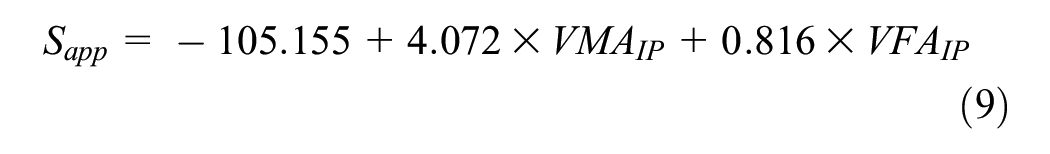
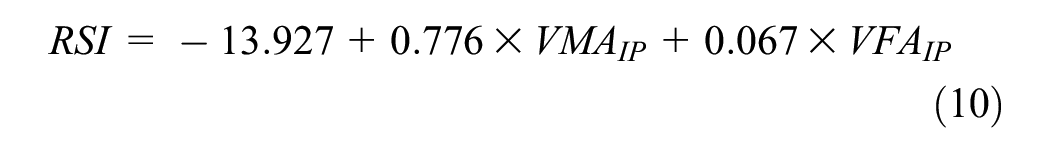
Figure 18 shows the volumetric space for the reference mixture that is used to calibrate the IVR function. In examining the figure, PI and MO are located within the calibrated volumetric space for the reference mixture, whereas CO is outside of this space. Recall that the reference mixture is from the Piedmont region of North Carolina and shares some similarities to PI: both have the same binder grade, which is softer than the other mixtures; both have the same binder content and almost the same effective binder content, even though the RAP content is different; and the design volumetric properties of these two mixtures are also very similar, which explains the overlap in the design volumetric space.
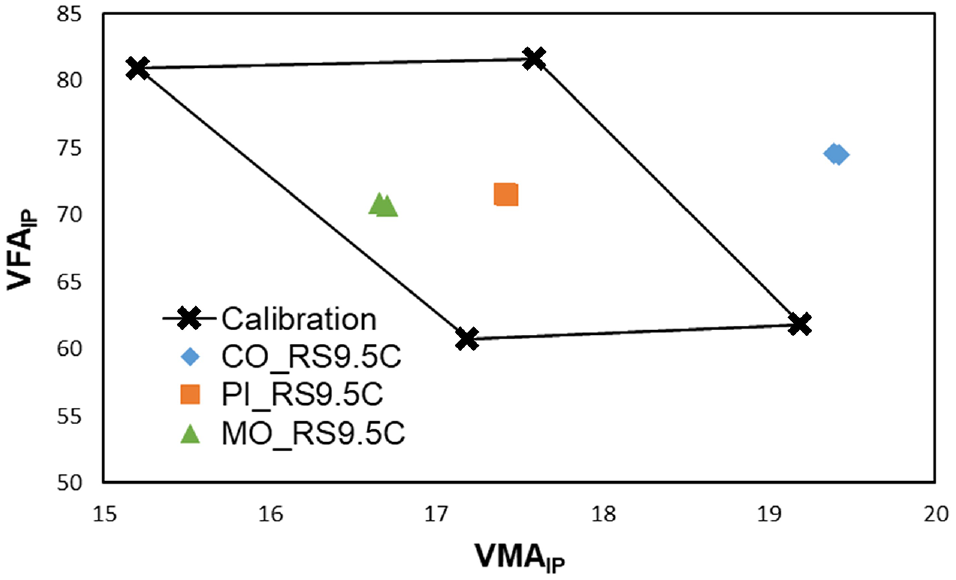
Volumetric space for the reference mixture and the three RS9.5C mixtures considered in this study.
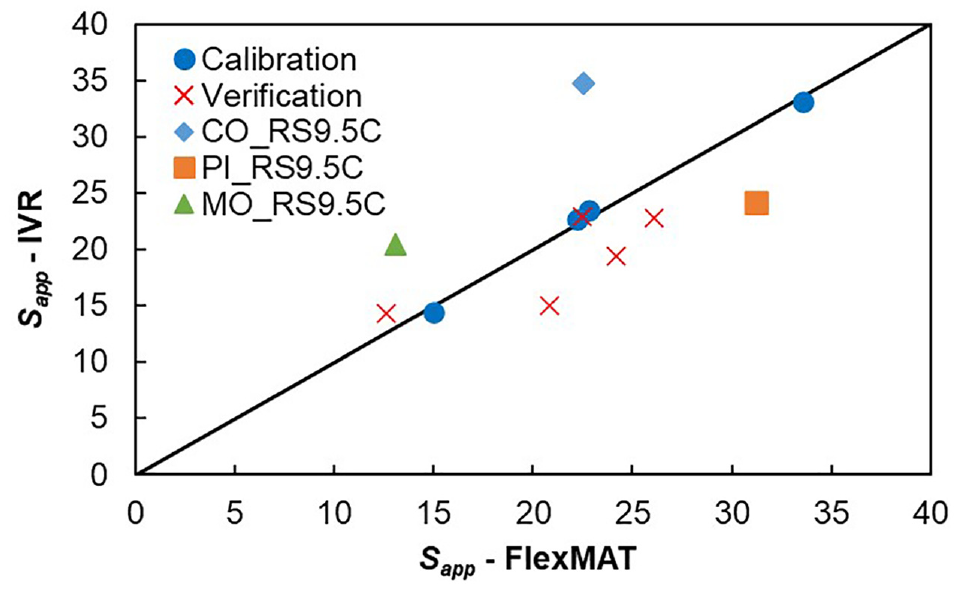
Variations of the reference mixture in relation to gradation, design air voids content, and test specimen air voids content were used to fabricate specimens, conduct testing, and verify the IVR. These variations were not used in the IVR calibration but only to check the validity of the IVR predictions. The measured Sapp and RSI values of the calibration and verification points and their corresponding predicted values are shown in Figures 19 and 20. The reasonable spread around the line of equality verifies the successful calibration of IVR.
IVR comparison of Sapp.
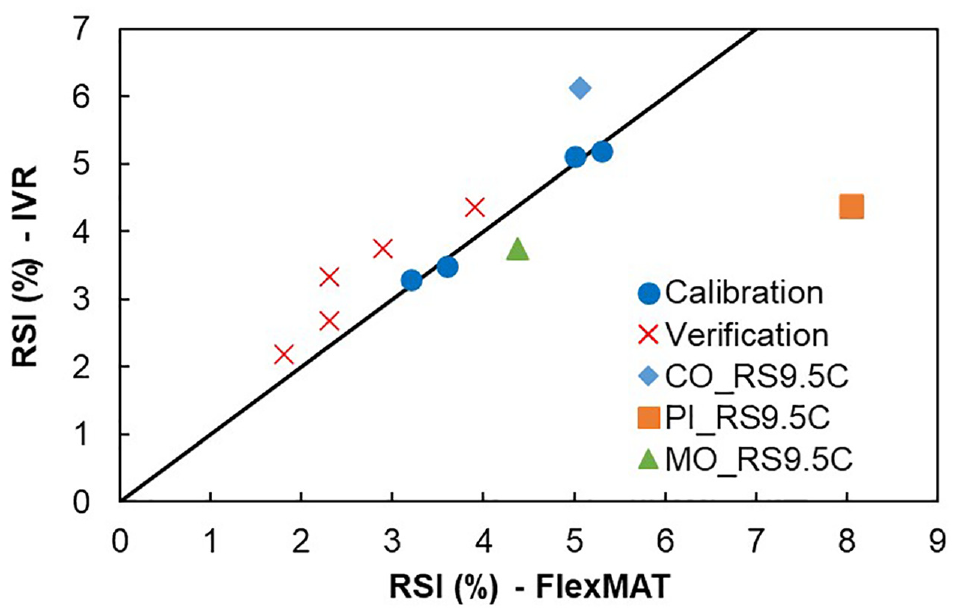
IVR comparison of RSI.
Application of the IVR to the Mixture Class
To predict Sapp and RSI for the three RS9.5C mixtures, the voids in mineral aggregate in place (VMAIP) and voids filled with asphalt in place (VFAIP) were calculated using Equation 2 and Equation 3 by inputting the actual air voids contents of the specimens that were used for performance testing instead of the design air voids content. The VMAIP and VFAIP were then input into the IVR function to obtain the predicted index parameters.
The comparison of CO, PI, and MO with the reference mixture is shown in Figures 19 and 20 for Sapp and RSI, respectively. CO, PI, and MO are designated using the same colors as in the experimental results comparison.
In examining Figure 19, PI was predicted to have a Sapp value of 24.1, but had an actual value of 31.2 (an error of 22.7%), and MO was predicted to have a Sapp value of 20.5, but had an actual value of 13.1 (an error of 56.5%). Even though the difference in the measured values is high, the two mixtures look to be similar according to the plot. The difference in the predicted and actual values could be attributed to the lower effective binder content of MO. Because of this, the VMAIP of MO is lower and close to the threshold of the calibrated volumetric space as shown in Figure 18.
CO has a predicted Sapp value of 34.7 but an actual value of 22.6 (an error of 53.3%). The predicted value may be greater because the effective binder content is greater than the reference mixture. This higher effective binder content increases the VMAIP, thus causing the predicted value to be greater. The prediction does not match the measurement value because the VMAIP value for this mixture is outside the volumetric space that was established by the variations of the reference mixture; thus, it is an extrapolation issue.
In examining Figure 20, CO has a predicted RSI value of 6.1 and an actual value of 5.1 (an error of 20.7%), MO has a predicted RSI value of 3.8 and an actual value of 4.4 (an error of 14.1%), and PI has a predicted value of 4.4 but an actual value of 8.1 (an error of 45.6%).
The higher value of RSI for the measured value of PI could have various causes. The RAP content of PI was 40% instead of 30% as with the reference mixture. This observation, along with the percent reclaimed binder ratio, indicates that this mixture is softer compared with the reference mixture, thus causing the actual RSI value to be higher.
This comparison shows that the volumetric properties can cause some differences in the predicted performance, especially if the reference mixture used to calibrate IVR performs differently than the mixtures whose performance the IVR is trying to predict. CO is predicted to perform better with respect to fatigue cracking but worse with respect to permanent deformation. PI is predicted to perform worse with respect to fatigue cracking but better with respect to permanent deformation. MO is predicted to perform better with respect to both fatigue cracking and permanent deformation.
Because of the differences between the actual and predicted values from the IVR function, an IVR function for an entire mixture classification might not be the ideal solution if the current volumetrics-based mixture classification system categorized for different traffic levels is maintained. The analysis presented in this study shows the discrepancies in performance between mixtures from different source locations but with the same traffic classification. With these performance discrepancies, an IVR function calibrated for a specific performance level will not be able to predict other performance levels accurately.
This finding also emphasizes the importance of comparing performance assessment of mixtures for classification and categorization purposes. Here, it is seen that four mixtures, designed under the same set of specifications, can yield very different behaviors and, therefore, performance attributes. This need for better performance consistency from mixtures within the same classification may become even more pronounced when applying methods such as PRS. This finding also highlights the importance of considering performance over volumetrics. Two mixtures with similar volumetric properties could perform significantly differently. Although PRS is an attractive option because it combines the strength of fundamental engineering properties with the simplicity of measuring volumetric properties for QA, the inherent drawbacks of using volumetric properties would still exist. Only a true performance-based specification, in which fundamental engineering properties are measured and used to predict performance for acceptance and payment, would be able to address the limitations of QA specifications based on volumetric properties.
Summary and Conclusions
The objective of this research was to investigate the differences between mixtures within the same traffic classification. The mixtures in question are three surface RAP mixtures (designated as RS9.5C) from North Carolina meant to serve a traffic level of 3–30 million ESALs, and they were obtained from three regions within North Carolina: CO; PI; and MO. The mixtures were evaluated by conducting dynamic modulus, cyclic fatigue, and SSR testing using an AMPT. The performance of the mixtures was compared with the performance of the pavement. In addition, the applicability of a single IVR function calibrated according to one reference mixture of the same traffic classification as the other mixtures was evaluated. Based on the analysis conducted, the conclusions drawn are as follows:
PI has a lower dynamic modulus than the other two mixtures. CO is different from MO until the temperature is increased to 40°C. MO has the highest dynamic modulus value and PI has the lowest.
With regard to phase angle data, the three mixtures are different for all temperatures, with PI having the highest phase angle value and CO the lowest.
With regard to cyclic fatigue data, all three mixtures are different, with PI performing the best and MO the worst.
For the SSR data, CO and MO were almost similar in relation to RSI. PI is different from the other two mixtures and is the worst performing with regard to RSI.
The bottom-up cracking results for both thin and thick sections showed that CO was the worst-performing mixture, followed by MO. PI was the best-performing mixture with a bottom-up cracking percent that did not exceed 18% and 10% for thin and thick sections, respectively.
Asphalt rutting performance simulations showed that PI had the highest rut depth value for thin and thick sections. CO and MO performed almost identically with regard to rutting performance for thin and thick sections.
Mixtures within the same traffic classification can perform differently. In other words, although some mixtures might have similar volumetric properties, the performance of these mixtures might be substantially different.
An IVR function calibrated for a specific performance level will not be able to predict other performance levels accurately.
The IVR comparison shows that the volumetric properties can cause large differences in the predicted performance, because the reference mixture used to calibrate IVR performs differently from the mixtures whose performance the IVR tries to predict.
Because of the differences in the actual and predicted values from the IVR function, an IVR function for an entire mixture classification might not be the ideal solution.
The collective insights gained from this study suggest that if SHAs are interested in applying PRS in the future, they could consider restructuring their mixture classification system so that it is based on mixture performance rather than on volumetric design. Although PRS is an attractive option because it combines the strength of fundamental engineering properties as well as the simplicity of measuring volumetric properties for QA, the inherent drawbacks of using volumetric properties would still exist. This alludes to the importance of setting performance-based specification rather than PRS as the ultimate goal for addressing the limitations introduced by volumetric properties. Future work could further investigate the differences between these mixtures to explain why they perform differently, and could include conducting a larger study involving more mixtures from different regions with different NMASs and assessing the long-term performance and cost implications of those differences.
Footnotes
Acknowledgements
The authors acknowledge the help of Yizhuang David Wang and Amir Ghanbari, who collected the data for the reference RS9.5C mixture. The authors also acknowledge the assistance of Douglas Mocelin, who provided the IVR function for the reference RS9.5C mixture.
Author Contributions
The authors confirm contribution to the paper as follows: study conception and design: M. M. Isied, N. Williams, B. S. Underwood, Y. R. Kim; data collection: M. M. Isied, A. K. Kuchiishi; analysis and interpretation of results: M. M. Isied, N. Williams, N. Saleh, A. K. Kuchiishi, B. S. Underwood, Y. R. Kim; draft manuscript preparation: M. M. Isied, N. Williams, N. Saleh. All authors reviewed the results and approved the final version of the manuscript.
Declaration of Conflicting Interests
The author(s) declared no potential conflicts of interest with respect to the research, authorship, and/or publication of this article.
Funding
The author(s) disclosed receipt of the following financial support for the research, authorship, and/or publication of this article: This work was supported by the North Carolina Department of Transportation under research project 2019-20, which is the state planning and research number.