
Abstract
The random regret minimization (RRM) approach has been widely used in transport literature, but its application in the Global South is still marginal. In this paper we discuss individual commuting mode choice in the city of São Paulo (Brazil) from the perspective of the RRM modeling approach and its variants found in the literature. We estimated several multinomial logit models (random utility maximization [RUM], classical RRM,
Keywords
The analysis of individual travel behavior is an important aspect in transportation policy to overcome the challenges in understanding the decision-making process that guides people when choosing different forms of mobility. Discrete choice models have been widely used in analyses of transport mode choice, considering the well-known random utility maximization (RUM) approach ( 1 ), which assumes that people choose the alternative that has maximum utility as a function of their sociodemographic characteristics and the level of service (LOS) of alternatives represented by their attributes.
Conversely, the random regret minimization (RRM) approach is based on the premise that people account for the regret generated by the binary comparison of alternatives on their attributes ( 2 , 3 ). Based on regret theory ( 4 ), the RRM approach has been widely used in transport literature. The classical formulation of the RRM model ( 3 ) was extended by van Cranenburgh et al. to the µRRM model, allowing for flexibility in the attribute level of the regret function ( 5 ).
According to literature, the RRM has been applied in various contexts, however its use in the Global South is still limited, especially in Latin America in the context of travel mode choice (
6
). Therefore, in this study we assess individual commuting mode choice in the city of São Paulo, Brazil, using the RRM approach. We estimate a multinomial logit (MNL) classical RRM (CRRM) model and variants of MNL
We additionally analyze heterogeneity in the travel time and travel cost attributes with regard to the intensity of regret imposed by individuals using specific
This paper is divided into five sections. Following this introduction, Section 2 discusses the RRM approach, its properties, and different sources of heterogeneity and applications found in the literature. In Section 3, the dataset used in the paper and the proposed models are detailed, and Section 4 discusses the results. Finally, Section 5 draws the main conclusions of the research and suggests directions for future studies.
Literature Review
The RUM approach accounts for the utility,


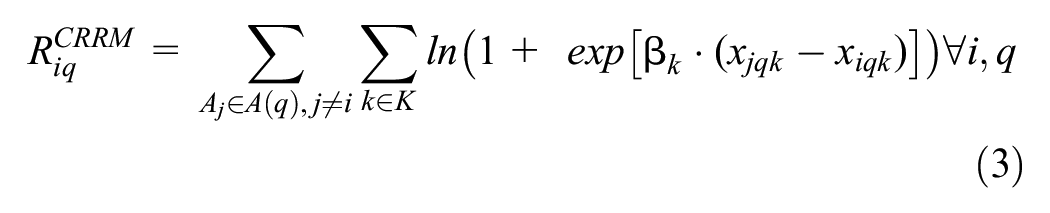
Whereas the RUM approach has gained widespread exposure in both literature and practical applications, alternative formulations have been proposed that offer new perspectives on travel behavior, including approaches grounded in RRM methodology and decision field theory ( 12 , 13 ). The fundamentals of discrete choice models estimated on the basis of regret theory were firstly addressed by Chorus et al. ( 2 ) and Chorus ( 3 ), in which individuals make binary comparisons between attributes to minimize the resulting regret when the attribute of the chosen alternative outperforms the attribute of the alternative not chosen. The formulation of the regret function in its continuous form proposed by Chorus ( 3 ) is shown in Equation 3.
where
Assuming that the regret is defined by stochastic terms that follow an IID EV Type I distribution, the MNL models are also employed to estimate choice probabilities as shown in Equation 4.

RRM models are sensitive to choice set composition and to the compensatory effect ( 14 – 16 ). The first refers to the property of independence of irrelevant alternatives in RUM MNL models, which does not apply to RRM models because the probability of an alternative relies on the comparison of its attributes with the other available alternatives ( 16 ). The second property, the semicompensatory effect, results from the convexity of the regret function, such that improving the performance of an alternative that already has good performance results in smaller reductions of regret, whereas deteriorating the performance of an alternative results in substantial increases in regret ( 16 ).
In relation to the performance of data used, Wong et al. discuss the advantages and drawbacks of revealed preference (RP) data in RRM models, highlighting that the absence of variability in the attribute levels and the lack of knowledge of the real set of alternatives considered by the individual may limit their applications ( 17 ). Those authors show that most of the empirical studies have used data from stated preference (SP) surveys, although models with RP data resulted in better performance.
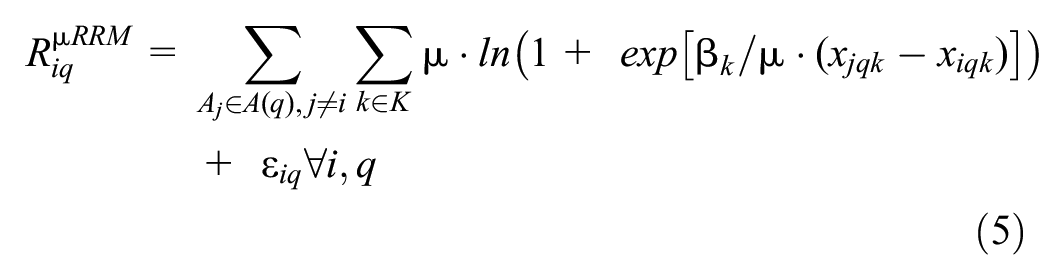
The research by van Cranenburgh et al. (
5
) extended the CRRM model proposed by Chorus (
3
) to the
Modeling Heterogeneity Preferences in the RRM Approach
So far, the issue of heterogeneity in transport literature has been explored by mixed MNL (MMNL) and LC models ( 18 , 19 ). The MMNL has become one of the most important tools in analyzing taste or unobserved heterogeneity when the analyst assumes that the taste related to an attribute follows a continuous distribution, or in the case of LC models by segmenting the population in homogeneous groups of different behavior through a discrete distribution.
In addition to the unobserved heterogeneity in preferences, some authors argue that the decision process can be heterogeneous in the population ( 8 ); the LC framework has been mostly used to explain such different paradigms of individual choice. Other studies have also observed this type of heterogeneity; for instance, Hess and Chorus compared various LC models incorporating both RUM and RRM classes, demonstrating improved model fit when heterogeneous decision rules are considered ( 20 ). Hess and Stathopoulos explored the connection between the character traits of individuals and these decision paradigms ( 9 ).
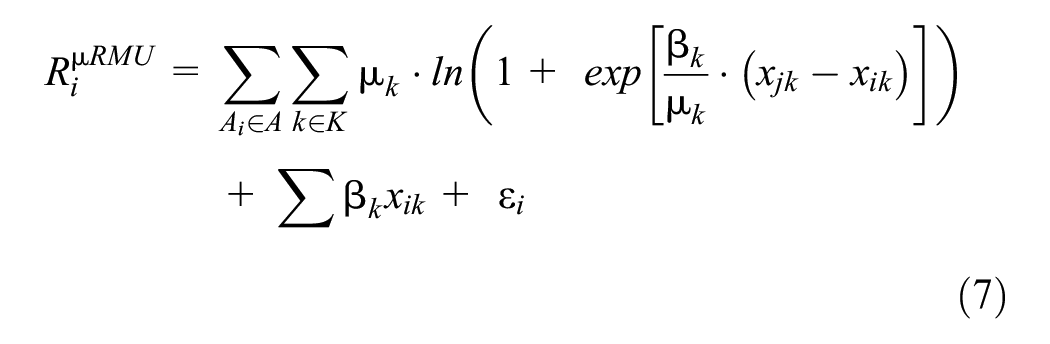
Another type of heterogeneity is represented by the RMU model proposed by Hensher et al., who state that individuals may minimize the regret for some attributes and maximize the utility for others, thus mixing the RRM and RUM approaches simultaneously in the same model (
21
). Such approach was explored by Leong and Hensher with mode and route choice data in Australia (
22
). More recently, Luan et al. used the CRRM and the generalized random regret minimization (GRRM) models to analyze the impact of the COVID-19 pandemic on travel mode choices and tested different
Another source of heterogeneity comprising the µRRM model (
5
) was explored by Wong et al., who estimated this model with both generic and specific scale parameters, though without finding significant results as they did not present better fits compared with the RUM model, nor with significant
Applications
Several applications of the RRM approach have been described in transport and travel behavior literature, for instance, in relation to road safety ( 24 ), freight transport ( 25 – 27 ), traffic allocation and route decision ( 28 – 31 ), demand for recreational activities ( 32 ), traffic calming schemes ( 33 ), and passenger mode choice ( 34 ). Among those comprising RP data, there are applications on parking site decisions ( 3 ) and route choices ( 35 ). For additional information, we refer interested readers to the literature reviews conducted by Chorus et al. ( 36 ) and Jing et al. ( 6 ). In the Global South context, empirical evidence appears mostly in Asian countries on topics of travel mode choice ( 37 , 38 ), tourism ( 39 ), and environmental concerns ( 40 ). Recently, Isler et al. analyzed the effects of stimulus perception in long distance rail mode choice using RRM models and SP data and found that RRM performs better in fewer cases ( 41 ). Mauad and Isler compared different modeling approaches to analyze destination choices in the city of São Paulo, Brazil ( 42 ).
Some studies have also extended the capabilities of the RRM models, for instance, incorporating psychophysical mapping into RRM models to account for perceptions of the attributes using Weber’s law ( 43 ); accounting for cognitive effort to compare alternatives ( 44 ); and analyzing the bias from measurement error ( 45 ) and from omitted variables ( 46 ). Dekker showed potential applications of value of travel time measures for transport appraisal in the context of the RRM approach ( 47 ).
Applications using the
Data and Model Specification
Data
The data used in this research were obtained from the RP “Origin and Destination Household Survey” (OD 2017) conducted in the metropolitan region of São Paulo (MRSP) by the Companhia do Metropolitano de São Paulo ( 49 ). The MRSP is composed by the city of São Paulo, which serves as the capital of the homonymous state, and 38 other municipalities over an urban area of 7,947 km2 with approximately 21.2 million inhabitants. The data collected in the survey refer to urban trips on a typical weekday previous to the interview and contain sociodemographic characteristics of the household and the individuals, and information about all their trips (origin, destination, departure time, and transport mode). The survey was applied to a stratified random sample of 32,000 households and approximately 100,000 individuals, representing around 42 million trips on a typical day in the MRSP.
The dataset was filtered for modeling purposes by selecting the observations of individuals traveling to work with both origin and destination exclusively in the city of São Paulo owing to the lack of information to estimate LOS attributes outside this area. Observations referring to individuals younger than 16 years, households with income equal to zero, and missing values in any of the sociodemographic attributes were removed from the dataset. In this research we considered only motorized modes of transport: car, bus, and rail comprising the subway and urban rail systems. Moreover, we selected only households owning at least one automobile to avoid cases in which the individual would have only two available alternatives ( 17 ).
The attributes of the
Given that the information reported in the survey refers only to the chosen modes, we inferred that all the alternatives were available to each individual, and we modeled the LOS attributes as recommended by Koppelman and Bhat, including the alternative actually chosen, to avoid biased measures from multiple sources that consider different rules for mode access, and maximum access distance to terminals ( 50 ).
Travel time by car and access and egress distances to estimate travel costs were collected from the TomTom application programming interface (API) ( 51 ). The monetary costs by car were calculated from the formulation proposed by Gomide and Morato, which is composed of a fixed cost added to a variable cost as a function of the total traveled distance, as shown in Equation 6 ( 52 ); these values were updated to 2017 by an inflation rate index ( 53 ).

where
Travel times by bus and rail were obtained from OpenTripPlanner, an open-source multimodal routing API coded in Java that uses information from GTFS (general feed information specification) files to calculate transit routes ( 54 ). In this study, the GTFS file from 2017 was provided by SPTrans, the company that manages the bus fleet in the city of São Paulo ( 55 ). Trips that could not be traced were subsequently removed from the final dataset.
In São Paulo, a unique fare of R$3.80 was charged at the time of the survey for trips made exclusively by bus, with temporal integration when a smart card was used in the system. The costs of rail trips were estimated for two groups: i) individuals who opted for the rail alternative as reported in the survey, the cost was estimated by considering the trip chain described in the survey, which varied between R$3.80 for trips made solely by rail or integrated with an individual/private transport mode, and R$6.80 for trips involving rail/bus integration; and ii) for unavailable trip chains in the survey, we considered an access rule in which the cost was set to R$3.80 for those individuals living 1,500 m or less from nearby train stations, and R$6.80 for individuals with an origin that was more than 1,500 m from the closest train station. The final dataset comprised 8,962 observations; the descriptive statistics are shown in Table 1.
Descriptive Statistics of the Attributes
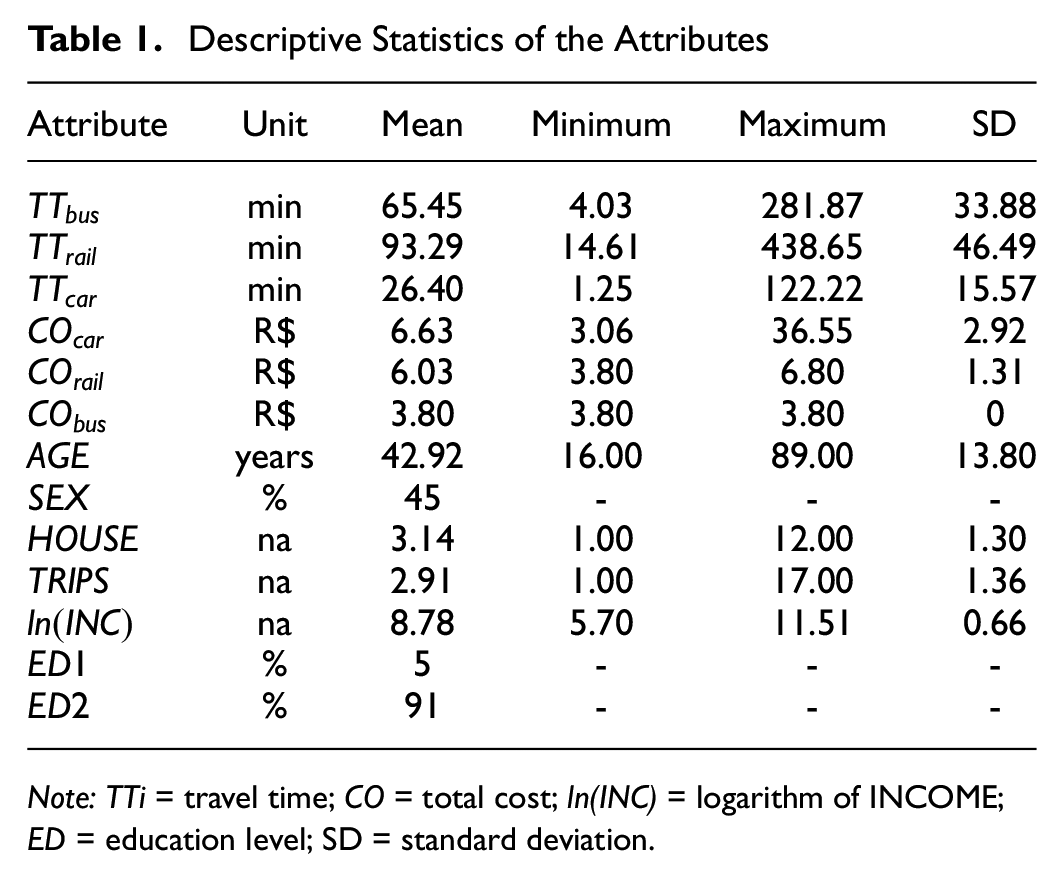
Note: TTi = travel time; CO = total cost; ln(INC) = logarithm of INCOME; ED = education level; SD = standard deviation.
Model Specification
RUM, CRRM, and
RRM MNL Models
We estimated RUM, CRRM, and
The final models were estimated with specific and generic parameters related to travel times and costs, respectively. Moreover, AGE and level of education (
Latent Class Models
The LC model was specified as proposed by Hess et al. (
8
). Let

where
Therefore, the choice probability conditional to the class allocation model can be calculated by Equation 9,
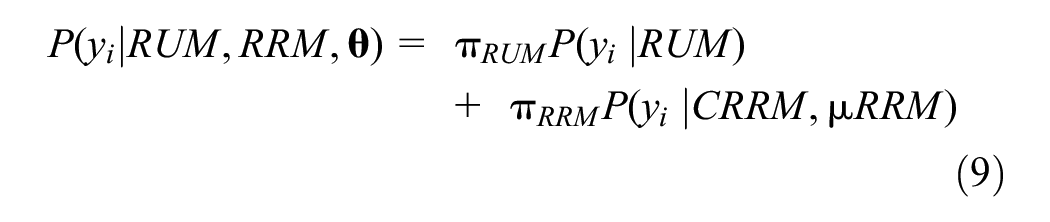
Several specifications were tested for the LC and MNL models within the RUM and RRM. The comparison involved the likelihood ratio test ( 56 ), and the Akaike likelihood ratio index (ALRI) test proposed by Ben-Akiva and Swait for nonnested models was employed to assess and contrast the RUM and RRM models ( 57 ). The parameters related to the LOS attributes in the LC were specified as in the final MNL models. We tested the sociodemographic attributes in the choice model, in the allocation model, and in both components simultaneously. The best result was found with the sociodemographic attributes in the allocation model, therefore, it is the only model presented in this paper. All models were estimated by likelihood maximization in Apollo ( 58 , 59 ) implemented in R package ( 60 ).
Elasticities
Elasticities are important measures for policy-making and widely applied in both transport literature and practice. These measures are already known for the RUM case and are simple to calculate. The elasticities for the RRM approach were firstly addressed by Hensher et al. for the CRRM (
21
), and recently discussed by Belgiawan et al. in the
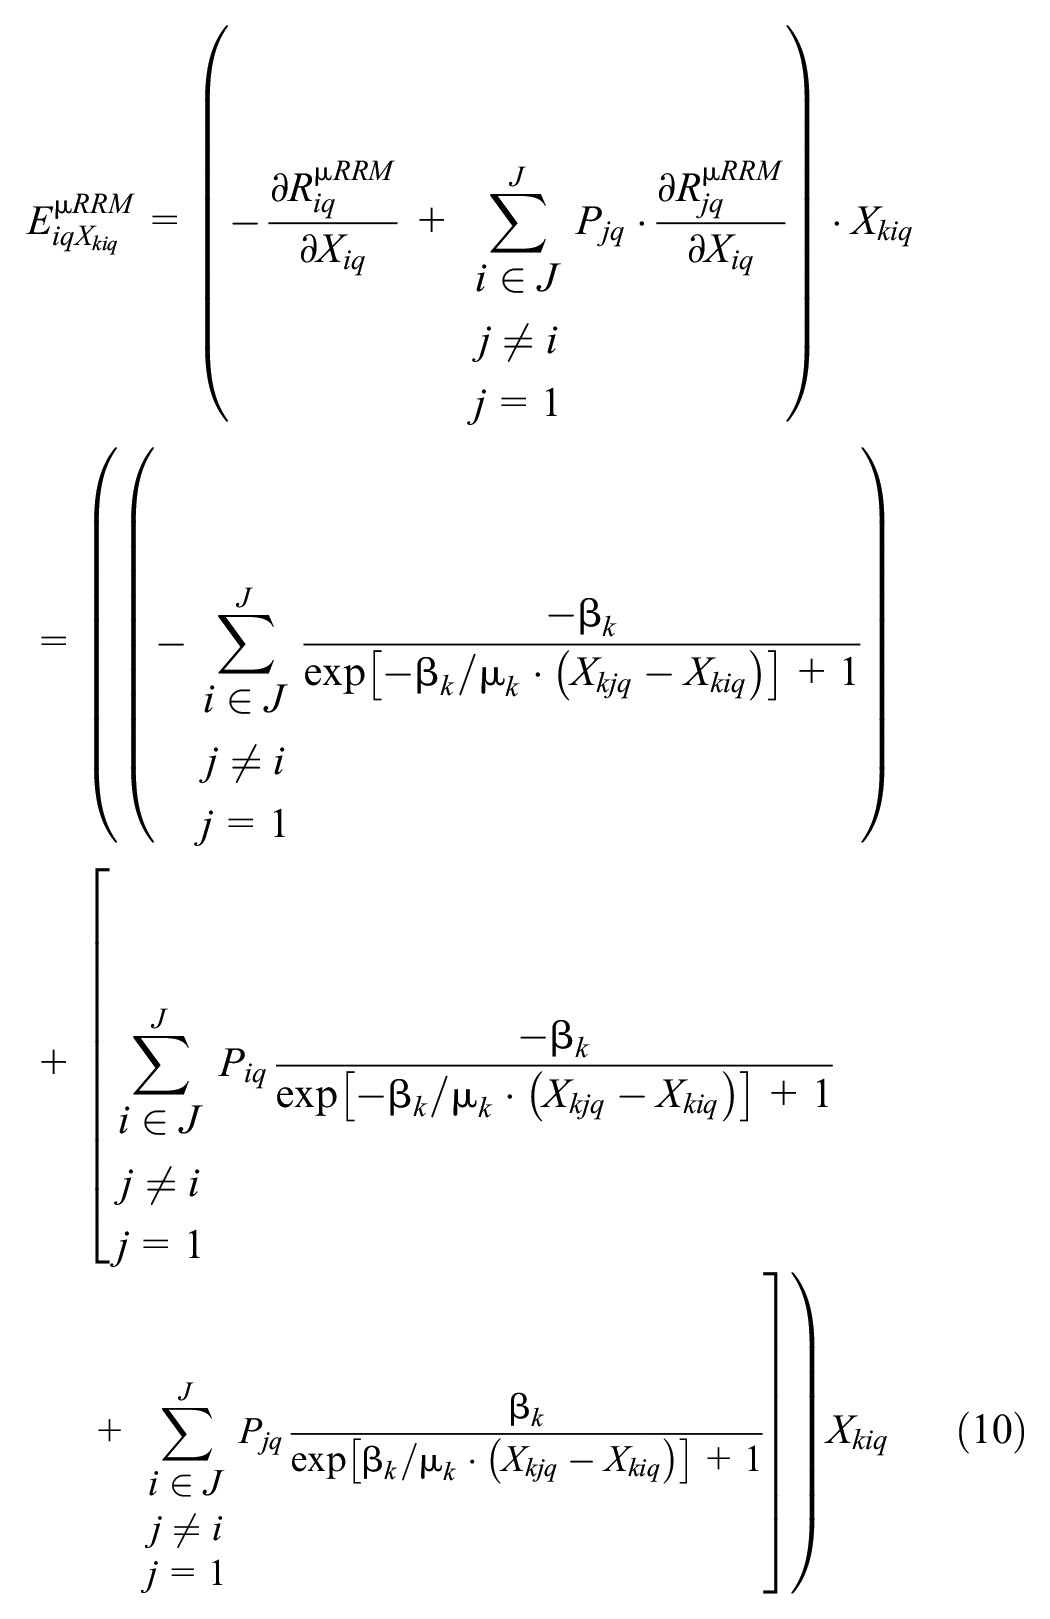
The aggregate direct point elasticities used to compare both approaches were calculated according to Equation 11 ( 61 ).
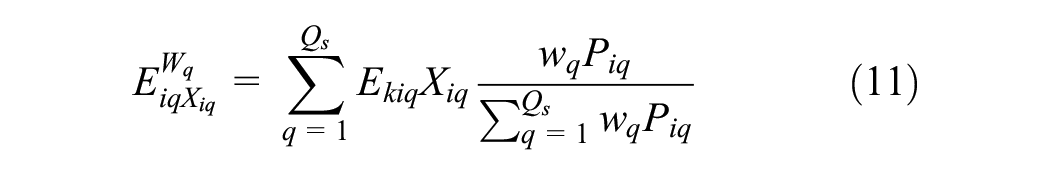
where
Results
Goodness-of-Fit
The goodness-of-fit measures of the estimated models are shown in Table 2 and their respective log-likelihoods are summarized in Figure 1. LC models that allow for flexibility in decision rules with only LOS attributes provide better results in relation to log-likelihood. In these cases, the MNL CRRM model fit better than the MNL RUM with a log-likelihood difference of 58.92, similar to Wong et al.’s research that highlighted that RRM models estimated with RP data provide better results than RRM models with SP data ( 17 ).
Goodness-of-Fit of the Estimated Models
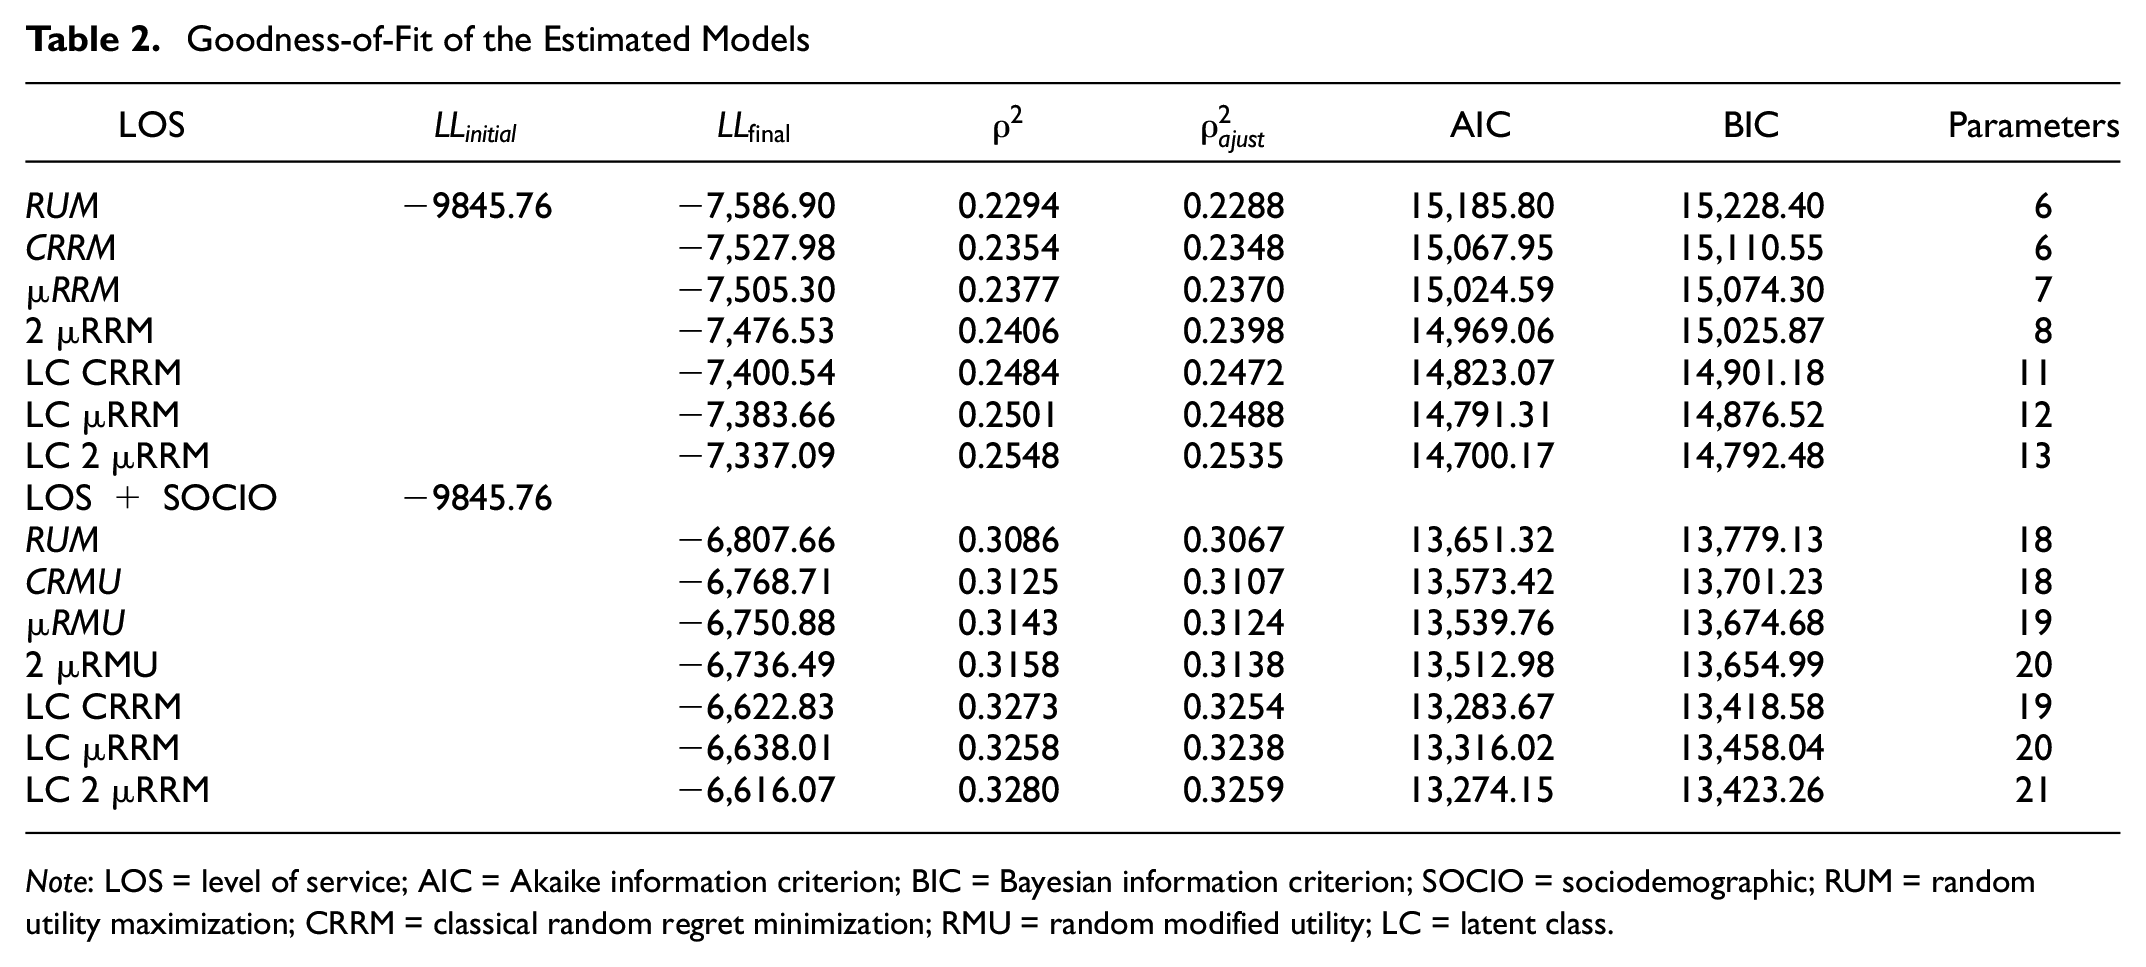
Note: LOS = level of service; AIC = Akaike information criterion; BIC = Bayesian information criterion; SOCIO = sociodemographic; RUM = random utility maximization; CRRM = classical random regret minimization; RMU = random modified utility; LC = latent class.
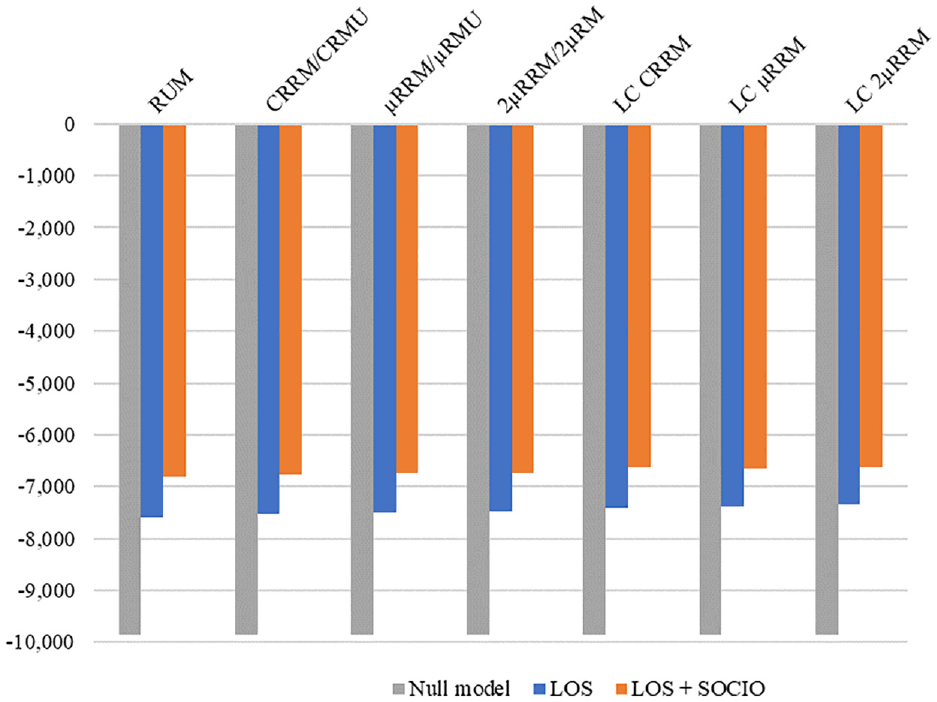
Log-likelihood of models with LOS attributes and sociodemographic attributes (LOS+SOCIO).
The
The
The results of the models with sociodemographic attributes are also shown in Table 2. It is worth noting that the inclusion of these variables significantly enhanced the results compared with models containing only LOS variables. Moreover, models estimated using the RRM approach demonstrated a superior fit compared with the RUM models, whereas the
Allowing for different scale parameters also increased the performance of estimations, given that the log-likelihood of the
Parameters
The parameters of the models with only LOS attributes are given in Table 3, and the estimates of the models with sociodemographic variables (LOS + SOCIO) are shown in Table 4. All the MNL and LC estimations had LOS parameters with the expected signs and were significant at a 95% confidence level. According to the data in Table 3, the MNL RRM models resulted in similar parameters, whereas the LC models provided higher values for some of them, similar to those related to the travel costs
Estimates of the Models with just LOS Attributes
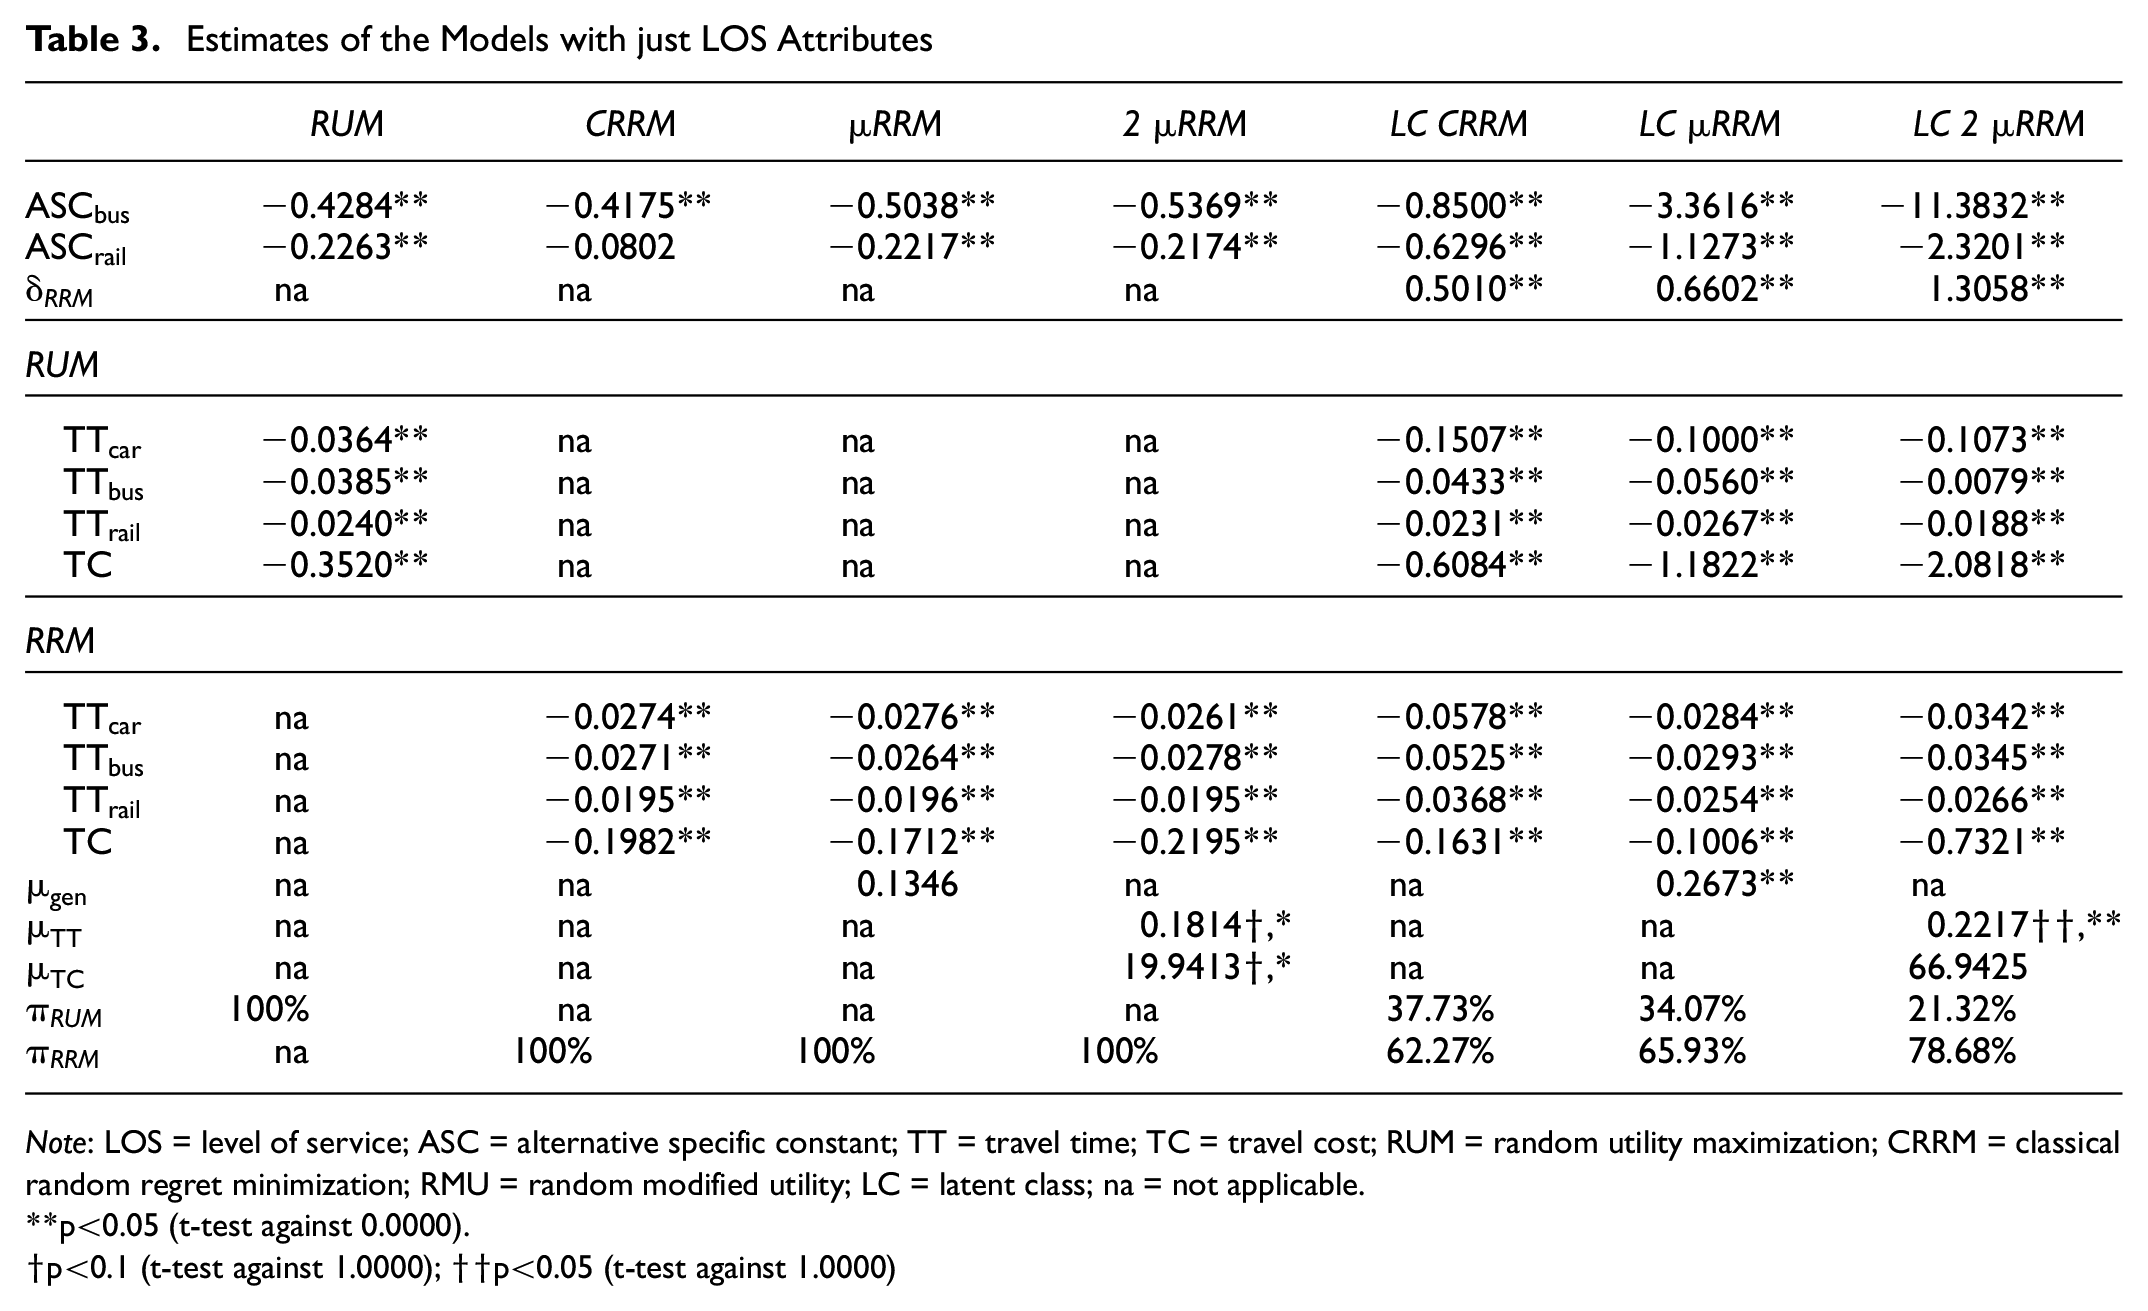
Note: LOS = level of service; ASC = alternative specific constant; TT = travel time; TC = travel cost; RUM = random utility maximization; CRRM = classical random regret minimization; RMU = random modified utility; LC = latent class; na = not applicable.
p<0.05 (t-test against 0.0000).†p<0.1 (t-test against 1.0000); ††p<0.05 (t-test against 1.0000)
LOS Estimates for Models with LOS + SOCIO Attributes
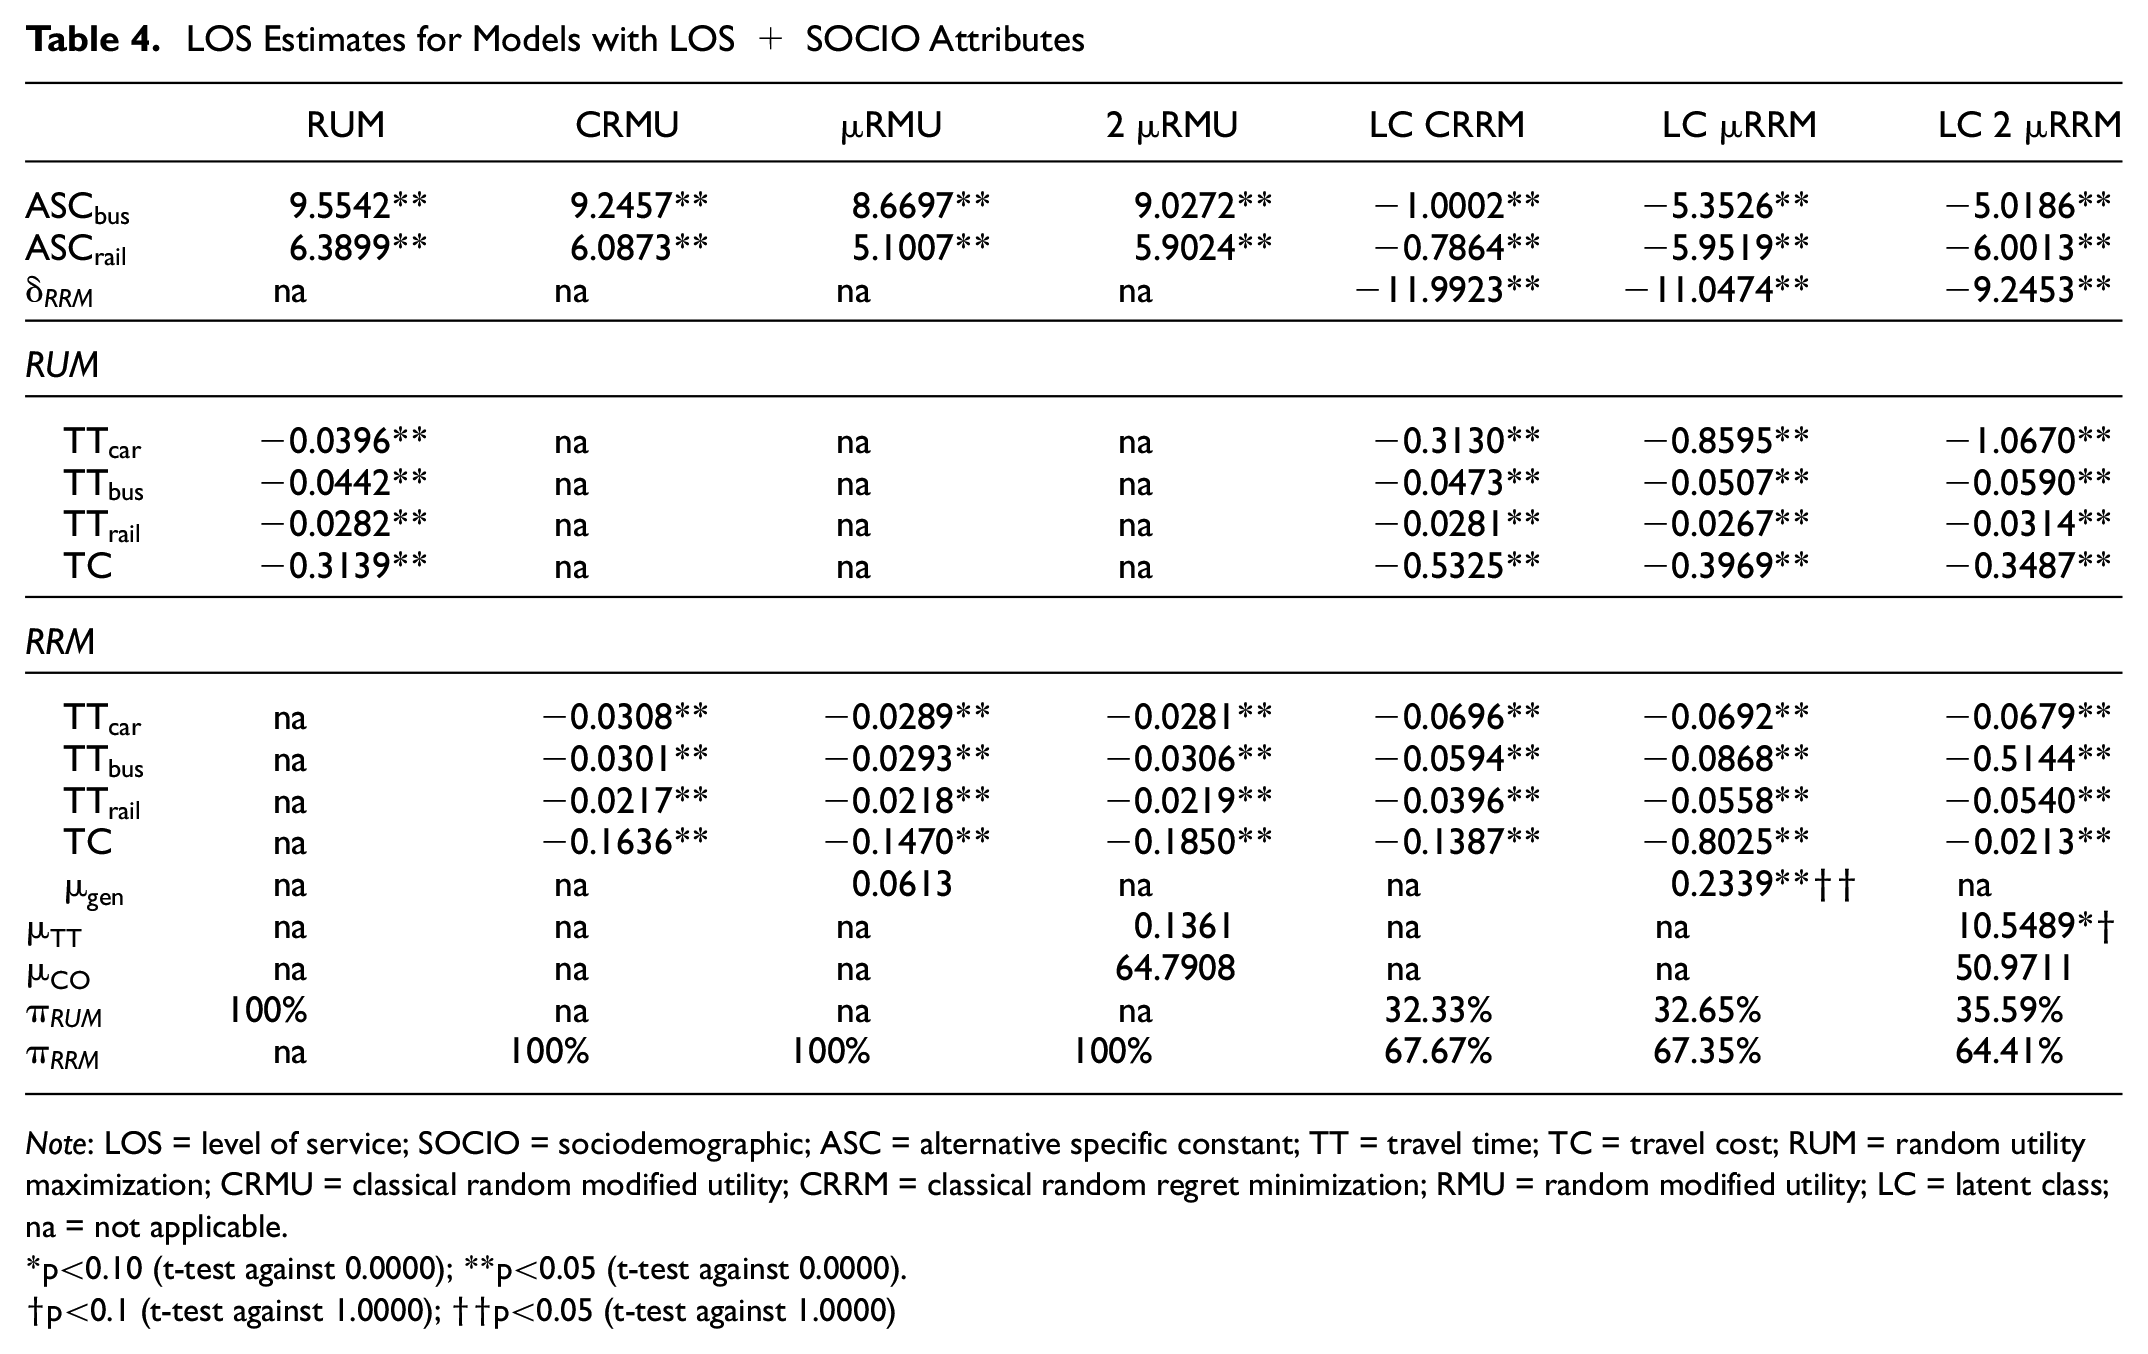
Note: LOS = level of service; SOCIO = sociodemographic; ASC = alternative specific constant; TT = travel time; TC = travel cost; RUM = random utility maximization; CRMU = classical random modified utility; CRRM = classical random regret minimization; RMU = random modified utility; LC = latent class; na = not applicable.
p<0.10 (t-test against 0.0000); **p<0.05 (t-test against 0.0000).†p<0.1 (t-test against 1.0000); ††p<0.05 (t-test against 1.0000)
The results of the alternative specific constants (ASCs) in all models with LOS attributes (Table 3) showed that the bus and rail alternatives were less popular than the car. It was also noted that individuals were more likely to choose public transport when sociodemographic attributes were included in the models, as shown in Table 4; an exception to this was the LC model that also had negative ASCs when sociodemographic attributes were included in the class allocation model.
The class specific constant
It is worth noting that the models with the generic
Furthermore, the
The parameter estimates for the sociodemographic attributes in the MNL models are presented in Table 5. In general, similar results were found across the models for expected signs, values, and significance. The only nonsignificant parameter was the first category of education (between 8 and 10 years of study) in all models. Car was preferable to bus and rail during the morning peak and among older individuals, whereas public transportation was less favored among those with higher levels of education. Likewise, increments in household income decreased the probability of bus and rail being chosen, even though these effects were different for the two alternatives. Nevertheless, higher numbers of members within a household increased the probability of individuals choosing transit alternatives. Women were more likely to choose bus and rail, and higher numbers of daily trips increased the probability of choosing the car.
Parameter Estimates of Sociodemographic Attributes from Logit Models
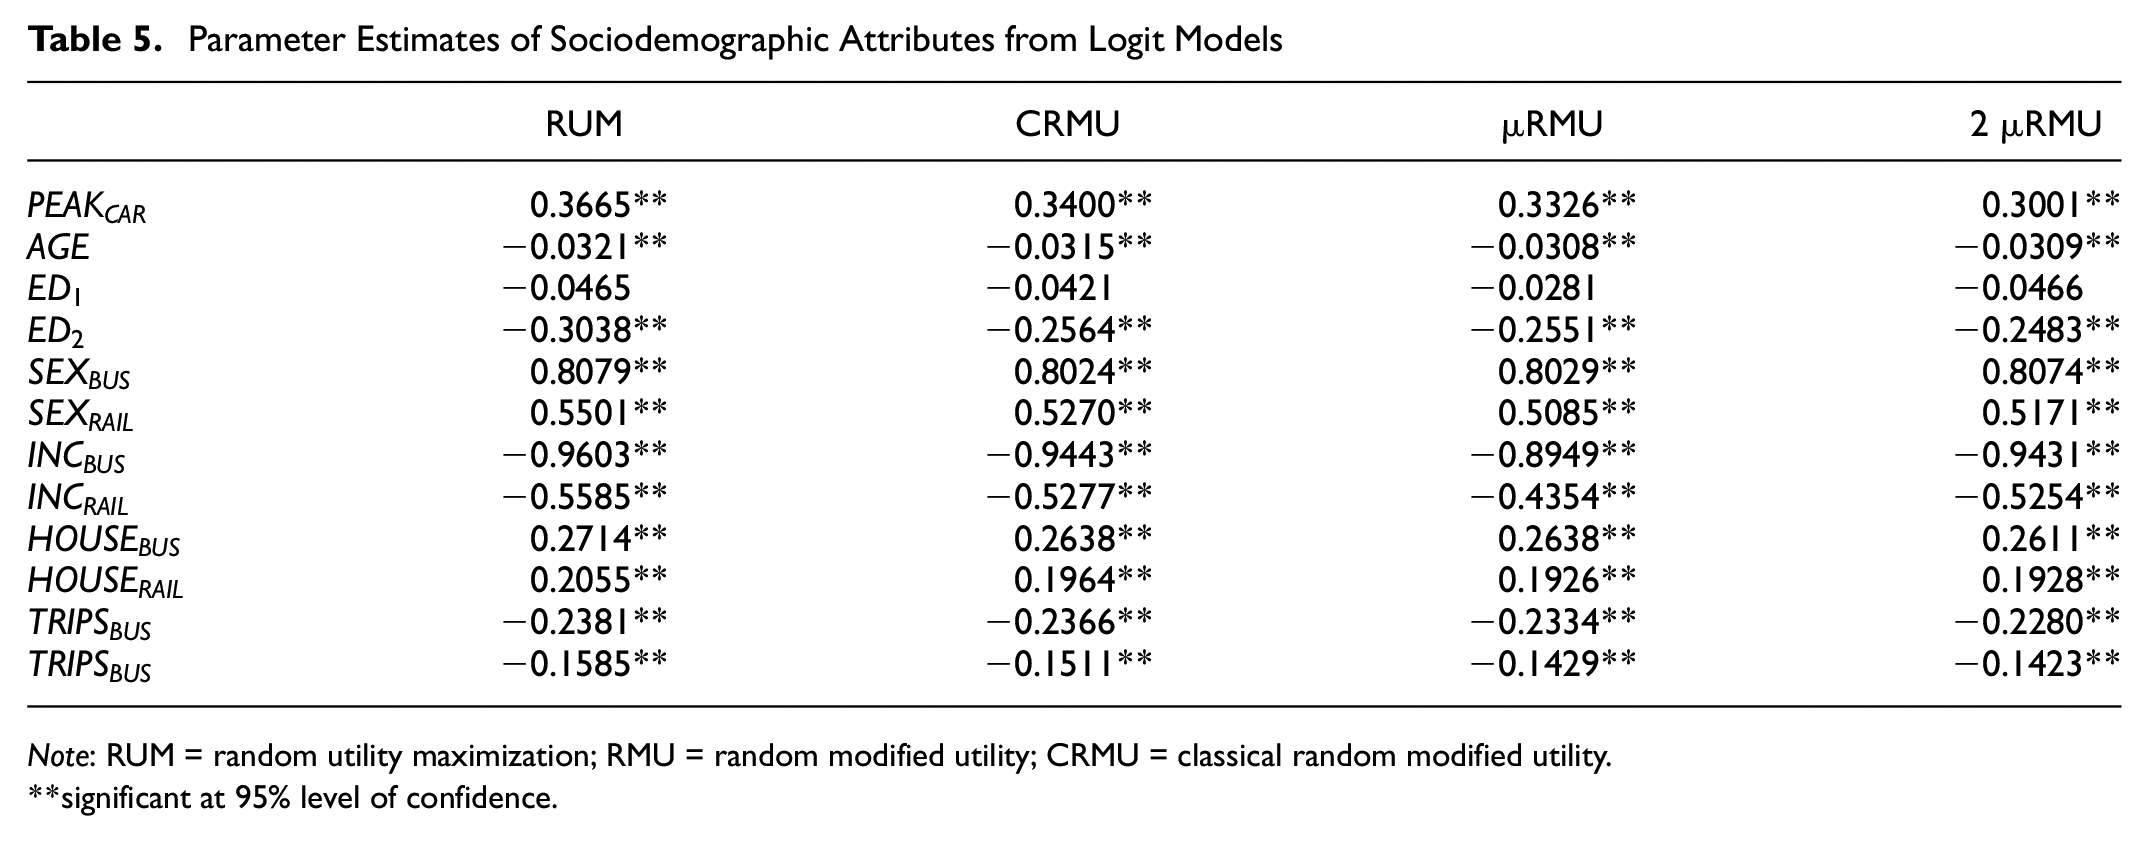
Note: RUM = random utility maximization; RMU = random modified utility; CRMU = classical random modified utility.
significant at 95% level of confidence.
Table 6 presents the parameter estimates in the class allocation model. Only the parameter for the first category of level of education
Parameter Estimates of the Sociodemographic Attribute of the Class Allocation Models
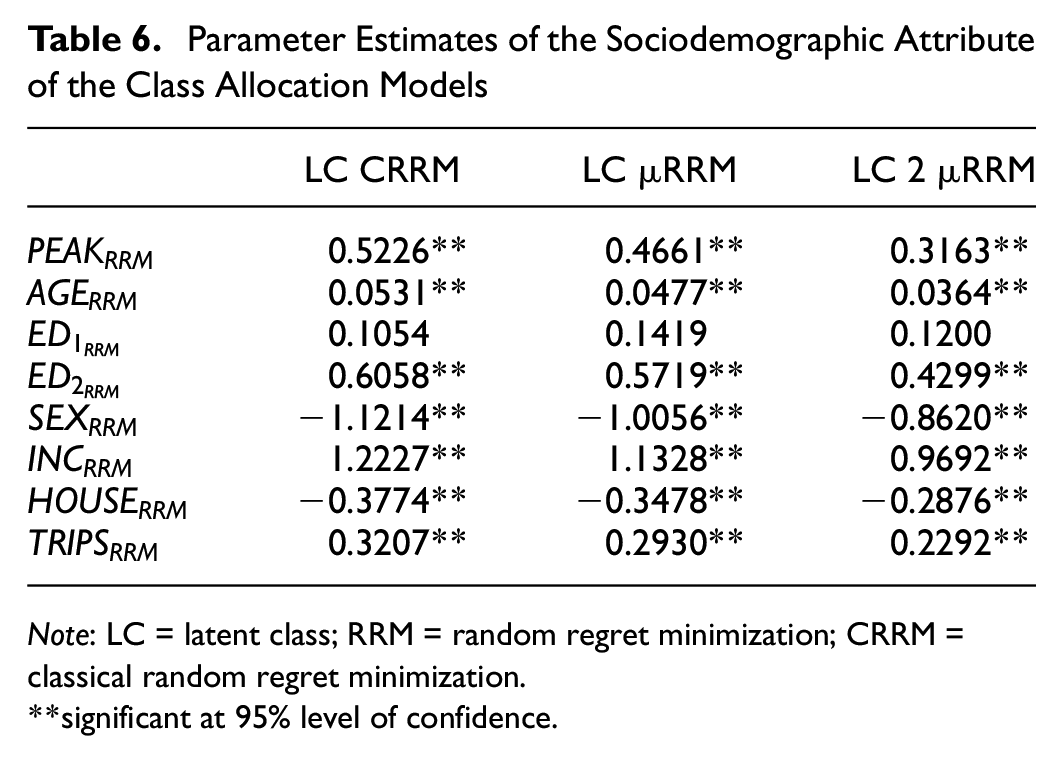
Note: LC = latent class; RRM = random regret minimization; CRRM = classical random regret minimization.
significant at 95% level of confidence.
Elasticities
We calculated the elasticity measures only for models with all significant coefficients, that is, we excluded the
Direct Aggregate Point Elasticities for TC and TT for Model with LOS Attributes
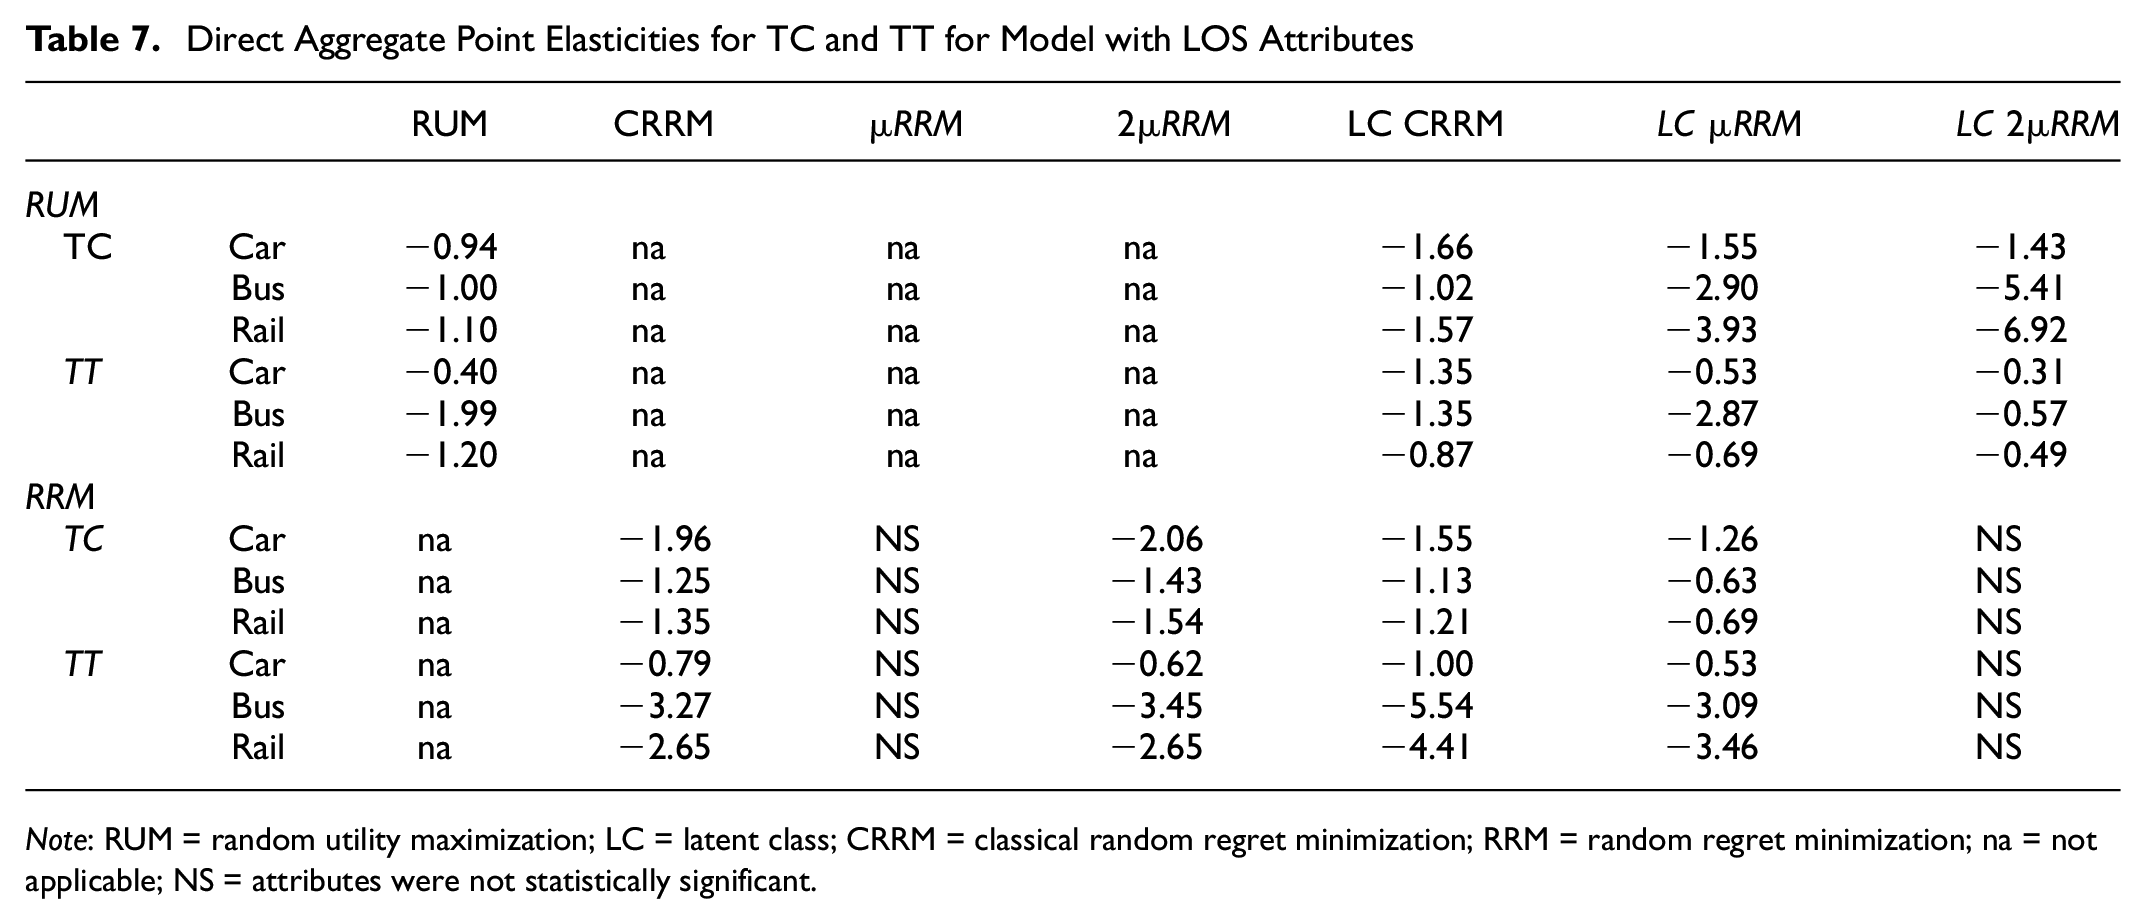
Note: RUM = random utility maximization; LC = latent class; CRRM = classical random regret minimization; RRM = random regret minimization; na = not applicable; NS = attributes were not statistically significant.
Direct Aggregate Point Elasticities for TC and TT for Model with LOS and Sociodemographic Attributes
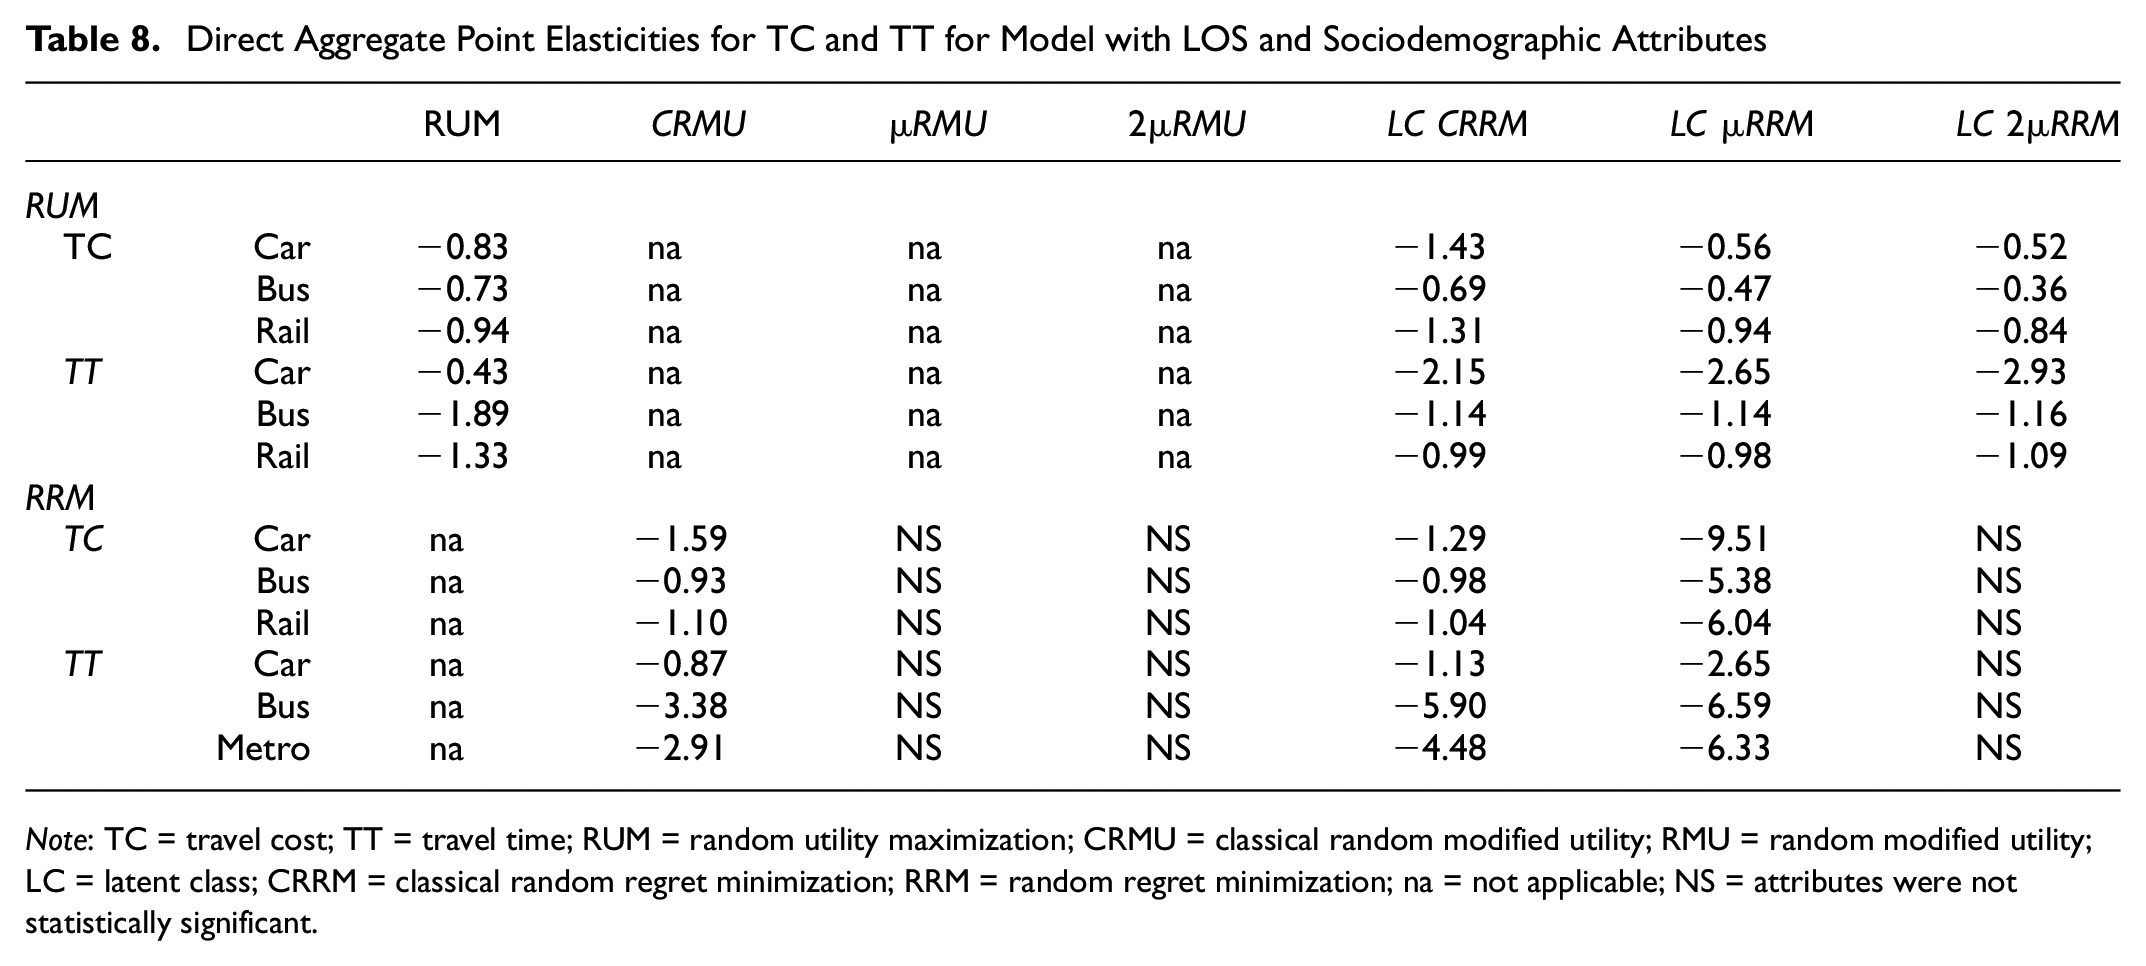
Note: TC = travel cost; TT = travel time; RUM = random utility maximization; CRMU = classical random modified utility; RMU = random modified utility; LC = latent class; CRRM = classical random regret minimization; RRM = random regret minimization; na = not applicable; NS = attributes were not statistically significant.
The outcomes of models incorporating sociodemographic attributes are presented in Table 8. The findings suggested that travel costs were inelastic for all alternatives, and for travel time only the car alternative showed inelasticity in the MNL RUM model. As for the RRM approach, only the elasticities of the MNL CRRM model are presented. In this context, the travel cost of the bus and travel time of the car alternatives were found to be inelastic. This suggested that an increase in these attributes did not significantly decrease the probability of choosing these alternatives. Similarly, the results of the LC models showed that the main difference between its RUM component and the RUM model was related to travel time by car, which was inelastic in the MNL case but elastic in all the LC models. For the RRM component, the elasticity of travel cost in the LC CRRM and all the elasticities in the LC
Conclusions and Policy Implications
Understanding the behavior processes underlying the decisions of individuals is an important task for transport policy-making. Although the RUM approach has been widely used in the field, other theories and approaches have been proposed such as the RRM, which has evolved from its first formulation to several variants such as the P-RRM and the
This holds significant importance as urbanization and factors influencing mobility patterns vary significantly between southern and northern regions. Moreover, cities in Latin America have faced substantial adverse effects owing to the extensive reliance on individual motorized transport. Therefore, embracing innovative paradigms like the RRM becomes crucial, thus providing new perspectives on individual travel behavior. This, in turn, can aid policy makers in formulating more effective transport policies and uncovering aspects that conventional approaches, such as RUM, may have overlooked until now.
This research addressed certain gaps identified in the existing RRM literature by i) applying the approach to travel mode choice in São Paulo, Brazil, the largest city in Latin America; ii) concurrently examining heterogeneity in the decision rule and the scale regret parameter; iii) correcting the formulation for the elasticities in the μRRM model, firstly addressed by Belgiawan et al. ( 10 ). To achieve this, we utilized RP data obtained from a household survey conducted in the city of São Paulo, focusing on travel mode choices for commuting trips. We also presented a correct formulation for deriving elasticities and MRS of the μRRM model.
The LC
Employing a combination of strategies derived from both approaches could be an effective method of changing mode shares, particularly in encouraging transitions from private car to public transport alternatives. Our findings indicated higher likelihood of individuals in São Paulo adopting the RRM approach (with an average probability of 66% across all LC models) as opposed to the RUM approach.
Moreover, engaging in a morning trip during peak hours, being older, having higher level of education, and greater income, as well as taking multiple trips per day, all contributed to an increased likelihood of individuals exhibiting semicompensatory behaviors. Conversely, being woman and having more household members increased the probability of belonging to the full compensatory behavior group (RUM). This pattern might be attributed to how women and larger families tend to have limited available alternatives, consequently reducing the probability of reproducing regret-related behaviors.
The RRM models demonstrated better performance than the RUM approach, regardless of the inclusion of sociodemographic attributes, in line with existing literature. Furthermore, the findings indicated that increasing flexibility in the decision process and the scale of regret significantly improved the goodness-of-fit of the estimated models. The μ parameter proved to be statistically significant when considering only minimized attributes (LOS) for the 2
Furthermore, a notable drawback in increasing the model complexity, that is, from MNL to LC models, was the occurrence of extreme values for elasticities in some cases, for example, in the elasticities of the RRM component of the LC
Moreover, from a policy standpoint, the findings underscored that individuals strongly dislike increases in travel time and cost. The travel cost elasticities of public transport alternatives were elastic in all models. In locations like São Paulo, where two-thirds of the population commute using both public transport and cars, alterations in transport fares and travel times could significantly influence their mode choices. In addition, the demand for travel times and costs was elastic, implying that policies affecting these attributes will have significant impacts on the demand for these alternatives.
Finally, for individuals exhibiting compensatory behavior, transport policies concentrating solely on one mode may not yield the expected results. Therefore, strategies such as the avoid-shift-improve approach could prove beneficial, emphasizing enhancements to transit and active modes through improved infrastructure, reduced travel times, and increased comfort, thereby discouraging car usage by raising its overall transport cost ( 61 ).
Policy making must incorporate a gender perspective, as the findings indicated higher likelihood for women to use public transport. Although such results are not novel, they underscore the importance of tailoring the planning and operation of bus and rail systems to accommodate the specific needs of women. In addition, initiatives aimed at promoting public transport should explore the use of incentives during off-peak hours, such as discounts or other types of incentives.
Future research could address the applicability of the RRM approach in diverse contexts and with alternative datasets, thereby broadening our understanding of the approach in cities across the Global South. Although some research has been conducted on this subject, the need for additional empirical evidence remains. Methodologically, it would be beneficial to explore alternative formulations of the RRM approach, such as the P-RRM model, and consider various types of heterogeneity, including unobserved taste and scale heterogeneity.
Supplemental Material
sj-docx-1-trr-10.1177_03611981241242062 – Supplemental material for Random Regret Minimization Approach to Commuting Mode Choice in São Paulo, Brazil
Supplemental material, sj-docx-1-trr-10.1177_03611981241242062 for Random Regret Minimization Approach to Commuting Mode Choice in São Paulo, Brazil by Gabriel Pereira Caldeira and Cassiano Augusto Isler in Transportation Research Record
Footnotes
Acknowledgements
The authors acknowledge TomTom Global Content B.V. for the access to data of the Traffic Stats API through an agreement with Escola Politécnica of the University of São Paulo.
Author Contributions
The authors confirm contribution to the paper as follows: study conception and design: G.P. Caldeira, C.A. Isler; data collection: G.P. Caldeira; analysis and interpretation of results: G.P. Caldeira, C.A. Isler; draft manuscript preparation: G.P. Caldeira, C.A. Isler. All authors reviewed the results and approved the final version of the manuscript.
Declaration of Conflicting Interests
The authors declared no potential conflicts of interest with respect to the research, authorship, and/or publication of this article.
Funding
The authors disclosed receipt of the following financial support for the research, authorship, and/or publication of this article: The first and the second authors acknowledge the Conselho Nacional de Desenvolvimento Científico e Tecnológico for the scholarships (process no. 132781/2019-8 and no. 306552/2022-1, respectively).
Supplemental Material
Supplemental material for this article is available online.
References
Supplementary Material
Please find the following supplemental material available below.
For Open Access articles published under a Creative Commons License, all supplemental material carries the same license as the article it is associated with.
For non-Open Access articles published, all supplemental material carries a non-exclusive license, and permission requests for re-use of supplemental material or any part of supplemental material shall be sent directly to the copyright owner as specified in the copyright notice associated with the article.