
Abstract
Safety service patrols (SSPs) play an important role in incident management on highways. It is critical to respond to incidents in a timely manner as this can significantly reduce nonrecurrent congestion and improve safety. Therefore, it is essential to allocate available SSP vehicles to highway segments such that their effectiveness is maximized. This study aimed to develop a simulation-based framework to assist with SSP service optimization. More specifically, a discrete event-based simulation tool (i.e., SSP-OPT) with customizable parameters was developed to help plan the optimum patrol routes based on available SSP resources and predicted incidents. The developed tool was tested with roadway traffic and incident data from the Virginia highway network. After model calibration, the simulation results showed that the developed SSP-OPT tool could replicate the patrol routes with similar performance to the field observations, validating the tool. Further, adopting the tool for corridor-level optimization could help to identify the best patrol plan to minimize SSP response time and maximize SSP response rates for a given number of SSP vehicles. The SSP-OPT tool requires minimal user input (e.g., segment lengths, annual average daily traffic) and has the flexibility to be easily applied to any highway corridor once calibrated. The tool generates various performance metrics to enable more informed decision making in SSP route planning.
Keywords
Nonrecurring congestion from incidents is a major concern as it accounts for a significant portion of delays on highways ( 1 , 2 ). To address this, highway operators employ safety service patrol (SSP) programs for improving highway safety and supporting incident management. SSP vehicles can detect and/or respond to incidents when patrolling highways. Their operational and safety benefits have been widely studied and documented. SSP systems can reduce travel delays, fuel consumption, emissions, and secondary incidents ( 3 – 5 ). Previous research also documented direct and indirect high cost–benefit ratios for SSP programs ( 3 , 6 , 7 ).
This study focused on designing SSP routes for a given corridor. Tackling SSP design problems requires dealing with three major considerations. The first step is beat configuration, in which the patrolled corridor is divided into segments, each referred to as a beat. A freeway network is segmented into links, and each link is assigned to at least one beat. The second consideration is the fleet size constraint, which determines the optimal number of SSP trucks required to fully cover the network. Finally, truck allocation decisions are made based on how best to assign SSP trucks to beats to minimize the overall delay caused by incidents. In this study, it was assumed that one truck was assigned to each beat.
Previous research has demonstrated that optimizing SSP schedules could lead to increases in safety and cost reductions ( 8 , 9 ). Daneshgar proposed a mixed-integer programming model for improving SSP effectiveness, measured by reduced incident-incurred delays and operation costs ( 10 ). Similarly, a Florida Department of Transportation study proposed a framework with three mathematical programming models to improve SSP performance through minimizing the average response time and maximizing the social benefits ( 11 ).
This paper aims to build a discrete event-based simulation framework (called SSP-OPT) for optimizing SSP beat designs. System performance was primarily measured in relation to response time and response rate. The proposed methodological framework consists of the following core components: (i) generating alternative beat scenarios matching customized rules; (ii) building an SSP model to simulate the service process with predicted incidents; and (iii) evaluating SSP performance and identifying the recommended beat configuration based on the performance metrics. The first component intends to generate all alternative scenarios for SSP simulation in a corridor with customized rules (e.g., beat lengths, total beat number). The second component develops an SSP operation model to simulate the procedure of an SSP incident response service. For generating incidents within the simulation, hierarchical negative binomial (HNB) models and hierarchical hazard-based duration models for incident frequency and SSP service time durations were estimated, respectively, based on archived incident data. Further, a Monte Carlo (MC) method was utilized to distribute the incidents along the corridor. The third component produces the various SSP performance measures for alternative beat configurations. The SSP simulation model considers various aspects and limitations of past efforts. Model parameters are calibrated based on actual incident data. This simulation-based approach can capture the spatial and temporal variations of incident frequencies and durations at a higher resolution, which enables a more accurate representation of field conditions. The model performs an exhaustive search of all feasible beat configurations. Although the total number of all beat configurations could be extremely large, for typical applications, the number of feasible beats is generally small.
Literature on optimization approaches in relation to SSP operations is reviewed in the following section. Then, the methodology of the simulation framework, which details incident management procedures, the SSP simulation model, and the incident prediction model are explained in the third section. Further, data used in the simulation model test are described and its results discussed in the fourth and fifth sections. Finally, the conclusion and implications are presented.
Literature Review
SSP services have been a vital part of traffic incident management programs over the last two decades ( 12 , 13 ). Owing to the terminology and specific program implementation across different states, SSPs are also referred to as freeway service patrols, courtesy patrols, emergency response units, and motorist assistance patrols ( 14 ).
In the extensive research on evaluating and optimizing the performance of SSP programs, three main approaches are used: mathematical models, simulation methods, and their integration ( 15 – 19 ). Since planning SSP patrolling is a proactive form of incident management, the incident information is unknown. Strategy is therefore typically decided based on historical experience ( 11 ).
Various mathematical methods have been used for the design of SSP programs. For example, Haghani et al. used a mixed-integer programming model to determine the optimal beat configuration and fleet size by minimizing incident-incurred delays while considering operational costs ( 20 ). Yin proposed a minimax bilevel programming model to calculate a fleet allocation that decreases the maximum system travel time that can result from incidents ( 21 ). Yin further formulated a mixed-integer nonlinear programming model to allocate SSPs among beats by optimizing the performance of the SSP system ( 22 ). Moreover, Daneshgar et al. presented two deterministic and probabilistic approaches model for minimizing the average response time to optimize patrol program performance and for determining the best beat configuration among existing beats ( 23 ).
Simulation is another method of SSP optimization. Zografos et al. proposed a framework containing three submodules to help determine SSP policy by minimizing freeway incident delays ( 19 ). Hadi et al. developed a simulation tool to assess the performance of SSP under different operation parameters and impacts of transportation networks ( 15 ). Wu et al. proposed a discrete event-based simulation model to replicate the patrol process of SSPs and test alternative schemes ( 16 ). Pal and Sinha developed a simulation model for configuration design and improving operational performance ( 17 ). Li and Walton built an event-driven simulation model to evaluate and estimate the benefits under different scenarios ( 18 ).
Event-driven simulation modeling has some advantages when compared with analytical models and microscopic simulation ( 18 ). It can provide higher resolution information than analytical models. Moreover, this approach achieves a faster simulating speed than microscopic simulations when the corridor scope is large and the simulation period is long. Some of the existing simulation approaches primarily focus on replicating historical incidents to test the alternative plans, which is limited ( 3 , 16 ). This is because incidents do not occur in exactly the same way as those in archived data. Other simulations utilize samples from archived incident distributions to generate incidents ( 15 , 16 ). Furthermore, a discrete event-driven method for simulating an SSP program and evaluating its performance is lacking in previous efforts. Therefore, in this study, this gap was addressed by implementing a discrete event-driven simulation framework that contains an incident prediction model and SSP operation simulation. This framework enables the evaluation of both existing beat configurations and all possible alternative configurations within the optimized corridor. Overall, the proposed approach has the following advantages:
It generates all alternative feasible beat configurations and their performance measures (e.g., response time, response rate) to allow decision makers to select a configuration that meets their requirements. Since all feasible beat configurations are evaluated in the proposed approach, it does not use a heuristic or an optimization algorithm for finding the best configuration, which typically does not guarantee optimality.
Once calibrated, the proposed model requires minimal input data, which mainly include annual average daily traffic (AADT) and segment lengths. This simplifies application of the model to various corridors to determine the optimal beat configurations.
It captures the spatial and temporal variations of incident frequencies and durations at a higher resolution, which enables a more accurate representation of field conditions. The model allows simulation of any portion of a weekday or weekend (at a resolution of 1 h), which facilitates designing SSP route schedules for different shifts in a day.
Methodology
SSP Simulation Framework
The overall framework of the SSP-OPT tool is shown in Figure 1. The simulation-based approach captures detailed performance data and complex dependencies. User input can be classified into three categories, which include simulation scenario criteria (e.g., beat lengths and numbers), model operational settings (e.g., SSP service period, weekend or weekday selections, incident waiting time threshold, simulation runs, the weighting factor for the output), and corridor data for incident prediction (e.g., road segment, milepost, AADT, district and route name).
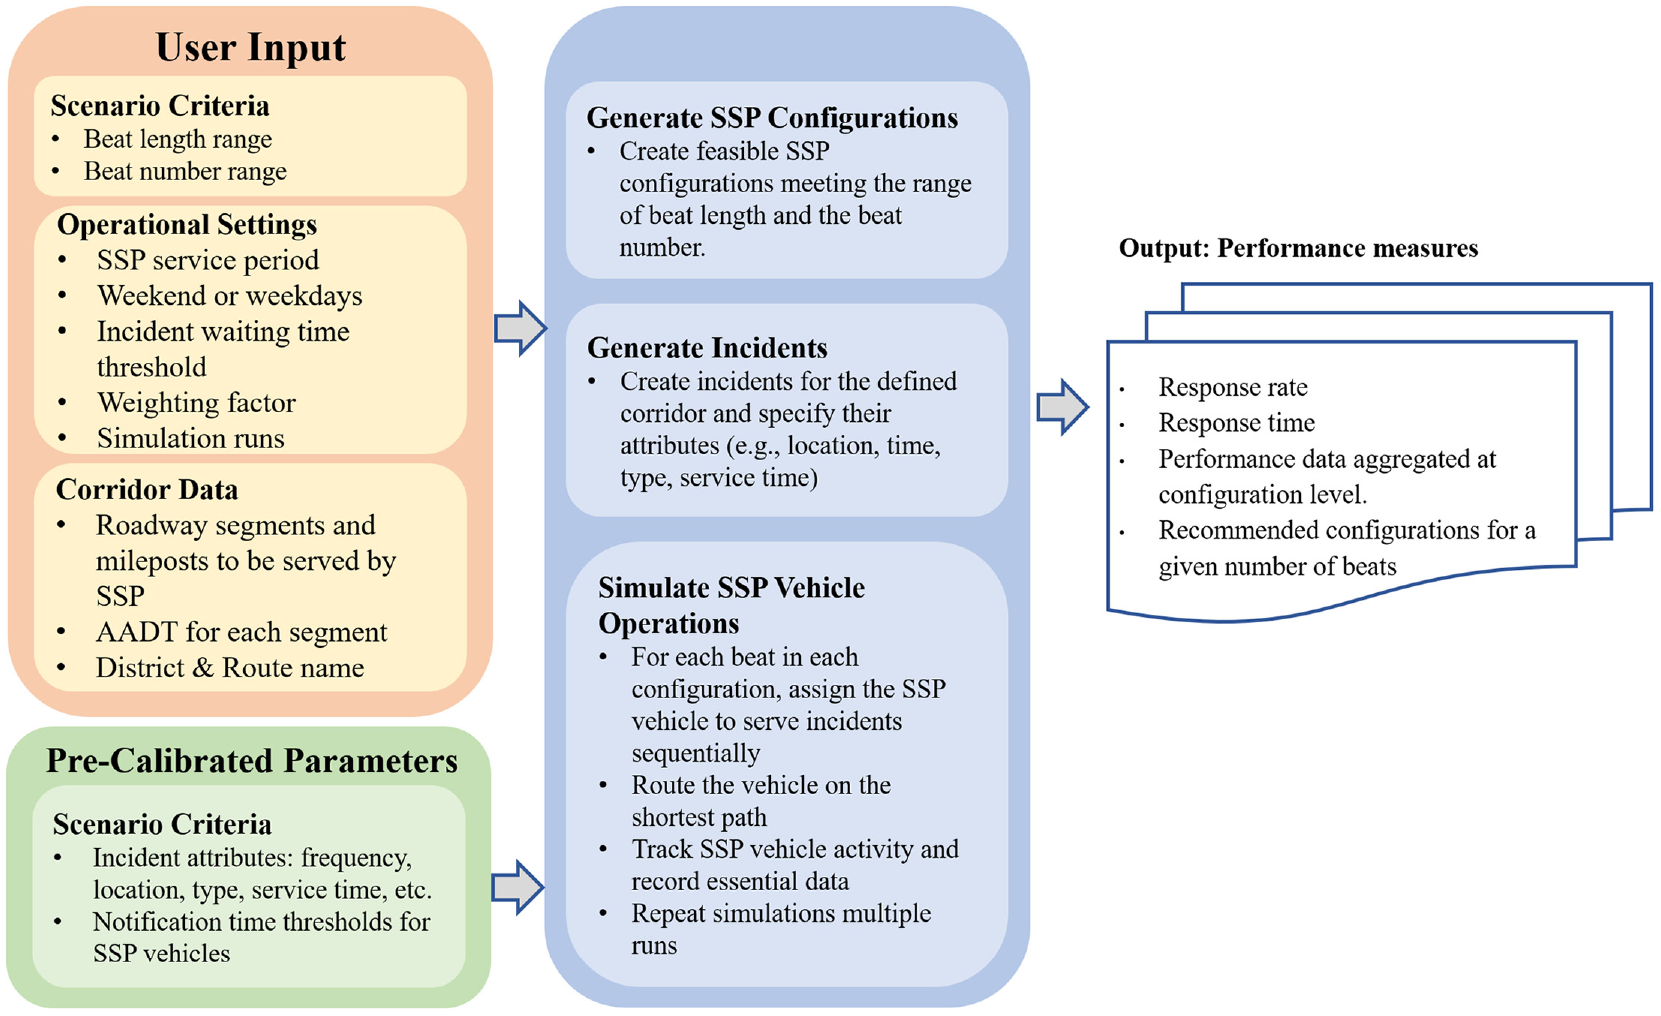
Key components of the SSP-OPT tool.
For the simulation module, three main components are integrated: SSP configuration creation, incident generation, and SSP vehicle operations. After the simulation is finished, performance metrics for each beat are measured and aggregated to evaluate the overall performance. In this section, we provide details of the methodology for SSP configuration generation, SSP vehicle operations simulation, model calibration, and performance measurement.
Generating Alternative SSP Configurations
For a given corridor consisting of multiple segments, there may be numerous ways of designing SSP routes and scheduling vehicles. For example, assume a 25-mi corridor needs to be partitioned into nonoverlapping beats (the term “beat” refers to an SSP route), each to be served by one SSP vehicle, and there is a turnaround point at each milepost. Without imposing a lower or upper bound on beat lengths, there are 16,777,216 unique ways to partition this corridor. The majority of these include beats that are just 1- or 2-mi long. If beats shorter than 4 mi are eliminated, we will be left with only 476 possible beat configurations. This example shows that the problem size can be reduced dramatically once unrealistic scenarios are eliminated. This section describes how all feasible beat configurations are generated for the simulation as input. Once performance metrics are computed for all these feasible SSP beat configurations, the best or optimum configurations can then be identified. This exhaustive search approach eliminates the need for approximate search algorithms (e.g., genetic algorithms).
All beat configurations are based on the turnaround points or interchange mileposts. Once the start milepost and end milepost are selected for the corridor to be optimized, all possible beat configurations are generated by grouping the interchanges between the start and end points based on the milepost information. In this paper, interchanges where the SSP vehicle can make a U-turn are considered to be turnaround points. For example, if there are N interchanges in the corridor, the number of intermediate interchanges between the start and end points are N-2, and the total possible beat configurations can be computed by the combination formula given in Equation 1 where K is total number of beat configurations, M is maximum number of beats selected for this corridor, n is number of intermediate interchanges defining the boundaries of the beats, and N is total number of interchanges. In the simulation program, the total possible beats are generated by Equation 1 and infeasible ones (those shorter or longer than the thresholds defined by the user) are eliminated so that the problem size is manageable.

Incident Generation
Incidents and their characteristics, such as location, occurrence time, and type, are needed as input for the simulation model. The first step is to estimate the total count of incidents for each segment making up the corridor being analyzed. This is accomplished by using an MC method to generate incidents from the incident prediction model (i.e., HNB model) described below. For these generated incidents, various attributes need to be specified so that they can be adequately simulated. Some of these attributes include incident type, time of day the incident occurs, and SSP service time. SSP service time refers to the amount of time it takes for the SSP vehicle to service the incident after arriving on the scene. Service time is generated by using the duration model (i.e., hierarchical Weibull model) described below. The duration model requires certain input variables (e.g., time of day, incident type, season), and the values for these are randomly sampled based on the distributions of the empirical data obtained from Virginia Department of Transportation (VDOT) for years 2017 to 2019. Since such distributions may vary across different VDOT districts and routes, these distributions are calculated for different groups based on VDOT districts and route names.
For the incident prediction, incident frequencies are modeled by HNB approach (
24
). For the HNB model, the probability of observed incident frequency is

where exp
Hierarchical hazard-based duration models (
25
) are specified to predict the SSP service time for each incident. Specifically, the service time,

where the intercept and coefficients vary by the group identifier,
Further, MC methods are utilized to generate incidents from the incident prediction models developed above to make the incident generation process more flexible. To capture the distribution of incidents across the days, weekdays and weekends are considered. Figure 2 shows the process of generating incidents by the MC method. The first step is to obtain the empirical distributions of contributing factors,
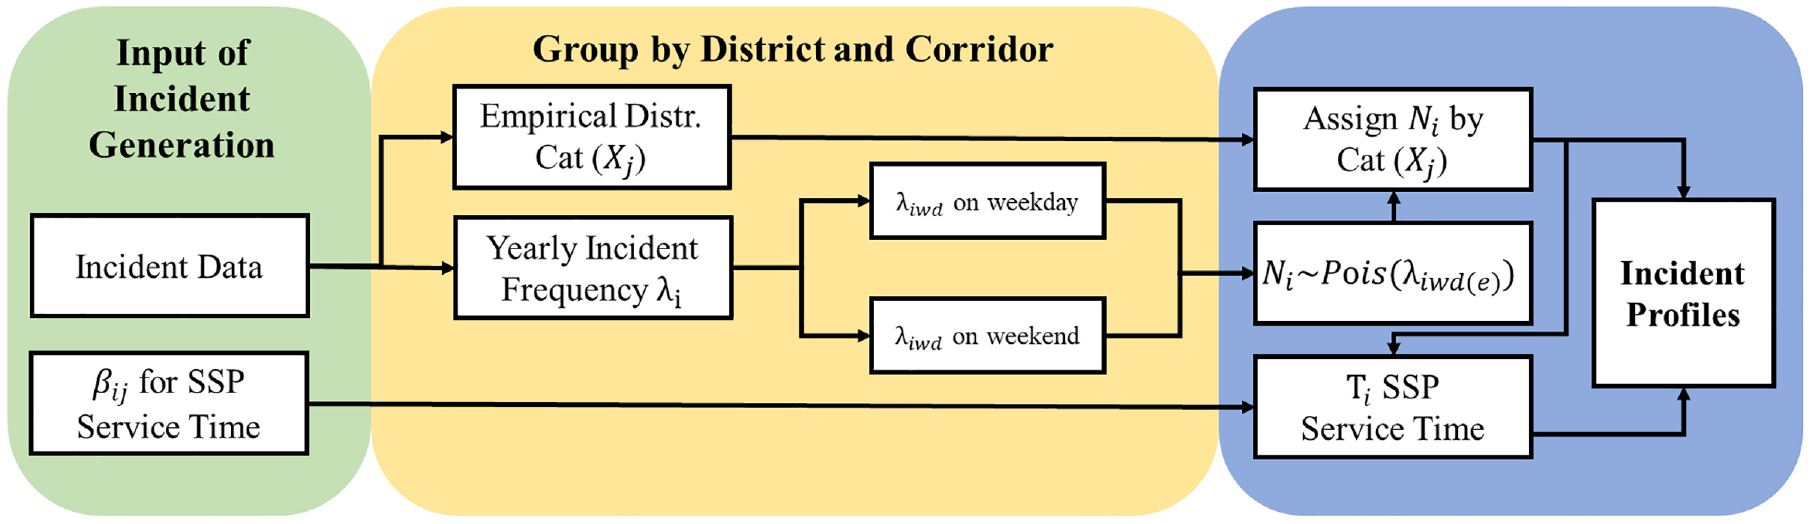
Realistic artificial incident generation process.
SSP Simulation
SSP simulation logic is presented in the flowchart in Figure 3. After a beat configuration scenario and incidents are generated, the SSP vehicle profile, which contains the SSP vehicle speed and location, is initialized. When an incident occurs, the simulation will check the SSP’s working status while SSP vehicles are patrolling. If an SSP vehicle is available in the vicinity of the incident, then an SSP will be dispatched to the incident location. In addition, if the incident is in the opposite direction, the SSP vehicle is directed to the nearest interchange to turn around to get to the incident scene (e.g., if the incident happens in the southbound direction, and the SSP is patrolling the northbound direction, the SSP is instructed to turn around using the nearest interchange). When an SSP vehicle is notified to respond to an incident, but it is serving another incident, then the incident will remain in waiting mode until this SSP vehicle is available. If the waiting time exceeds a specific threshold, the SSP service request for this incident will be canceled. If there is no incident when the SSP vehicle becomes available, it will resume patrolling the beat it is assigned to. All incidents in each beat are simulated for all beat configurations.
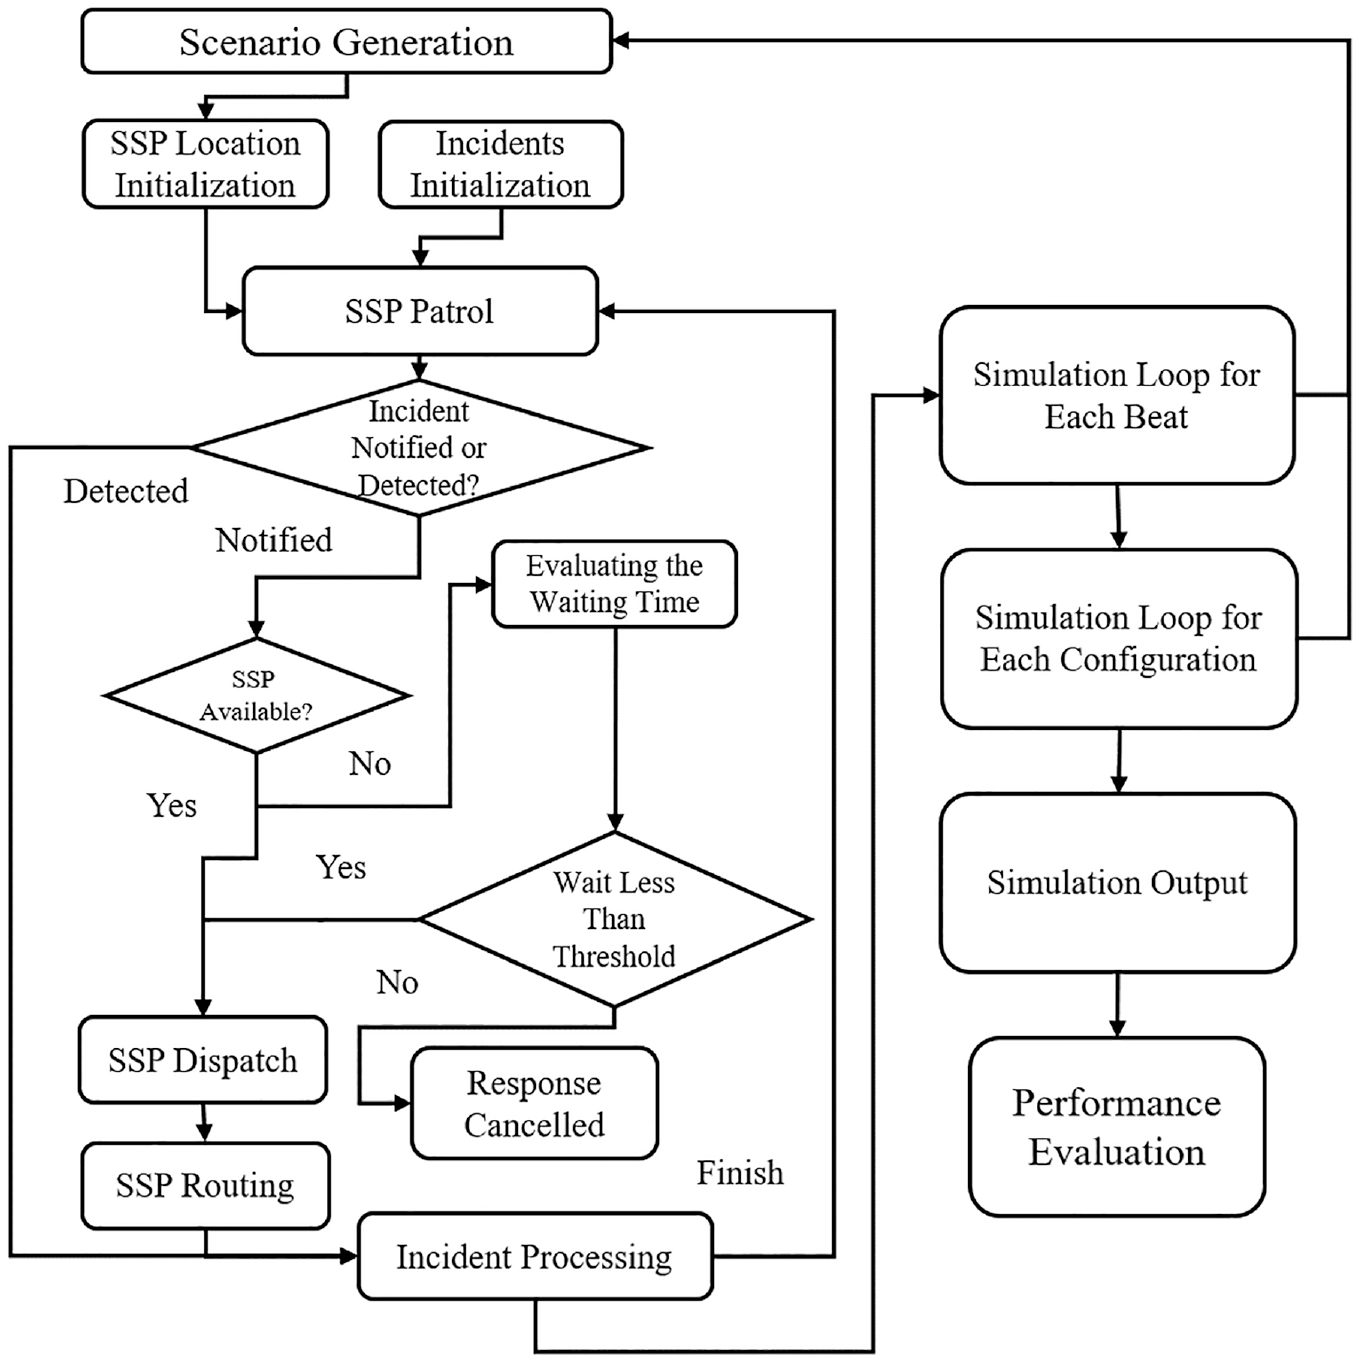
Flowchart of safety service patrol (SSP) operation in simulation.
In reality, not all incidents are detected by SSP or assigned immediately when they occur: other sources, such as CCTV cameras and Virginia state police, can also detect incidents. In the simulation, the SSP vehicle will be notified after a certain time (called “notification time”) instead of being notified immediately. This allows the SSP vehicle to detect incidents in the simulated beat as it is patrolling. From the data records, a significant percentage of incidents (especially disabled vehicles) are detected by SSPs, therefore, the notification time needs to be calibrated for the incident type so that the simulation yields incident detection rates by SSPs that are consistent with field observations. The waiting time threshold is another parameter that needs to be calibrated. The calibration for the notification time (or waiting time threshold) is presented in the results section.
SSP Performance Measurement
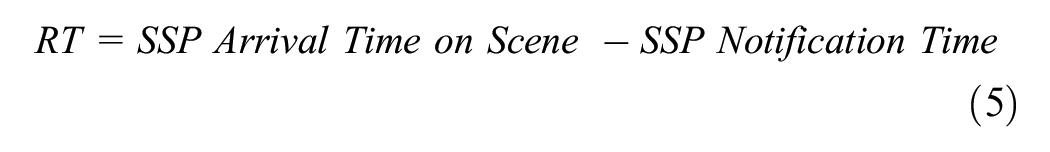
Two main metrics, response time (RT) and response rate (RR), are used to evaluate the performance of SSPs in alternative beat configuration designs. RT is measured from the time the SSP operator was notified to the time the SSP vehicle arrives on the scene of the incident. RR measures the percentage of incidents that are responded to by the SSP out of the total number of incidents. Two additional metrics, response time-2 (RT2), and service time utilization (TU), are used in the performance evaluation. RT2 is defined as the duration between incident occurrence and the time the SSP vehicle arrives on scene, which can provide insights into the additional time required by the SSP operator to process the incident after being notified. Data for RT2 cannot generally be collected in the field because the exact incident occurrence times are unknown, but this information is available in the simulation. TU is used to measures the effectiveness of SSP utilization. This is calculated by the fraction of time during which the SSP vehicle is responding to and attending incidents in relation to the total patrolling time (or shift time).
In the simulation, these four metrics (RT, RR, RT2, and TU; Equations 4 to 7) are aggregated at beat configuration level for the optimized corridor. After collecting the output data, normalized RR and RT are computed by using data from all beat configurations with the same number of beats. As the simulation goal is to minimize the RT and maximize RR, the weighted composite score is defined based on the normalized RR and RT in the evaluation. The equations for these normalized metrics are presented in Equations 8 to 10. The minimum and maximum values are computed based on the performance metrics of the configurations belonging to the same number of total beats.


Simulation Model Parameter Calibration
Since important parameters in the SSP operation model such as notification time thresholds, SSP speed, and waiting time cannot be obtained directly from the field data, they need to be calibrated indirectly by comparing the SSP-OPT model outputs to field data.
Notification Time Threshold Calibration
The simulation models were run under varying notification times, and the SSP detection rates were recorded for the two incident types considered (i.e., disabled vehicles and crashes, which constitute more than 90% of all incidents) and compared with the field observations. The goal is to match the observed detection rates as closely as possible. Since the detection rates and situations for the two incident types are significantly different, the notification time thresholds need to be set to different values. An example is presented in Figure 4. As the notification threshold (x-axis) increased, the detection rate also increased as expected, eventually approaching 100%. The field observations are marked with horizontal dash lines. The notification times that produce the closest values to the field data are indicated on the figures for this sample beat, and this process is repeated for all the other beats. The optimum value selected for calibration,

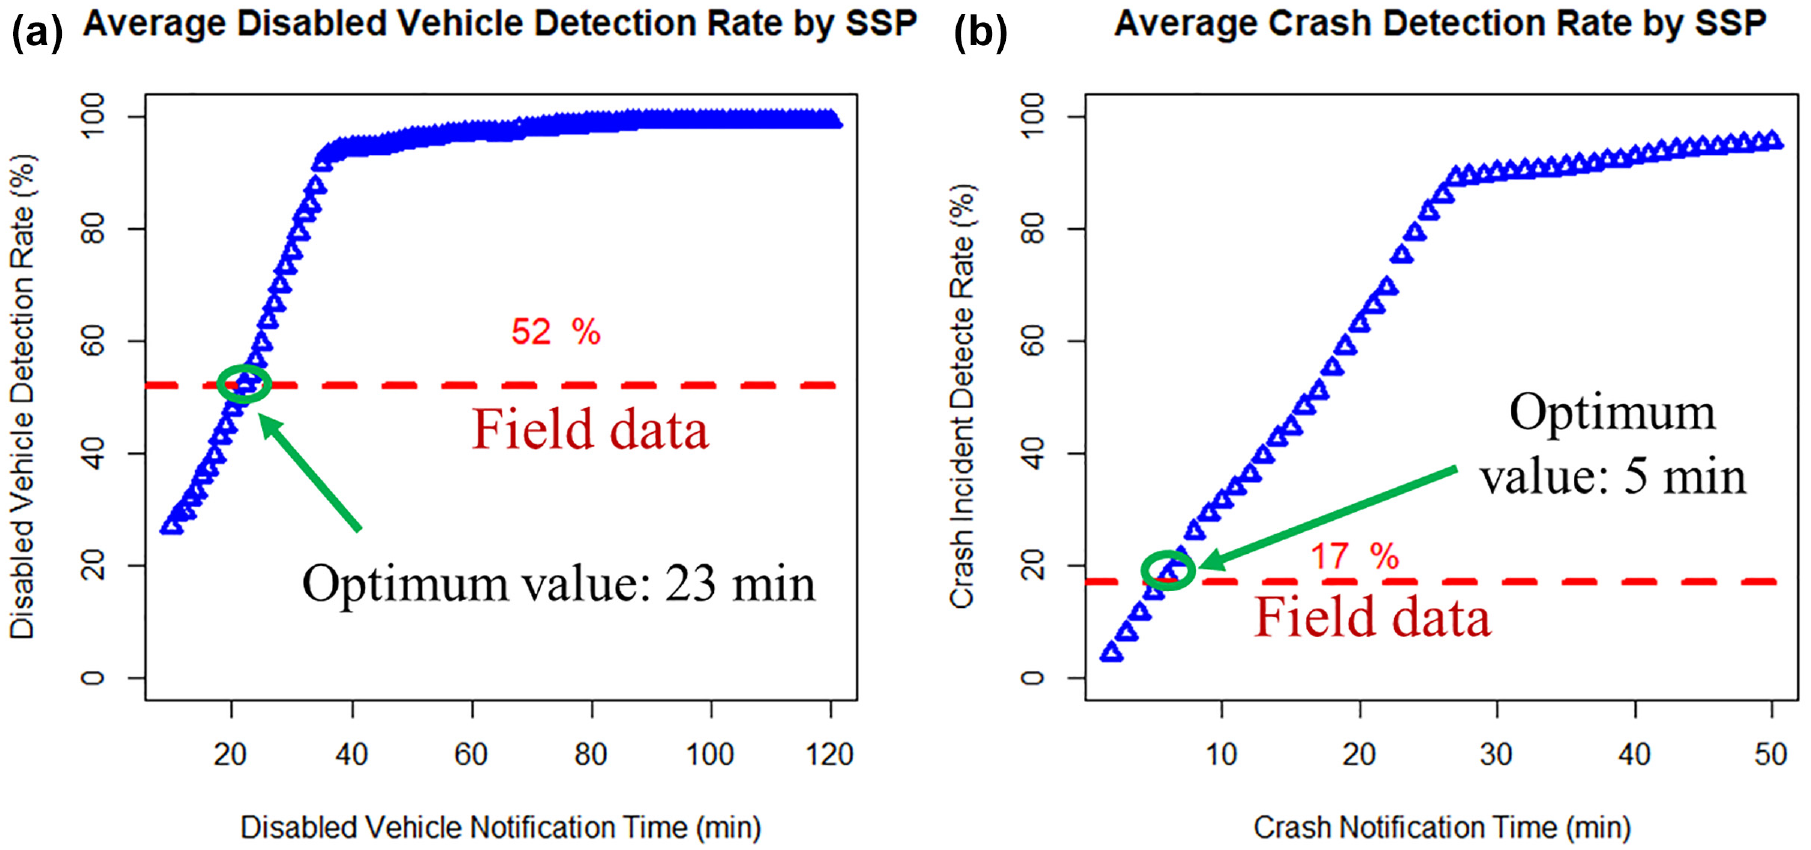
Example of notification time calibration for (a) disabled vehicle and (b) crash.
SSP Speed and Waiting Time Calibration
For calibrating the speed of the SSP vehicle and the waiting time threshold, the SSP operations are tested on the different beats with different speed and waiting time values. The differences between field data and simulation results, in relation to RT and RR, are used as the error measure shown in Equation 12.

Waiting time is selected based on the error values. Moreover, existing research shows that in different regions, SSP operational situations differ ( 4 , 12 ). The speed values are determined based on the lowest errors as well as the geographic locations of the different beats used in the calibration. The recommended speed values are then categorized as follows: urban or congested corridors, rural corridors, and suburban corridors.
Data and Assumption
This study used traffic volume information obtained from VDOT and incident data from two incident management systems for model development. Three years (2017 to 2019) of incident data were selected to avoid the potential effects of the COVID-19 pandemic on typical traffic patterns. The Advanced Transportation Management System (ATMS) dataset provides detailed information about SSPs and other agents (e.g., Virginia State Police) responding to each incident. The statewide Virginia Traffic System (VaTraffic) dataset contains the longitude and latitude information for each incident. Therefore, we used the VaTraffic dataset to model incident frequencies along the SSP corridors, while the matched dataset (i.e., VaTraffic and ATMS) was extracted to measure SSP service time. An example is shown in Figure 5 to illustrate the main timestamps used for model calibration and testing. In this example, following notification, the RT for the SSP vehicle is 2 min, then the SSP takes 9 min to process the incident.
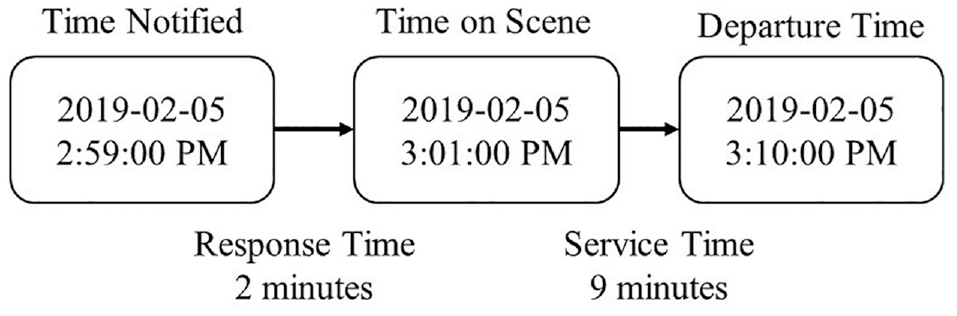
Sample timestamps from the database for an incident responded by an safety service patrol (SSP) vehicle.
Four types of incidents were selected: disabled vehicles, traffic crashes, disabled tractor-trailers, and vehicle fires, which accounts for about 90% of incidents in the VaTraffic dataset. With further analysis, it was found that 93.38% of incidents were responded to by only one SSP vehicle, whereas only 6.62% needed multiple SSP vehicles for the four types of incidents. Given the relatively small percentage of incidents requiring multiple SSP vehicles, in this study, only one SSP vehicle scenario was considered for each beat in the simulation logic.
The service time and RR for different types of incidents responded to by SSP are summarized in Figure 6, a and b . As shown in Figure 6a, disabled vehicles and disabled tractor-trailers had similar SSP service times, and traffic crashes and vehicle fires had similar SSP service times, too. In addition, Figure 6b shows the temporal distributions of SSP RRs for the selected incident types along the SSP corridors. It was clear that SSP RRs for traffic crashes and vehicle fires had similar temporal patterns with significant temporal variation according to the time of day. In contrast, RRs for disabled vehicles and disabled tractor-trailers were also similar for different times of day but with higher SSP RRs and lower temporal variations than for traffic crashes and vehicle fires. Based on these observations, in this SSP simulation, disabled vehicles and disabled tractor-trailers were combined into one category, “disabled vehicle,” whereas crashes and vehicle fires were combined into another category called “crash.” This reduced the complexity of the simulation logic and the amount of output data.
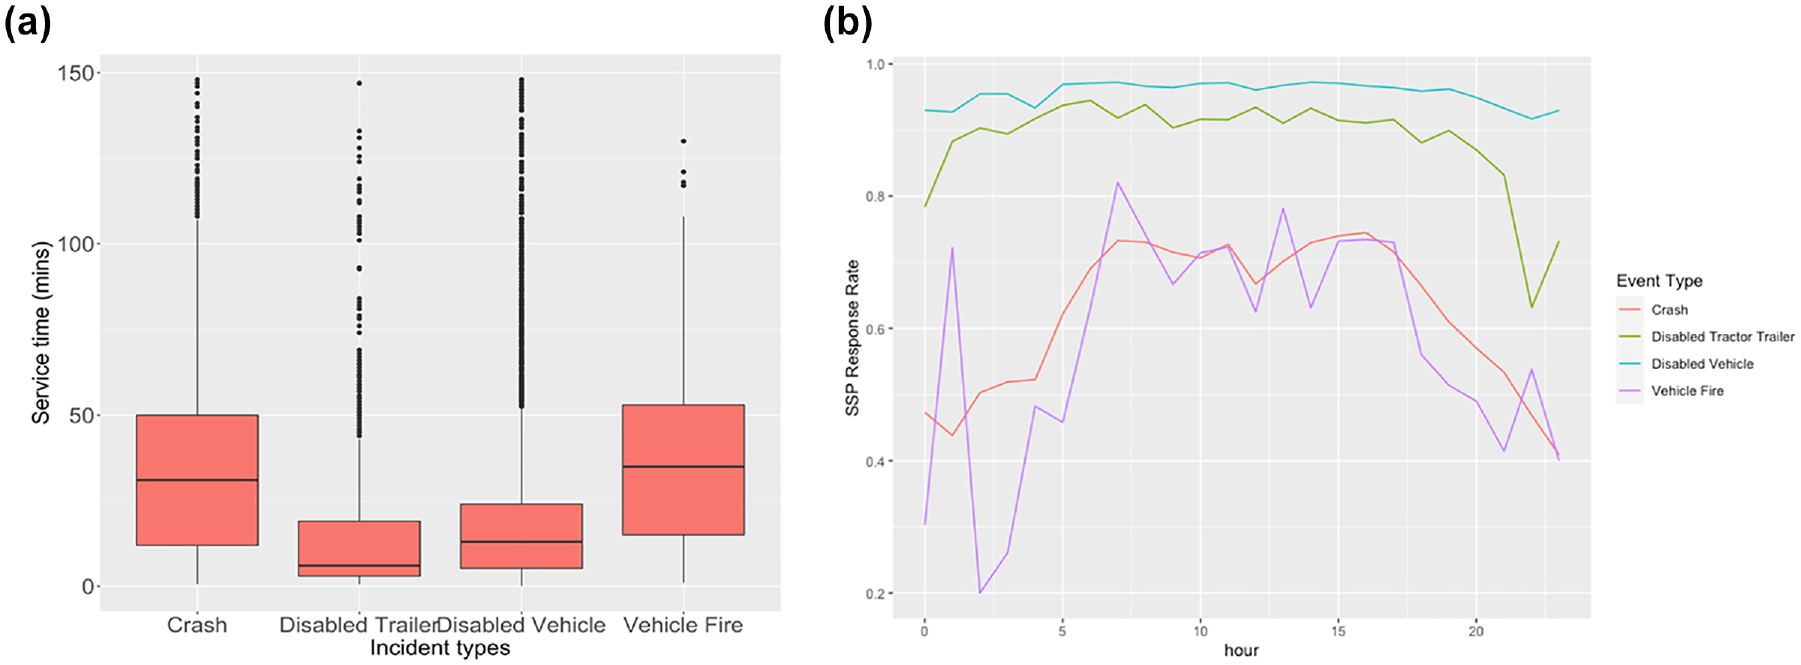
(a) Safety service patrol (SSP) service times and (b) SSP response rates for incidents along SSP corridors (2017 to 2019).
Other assumptions for the SSP simulation process are summarized below.
Two incident types are assumed to follow different categorical distributions for different VDOT districts and corridors.
The time of the day also follows categorical distributions and incident occurrence times within each hour following uniform distributions.
The exact locations of incidents are assumed to be uniformly distributed within the start and end mileposts of each road segment.
Based on the incident datasets (2017 to 2019), the average SSP response rate for crashes along the SSP corridors is around 87%. Therefore, 15% of crash incidents are selected randomly and excluded for each day based on the data analysis, since they may not require an SSP vehicle.
SSP rest time is not considered in this simulation. Each SSP vehicle patrols its beat continuously for the selected shift.
Simulations are conducted for each beat independently of others.
Results and Discussion
Calibration Results
In SSP operation model calibration, the matched incident data from 2019 for seven beats on I-95 and three beats on I-81 were selected as samples to calibrate the relative SSP parameters. The beats’ locations on the map are shown in Figure 7. Incidents for each day were generated in the simulation with their observed occurrence times, locations, and service times during the calibration process. All 10 beats were simulated for 1 year, and the results were collected and analyzed for parameter calibration. The field data used in calibration from these 10 beats are summarized in Table 1. It should be noted that the number of samples (incidents) observed on Beats 8, 9, and 10 are smaller than those from the other beats.
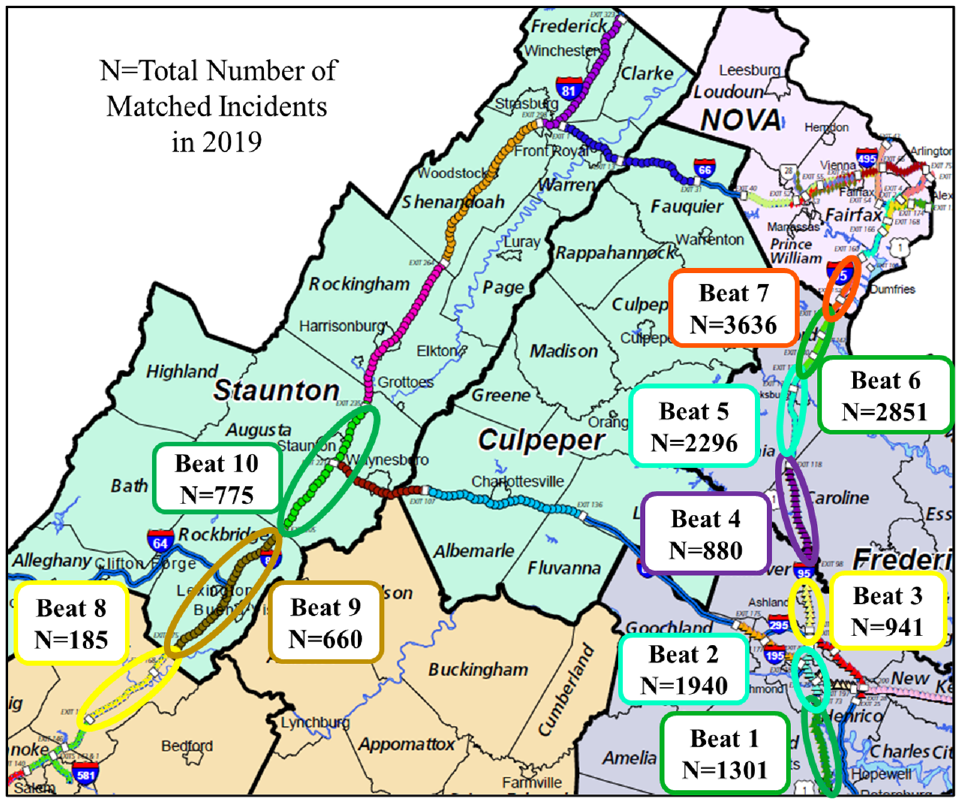
Map of ten selected beats for model calibration.
Summarized Incident Information for Ten Calibration Beats
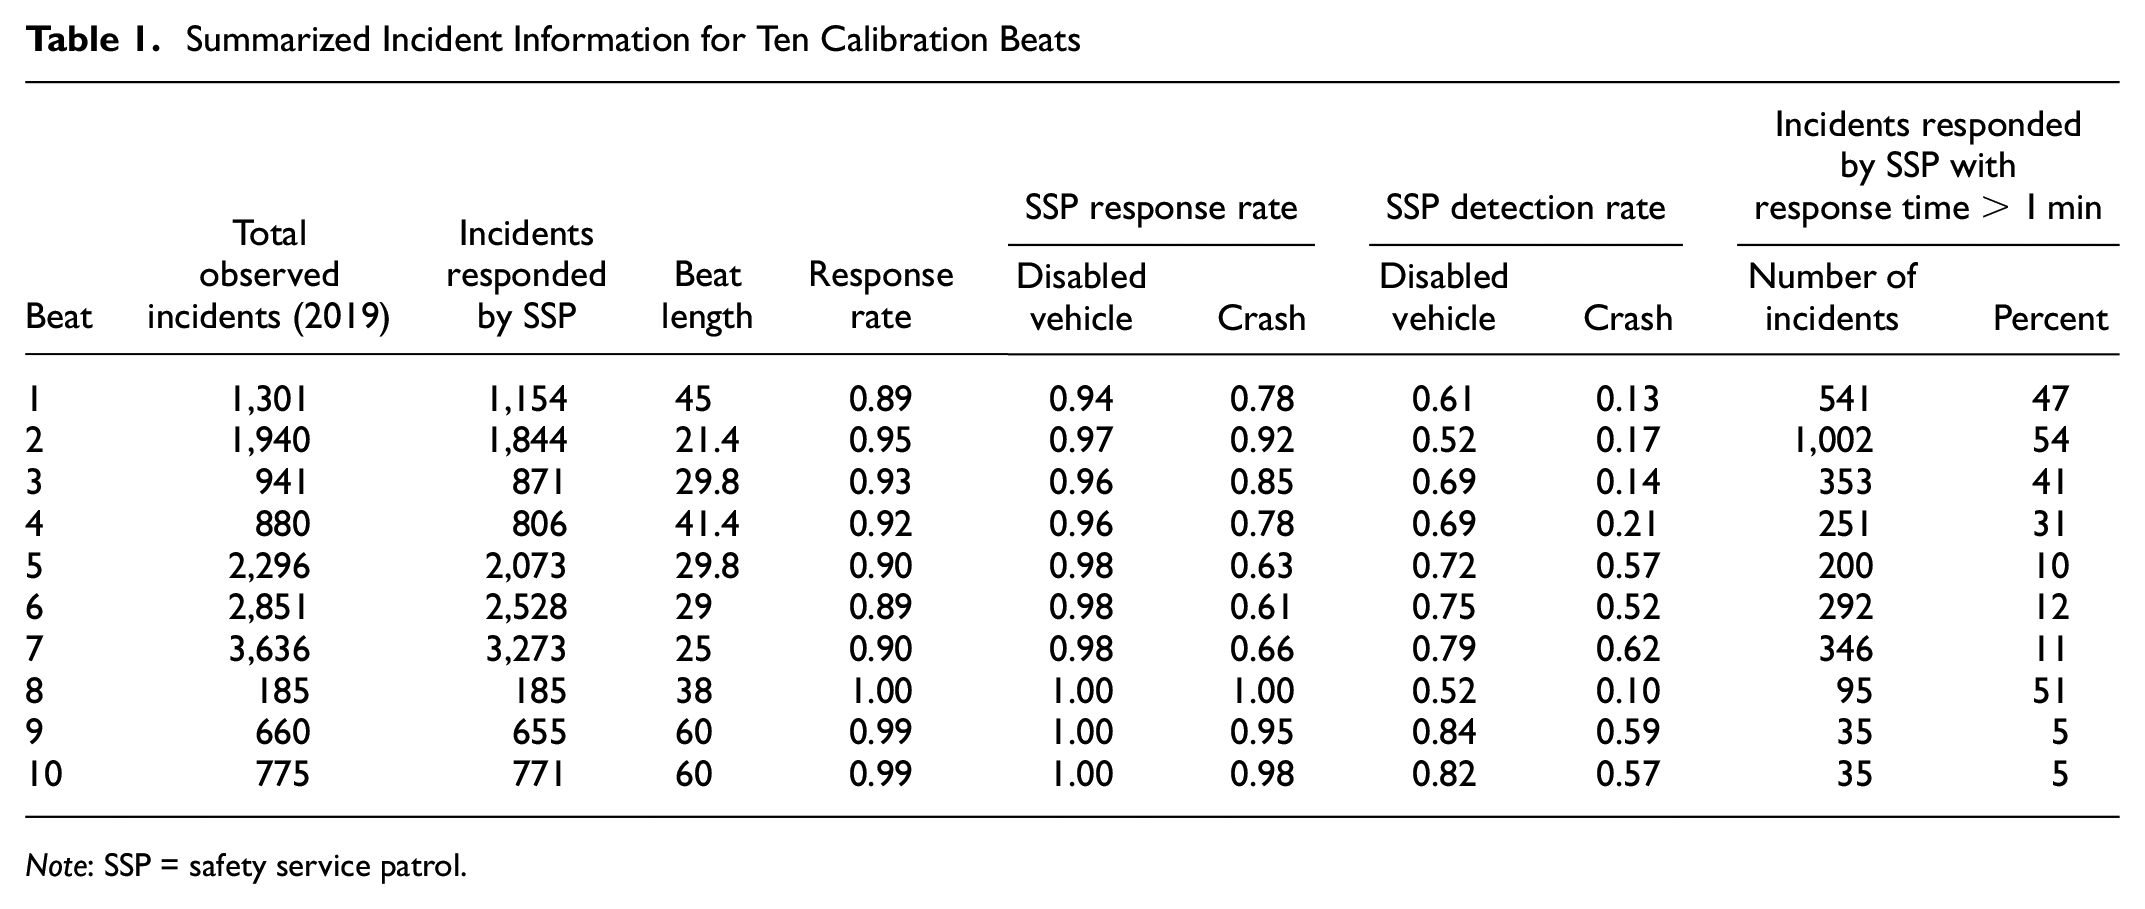
Note: SSP = safety service patrol.
From the table, the detected incidents can be classified into two groups: the first part represents incidents detected by SSPs directly and the second part contains incidents detected by any other source. In general, the RT is expected to be close to zero in the field data if an incident is detected by SSPs. So, we assume that incidents detected by other resources where the SSP response times are less than 1 minute are also treated as detected by SSP in the simulation. (e.g., SSP may be on the scene with other resources together but not recorded as such). The results are shown in Figure 8. Given the relatively strong correlation between the calibration values and beat length, a linear regression line with zero intercept was fit to the data (this approach prevents negative values for notification time occurring when beat lengths are short).
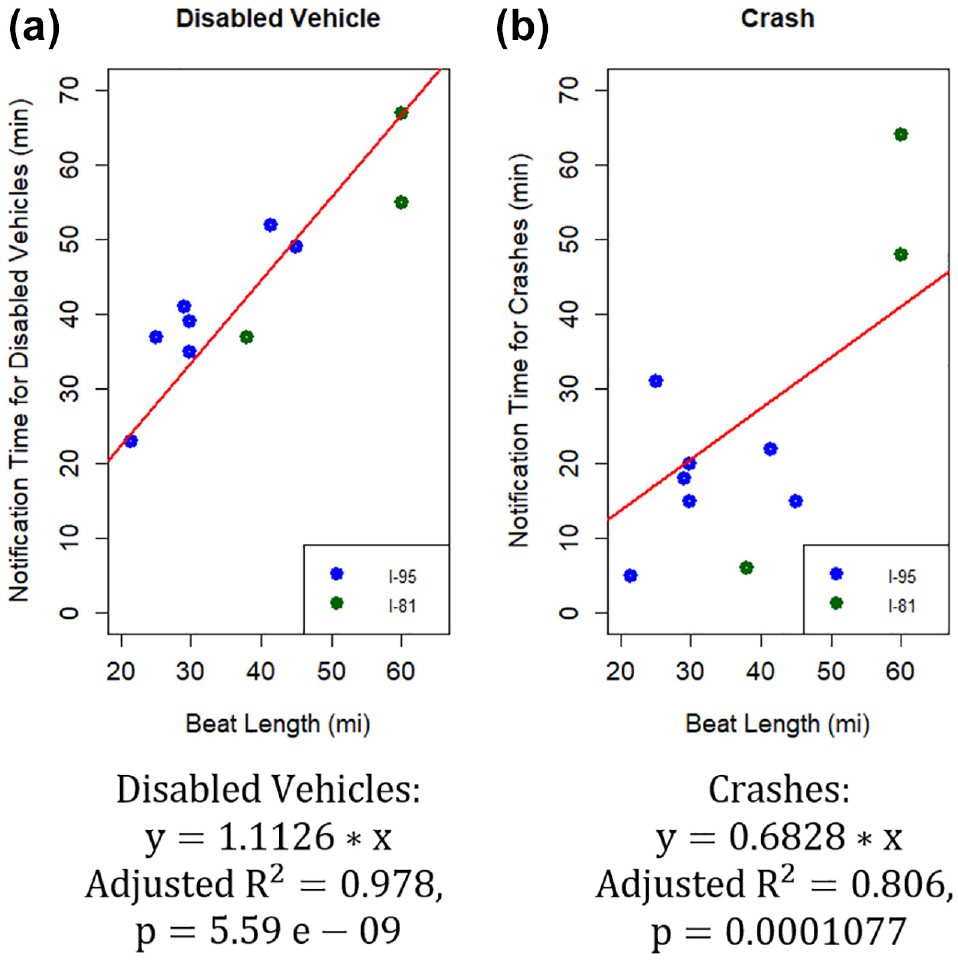
Notification time regression results for (a) disabled vehicles and (b) crashes.
For SSP vehicle speed and waiting time calibrations, the error results for each beat are summarized as heatmaps, in which the rows represent the speed (mi/min), and columns the waiting time (min). As shown in Figure 9, the lowest errors of speed are indicated by red rectangles. It is obvious that no single speed value was optimal for all beats. After considering the geographic location of the 10 selected beats (Figure 7) and analyzing the errors in Figures 9 and 10, three SSP vehicle speeds in different regions in the simulation were determined as follows:
Urban or congested corridors: 35 mph (0.58 mi/min);
Rural corridors: 60 mph (1.0 mi/min); and
Suburban corridors: 45 mph (0.75 mi/min).
Waiting time did not show a strong trend based on the results in Figures 9 and 10. If the waiting time is set to a low value (e.g., 10 min) more incidents will be omitted from the SSP service and lead to a worsened RR. However, a large value (e.g., 60 min) leads to errors in RT increasing and is therefore not optimum either. Based on these factors, the waiting time threshold in the simulation was set to a default value of 30 min.
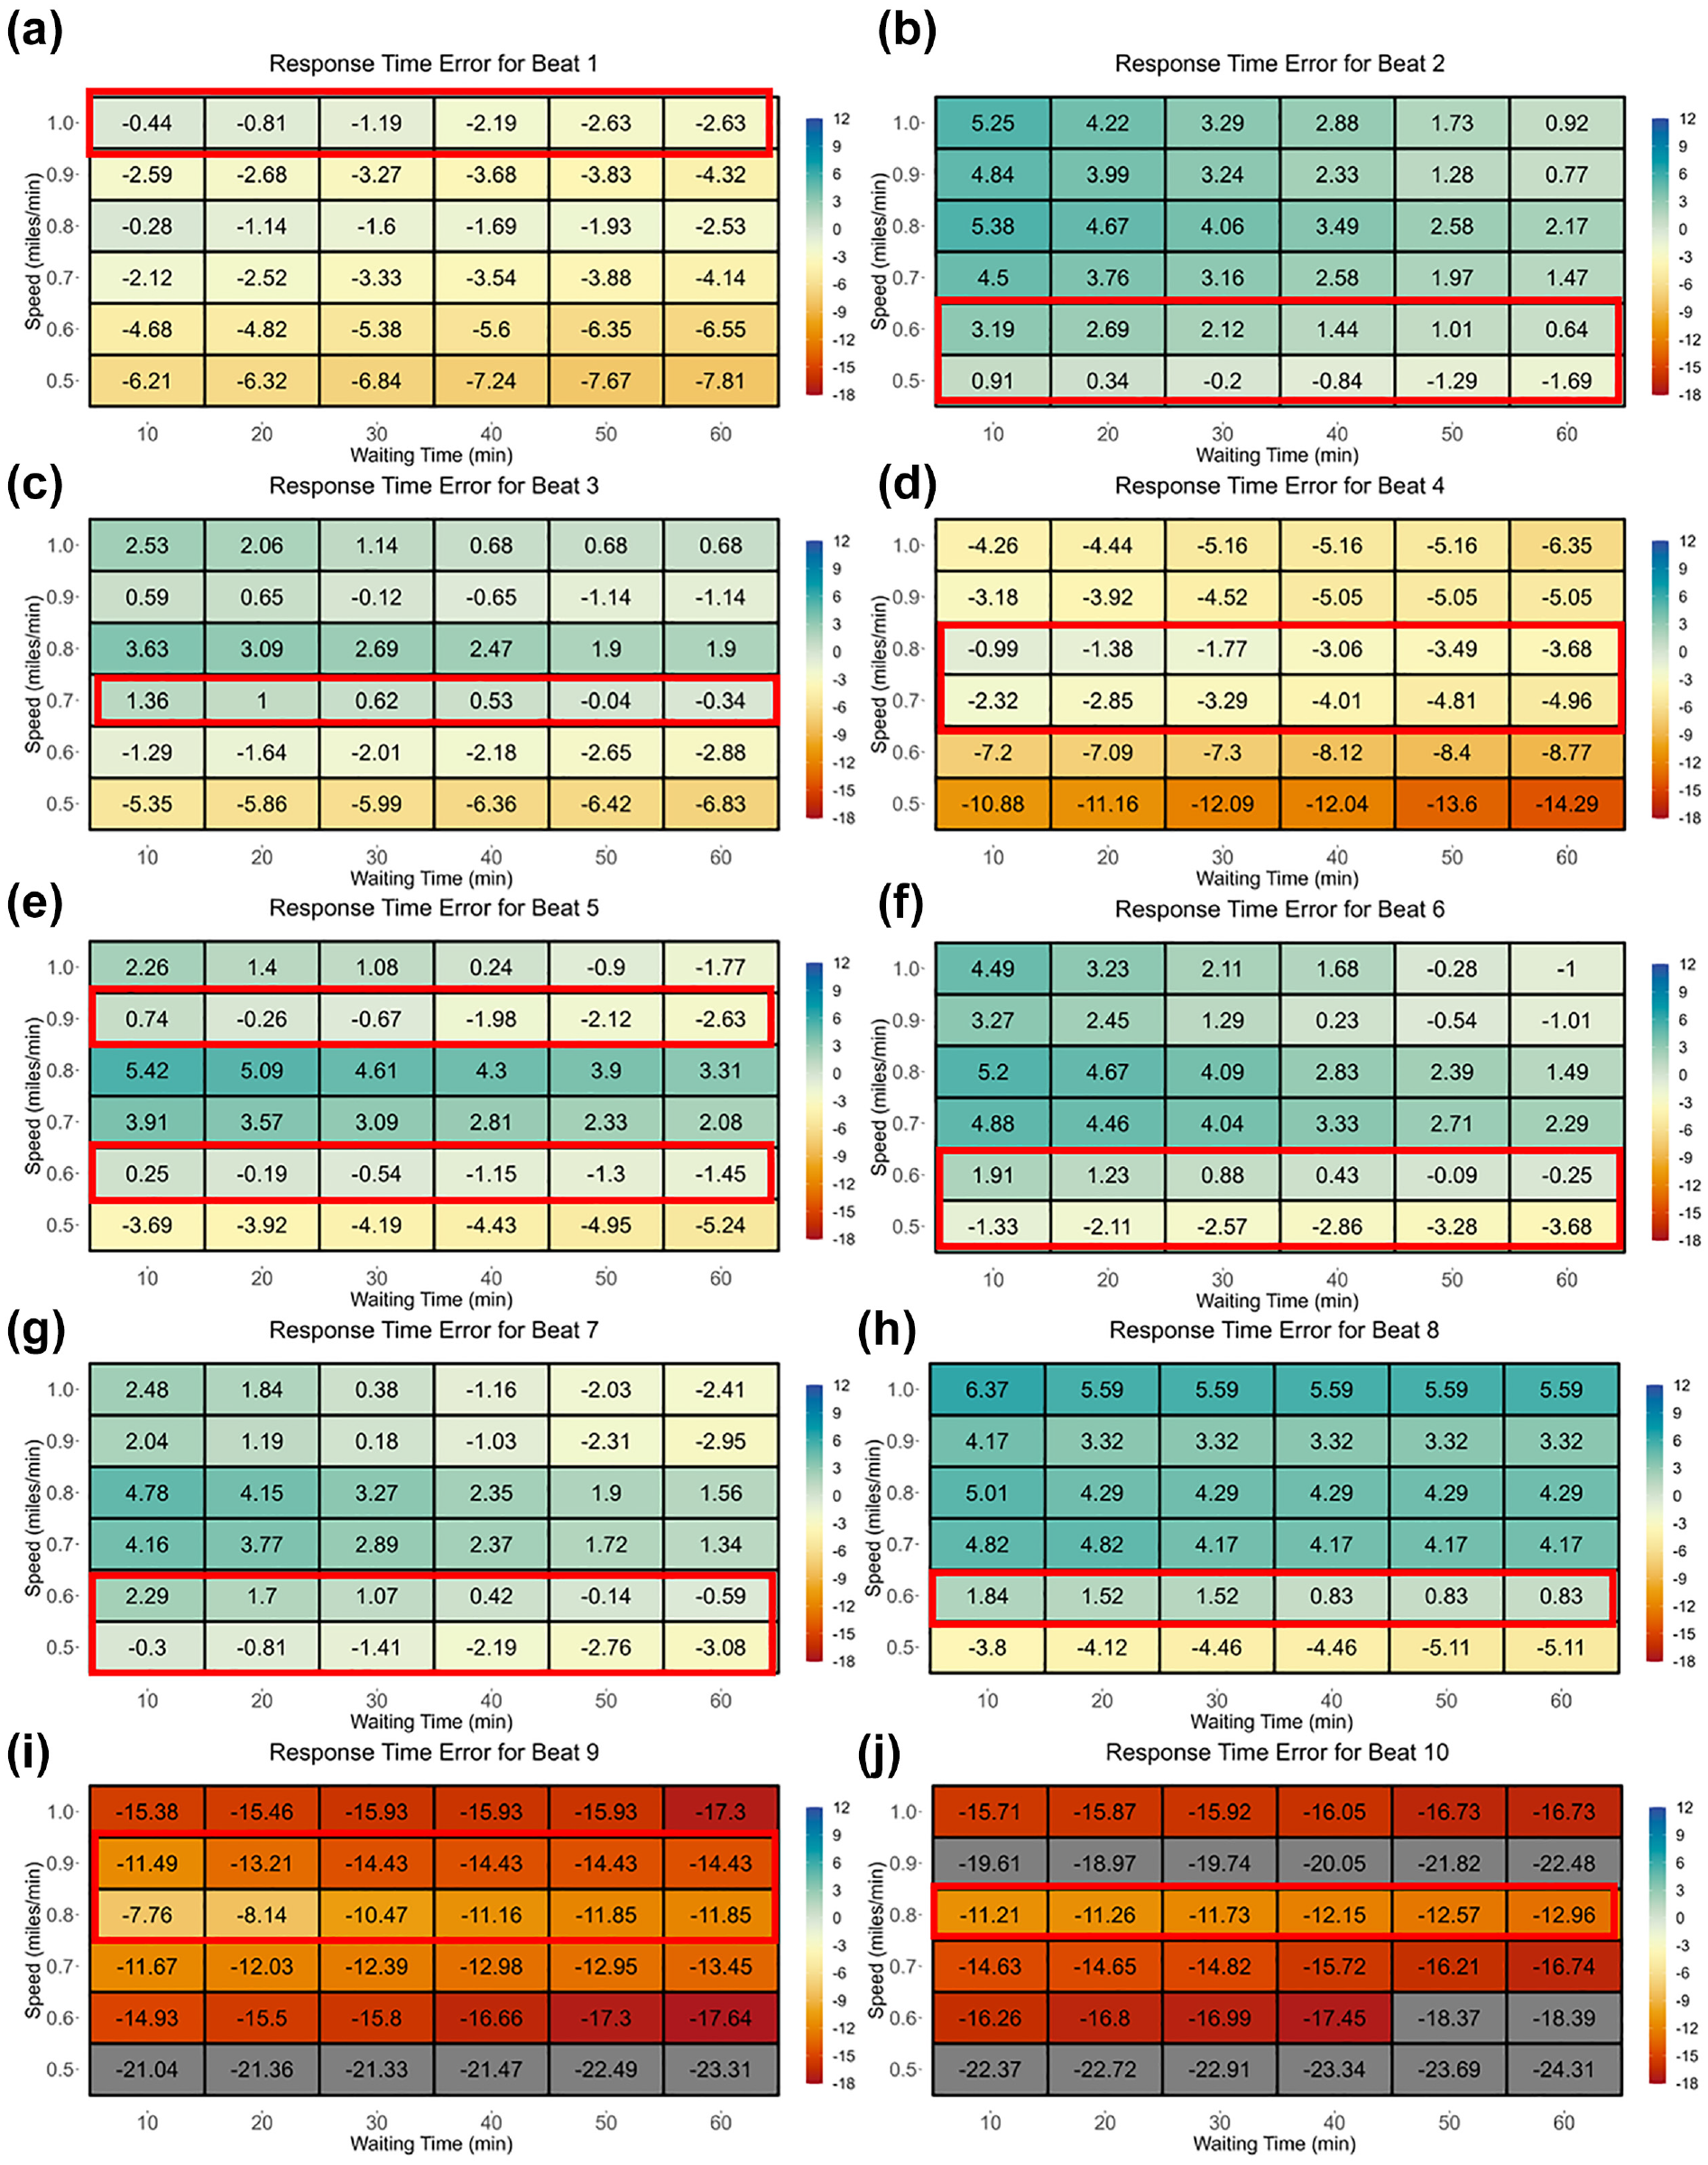
Heat maps of response time error for ten beats: (a) to (j) for Beats 1 to 10, respectively.
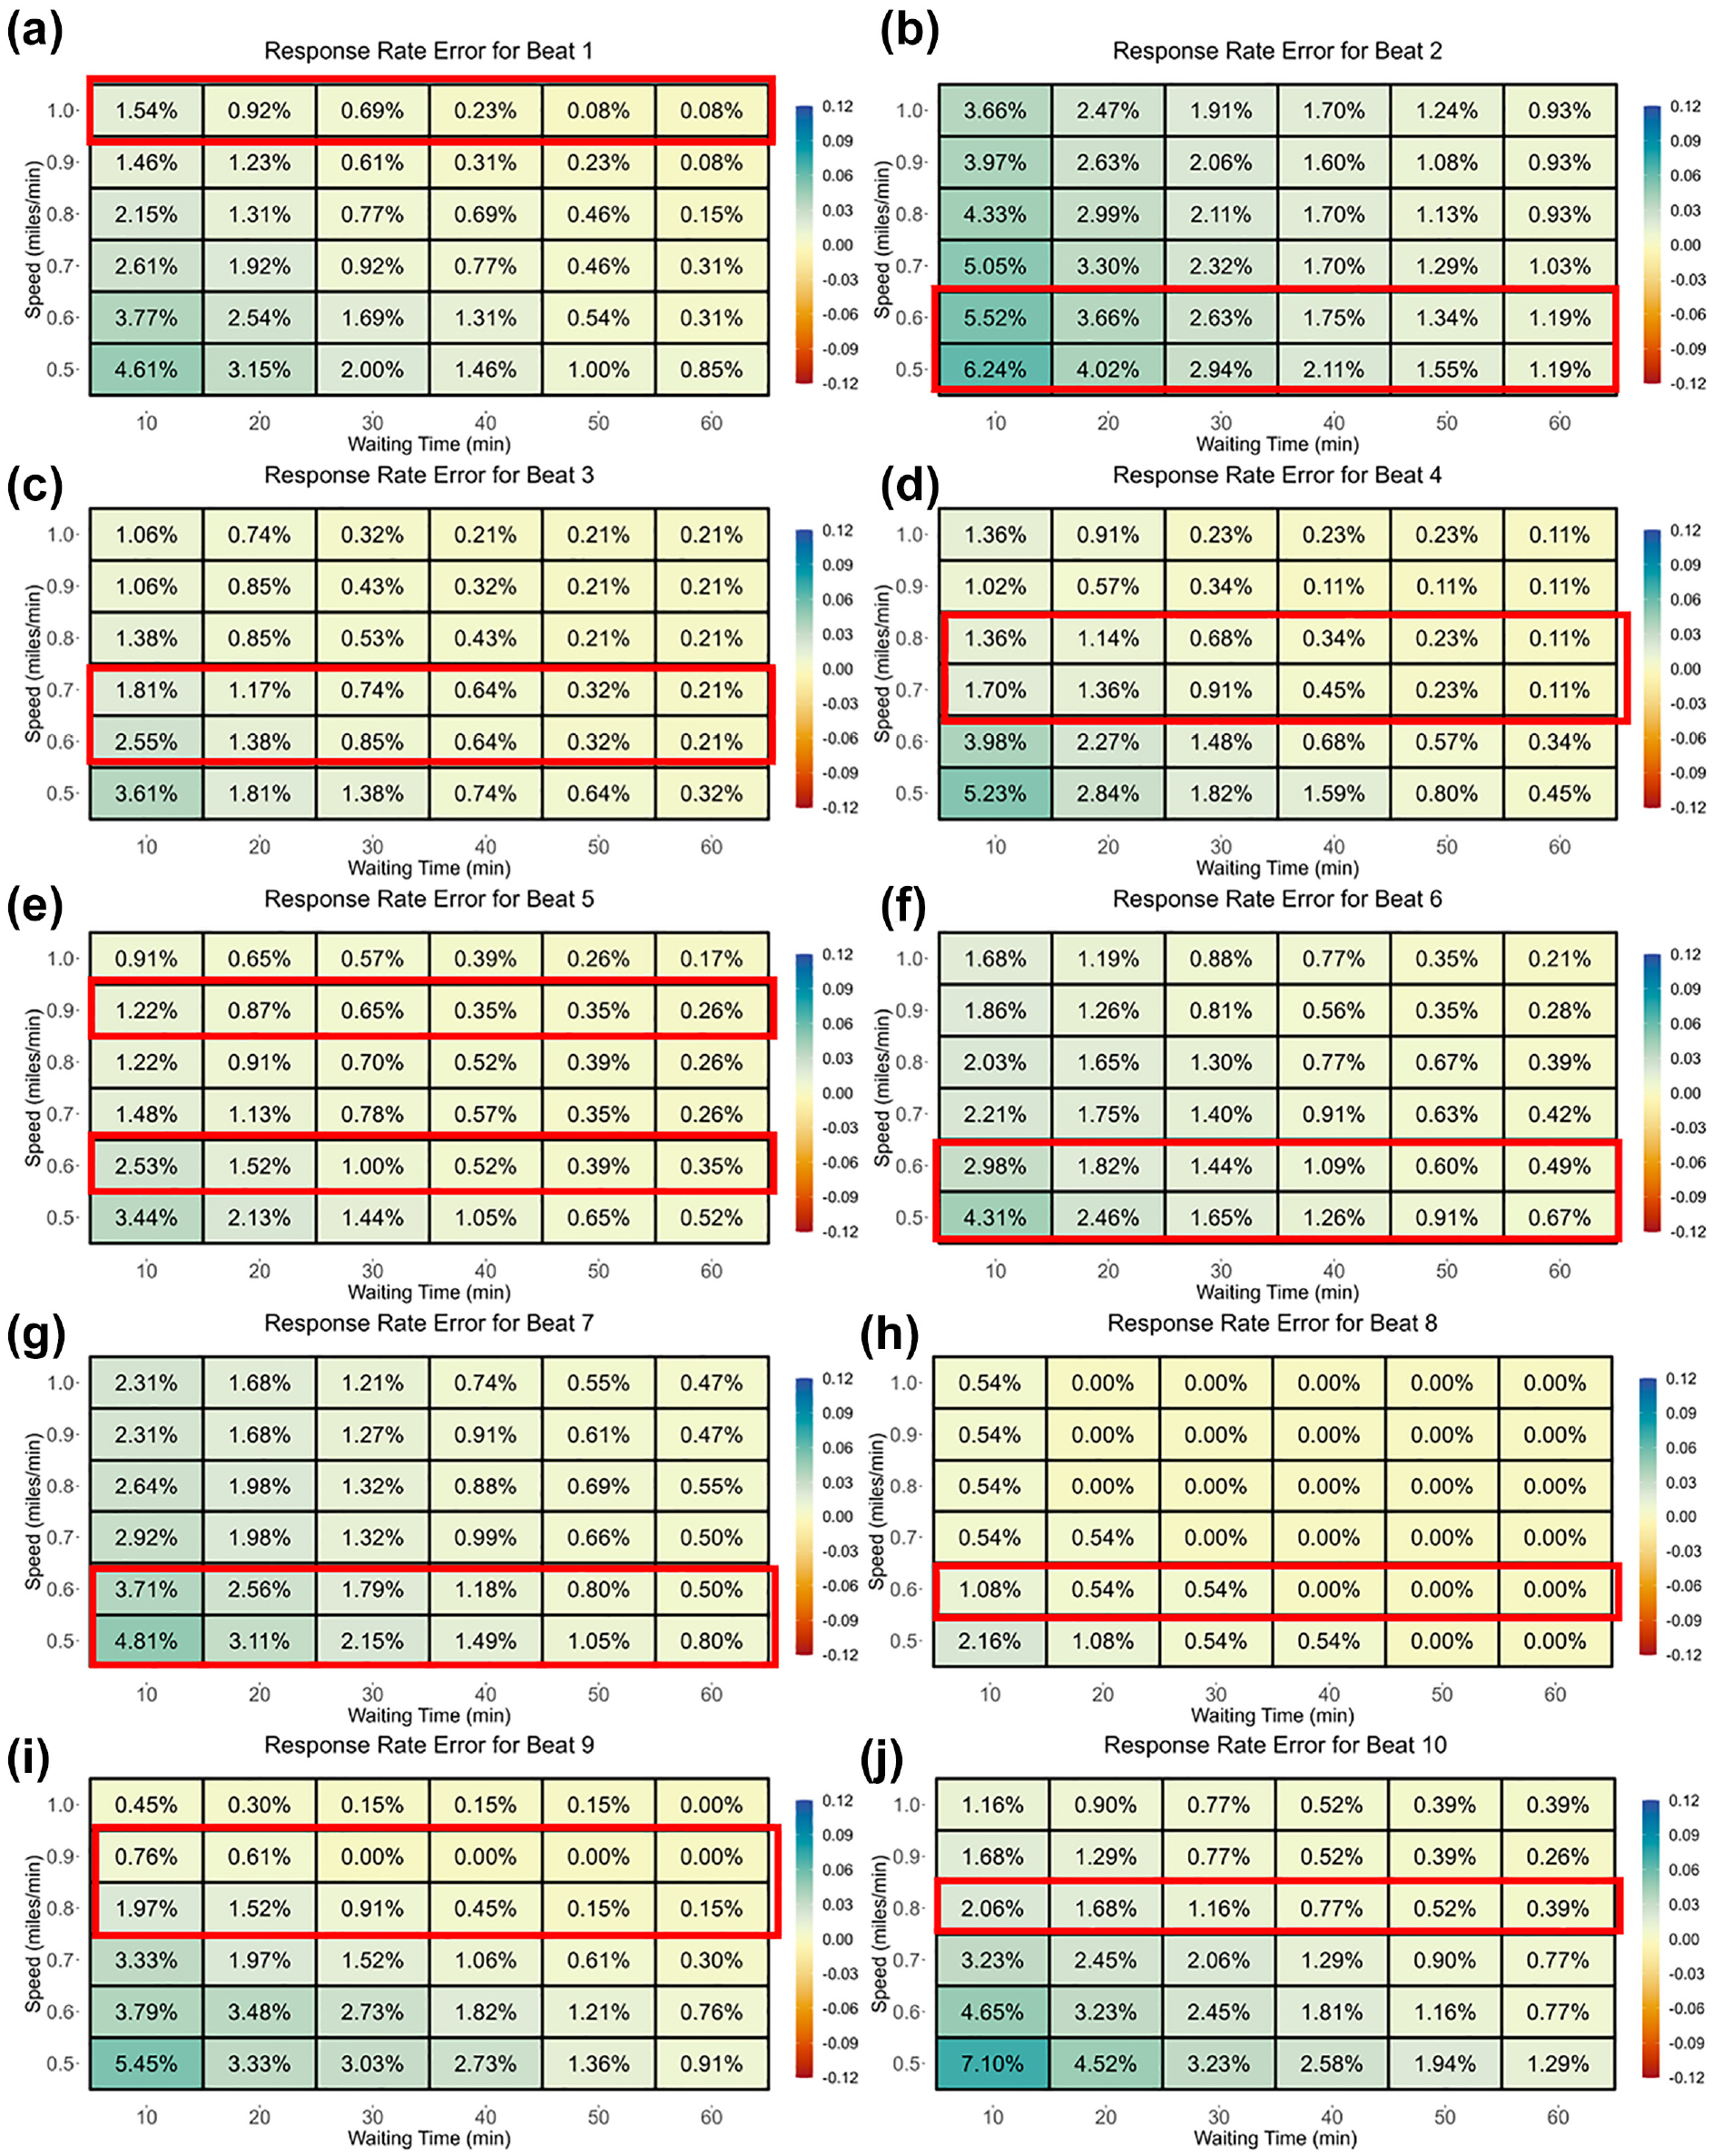
Heat maps of response rate error for ten beats: (a) to (j) for Beats 1 to 10, respectively.
Incident Prediction Results
In this section, the results of the incident prediction models are presented, including the incident frequency- and SSP service time duration models. In total, 44 integrated groups were identified by corridor ID and district ID in Virginia. The results of the HNB model for frequency are summarized in Table 2. Mean absolute error (MAE) was around 30% and pseudo-R2 was round 0.8 based on different years. The results showed that AADT and road length were positively associated with incident frequencies, consistent with previous studies.
Results of Hierarchical Negative Binomial Models
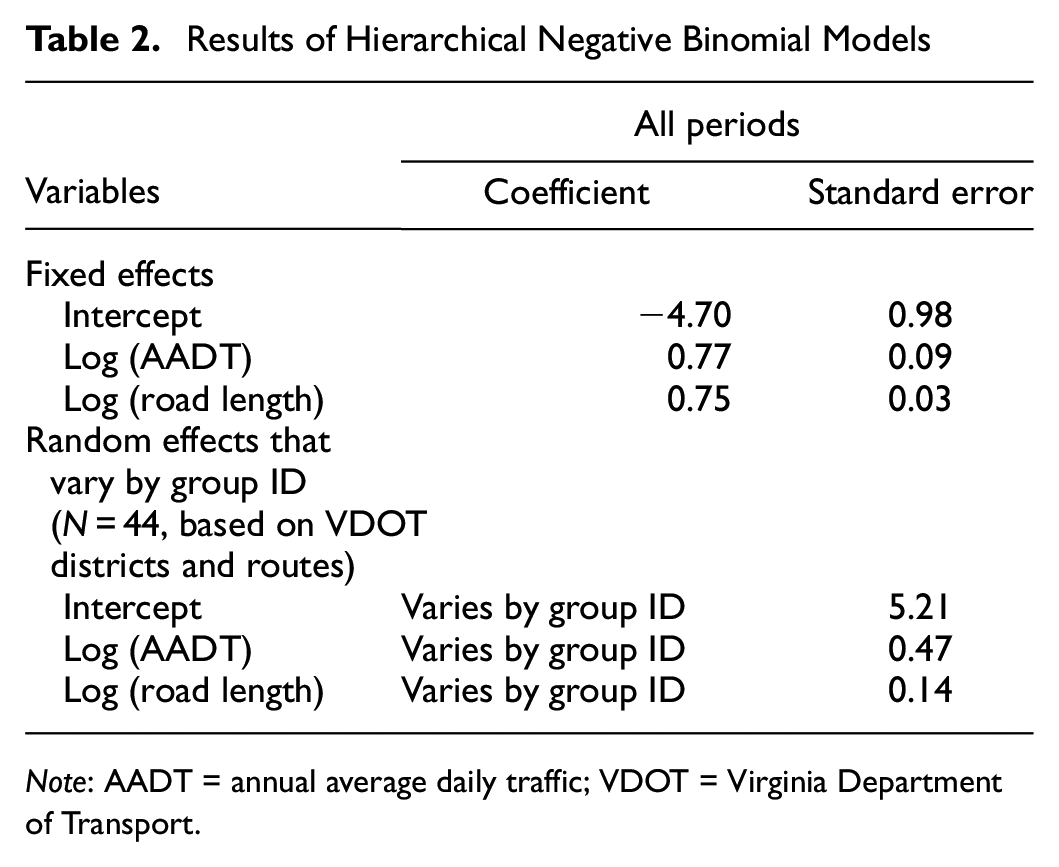
Note: AADT = annual average daily traffic; VDOT = Virginia Department of Transport.
The results of the hierarchical Weibull model for SSP service time prediction are given in Table 3. Time of day, season, and incident type were found to be significant factors in estimating SSP service time. The service time of incidents that occurred during the midday (MD), afternoon (PM), and nighttime (NT) periods was found to be positively associated with the SSP service time. The morning period (7 to 9 a.m.) was taken as the base or reference period. Incidents that occurred in the fall and winter seasons were found to have a longer service time compared with those occurring in the spring and summer. Crashes were also found to have a longer service time than disabled vehicles. In addition, a large variation of random effects for the intercept, the PM period, winter season, and incident type indicated the importance of including spatial heterogeneity. The MAE of this model was 12.17.
Results of the Hierarchical Weibull Model for Safety Service Patrol (SSP) Service Time
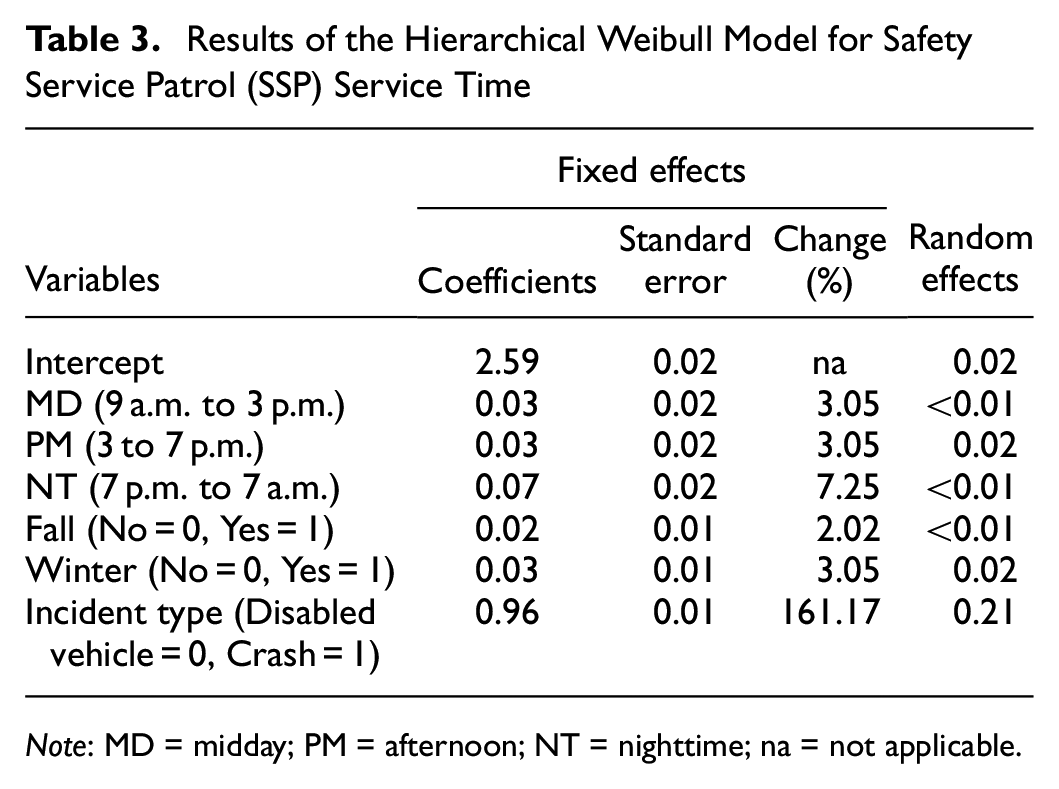
Note: MD = midday; PM = afternoon; NT = nighttime; na = not applicable.
Case Study of SSP Optimization and Model Validation
For model validation, a corridor consisting of two SSP beats on I-95 (Beats 1 and 2 in Figure 7) was selected. In this case study, the beat lengths were restricted to be between 7 and 30 mi. The total beats number varied from 2 to 4. Ultimately, 36 feasible beat configurations were generated (see Table 4). The “Start” and “End” columns represent the beginning and end mileposts of the corridor. The mileposts recorded in columns starting with an “X” refer to the boundary between two beats within the selected corridor. For example, beat configuration C11 has three beats: from Milepost 50 to 57.2, 57.2 to 66.9, and 66.9 to 83.2, respectively. In these columns, a “−1” indicates an inapplicable value. Incident data generated from the incident prediction model were used as simulation input. The incident data were synthesized for 40 weekdays to represent typical incident frequencies, and the simulation period was set to 24 h.
All Feasible Beat Configuration Results
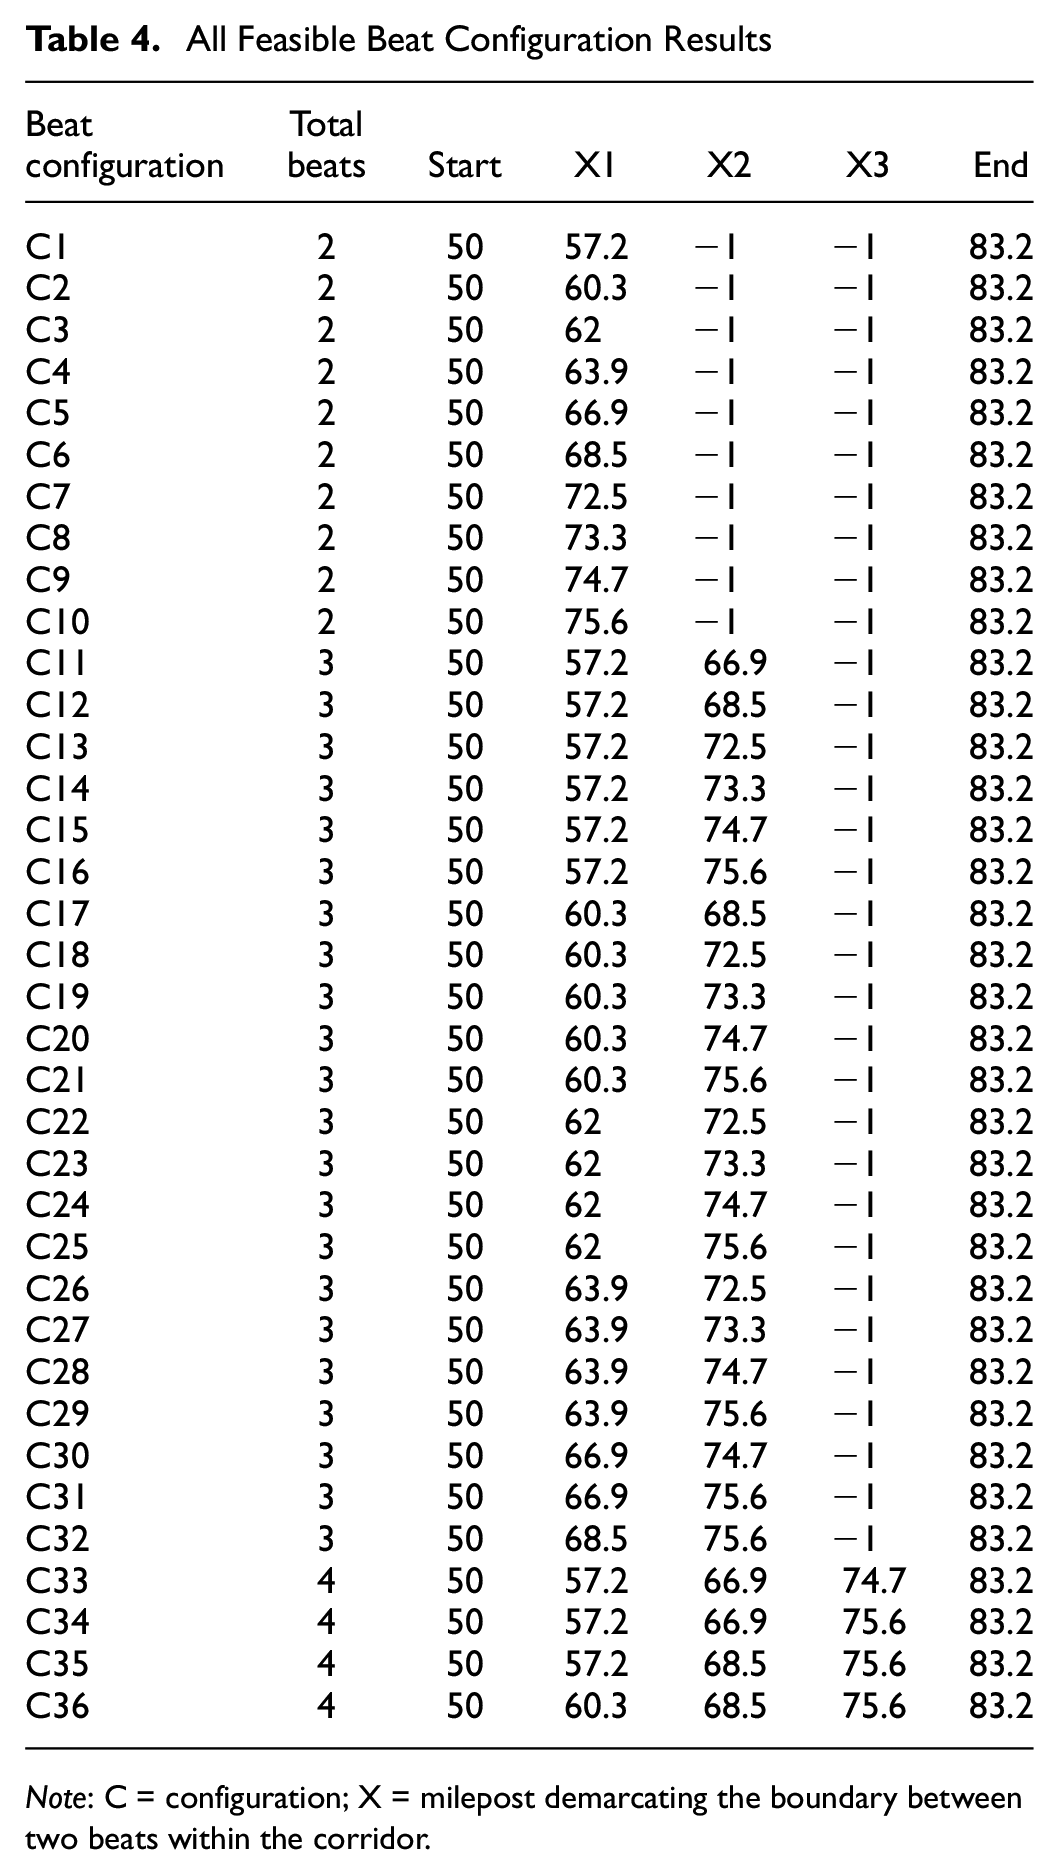
Note: C = configuration; X = milepost demarcating the boundary between two beats within the corridor.
The simulation results from different runs are presented below. Figure 11 shows three types of chart comprising the performance metrics presented earlier: RT and RR, TU and RT, and RT2 and RR. The annotated number represents the beat configuration in Table 4. Different dot shapes represent the number of beats simulated in this corridor: red dots represent two-beat configurations, green triangles three beats, and blue squares four beats. It was evident that, with the number of assigned SSPs increasing in the corridor (i.e., beat number increase), the performance metrics of the beat configurations improved. There was a clear increase in RR and a decrease in both RT and RT2.
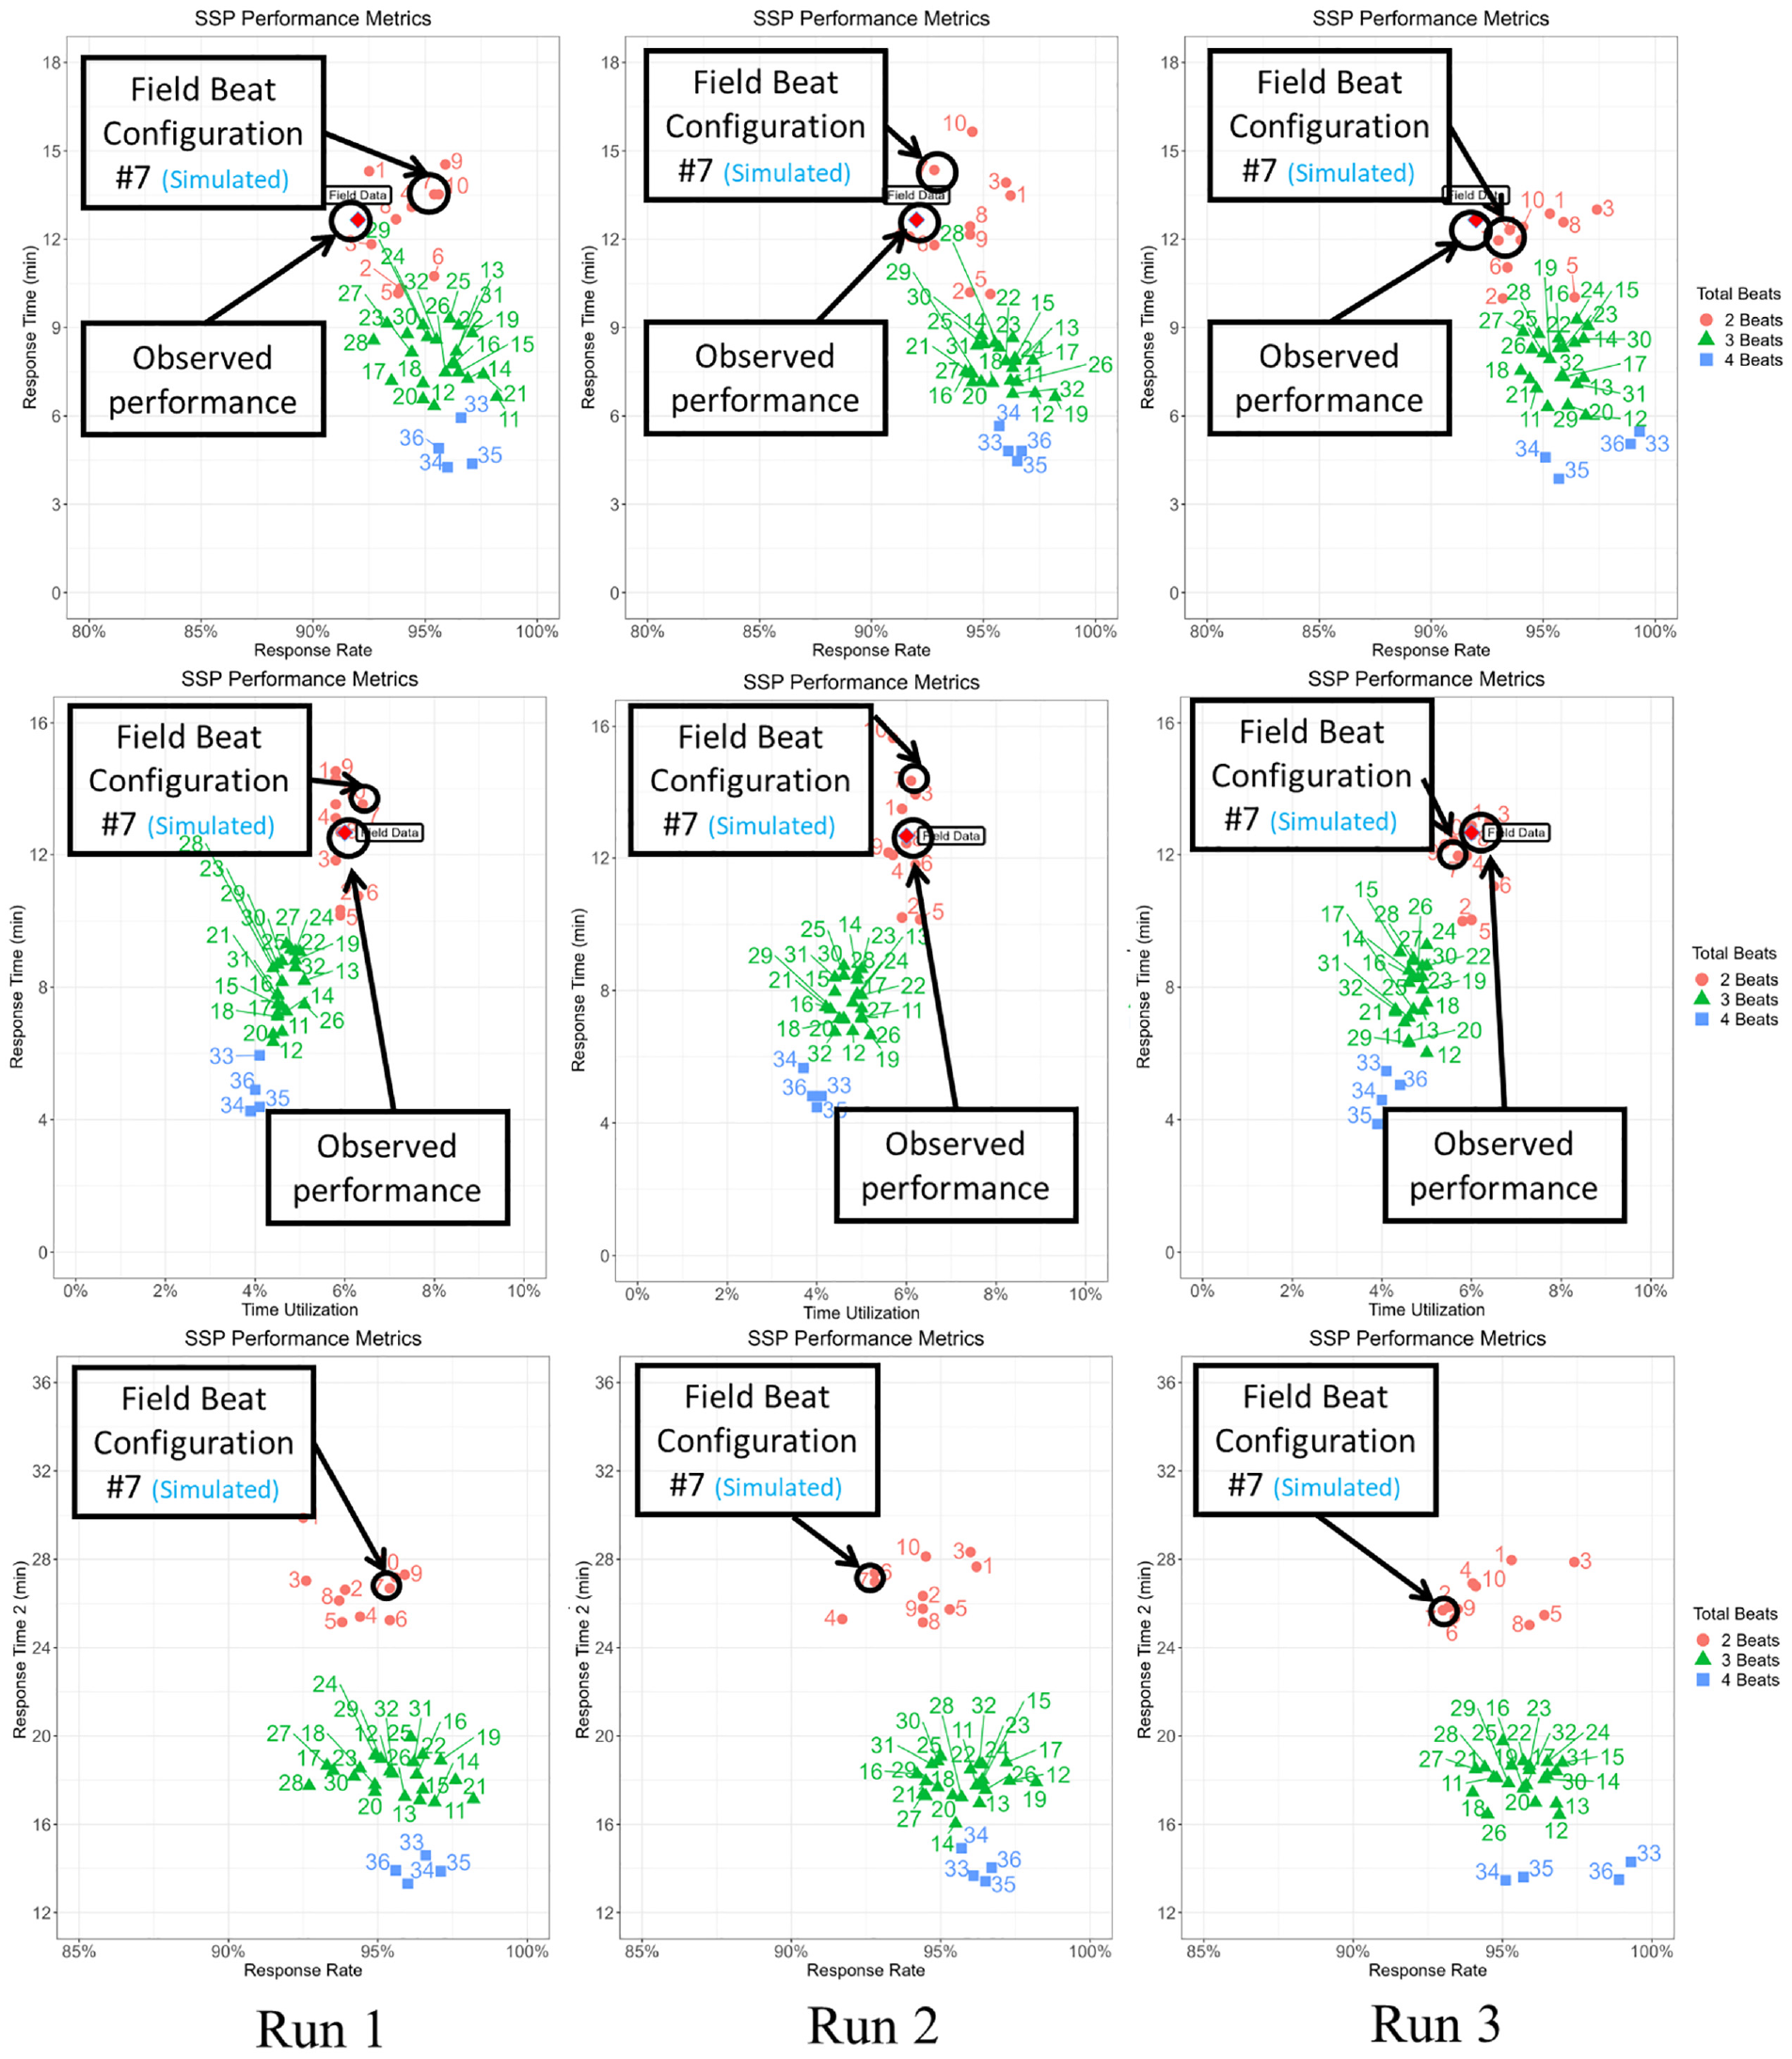
Performance metrics of safety service patrol (SSP) simulation with three different runs.
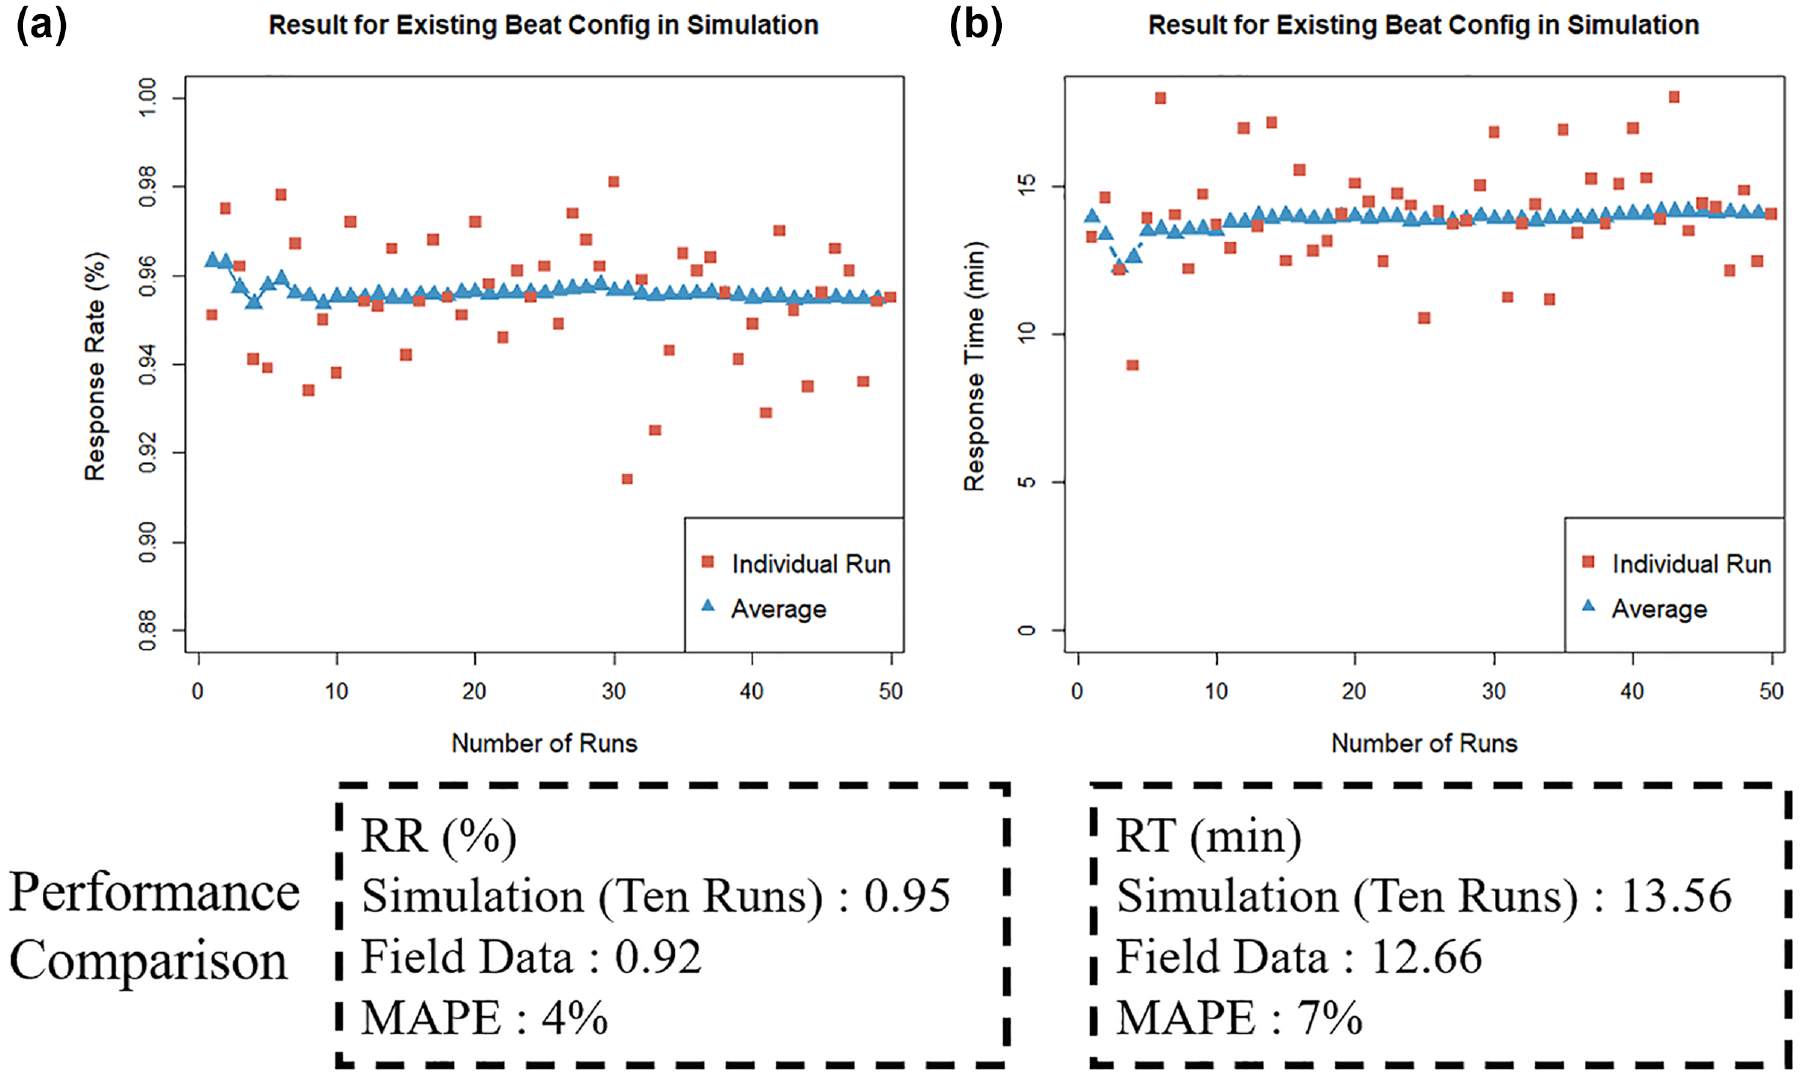
Field observations are indicated by a red diamond for the current SSP routes. The two-beat configuration, C7, was identical to the existing SSP beat configuration in the field. Simulation results for C7 are circled in the charts, which showed good agreement with the field data but fluctuated because of randomness in the incident generation process. Simulations need to be repeated multiple times to obtain stable results. Outputs for individual runs, as well as the average of RR and RT when the number of simulations increased are illustrated in Figure 12. In the figure, the results quickly become stable after 10 or more runs. MAPEs (mean absolute percentage errors) were computed as well. These small differences indicated that the simulation model produced relatively accurate results.
(a) Average response rate (RR) and (b) average response time (RT) as the number of runs changes.
In addition to the corridor on I-95 (Beats 1 and 2 in Figure 7), the model also tested for a corridor on I-81 (Beats 8 and 9 in Figure 7) using the simulation with the same calibrated parameters. For the corridor on I-81, the results showed that the MAPEs for RR and the RT were 4% and 17%, respectively, with the RT error range fluctuating around 2 min.
Conclusions
In this study, a simulation-based approach was employed for modeling SSP operations. The SSP simulation model incorporates an HNB model for incident frequencies and a hierarchical Weibull model for incident duration. These models were found to be effective in simulating the spatiotemporal distributions of incidents along the highway corridors and for generating their attribute data (e.g., incident type, SSP service duration). The simulation-based approach proposed in this study was shown to produce realistic performance measures (e.g., RT, RR) that were consistent with field observations. The results indicated that adding more SSP vehicles in target corridors could reduce RTs, improving RRs—findings that were consistent with previous studies ( 26 ). The simulation program employed a discrete event-based approach using a few calibration parameters (e.g., SSP vehicle speed, thresholds for waiting and notification times). After calibrating the model, the validation results showed good agreement with field observations when applied to sample SSP corridors on I-95 and I-81. The proposed SSP optimization model could be applied to corridors with or without existing SSP service. However, it should be noted that the models were calibrated on historical incident and SSP operational data from existing SSP corridors. The model outputs for future scenarios would be valid insofar as those scenarios are consistent with the historical data.
Footnotes
Acknowledgements
The authors thank Virginia Transportation Research Council for funding this study. The contributions and feedback received from Paul Szatkowski, Ken Coody, Brian Mosier, Jonathan Meeks, Noah Goodall, and Lance Dougald of the technical review panel (TRP) of the project were highly appreciated. We are very grateful to Mike Fontaine of Virginia Transportation Research Council who served as the project manager and helped the team schedule TRP meetings and access field data. He provided invaluable comments and feedback to the team throughout the project. The team is also thankful to Katie Felton of Traffic Operations Division, who provided access to VaTraffic and ATMS data.
Author Contributions
The authors confirm contribution to the paper as follows: study conception and design: J. Wang, M. Cetin, H. Yang, K. Xie, G. Zhai, S. Ishak; data collection: J. Wang, M. Cetin, H. Yang, K. Xie, G. Zhai; analysis and interpretation of results: J. Wang, M. Cetin, H. Yang, K. Xie, G. Zhai; draft manuscript preparation: J. Wang, M. Cetin, H. Yang, K. Xie, G. Zhai, S. Ishak. All authors reviewed the results and approved the final version of the manuscript
Declaration of Conflicting Interests
The authors declared no potential conflicts of interest with respect to the research, authorship, and/or publication of this article.
Funding
The authors disclosed receipt of the following financial support for the research, authorship, and/or publication of this article: This research was funded by Virginia Transportation Research Council. The grant number is 119789.