
Abstract
In the context of the trend for green travel, the emergence of shared mobility, represented by e-hailing and ridesharing, provides behavioral richness for travelers. Consequently, the authorities that devote themselves to balancing supply and demand in multimodal networks are concerned with incorporating shared mobility into transportation planning and formulating reasonable policy measures. A novel capacity model incorporating a policy mix is developed here as a bi-level programming problem in which the lower-level model is a combined modal split and traffic assignment considering elastic demand (CMSTA-ED) problem, while the upper-level model maximizes the origin–destination (OD) demand multiplier. Integrating the capacity model (the effectiveness index) with social welfare (the implementability index) can account for the synergy, facilitation, and potential contradiction of policy mixes. Numerical experiments validate the characteristics of shared mobility as a supplement to poorly performing public transit under its poor performance. It also examines the policy mix between a public-transit priority subsidy, parking charging, and the shared-mobility subsidy to discover the positive coordination that any individual policy cannot satisfy. This study provides implementable insights for further formulating rational policy-mix strategies on shared mobility to promote the sustainable usage of shared mobility.
Keywords
Recently, the development of Internet platforms and mobile payment have facilitated shared-mobility services, such as e-hailing and ridesharing, which provide lower prices, flexible mobility, and high service quality. As an effective supplement to public transit, shared mobility can reduce the number of motor vehicles on the road network and alleviate traffic congestion, thus enhancing traveler satisfaction. However, shared mobility exhibits complicated trajectories and mechanisms, resulting in diverse traveler behavioral choices and flow patterns. Therefore, estimating the variety of mode share in multimodal networks with shared mobility is essential, as it enables authorities to devise reasonable traffic management policies and promote sustainable transport development.
In this study, shared mobility refers to e-hailing and ridesharing, which includes various flexible matching forms such as peer-to-peer (P2P) ridesharing ( 1 ) and vanpooling ( 2 ). Here, we define ridesharing as a mode where vacant vehicle seats are used to promote shared rides for both drivers and passengers, with the passengers’ origin–destination (OD) pairs being part of the drivers’ routes ( 3 ). For e-hailing services, traditional views often position passengers as leaders and taxis or online taxis as followers in Stackelberg games ( 4 ) or multiple-leader-follower games ( 5 ). Recently, however, some studies ( 6 , 7 ) have divided the e-hailing flow into occupied and vacant stages, which can consider the congestion effect in the model. Therefore, we adopt this method when modeling e-hailing services.
In general, an equilibrium model is designed to capture complex mode-choice and route-choice behaviors, with the goal of reflecting combined modal split and traffic assignment (CMSTA) processes. Various mature methods are discussed, including the nonlinear complementarity problem (NCP) ( 8 ), the quasi-variational inequality (VI) problem ( 6 ), and the mathematical programming (MP) formulation ( 9 ). Building on this foundation, capacity models can be formulated as bi-level problems to assess a multimodal network system, where the lower-level model addresses user equilibrium (UE) or stochastic user equilibrium (SUE) problems, while the upper-level model maximizes the OD demand multiplier. However, the major existing capacity-model studies have not addressed two extensions: one is that current capacity models need more integration of elastic demand and emerging multimodes, such as shared mobility; the other is that there is a need to incorporate a policy mix into multimodal network capacity problems, providing guidance on travelers’ mode-choice behavior.
Firstly, there is an increasing need to construct new formulations to accommodate the present and newly generated multimodal travel demand. Xu et al. ( 10 ) discussed the impact of the ridesharing mode on travelers’ mode choices. However, in this model, the matching between passengers and drivers occurs when they share the same links in their journeys. Therefore, the passenger may take several drivers’ vehicles to complete one journey. Di et al. ( 8 ) assumed that the drivers only pick up passengers with the same OD to enrich ridesharing research on multimodal network problems. Also, Di and Ban ( 6 ) added an e-hailing service and formulated their equilibrium model. Du et al. ( 7 ) developed a novel transportation network capacity model that incorporates ridesharing and e-hailing modes to capture travel behaviors. In the abovementioned studies, the modal split and traffic assignment processes with embedded shared mobility were assumed to obey a fixed total travel demand. This may cause biased future travel demand pattern prediction and inefficient budget allocation. In contrast, elastic demand can reflect fluctuations with link travel costs, a characteristic of travel demand that aligns with the actual traffic trip distribution. Kitthamkesorn et al. ( 11 ) used excess demand as a substitute for elastic demand. The excess demand can be interpreted as an alternative mode separated from the initial mode, such as the physically separate car and metro modes. In extension works, researchers have developed bi-modal systems with physical separation or sharing ( 12 , 13 ). Subsequently, they constructed multimodal network capacity models that incorporate elastic demand and account for travelers’ mode choices, with a particular focus on cars, public transit, and other regular services ( 14 , 15 ). As a result, it is necessary to develop a road network capacity model that can simultaneously consider shared mobility and elastic demand.
Secondly, the impact of the policy mix on travelers’ mode choices is another crucial extension to the multimodal network capacity problem. Givoni et al. ( 16 ) proposed the following definition of a policy mix: “a combination of policy measures designed to address one or more policy objectives, created in order to improve the effectiveness of the individual policy measures, and implemented while minimizing possible unintended effects, and/or facilitating interventions’ legitimacy and feasibility in order to increase efficiency.” Habibian and Kermanshah ( 17 ) assumed that mode choice decisions obeyed a mixed logit model when studying the variety of travel modes in two policy-mix scenarios. Bueno et al. ( 18 ) investigated the relationship between commuter benefits and mode choice for commuting trips, considering various policy mixes. Their study was performed under the assumption that employees’ behaviors follow a multinomial logit model. Wang et al. ( 19 ) designed orthogonal experiments to analyze the full combined effects of packages of policy measures using multinomial logit models. Limited by the mass data available, such data-driven studies emphasize the policy combination scenarios but ignore the practical assumption of travelers’ behavioral choices, causing inadequate policy guidance. Still, a limited number of studies have recognized the significance of employing precise models for travel behaviors when assessing the effects of policy measures. Zheng et al. ( 20 ) established three different capacity-flexibility measurement approaches to predict how drivers and passengers react to various subsidy decisions. Based on an equilibrium framework, Sun and Szeto ( 21 ) discussed several policy implications, namely car restrictions, cordon tolling, and subsidization. Nevertheless, they paid more attention to comparing the merits of the policy measures rather than discussing the coordination of various policy measures. Therefore, a model that can assess the effects of the policy mix and capture the practical mode and route choices should be established for multimodal networks.
This study aims to customize a road capacity framework to examine the synergy, facilitation, and potential contradiction of policy mixes in a multimodal network in which shared mobility is embedded. The proposed formulation can identify the inherent relationships, such as the interaction of e-hailing and ridesharing and the competition between shared mobility and public-transit services, and contribute to implementing mode-specific policy measures. We examine the impact mechanism of shared mobility in the multimodal network, then explore the synergy of policy mixes among a public-transit priority subsidy, parking charge, and shared-mobility subsidy, considering users’ diverse preferences for travel modes and the stringency of other policy measures.
Specifically, the contributions of this study include the following:
(1) It proposes a new network capacity model to evaluate the performance of urban road systems with embedded shared mobility. The network capacity model regards the public-transit demand as an elastic demand when considering the variability of the OD demand pattern in the road network.
(2) It explores the impacts on network capacity of the separate implementation and the combined implementation of shared mobility, which can provide management strategies such as the share ratio of travel services to coordinate shared mobility with public transportation.
(3) It presents the assessment system for the policy mix, which utilizes capacity as the effectiveness index and social welfare as the implementability index to manage, evaluate, and monitor the effects of the policy mix, thereby suggesting the best policy mix.
The remainder of this paper is organized as follows. Section 2 presents the notation, the characteristics of multimodes, the policy mix, and the capacity model for multi-class users. Then the solution algorithms are presented in Section 3. Numerical examples showing the impact mechanism of shared mobility and the evaluation of the policy mix are given in Section 4. Section 5 concludes the paper.
Road Network Capacity Model
The notations used in this study are listed below:
Multimodal Demand Considering Shared Mobility
There are five participants in the shared-mobility network: transit passengers, ridesharing passengers, e-hailing passengers, car drivers, and ridesharing drivers, as depicted in Figure 1. Note that passenger demand cannot directly influence the transportation network capacity; its impact is manifested through the transport services tailored to a specific passenger demand. Therefore, we categorize overall demand into passenger demand and driver demand. Specifically, ridesharing passengers are served by drivers who share a similar OD, while e-hailing passengers attract e-hailing drivers, resulting in a vacant flow.
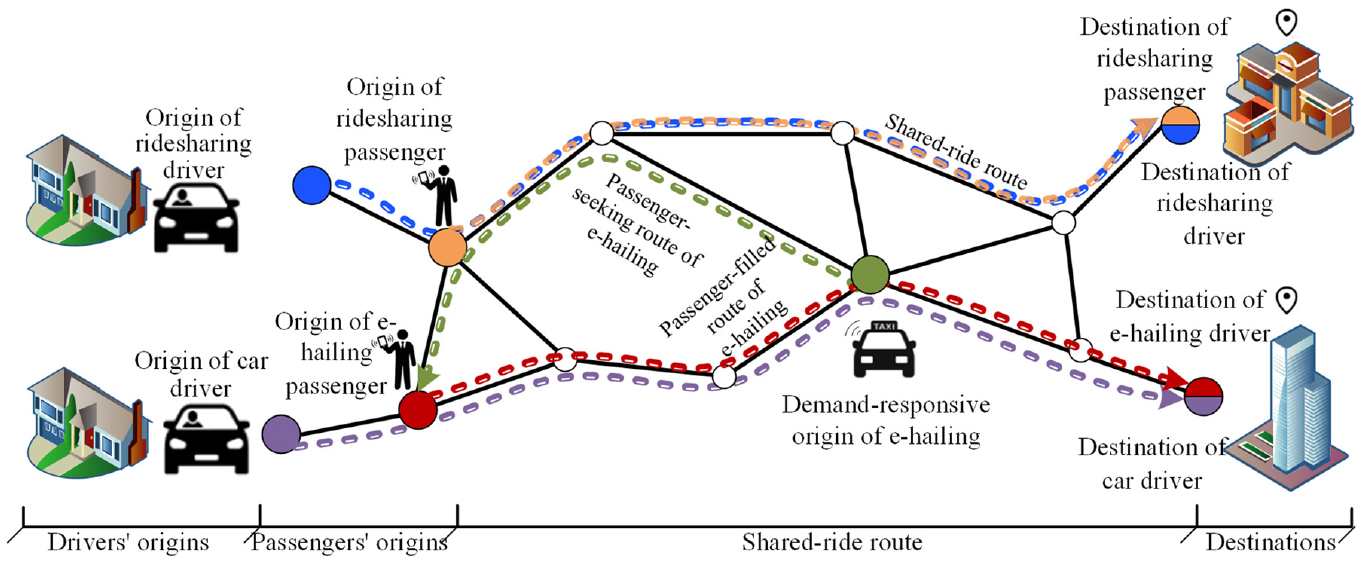
Five participants in a multimodal road network with shared mobility.
Figure 1 illustrates that shared mobility has a complex trajectory and directly interacts with other travel modes in the multimodal network. Therefore, developing a network equilibrium model to investigate the impact mechanism for shared and traditional modes is crucial for promoting the advancement of emerging modes and establishing mode-specific traffic management measures.
In addition, we introduce elastic demand to enhance the accuracy of the capacity model. The multimodal network demand, divided into passenger demand, driver demand, and excess demand, is illustrated in Figure 2. The nested logit (NL) model can capture the mode similarity; that is, driver modes sharing the same physical links or passengers competing limited vehicle resources. Also, their mode-specific route choices follow the path size logit (PSL) model.
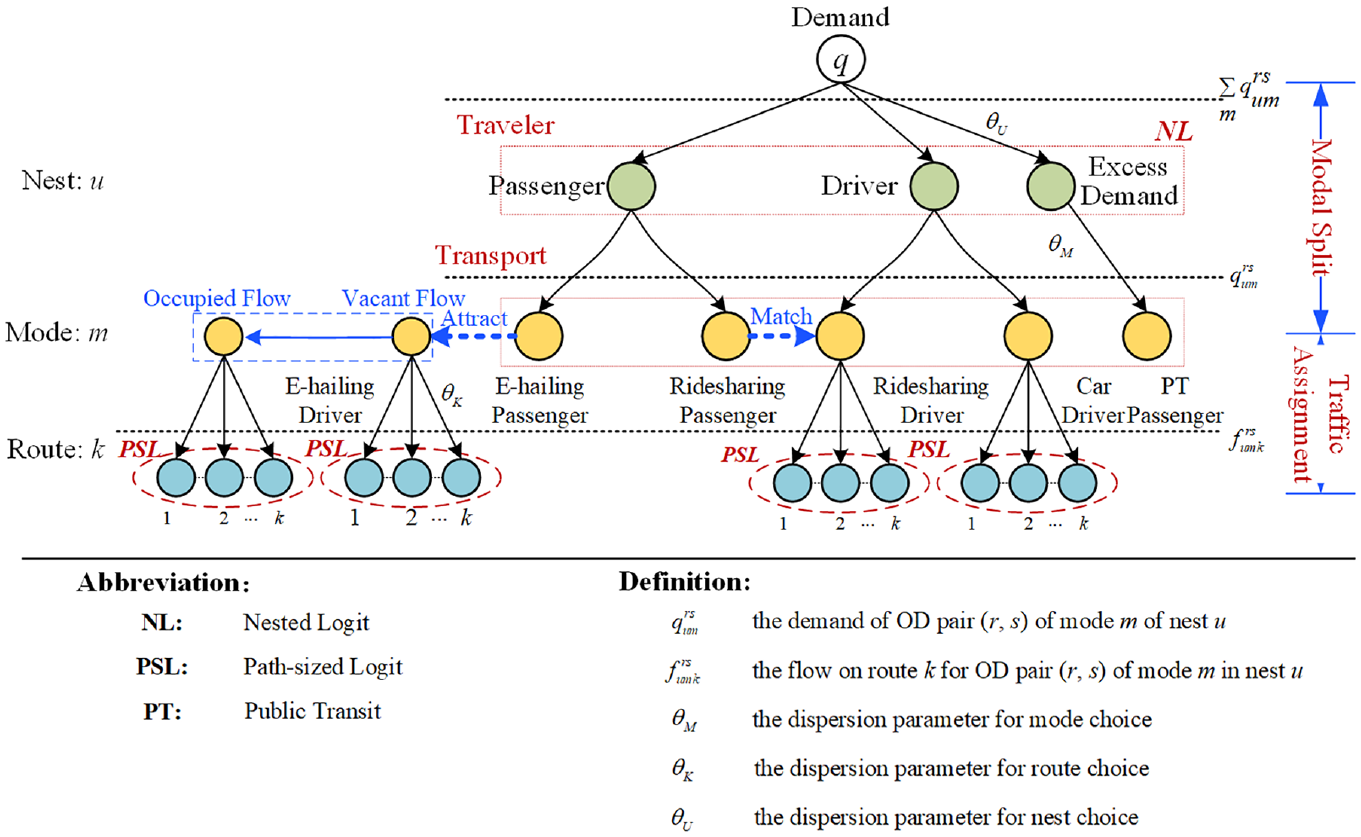
The NL–PSL structure for the multimodal network.
Network Assumptions and Model Definition
Consider a connected network with multiple OD pairs. In this multimodal network, users fall into three classes: those with private cars, those using car-hailing services, and others utilizing public-transit services. Consequently, these users have six travel modes to choose from: e-hailing driver, e-hailing passenger, ridesharing passenger, ridesharing driver, car driver, and public-transit passenger. In this study, it is assumed that no one can switch their roles throughout their trips.
Each traveler in the network aims to minimize their generalized perceived travel cost by selecting an optimal route and mode. The route and mode choice behavior is characterized by a logit function, as illustrated in Figure 2. Consequently, a SUE problem is formulated to model travelers’ behaviors. This SUE model serves as the lower-level model, while the upper-level model maximizes the OD demand multiplier, resulting in the construction of a bi-level model. This bi-level model enables the assessment of the multimodal transportation network capacity, considering the complex travel behaviors and the emergence of new travel modes.
Elastic Demand
Generally, elastic demand negatively correlates with the users’ expected perceived costs (EPC). The elastic demand function is as follows:

To demonstrate how to measure elastic demand in the multimodal network, we take a simple network with a single travel demand—the private car driver mode—as an instance. Figure 3 presents the application of elastic demand in the multimode network. The network accommodating the car driver demand has not reached saturation; thus, the demand of the network that can still be accommodated is called the excess demand; it also can be interpreted as the demand that non-travelers may generate. This study specifies the untraveled demand as the public-transit passenger demand; the car and public transit then constitute the bi-mode in Figure 3b, where the total demand is the potential maximum OD demand on the network.
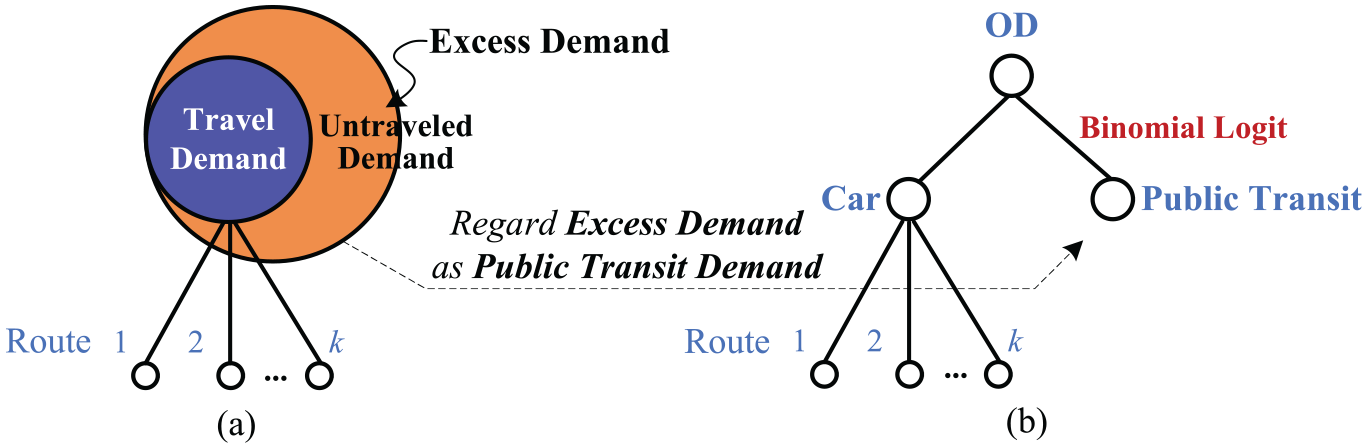
The derivation of elastic demand: (a) the elastic demand model and (b) the bi-modal demand model.
In the bi-modal model, excess demand is viewed as an alternative mode separate from the original mode. Following entropy maximization, this study converts the elastic demand into a binomial logit model using the argument-complementing function. The mathematical formulation from the SUE model is as follows:
The total demand in the multimodal transportation network is then

The travel cost function for public-transit passengers on route k is described as follows:
where
Car Mode
It can be seen from Figure 1 that the trajectory of the car driver is simple; that is, the car driver completes the journey independently between the origin and destination, so the cost function of car drivers on route k is
The car travel cost in our model is route based and consists of two terms. The first term utilizes the parameter
The OD travel demand and path flow of car drivers are constrained by

Ridesharing Mode
In the Multinormal Logit (MNL) model, ridesharing drivers and passengers are matched. Notably, the prerequisite for successful matching is that the driver does not show detour behavior. The passenger’s OD (i, j) is entirely part of the driver’s OD (r, s). The driver’s route follows the PSL model, as shown in Figure 4.
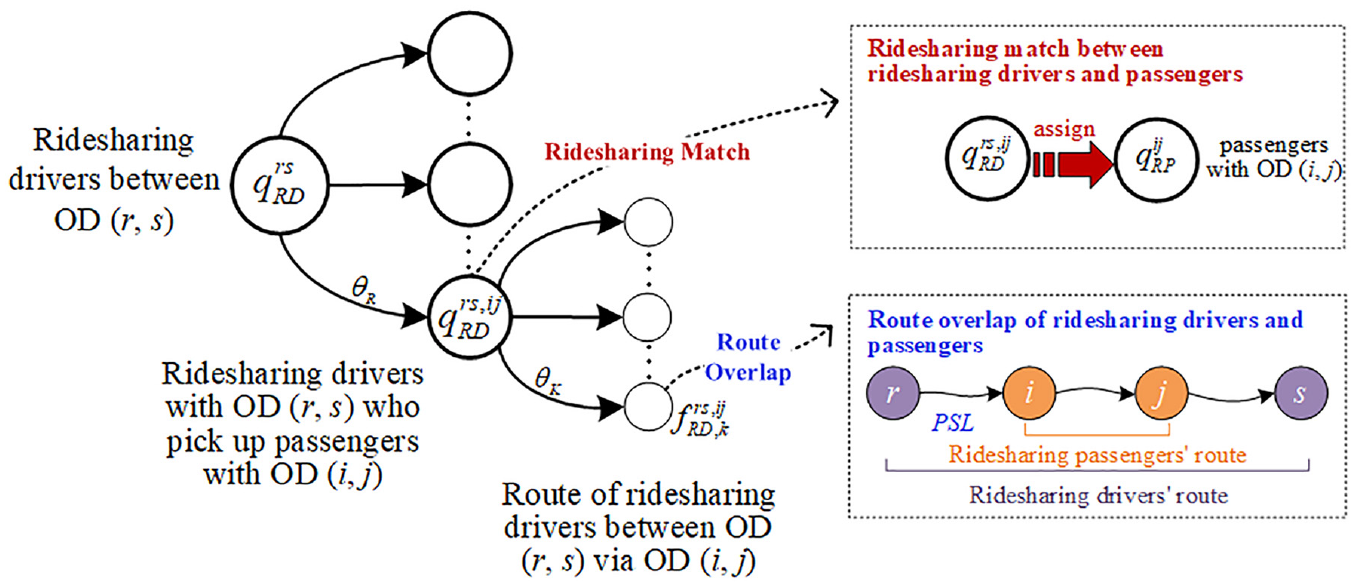
Travelers’ behavior for the ridesharing mode.
The travel cost function is

According to Figure 4, the demands of ridesharing drivers and passengers are constrained:

where Cap denotes the maximum passenger capacity of a car. The capacity constraints in Equation 11 for the ridesharing mode are introduced into the upper-level model.
E-Hailing Mode
Figure 5 displays the journey of e-hailing drivers. Before completing the current order (OD pair [r, s]), the driver will accept the platform’s new order (OD pair [o, d]). Therefore, after sending the current passenger to destination s, the driver will drive alone to the next passenger’s order origin o then perform a new occupied journey. So, the whole trip of the e-hailing driver is composed of passenger-filled and passenger-seeking stages, both which can cause congestion. To ensure the consistency of hypotheses, we assume that the drivers of vacant e-hailing vehicles are assigned to the new pick-up nodes based on the MNL logit-based trip distribution model. Without any loss of generality, this paper assumes that e-hailing drivers carry one passenger per trip. The driver follows the PSL model along the path of the trip.
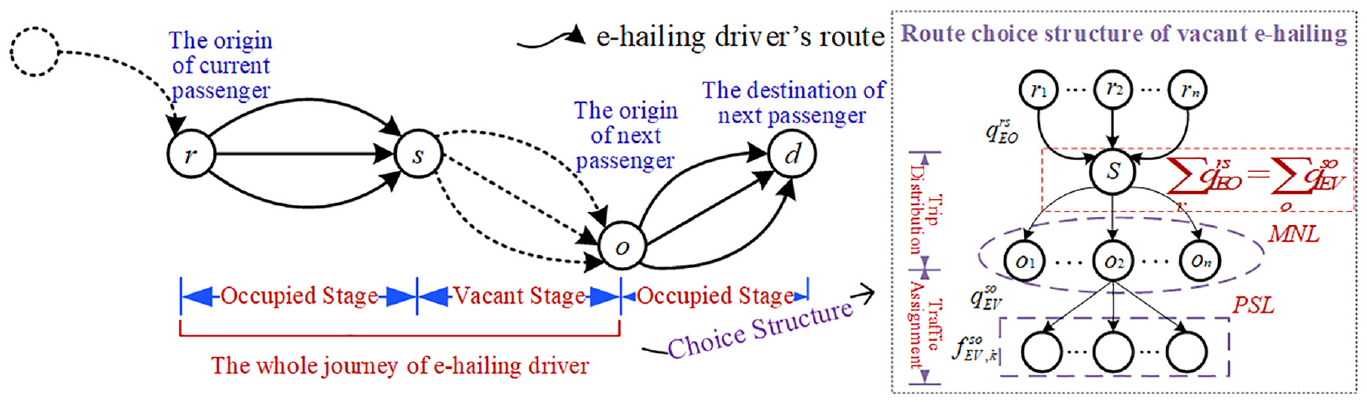
Illustration of e-hailing services.
In the occupied stage, the passenger needs to pay the trip fee based on their OD pair to the driver. In the vacant stage, the price of the e-hailing driver is the same as that of the car driver. Therefore, the cost function of the network e-hailing driver is as follows:
In addition, the conservation relationship is as follows:
According to flow conservation, the sum of the occupied flow arriving at node s should equal the sum of the vacant flow departing from node s:
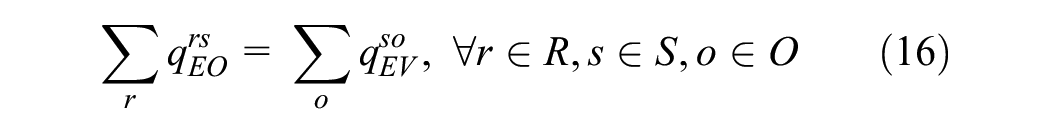
To ensure that sufficient vehicles are available for the waiting passengers, the sum of the vacant flow arriving should exceed or equal the sum of the occupied flow departing:
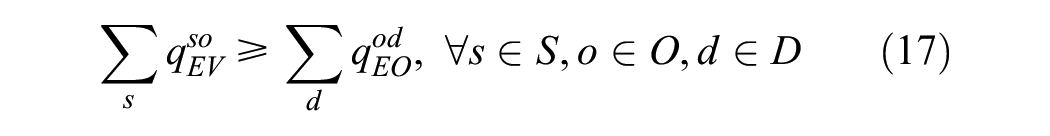
Equation 17 can be regarded as a capacity constraint and is thus introduced into the upper level of the network capacity model.
Policy Mix
Givoni ( 22 ) indicated that policy mixes should strive to achieve three objectives: effectiveness, implementability, and efficiency when combining these two. This study uses the capacity as an indicator to examine the effectiveness of policy mixes. When considering the policy’s implementability, most research focuses on financial cost; therefore, we introduce the customer surplus (CS) and social welfare (SW):
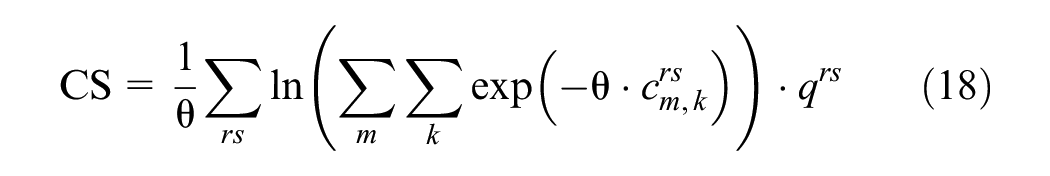
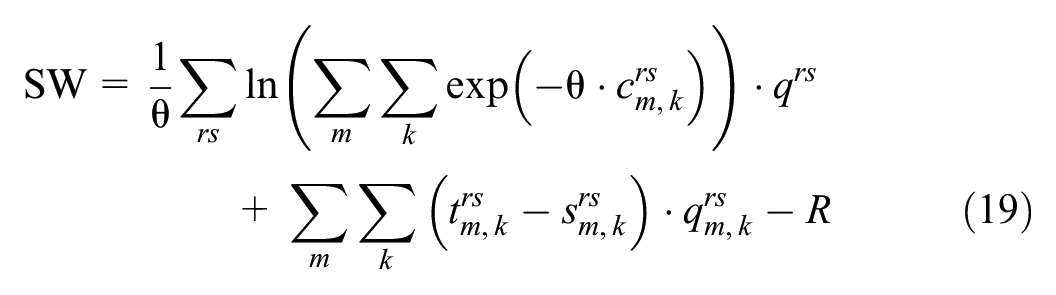
where R is the system operation cost, which has been discussed in many publications ( 21 , 23 ). In this paper, we refer to Sun and Szeto ( 21 ) and let R equal 0.
Figure 6 illustrates how the pricing policy improves system performance.
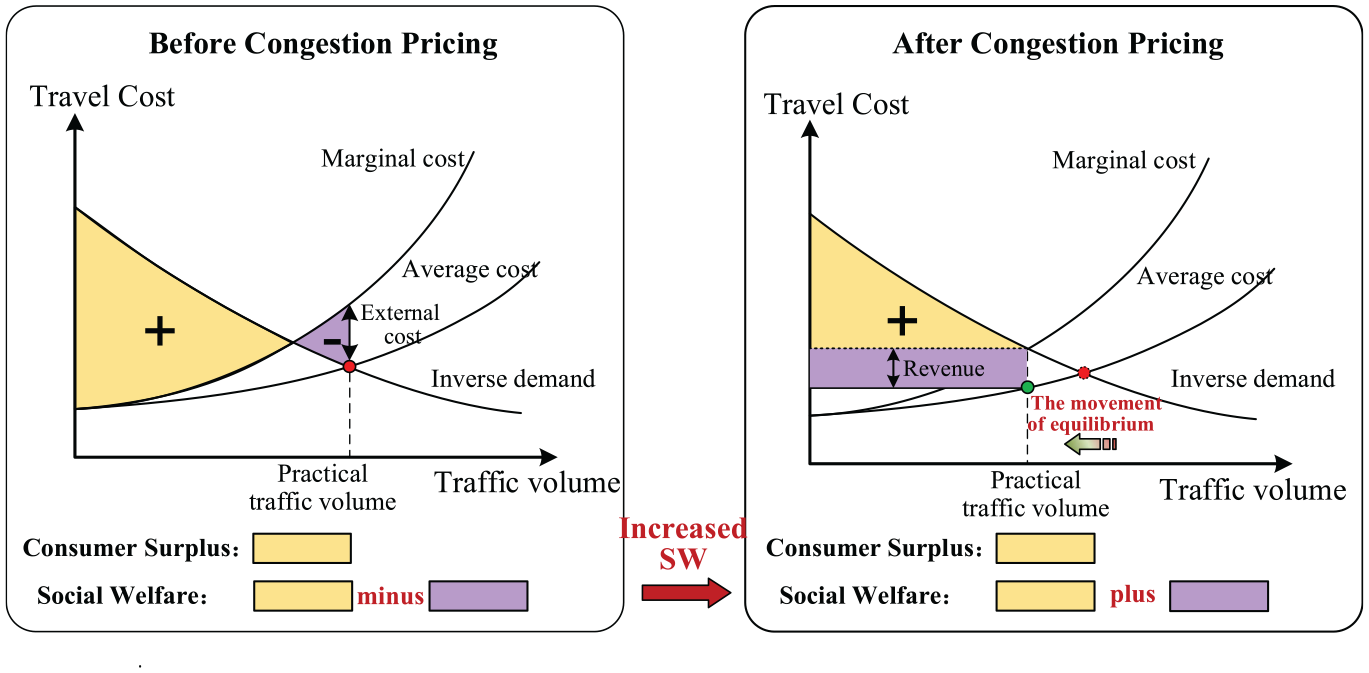
The impact of policy measures on network system performance.
The average cost function indicates that the travel cost will increase with growing demand. Thus, the equilibrium of the current network system is found at the intersection of the cost function and the inverse demand function. Inspired by external economies, the marginal cost reflects the congestion caused by travelers crowding the road link, which affects both their interests and those of others. To address this, the authority collects the external cost from the travelers causing congestion to raise SW and reallocates resources to optimize road network performance. After congestion pricing, the purple region in Figure 6 represents the revenue, which equals the product of the traffic volume and the charge, while the yellow part represents CS, calculated as the product of demand and cost. The sum of both contributes to SW. Figure 6 demonstrates a rise in social welfare resulting from congestion pricing. Furthermore, the subsidy policy can be perceived as a variation of reverse charges.
The literature has categorized transportation policy measures as “push” and “pull” measures. More specifically, push measures discourage private car usage, while pull measures encourage other alternative modes ( 24 , 25 ). Thus, the policy mix of pull and push measures can avoid contradictory effects by increasing the public acceptance of policies and achieving political compromises to facilitate implementation.
This study evaluates the effects of three policies—a public-transport priority subsidy, a shared-mobility subsidy, and a parking charge—when used in isolation and when they are coordinated. Table 1 summarizes the cost components of the six travel behaviors under these policies. Here, the public-transport priority subsidy aims to reduce the cost for transit travelers, encouraging more individuals to choose the public-transit mode. In the shared-mobility subsidy policy, we allocate incentives to ridesharing drivers and passengers to facilitate successful matches. Additionally, we encourage travelers to opt for shared-mobility services over driving a car. Furthermore, the travelers who choose to drive a car are required to pay for parking costs.
Cost components for six travel behaviors
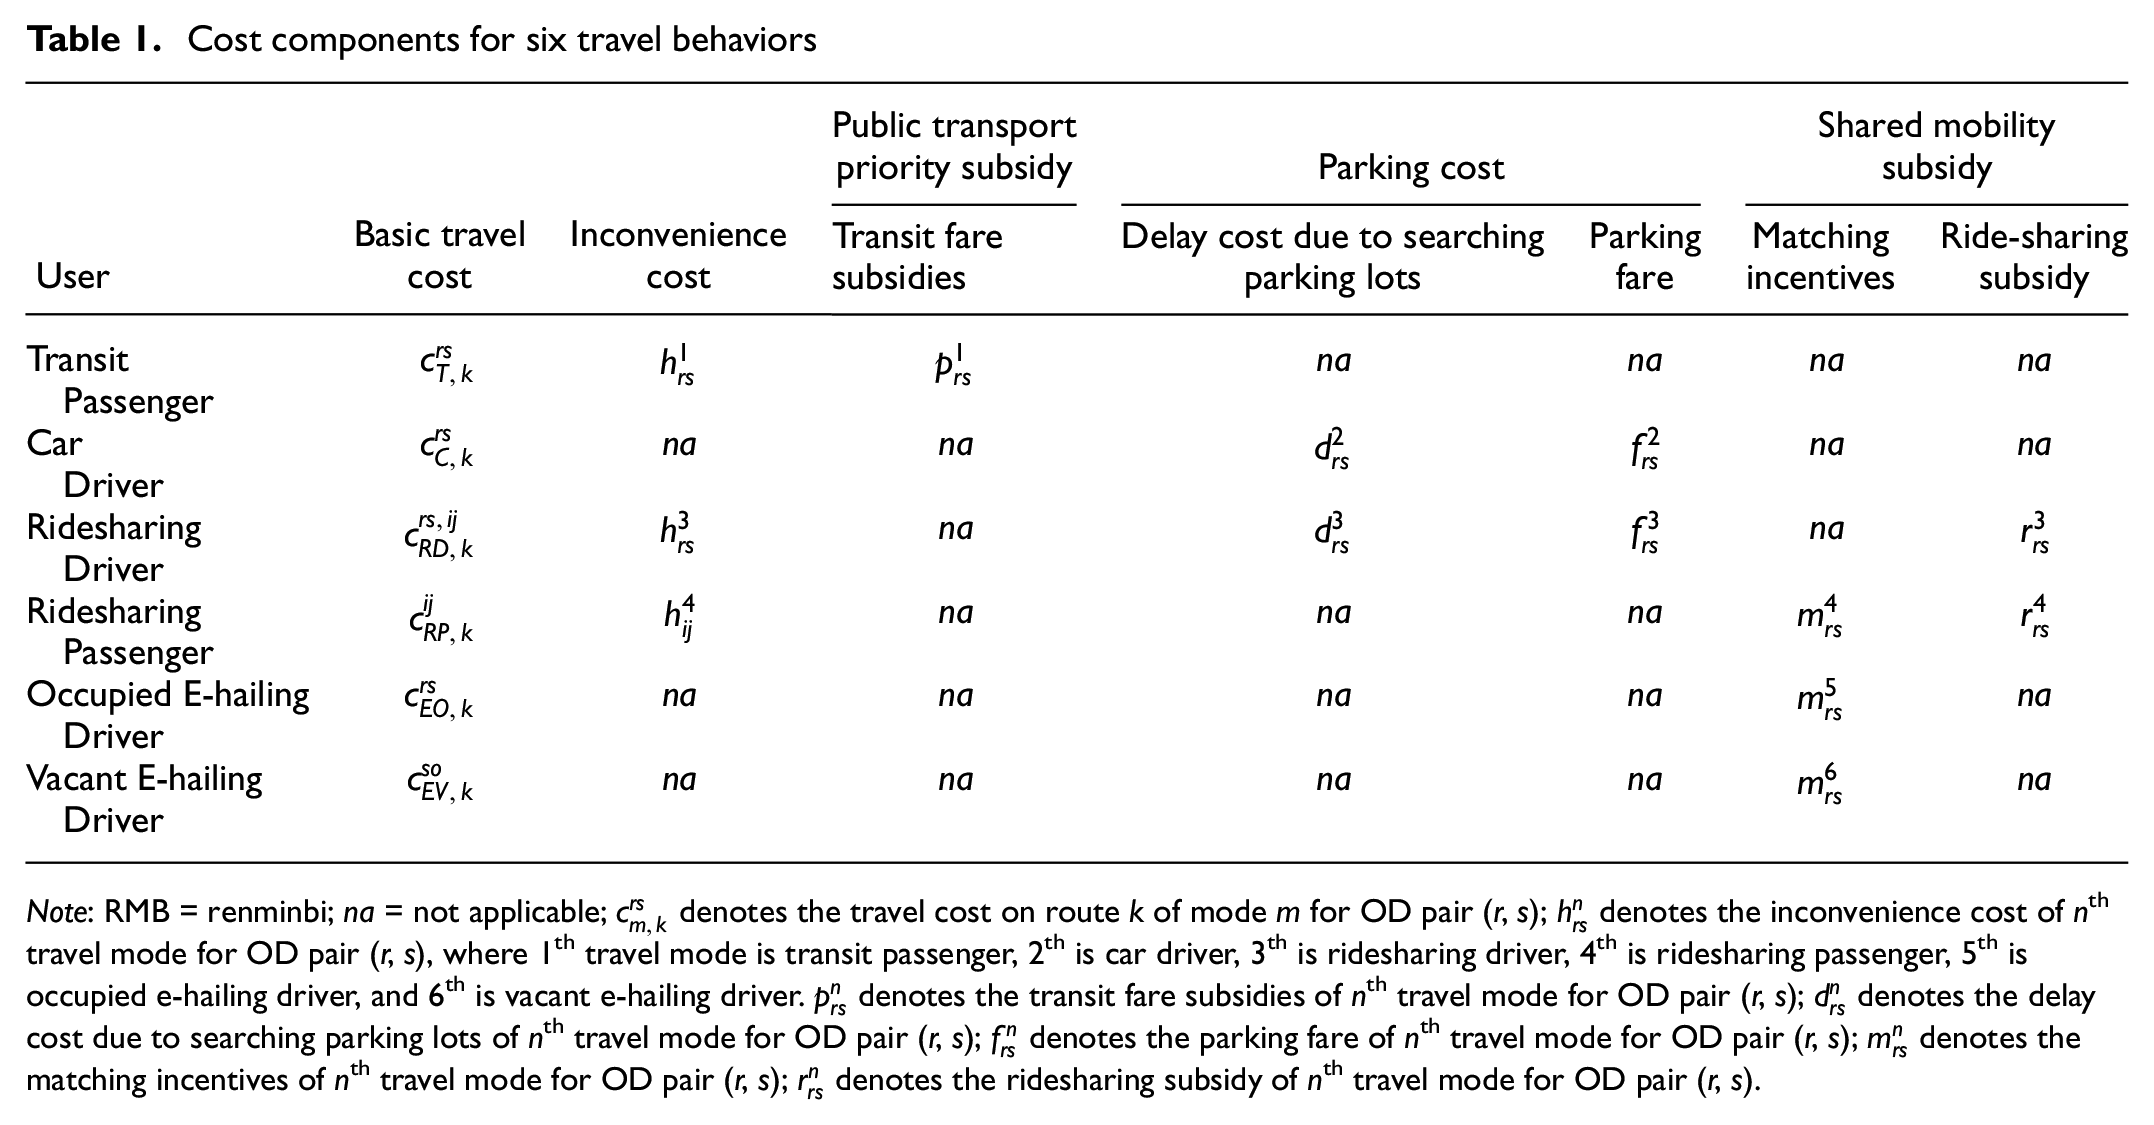
Note: RMB = renminbi; na = not applicable;
In this way, the travel costs of all six travel behaviors are influenced by three policies. In Table 1, the effect of each policy on the travel costs is expressed using the corresponding variables. Based on the travel cost functions introduced above, the travel cost under various policies should sum all the variables in Table 1.
Considering the classification of pull and push measures, the public-transport priority and shared-mobility subsidies can be categorized as pull measures, while the parking charge is a push measure. The combination of these three policies has the potential to realize synergistic effects.
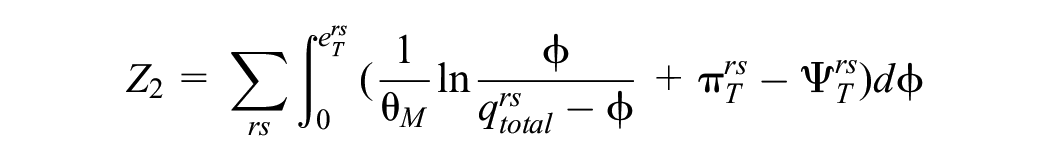
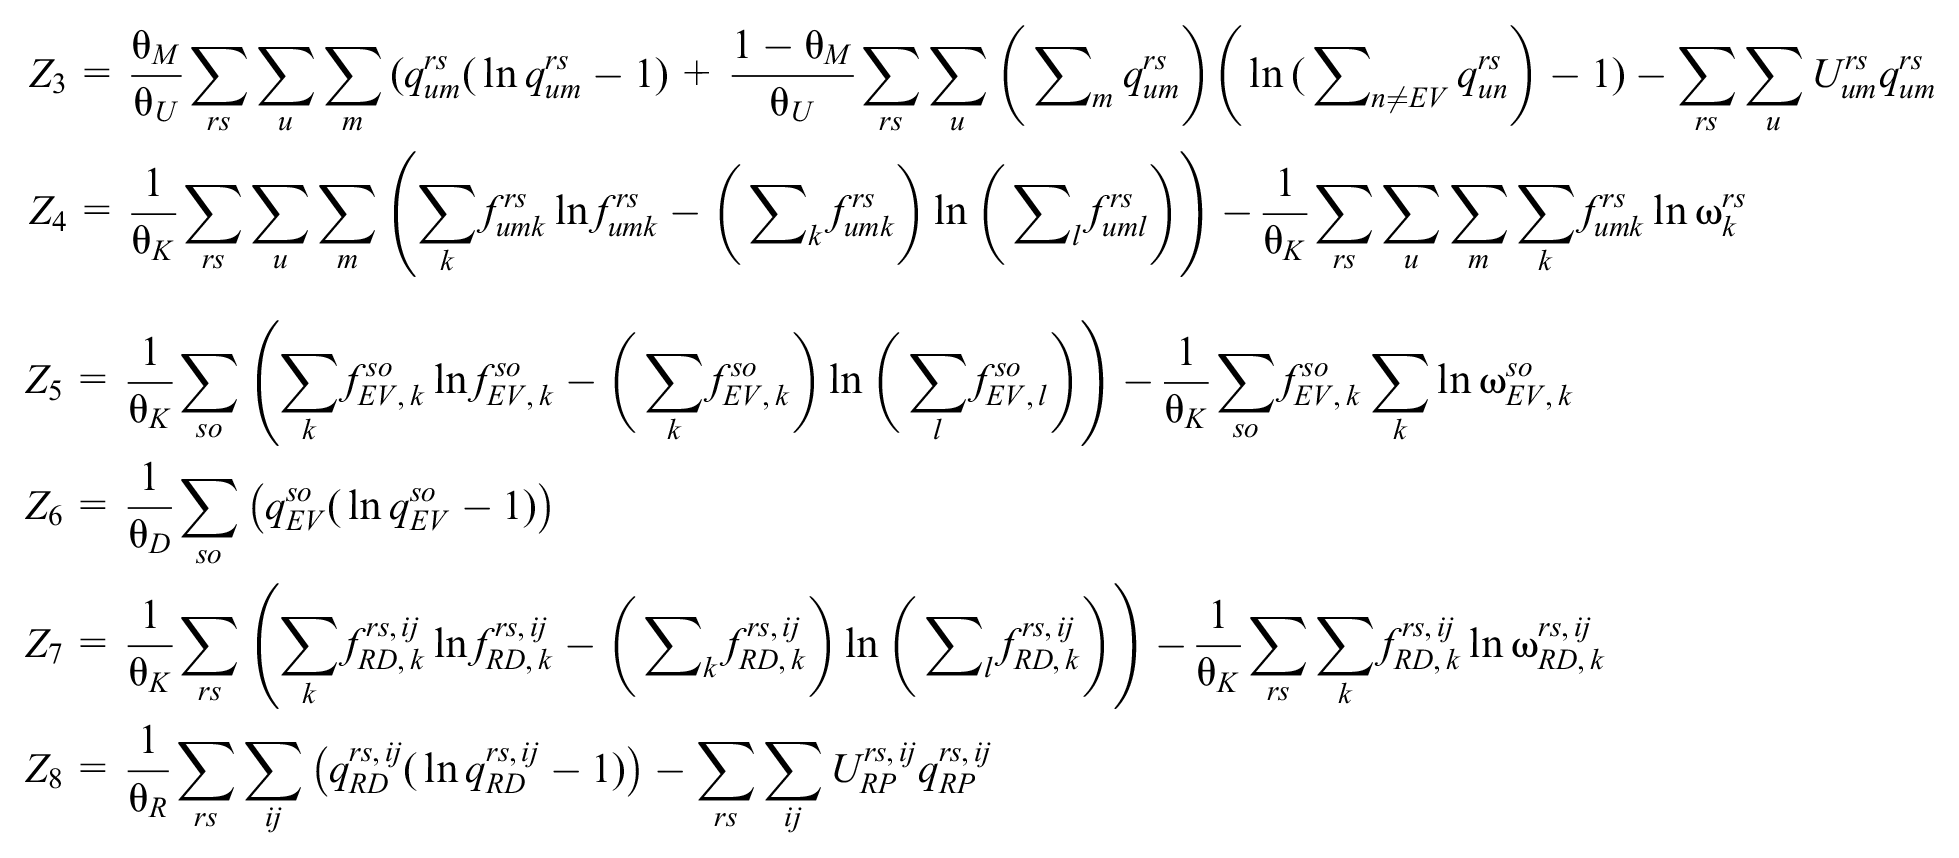
The CMSTA-ED Model Considering Shared Mobility
Based on previous research ( 7 ), we extended this model to also consider elastic demand. The proofs of equivalence, existence, and uniqueness are similar to those in ( 7 ). This study customizes the general mathematical formulation of the CMSTA-ED model for the SUE-ED model considering shared mobility in the multimodal network:


Equations (9) and (10) in Ridesharing Mode Section and Equations (14) to(16) in E-hailing Mode Section
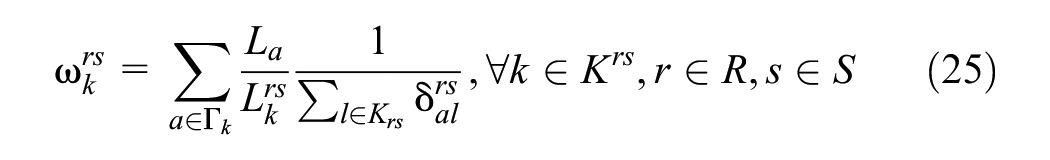
Referring to Figure 2, the proposed SUE model adheres to the NL and PSL assumptions. As a result, the MP of the NL-PSL-based SUE can be constructed using three terms: the Beckman transformation term, the entropy optimization term derived from the NL model, and the entropy optimization term derived from the PSL model. In addition, in relation to shared mobility, the fifth and sixth terms depict the e-hailing mode, and the seventh and eighth terms characterize the ridesharing mode.
Equation 19 is the objective function of the capacity model, which is used to minimize the total travel time considering the congestion effect and the mode and route choice. In Equation 20,
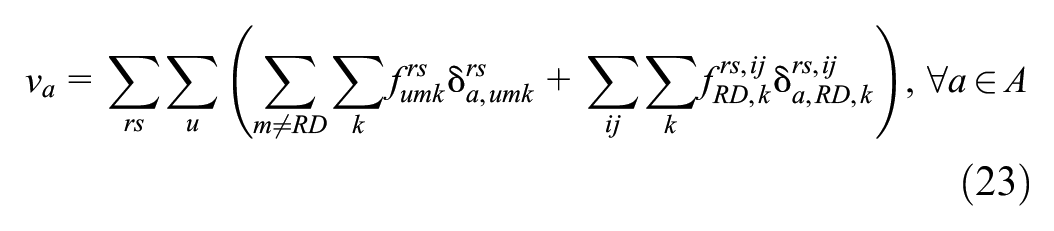
In Equation 23, it is essential to specifically highlight the ridesharing driver flow
Note that

Z
1 is the Beckman transformation that reflects the congestion effect in the road network; Z2 is the term associated with elastic demand, where
Z 5 is associated with the PSL model for the vacant e-hailing vehicle. Also, Z6 is the entropy optimization for the vacant flow in e-hailing. Similarly, the Z7 and Z8 terms provide the entropy optimization for the ridesharing path flow and the OD demand, respectively.
Road Network Capacity Model with Shared Mobility
The previous section described the lower level. The upper-level model based on the reserve capacity is presented as follows:

subject to

Equations (11) in Ride sharing Mode Section and Equations (17) in E-hailing Mode Section
The objective of the upper level in Equation 25 is to maximize the OD demand multiplier, where
The Solution Algorithm
The network capacity model is formulated as a bi-level programming problem in which the lower-level model is a CMSTA-ED problem based on mathematical programming and the upper-level model maximizes the total travel demand. Therefore, the solution algorithm in this study is divided into three parts, which are used to solve different model problems:
(a) Construct a combined path search algorithm to obtain feasible path sets in the multimode network.
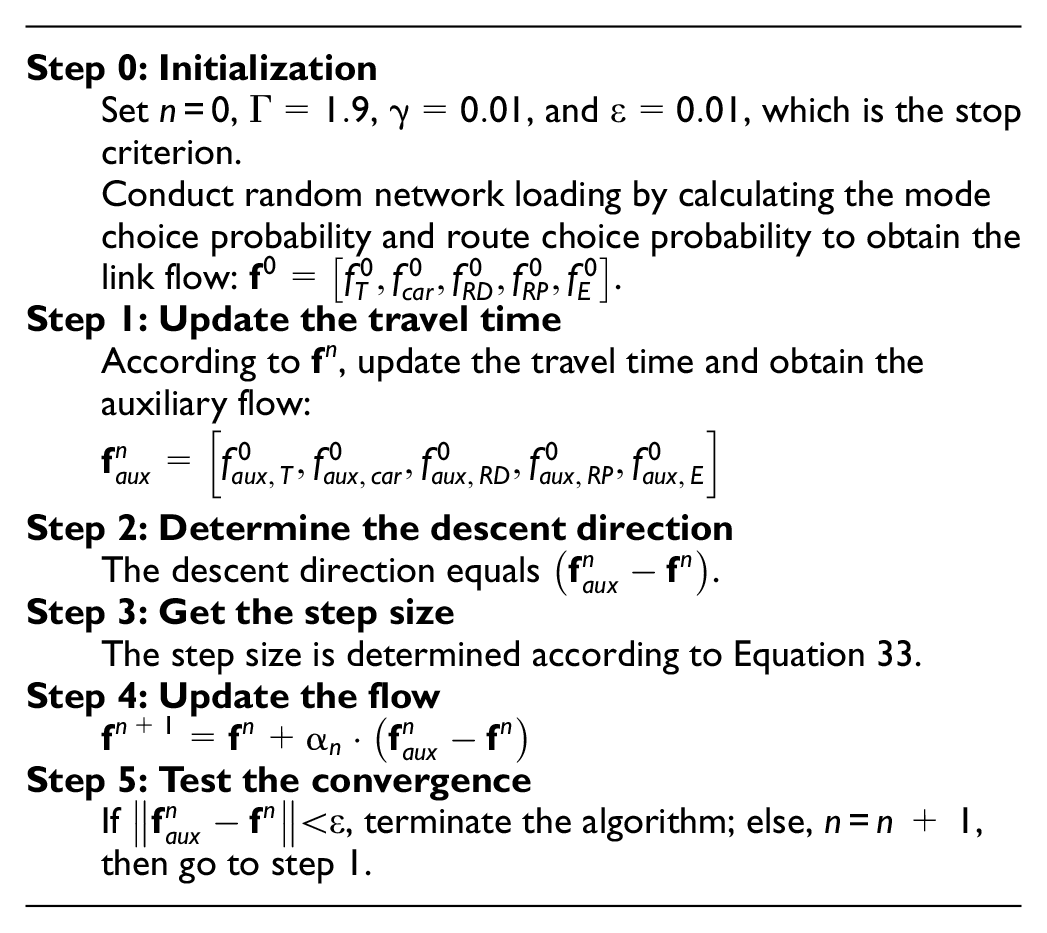
(b) Use the f-regulated averaging (SRA) method to solve the CMSTA-ED model.
(c) Use the sensitivity analysis-based (SAB) algorithm to solve the bi-level model.
Combined Path Search Algorithm
A set of paths should be generated before solving the SUE model. In this study, we use the link elimination method and link penalty method to obtain the path set, which can compensate for the shortcomings of the link elimination method (in forming a non-loop path set) and link penalty method (in relying on the penalty degree). The details of the algorithm are described in the literature ( 7 ).
SRA Algorithm for CMSTA-ED
This paper uses the SRA algorithm to solve the NL-PSL-SUE model. The SRA algorithm makes up for the shortcoming of the method of successive averaging (MSA): its slow convergence caused by the fixed search step sequence. Liu et al. ( 26 ) constructed the SRA algorithm based on the MSA algorithm, which can adjust the step sequence search direction by comparing two adjacent iterative norms. The self-adjusting step is
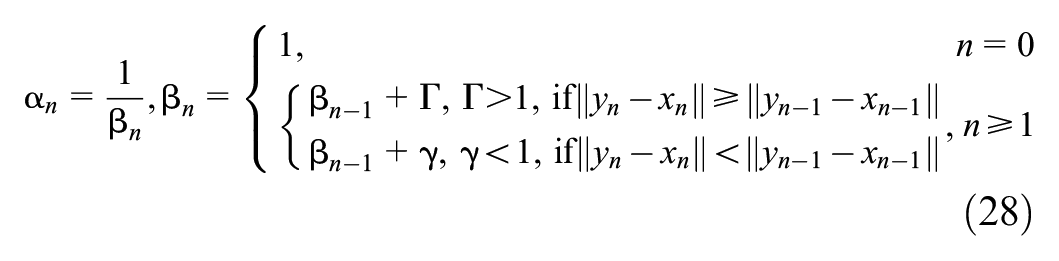
where
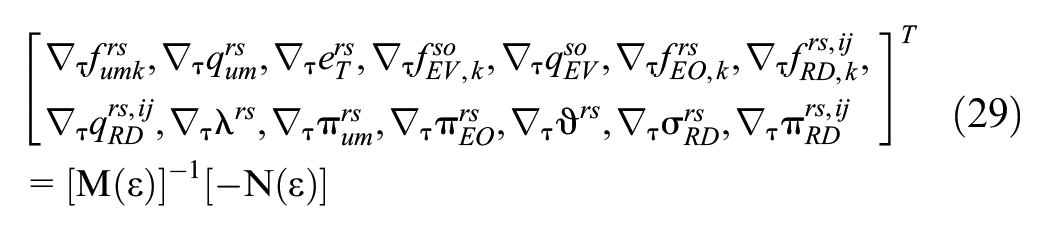
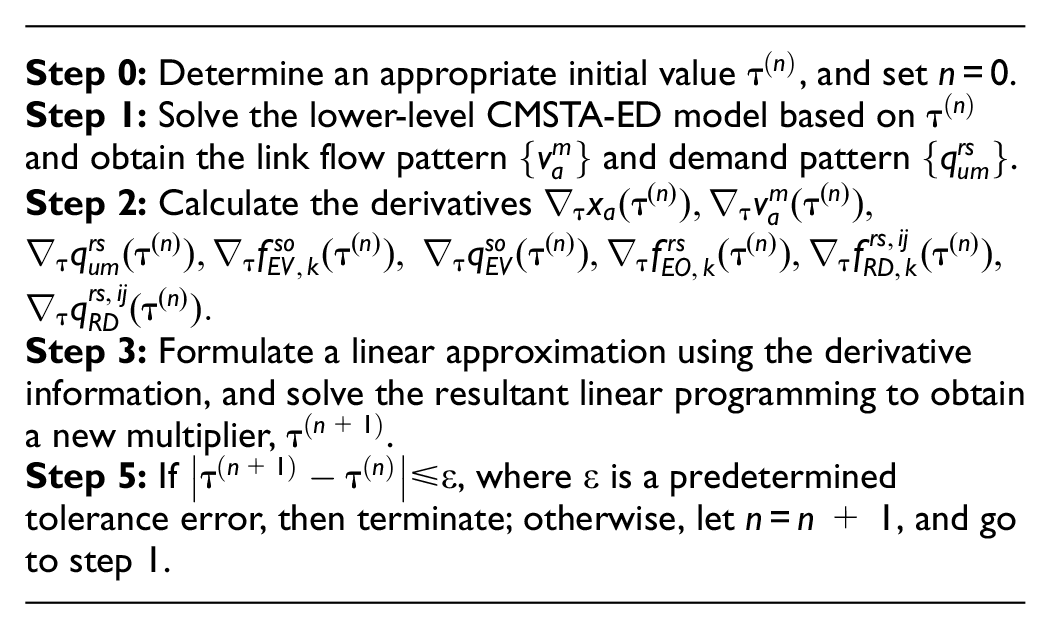
SAB Algorithm for the Bi-level Problem
Based on the derivative information generated by the sensitivity analysis of the lower model, the SAB algorithm conducts a first-order Taylor expansion of the variables of the upper problem so that the nonlinear relation of the bi-level programming problem is locally approximated to a single-level problem.
Primarily, the standard sensitivity analysis of the CMSTA-ED model is
The process of solving the bi-level programming problem based on the SAB algorithm is as follows:
Numerical Examples
In this section, the study provides three detailed examples for illustration: the effects of (i) the separate impacts and the combined impact of the e-hailing and ridesharing modes on the multimodal network; (ii) four structures of CMSTA, the corresponding NL-PSL-ED model, two NL-PSL models with different nests, and MNL; and (iii) the coordination of different policy mixes of three policy measures.
Given a two-way road network, each link’s free-flow travel time and capacity are indicated in Figure 7. We assume different lane numbers for each approach, resulting in differences in free flow travel time (FFTT) and capacity between the opposing directions on the same road in the example so as to acquire remarkable results and conclusions. Without any loss of generality, these results and conclusions can also apply to scenarios with the same FFTT and capacity in both opposing directions on one road. We assume that there are two traditional travel modes: public transit and car. The attractiveness of the car mode is set to 1, while the attractiveness of public transit is divided into 0 for low service performance and 3 for high service performance. Note that the mode attractiveness, as its name suggests, represents the travelers’ preference and significantly influences the mode share. A detailed introduction and its real-world application are elaborated by Kitthamkesorn et al. (
11
) and Xu et al. (
12
). The parameters are set to
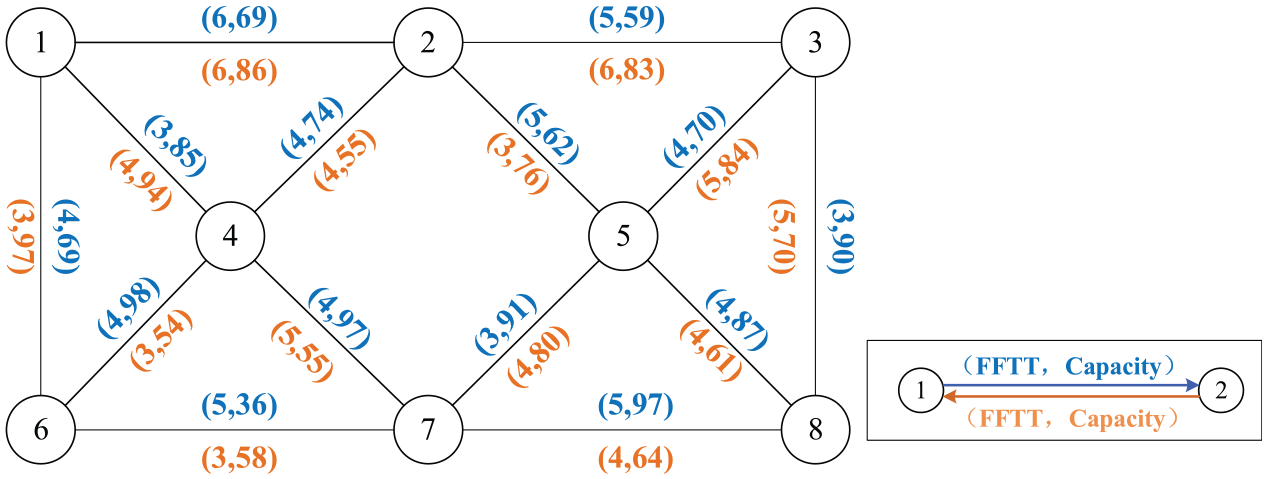
An instance of a multimodal network.
Effects of Separate and Combined Shared Mobility
Six scenarios are discussed: either increasing attractiveness of a separate e-hailing service, a separate ridesharing service, or combined e-hailing and ridesharing services—each with either poor or good public-transit levels.
Firstly, Figure 8 illustrates the changes in network capacity as the e-hailing attractiveness varies in two public-transit-service-level scenarios. Two OD pairs (1, 8) and (8, 1), both with a demand volume of 100 passenger cars per hour (pcph), are considered in this experiment. This setup allows us to observe the vacant flow at nodes 1 and 8, which serve as both destinations and origins. From the perspective of network capacity, the presence of e-hailing services reduces the overall network capacity, regardless of public-transit quality. This reduction occurs because e-hailing, as an extension of traditional taxis facilitated by the Internet, maintains the taxis’ cruising characteristics. Therefore, e-hailing operating in the network inevitably generates additional vacant vehicle flow, thereby increasing the burden on the road network and reducing its spare capacity. However, when public-transit service levels are low, e-hailing services compete with car modes, and the impact on the network capacity of increased e-hailing attractiveness becomes relatively minor.
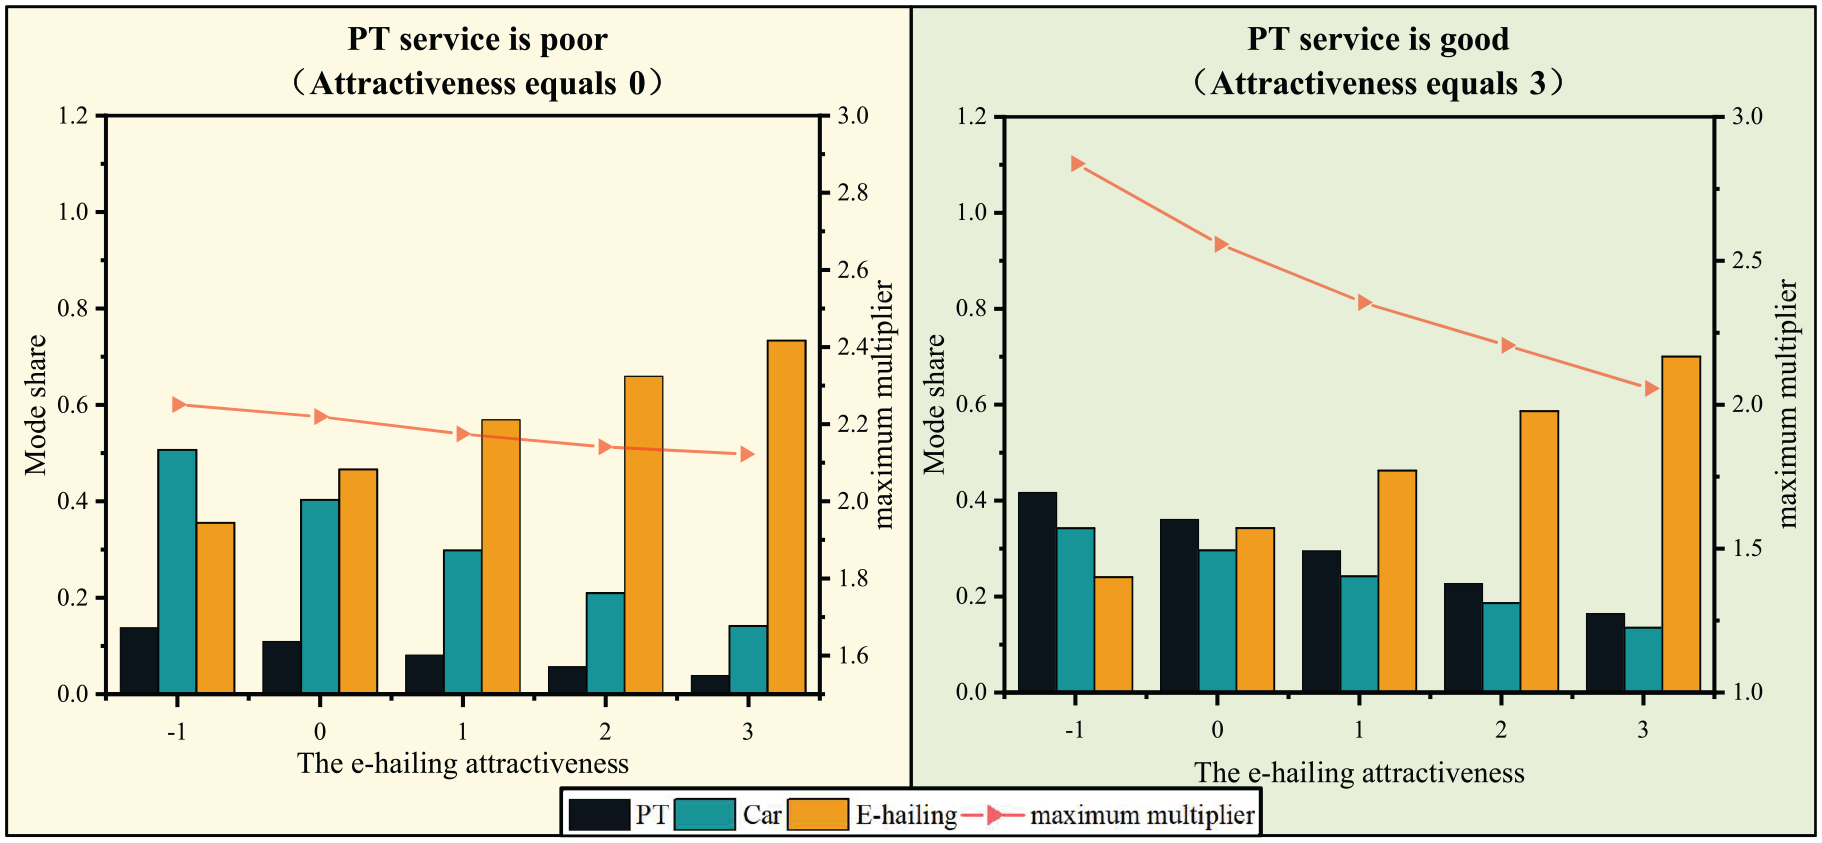
The changes in network performance on varying the e-hailing attractiveness.
Furthermore, Figure 9 presents the impact of the ridesharing mode on the road network capacity. For facilitating ridesharing matches between the OD pairs (1, 8) and (4, 8), we set two OD pairs (1, 8) and (4, 8) in the experiment involving ridesharing, car, and public-transit modes. Here, (1, 8) has a demand of 100 pcph and (4, 8) has a flow rate of 50 pcph. It can be observed that when public-transit performance is weak, an increase in the attractiveness of the ridesharing mode leads to a gradual improvement in road network capacity. There are two reasons for this. Firstly, the increased attractiveness of the ridesharing mode causes more of the traffic to become ridesharing passengers, thereby reducing the burden on the road network. Secondly, from a mode share perspective, the increase in ridesharing flow shifts from the car flow. However, when there is strong public-transit performance, an increase in the attractiveness of ridesharing gradually shifts the flow away from public transit, thereby reducing the road network capacity.
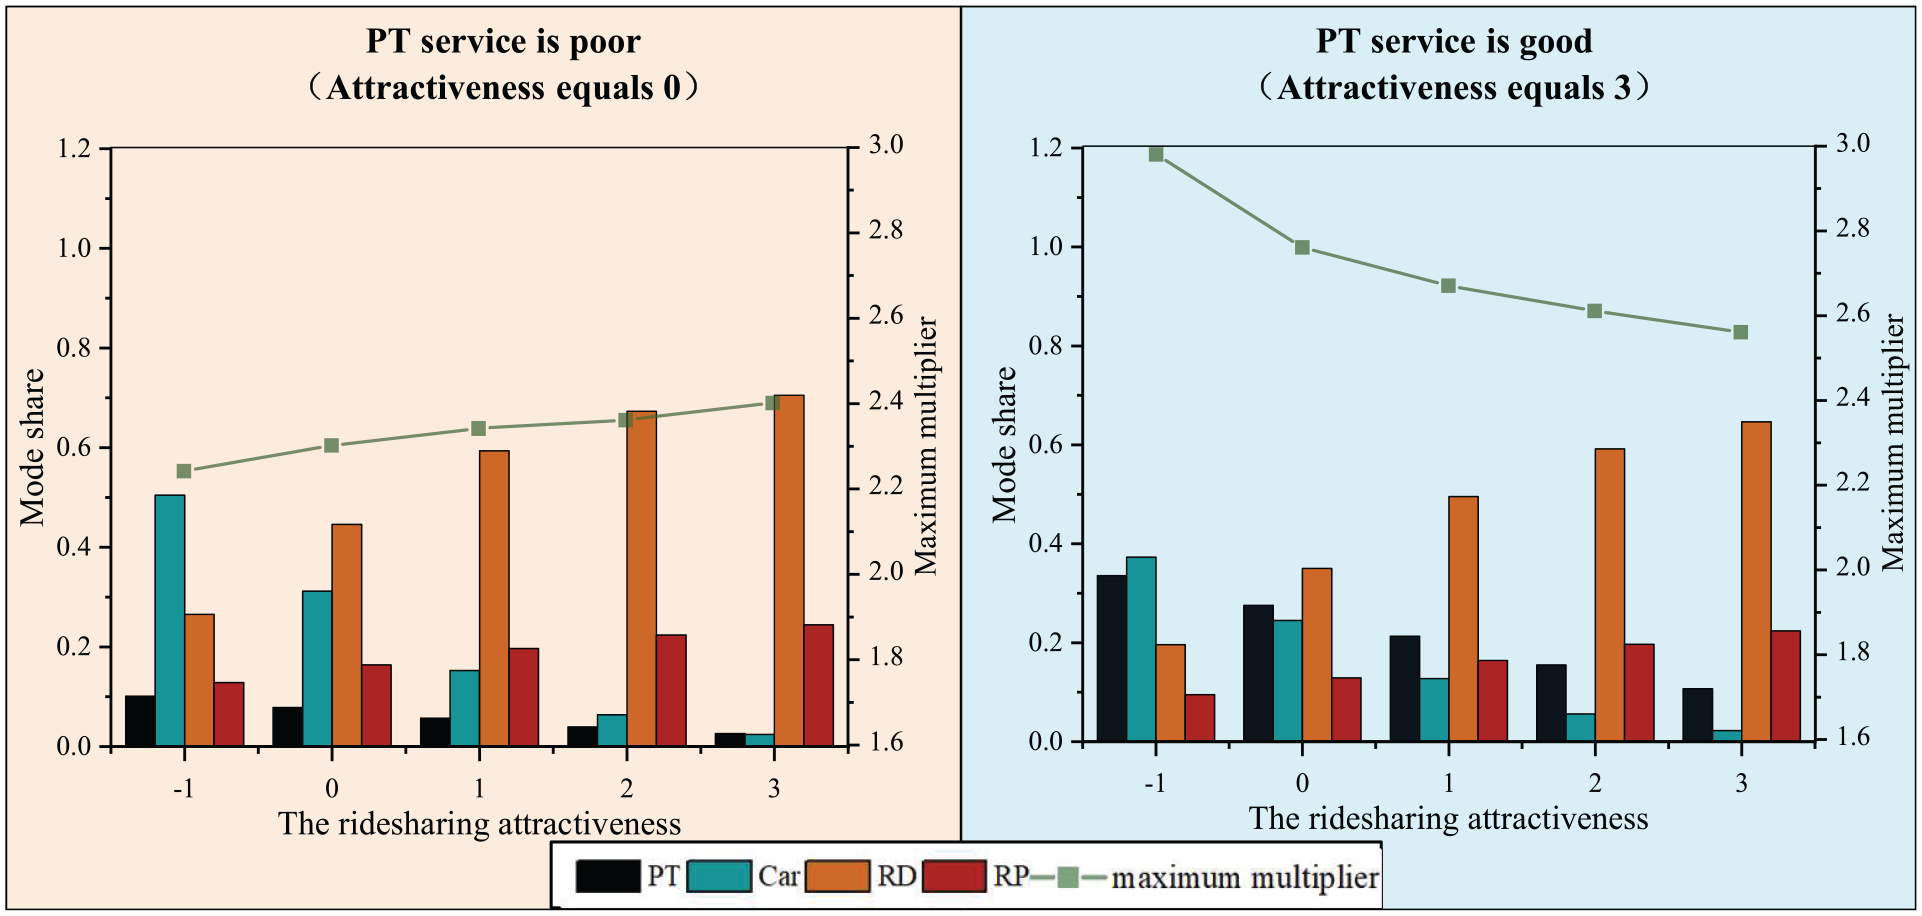
The impact of the ridesharing mode.
In summary, when the public-transit service capacity is low, ridesharing can be viewed as a supplement to public transit, and it positively affects the road network capacity. When ridesharing competes with public transit, the road network capacity decreases when there is a high level of public-transit service.
This study investigates the combined impact of varying e-hailing and ridesharing attractiveness on network capacity at two public-transit performance levels in Table 2. Three travel OD pairs are considered: (1, 8), (8, 1), and (4, 8), with a total demand of 100 pcph, 100 pcph, and 50 pcph, respectively.
The Maximum Multiplier at Low and High Public-Transit Service Levels
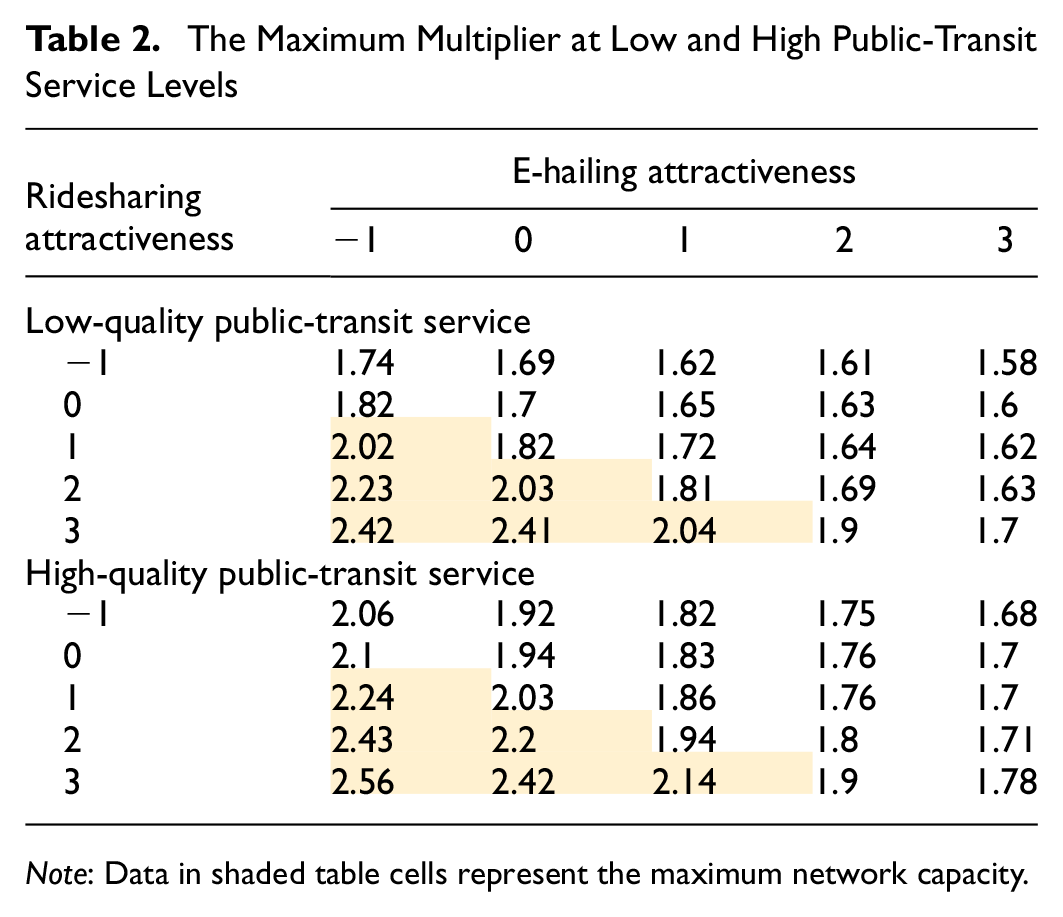
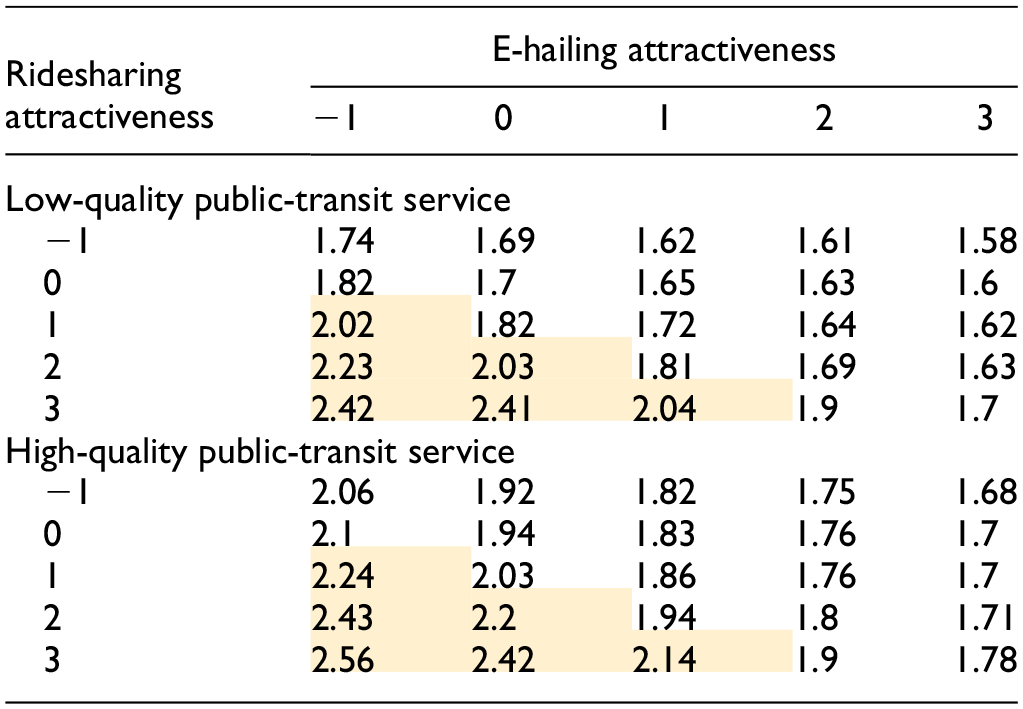
Note: Data in shaded table cells represent the maximum network capacity.
When considering both e-hailing and ridesharing modes in the multimodal network, the results in Table 2 indicate that capacity decreases as e-hailing attractiveness increases, while it increases as ridesharing attractiveness increases. Therefore, the data in shaded table cells represent the maximum network capacity. Furthermore, increasing ridesharing attractiveness leads to a slower improvement in network capacity under higher e-hailing attractiveness than under low e-hailing attractiveness. Based on the data in the tables, we conclude that promoting the ridesharing mode and maintaining a lower proportion of e-hailing in the multimodal network can enhance network capacity.
Additionally, a comprehensive analysis is undertaken by selecting the datasets with the top six highest network capacities from Table 2 to explore the interactions between shared-mobility modes. Figure 10 illustrates the composition of mode shares at various capacity levels. Note that we have sorted the six sets of data in ascending order based on their maximum multiplier values in Figure 10.
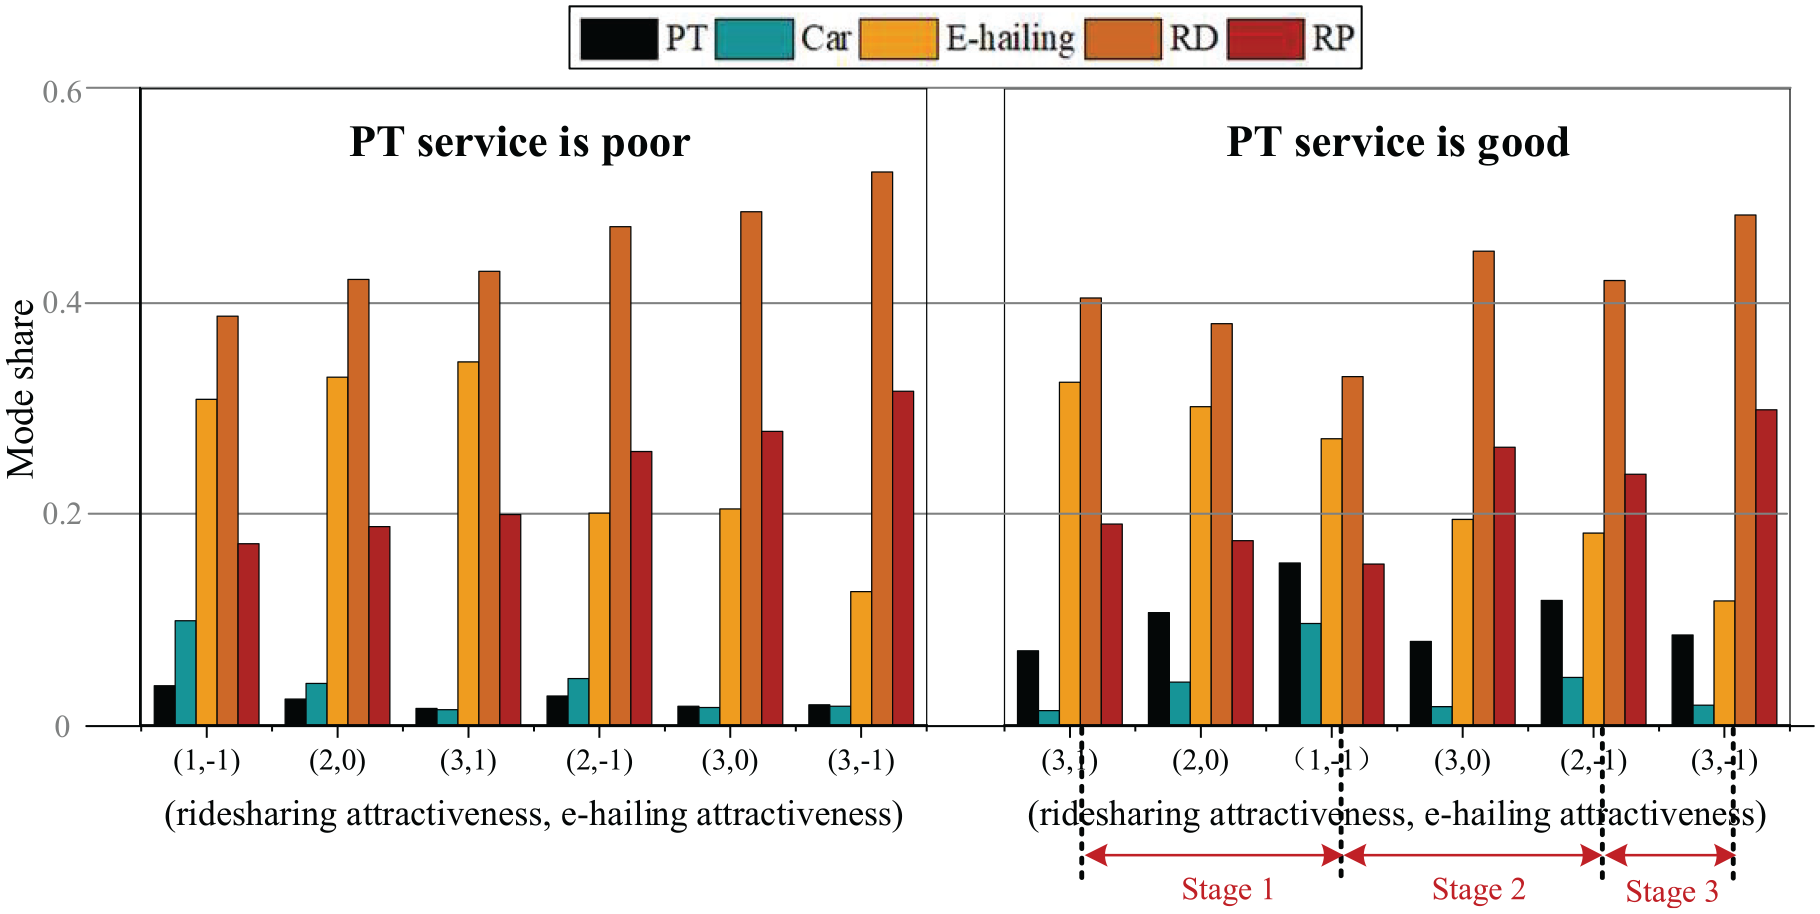
Composition of mode shares and the relationship between carbon emissions and capacity.
During periods with low public-transit service levels, the primary traffic competition within the network occurs among motor vehicle modes. Consequently, as the dominance of ridesharing gradually increases, the network capacity also experiences an increment. This observed trend aligns with the principles identified in previous single-mode analyses.
However, in the case of high public-transit service levels, the network dynamics become more intricate, unfolding in three distinct stages. In stage 1, both e-hailing attractiveness and ridesharing attractiveness decline, resulting in a primary traffic shift toward public transit. As a result, the network capacity increases. In stage 2, the public-transit flow stabilizes, and the ridesharing mode absorbs traffic from both the car and e-hailing modes, sustaining the continuous expansion of network capacity. Stage 3 indicates that an excessively high proportion of ridesharing encroaches on public-transit demand. These stages align with changes in attractiveness. Nevertheless, we will discuss whether the nest structure restricts demand shift.
Comparison of Four CMSTA-ED Structures
This section compares four nested structures, as shown in Figure 11. There are three NL structures with different nest classifications and one MNL structure. The MNL can be regarded as a special NL structure that does not consider mode similarity (i.e.,
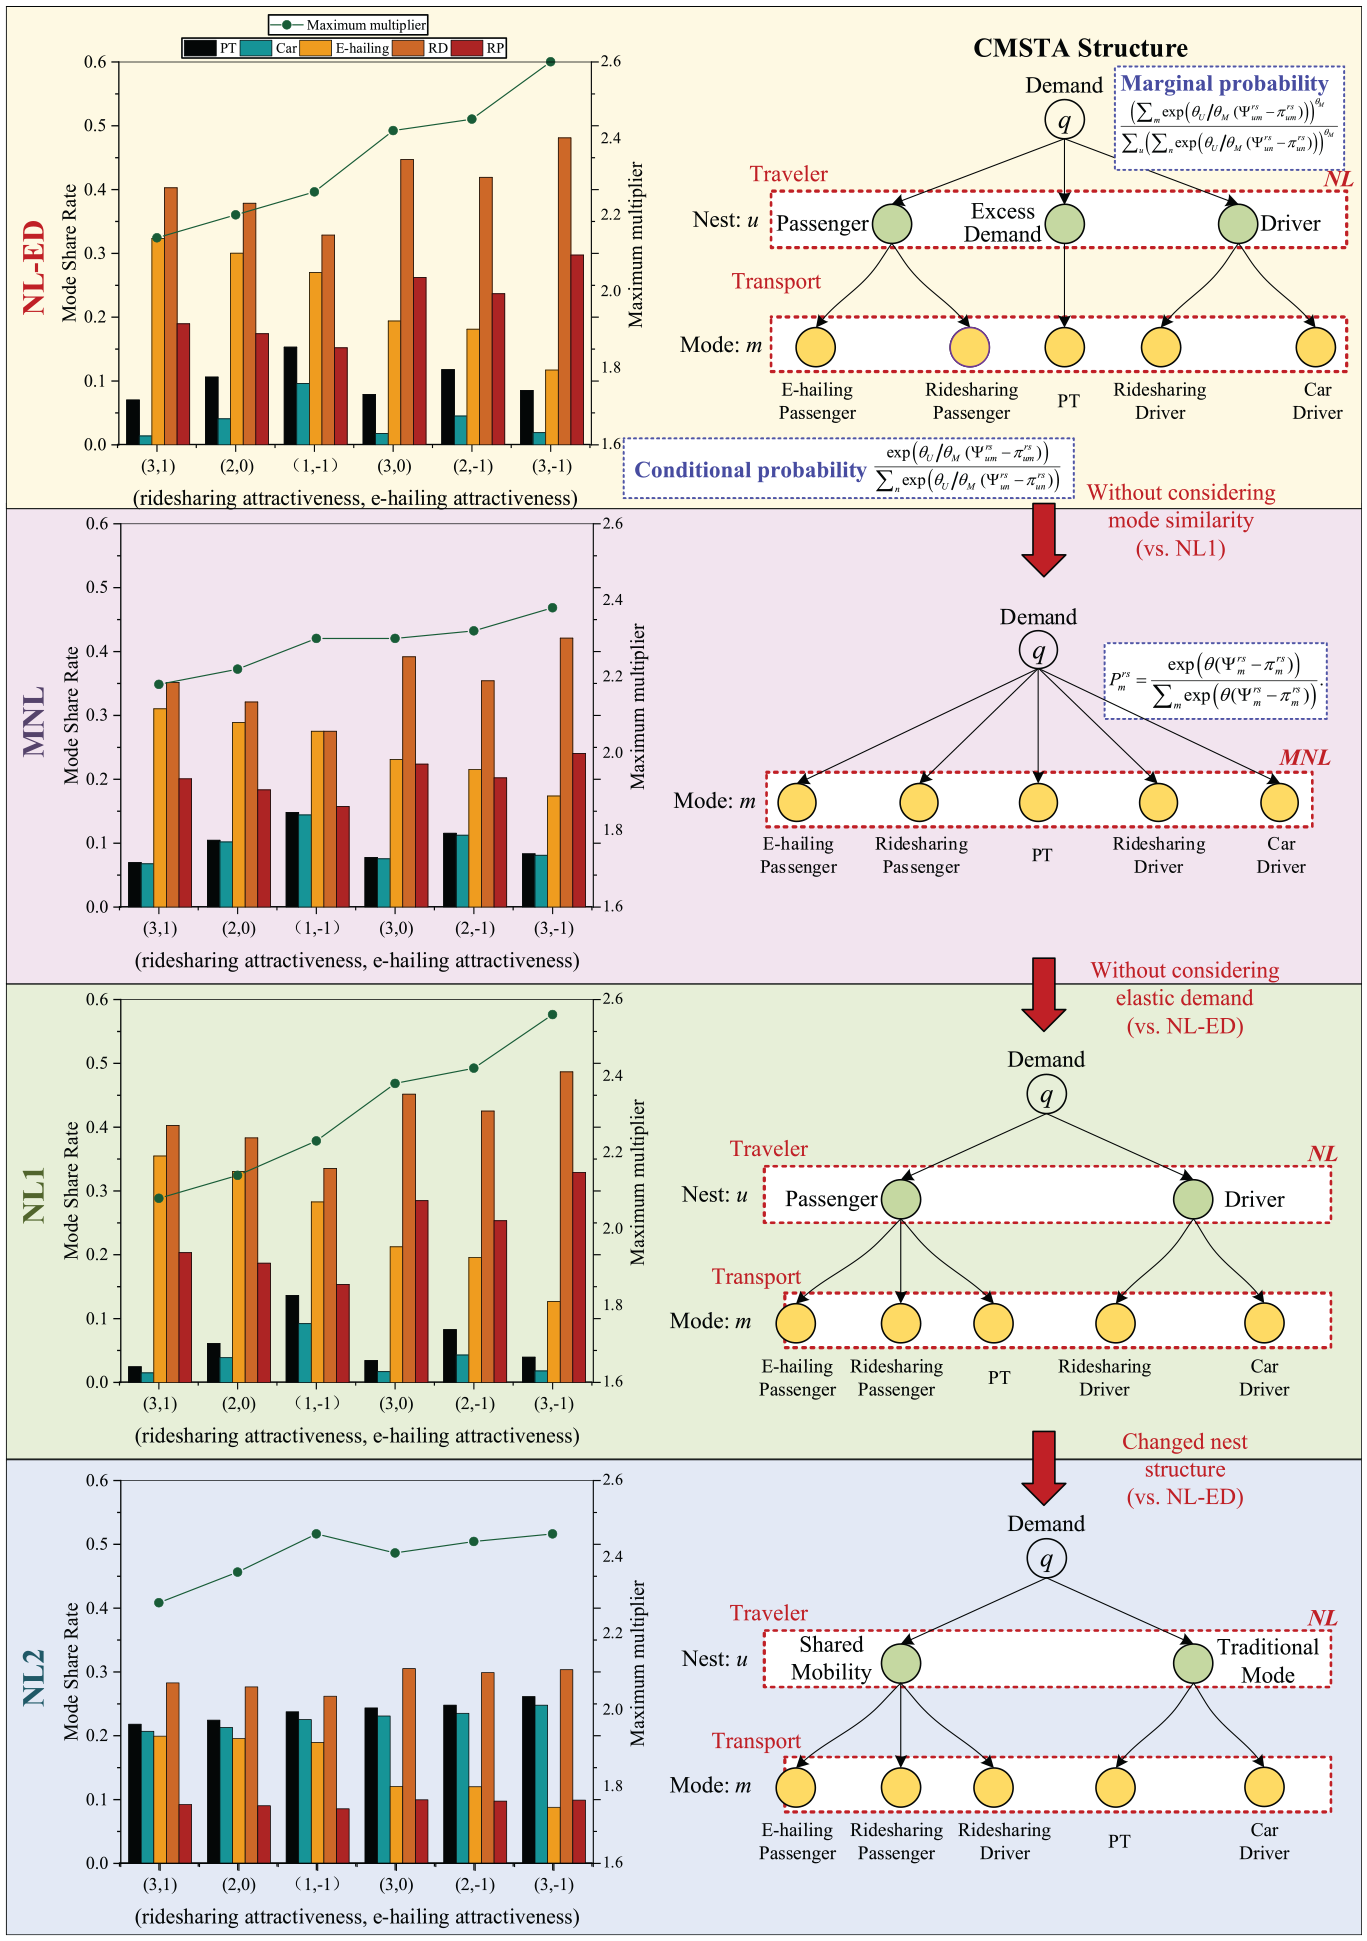
The effect of the nested structure on the mode share rate.
The MNL model does not capture the mode similarity arising from the independently distributed assumption. However, the mode similarity, which refers to the correlation of the travel modes, can be captured by the nest structure. For example, in the NL1 structure, mode similarity refers to drivers sharing the same physical links or passengers competing for limited vehicle resources. The NL2 structure considers the competition between similar travel modes from the perspective of shared mobility and traditional modes. Moreover, the NL-ED structure regards the public-transit service as a special case of external travel modes based on the NL1 structure. The three nested structures other than the MNL structure can reflect systematic behaviors. Therefore, we can introduce some exogenous indices, such as the maximum OD demand multiplier and mode share rate, to distinguish the characteristics of these nested structures.
Note that modes that share the same nest have a two-level probability tree structure (i.e., marginal and conditional), and therefore the independent mode would gain more benefit, as it does not need to get through the conditional probability. Classifying the PT mode within the “Passenger” nest diminishes the benefit in a single-level probability tree structure. For instance, by increasing the attractiveness of the e-hailing and ridesharing modes in NL1, the PT demand must decline to a lower level than that in NL-ED as a result of the competition in the “Passenger” nest. This is because the PT demand will be easier to shift to the e-hailing and ridesharing modes, as they are located in the same nest in NL1. A similar situation can be observed for the NL2 structure.
The above results suggest that to promote multimodal network performance, we should enhance the shared-mobility mode, maintain the dominance of PT, and curb the increase in the car mode. Thus, it is desirable to develop the multimodal transportation system by following the NL-ED structure, which makes PT an independent mode to protect its demand while placing the car mode and ridesharing mode in the same nest. Therefore, in this study, we employ the NL-ED structure to investigate the effect of policy mix on road network capacity. Nevertheless, the choice of nest structure should in practice depend on the real state of the given multimodal transportation system. That is, either NL1 or NL2 could be more consistent with reality.
Assessment of Policy Mix Measures
In this example, we aim to discuss the effects of various policy mixes between the public-transport priority subsidy, the parking charge, and the shared-mobility subsidy, supported by the assessment system and impact mechanism, as mentioned earlier. The implemented scenarios are listed in Table 3, with the attractiveness of public transit, cars, ridesharing, and e-hailing being set to 3, 1, 1, and −1, respectively. Note that the charge and subsidy values are set to be aligned with those observed in the real world. The variables used for policy implementation in Table 3 can be linked to the cost components presented in Table 1.
Cases for evaluating network capacity
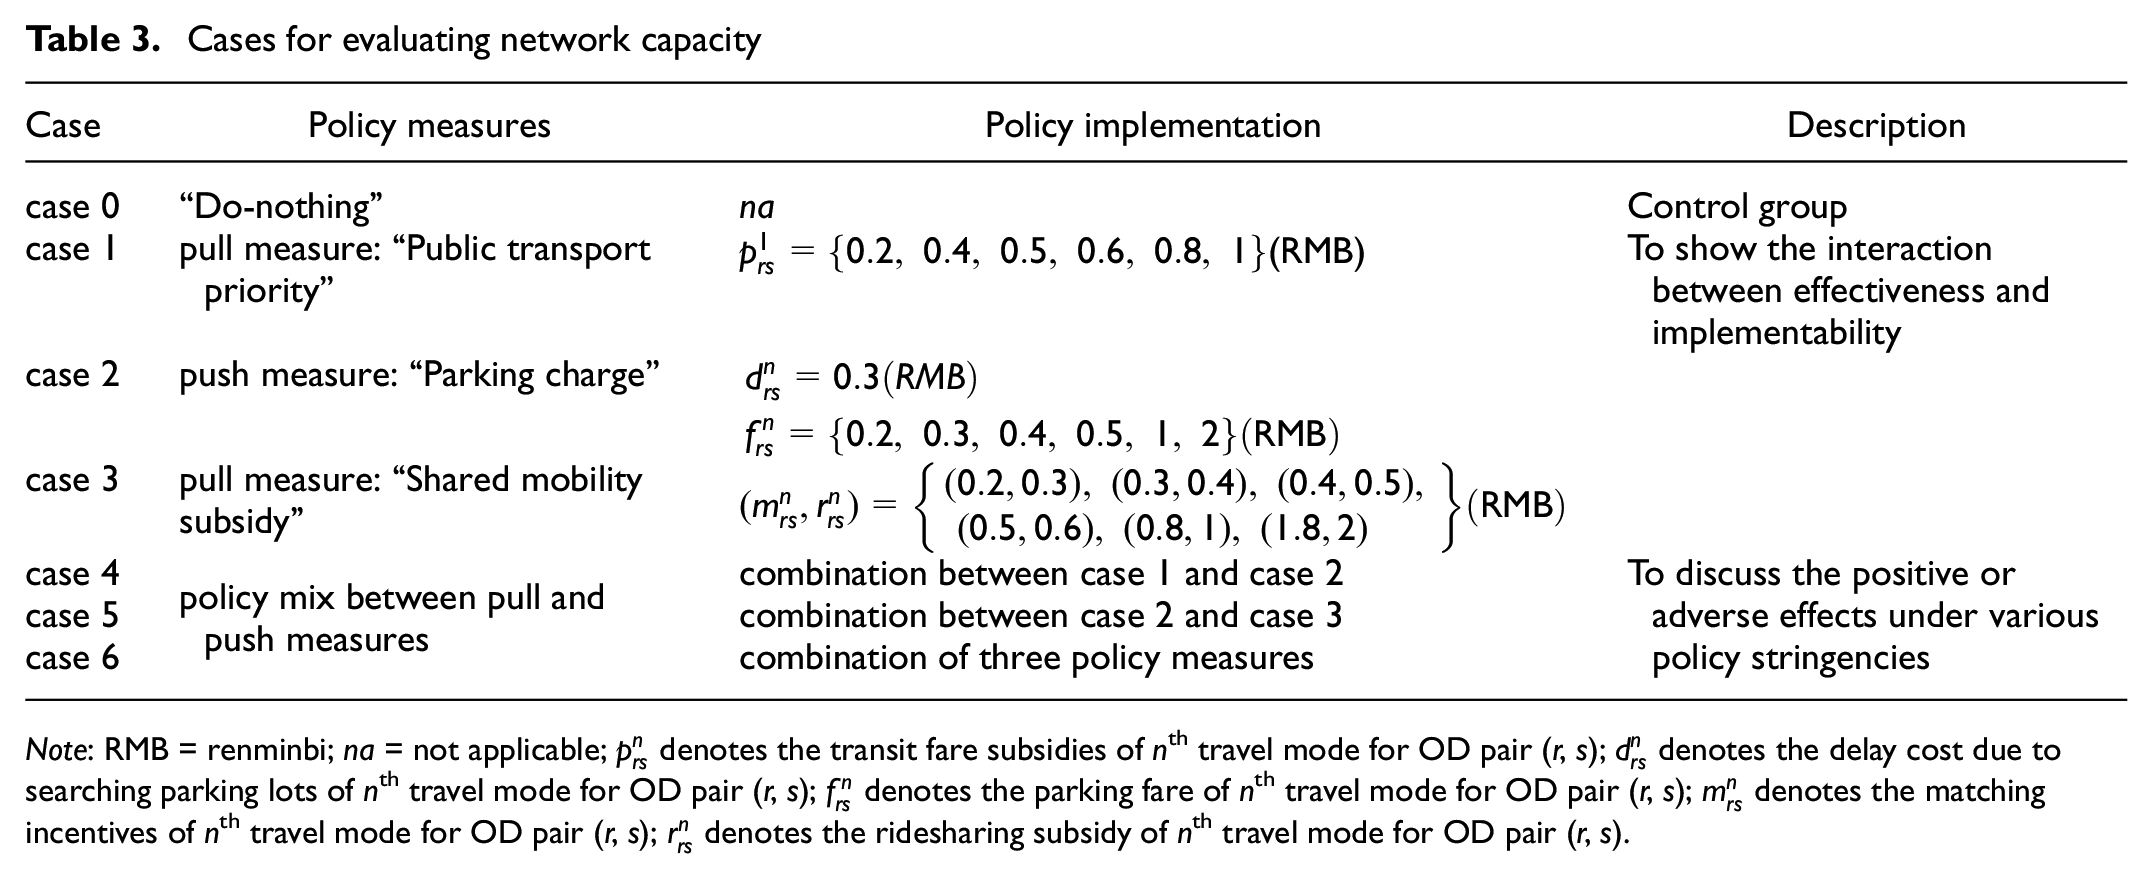
Note: RMB = renminbi; na = not applicable;
To ensure meaningful validation, reasonable adjustments corresponding to the data listed in Table 3 were made to the charge and subsidy values to tailor them to this paper’s small-size network, as depicted in Figure 12.
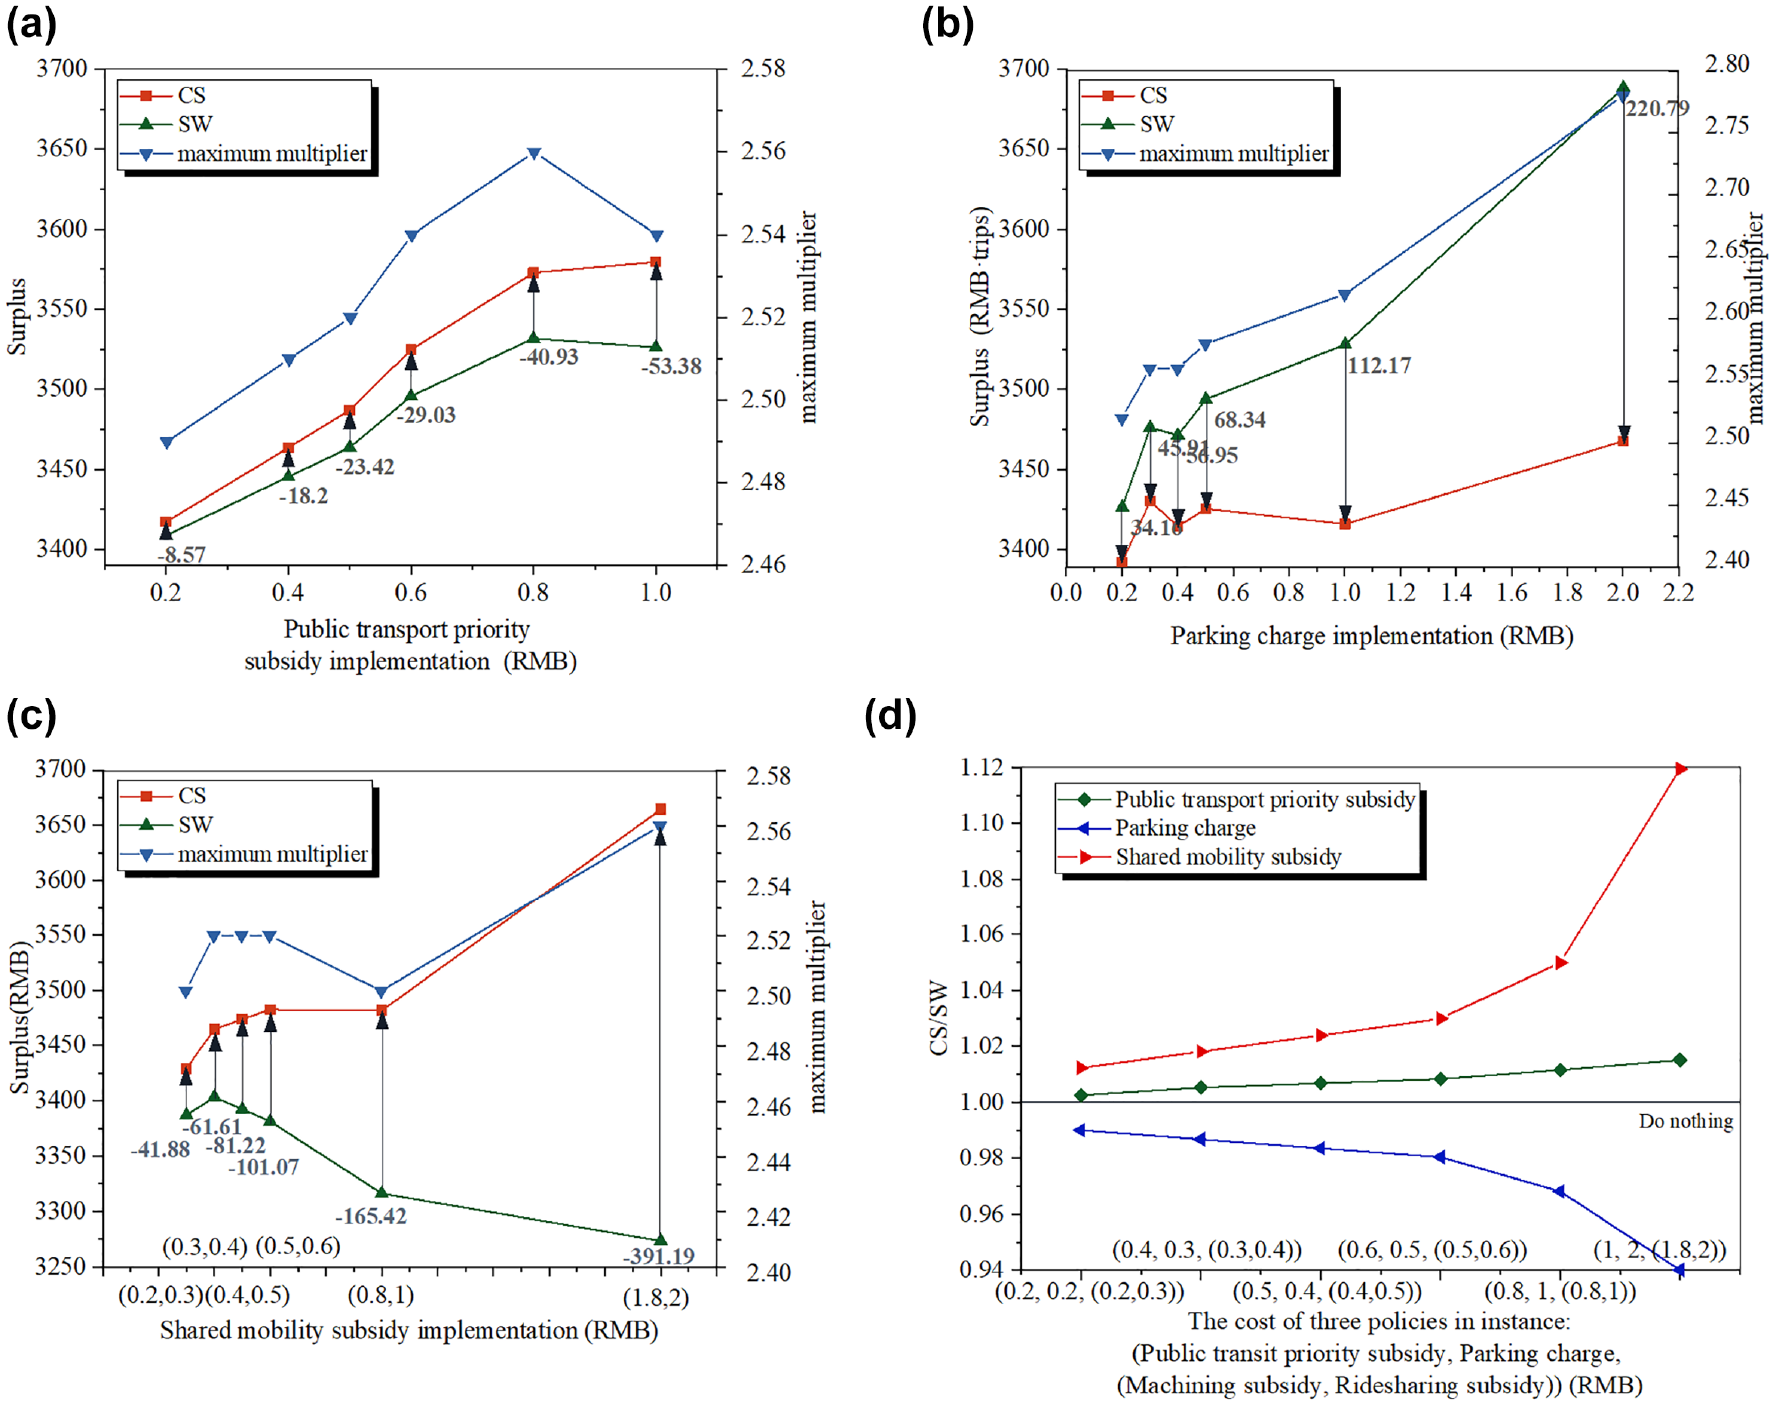
Effects under the implementation of three independent policy measures: (a) sample 1, (b) sample 1, (c) sample 3, and (d) sample 4 (CS/SW of the three policies, where “CS” is the customer surplus).
As shown in Figure 12a, the introduction of the public-transit priority subsidy policy results in an initial increase in SW with respect to the subsidy level, followed by a decrease after reaching an extreme subsidy level. This pattern is explained by noting that while increasing the public-transit demand can raise the maximum multiplier, it simultaneously decreases revenue. In Figure 12b, it is evident that higher charges lead to increased toll revenue but a reduction in CS, potentially affecting the public acceptance of policies. Moving on, Figure 12c illustrates that subsidizing shared mobility, while meaningful, proves to be ineffective. Therefore, Figure 12d summarizes the ratio CS/SW for the three policies under similar charge and subsidy levels, providing insights for potential combined policy implementation.
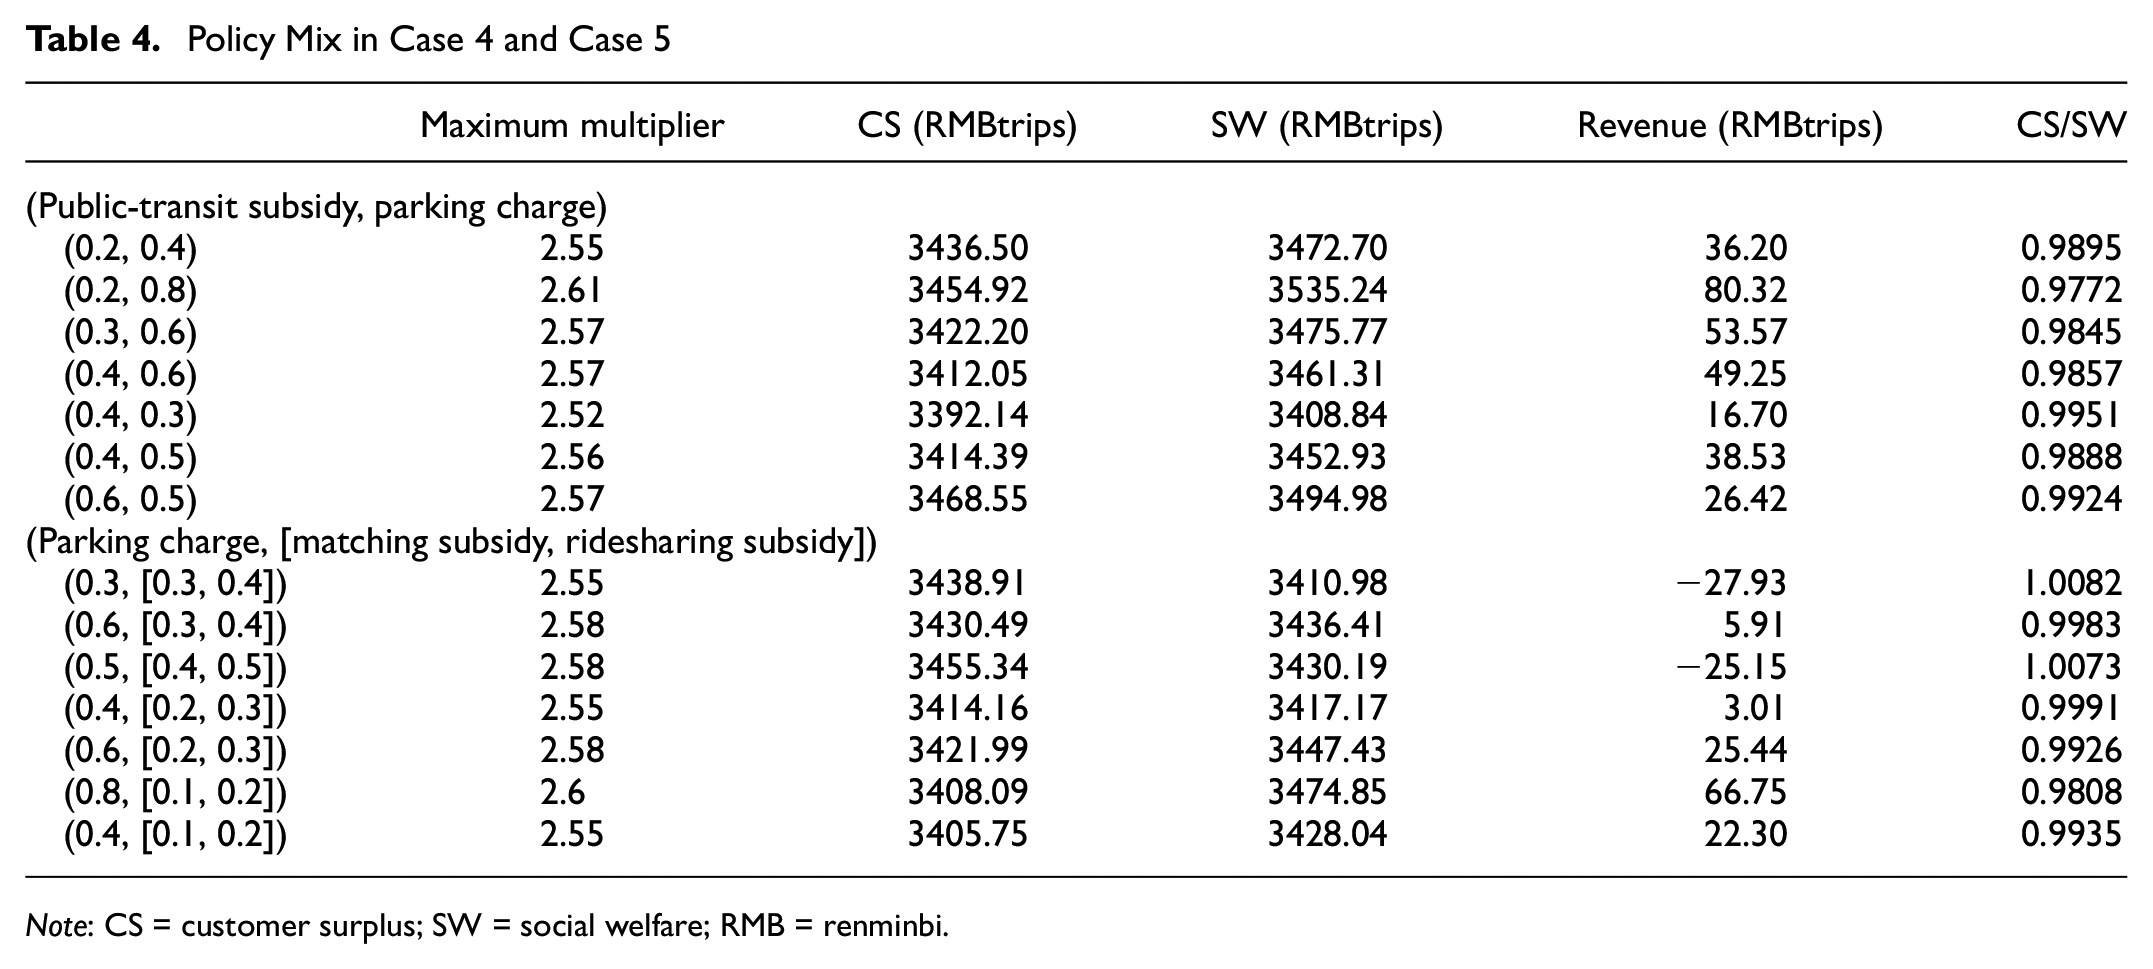
The data suggest that the network performance is not solely determined by the individual policy stringency. Therefore, we introduce the effects of the three policy mixes in Tables 4 and 5. In these tables, the value of CS/SW indicates the extent of the relative variation in CS and SW.
Policy Mix in Case 4 and Case 5
Note: CS = customer surplus; SW = social welfare; RMB = renminbi.
Policy Mix in Case 6
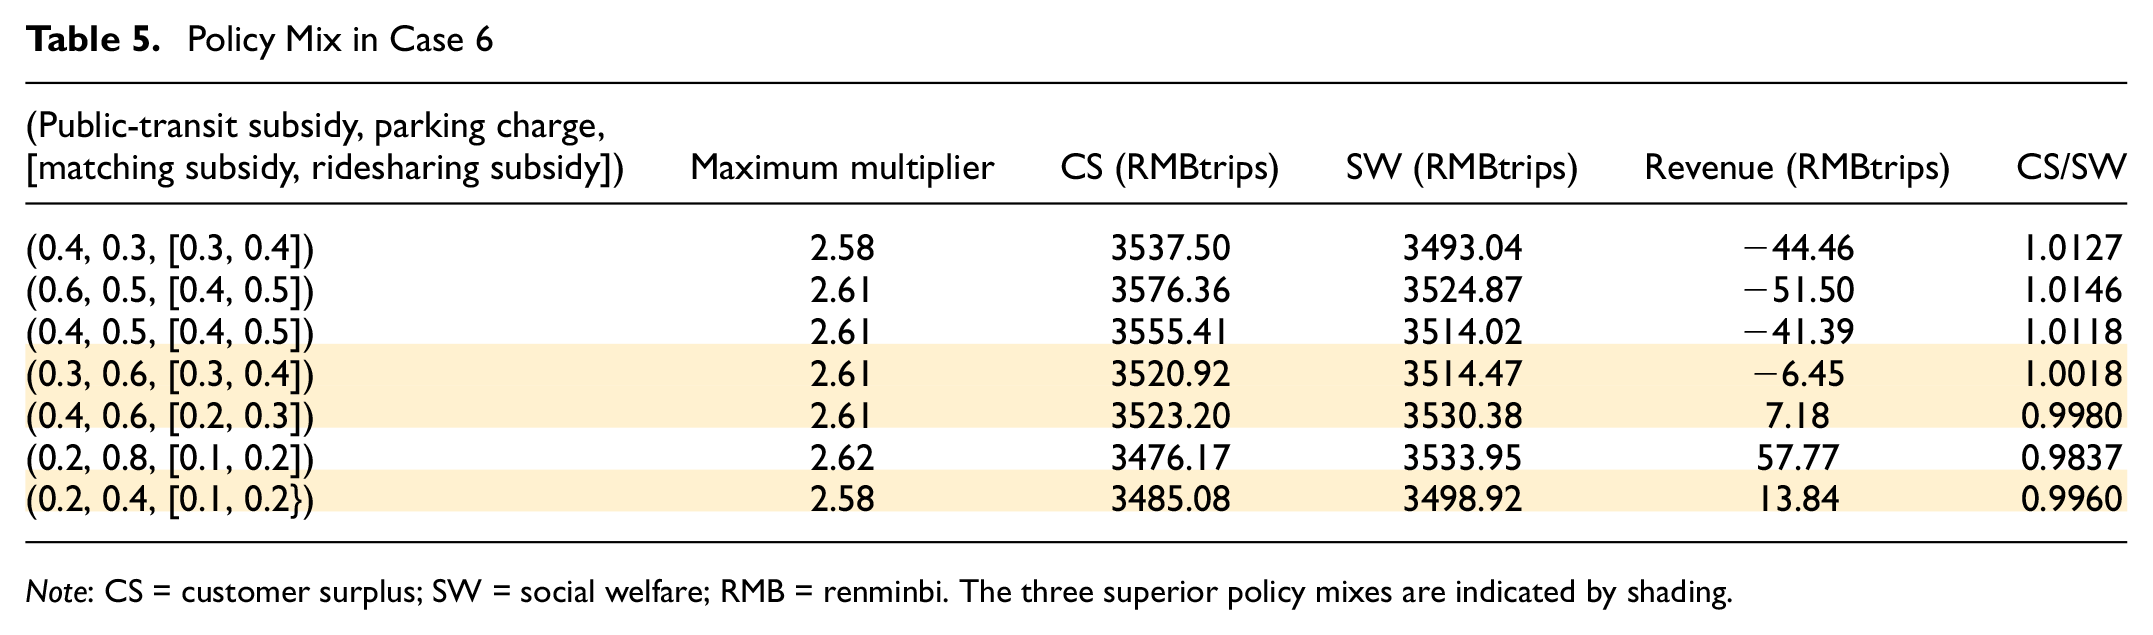
Note: CS = customer surplus; SW = social welfare; RMB = renminbi. The three superior policy mixes are indicated by shading.
Table 4 highlights that growth in parking charges would enhance network capacity at the same subsidy level. This is attributed to the increase in the travel impendence of the motor modes on increasing charges, which leads to a shift in travel demand to public transportation (public transit). Consequently, the significance of the incorporation of subsidy policies is more centered on improving public acceptance, thereby fostering increased compliance with charge policy measures.
In Table 5, we gradually test the synergistic effects between separate policies with various policy intensities.
We find three superior policy mixes, as indicated by shading in Table 5. In summary, the results show that positive synergistic effects between policy measures are not determined by the optimal size (number of measures) or the policy stringencies. Policy measures never work in isolation. Their combined performance improvement depends on their interactions with other measures, that is, avoiding contradictory effects and reducing adverse unintended (side) effects. Thus, we find three policy mix measures that can enhance both capacity and SW.
Conclusions
This paper extends network capacity analysis to consider elastic demand and shared-mobility options (e-hailing and ridesharing). It proposes a capacity model to assess the synergy of the policy mix in an urban multimodal transportation system. Given the importance of modeling the effects of combining policy measures, we focus on exploring the impact mechanism of shared mobility to formulate mode-specific policies, thereby establishing an assessment system.
The conclusions drawn from this study are as follows. (1) E-hailing, similar to traditional taxis, retains a cruising characteristic, which attracts vacant flow and reduces the road network capacity. (2) Ridesharing matches the ridesharing passengers’ demand, relieving traffic congestion. When there is no competition between the ridesharing and public transit, ridesharing contributes positively to the road network capacity. (3) A policy mix of public-transit priority subsidy, parking charging, and a shared-mobility subsidy can achieve optimal synergy, while each individual policy is not satisfactory. Moreover, the model-driven policy mix analysis can capture the precise share ratio to leverage the shared mobility’s characteristics and enhance multimodal network performance.
Several extensions of this study can be explored in future research. Firstly, it is essential to comprehensively measure the discomfort costs of all travel modes in a multimodal network. For instance, the EPC for public-transit passengers can increase as more travelers choose this mode. Similarly, the EPC for e-hailing passengers can rise when many passengers are waiting for a limited number of e-hailing drivers; both of these discomfort costs should be considered in the modeling. Additionally, it is worthwhile to explore novel methods to determine the optimal mix. In the future, we can create a quantitative analytical model to study the inherent interactions among varying measures.
Footnotes
Author Contributions
The authors confirm contribution to the paper as follows: study conception and design: M. Du; data collection: Z. Ju, M. Du; analysis and interpretation of results: M. Du, Z. Ju; draft manuscript preparation: Z. Ju, M. Du. All authors reviewed the results and approved the final version of the manuscript.
Declaration of Conflicting Interests
The author(s) declared no potential conflicts of interest with respect to the research, authorship, and/or publication of this article.
Funding
The author(s) disclosed receipt of the following financial support for the research, authorship, and/or publication of this article: Research support from the Natural Science Foundation of China (no. 71801079) and the Project on Excellent Post-graduate Dissertation of Hohai University (no. 422003472).