
Abstract
Despite its primary role in shaping policy and service characteristics, board governance is an understudied topic in the field of urban transit. Existing research on board management and representative bureaucracy theory suggests that the race and gender diversity of boards has a significant impact on organizational activity but that these relationships are highly dependent on the cultural context and industry analyzed. In this paper, we evaluate how the diversity of transit boards (with respect to race, gender, and disability) in the U.S.A. correlates with service changes authorized by these boards during the COVID-19 pandemic. Utilizing a database on board governance and general transit feed specification data for 36 agencies, we find a positive relationship between the presence of women on transit boards and vertically equitable service cuts, defined as increasing or maintaining transit service in more vulnerable neighborhoods. Overall, transit agencies with more female board members had more equitable service cuts, on average, during the COVID-19 pandemic.
Urban transportation patterns shifted considerably during the COVID-19 pandemic ( 1 – 5 ). Nationwide, public transit providers struggled to balance the mobility needs of essential workers with concerns about public health, reductions in farebox revenues, and high rates of absenteeism among workers as well as increased expenses of protective gear and deep cleaning fleets ( 6 ). Concurrently, the pandemic brought heightened awareness to the vital nature of transit services in moving the often low-income and transit-dependent members of the essential workforce ( 7 ). Transit executives and boards in the U.S.A. exhibited considerable discretion in their reorganization of services in response to the pandemic ( 8 ). In some cities, such as Seattle and Miami, minor service cuts were implemented system-wide, while in other cities, such as San Francisco and Portland, public transit providers increased service to areas with transit-dependent and low-income residents ( 9 ). The majority of research on the topic of public transit and global pandemics uses service and ridership data to identify trends in the use and provision of public transit during global health crises ( 7 , 10–13). Preliminary assessments conducted during the height of COVID shutdowns suggest that many U.S. providers took specific steps to protect or even enhance transit services to low-income and minority neighborhoods, who tend to be the primary users of public transit services in American cities ( 14 ).
What remains less clear is how the composition of transit boards and board deliberation processes influenced decisions to reduce, cut, or enhance public transit services across localities. Transit governance is an understudied topic in the field of urban transit, despite its primacy in shaping transit services, investments, and amenities ( 15 ); the lack of attention to context and power is indicative of a field that prioritizes technical questions and minimizes concerns with public decision-making ( 16 ). Board governance and representation shape policy and operational decisions related to transit and urban transportation ( 17 ), but remain undertheorized as causal mechanisms ( 18 ). The limited gray literature on the topic suggests that transit boards have different race and ethnic compositions than the populations they serve ( 19 ). Transit riders are disproportionately female ( 20 ), people with disabilities ( 21 ), low-income, and people of color ( 22 ).
The purpose of this paper is to address the question of whether transit boards in the U.S.A. with greater representation by women, people of color, and people with disabilities were more likely to make more equitable changes to transit service during the period between February and May 2020, when ridership, revenue, and risk-mitigation strategies changed with the onset of the global COVID-19 pandemic. In the following sections, we summarize the literature that informs our hypothesized relationships between transit board demographics and the equity of pandemic-induced service changes. Then, we describe our methods for:
developing metrics to describe each of three dimensions of the equity of transit service changes (race-based equity, income-based equity, and education-based equity);
determining the representation of women, people of color, and people with disabilities on each of the transit boards in our study sample; and
testing the relationship between board demographics and measures of the equity of changes to transit services.
We do not find evidence that the racial composition of a transit board has a relationship with the equity of pandemic-induced service changes, but we do find that the equity of service changes are significantly and positively associated with the percentage of board members who are women. Results on the association between service equity and the presence of a board member with a disability were limited because of the small number of transit boards for which were able to identify a member with a disability. We conclude with a discussion of the implications of these findings and a call for further research to illuminate the reasons for the relationships this study uncovers.
Background
The question of how the demographics of a transit board might influence transit planning decisions can be understood with respect to representative bureaucracy theory and with respect to research on the roles of corporate boards.
Representative Bureaucracy
Representative bureaucracy theory initially developed as a critique of the British Civil Service but gained traction in the 1970s in response to the civil rights movements of the prior decade ( 23 ). Rooted in public administration and political science, it is the hypothesis that increasing demographic representation within bureaucracies can improve outcomes for historically underrepresented communities. Representation has two components: passive and active ( 23 ). Passive representation is the presence within a bureaucracy of members of the targeted demographic; active representation is the production of “policy outputs that benefit the individuals who are passively represented” ( 24 , p. 393). In a review of the literature, Meier ( 24 ) argues that passive representation leads to active representation when three criteria are met: the demographic criteria is salient; individual bureaucrats have discretion to act; and decisions are relevant to the demographic. A critical mass may be needed before a collective group can shift from passive to active representation ( 25 , 26 ).
Work on representative bureaucracy has traditionally focused on two demographic groups: women and people of color. There is conclusive evidence that under the right conditions, passive representation leads to active representation for Black and Hispanic communities ( 24 ). The evidence is considerably more mixed for gender, despite the significant benefits that affirmative action provides women ( 27 , 28 ). Until Keiser et. al.’s ( 25 ) work on the effects of female math teachers and principals on female students’ math scores, there was little evidence that passive representation translated to active representation for women. They found that hierarchy matters, and that, at least for gender, the presence of women at higher levels of an organizational hierarchy is significant ( 25 ). Looking specifically at board representation, Dula ( 26 ) finds a nonlinear relationship between active and passive representation for women serving on the board of a non-profit; once 30% of the board of a United Way affiliate is female, there is no additional benefit to increased passive representation with respect to shifting funding to projects that target women ( 26 ). As Kennedy ( 29 ) argues, most of the representative bureaucracy research has been conducted on redistributive agencies and schools, with no known peer-reviewed work on public transit agencies.
Transit Boards as Corporate Boards
The limited existing literature on transit board representation does not utilize representative bureaucracy theory, and primarily evaluates these entities as though they are corporate boards. From this perspective, Ugboro and Obeng ( 30 , p. 240) find limited support for the hypothesis that more involved board members—defined as board members taking part in “contextual, analytical, strategic, interpersonal, and political activities” on behalf of the agency—results in more cost-efficient agencies. In their analysis of 66 transit agencies in the U.S.A., mission-focused boards generally lower costs while board member educational activities are associated with increased costs, suggesting that the more boards learn about the agency’s activities the more likely they are to increase spending. While they were not exploring questions of equity, their survey did track race and gender. In 1999, when the survey was conducted, the sample was 76% male, 76% White, and 17% Black. They found that boards dominated by White members had lower costs per passenger and higher costs per hour. At the broader scale of transit agency outcomes, research has found that the institutional structure has less importance than outside factors ( 31 – 33 ). None of these existing studies specifically address equity concerns at the heart of representative bureaucracy.
If we follow Ugboro and Obeng’s ( 30 ) lead and explore the role of gender diversity on boards in the corporate world, we again find mixed results. There is some evidence that more women on a board leads to less financial mismanagement, although as with the non-profit research, the relationship is nonlinear, and the authors suggest the mechanism is likely a change in group dynamics ( 34 ). Depending on the location and industry, the effect of board diversity on corporate social responsibility and sustainability are mixed. Using a diversity measure based on gender and nationality for companies in 46 countries, Naciti ( 35 ) finds a significant relationship between board diversity and sustainability initiatives, suggesting that both female and foreign directors support a relational approach to sustainability. Looking specifically at Latin America, however, De Abreu et al. ( 36 ) find no such significance, suggesting that certain cultural accountability mechanisms must be in place for diversity to have its intended effect. Naveed et al. ( 37 ), focusing on China, confirms the importance of not just regional but also industry-specific constraints, and finds that under certain conditions, gender diversity on boards enhances the green performance of the firm. In summary, the gender diversity of corporate boards may have a significant effect even on issues that are not specifically about gender, although the mechanisms are complex and culturally specific.
Relatedly, Ugboro and Obeng’s ( 30 , p. 237) note that the role of members and expectations for transit boards have shifted over time. Historically boards were “influential people in society who hardly came under public scrutiny,” and whose participation was seen as important for maintaining an agency’s fiscal status and ability to issue bonds. Board members were generally leaders in business, finance, or law, and there was little expectation of representation for historically underrepresented communities or transit riders. Over time, however, both non-profit and corporate boards have faced growing expectations to be involved in shaping the mission, vision, and values of organizations, and to be a venue where the complex and conflicting needs of various interests can be aired and negotiated ( 18 , 38 ). Whether or not transit boards are currently living up to those expectations is an open question that this research explores.
Service Change Equity during the COVID-19 Pandemic
Prior research has had mixed results on the question of whether service cuts that occurred during the COVID-19 pandemic disproportionately burdened already marginalized communities. Few studies have sought to identify differences in the equitable distribution of service cuts among cities and agencies, and none have sought to explain such differences.
Two studies applied qualitative methods to assess the degree to which decision-makers considered equity in COVID-related service reductions. Based on their analysis of interviews with and public statements from six transit agencies in Ontario, Canada, Sutcliffe et al. ( 39 ) find that decision-makers were aware of inequities associated with service reductions, but that the need to make decisions quickly in response to rapidly changing contexts forced or justified decisions without adequate public consultation. Karner et al. ( 6 ) likewise analyzed public statements from the early months of the pandemic at six transit agencies in the U.S.A. They found that agencies commonly made references to serving the needs of essential workers protecting health through social distancing.
Three studies pooled observations across one or more transit agency to identify relationships between measures of marginalization and service cuts. Karner et el. ( 6 ) coupled the qualitative analysis described above with a quantitative study of changes in transit service intensity experienced by populations defined with respect to race, ethnicity, and poverty status and found that pandemic-era service cuts neither mitigated nor exacerbated existing inequalities. In contrast, Kar et al. ( 40 ) pooled block-level observations across 22 cities in the U.S.A. to estimate the effect of social vulnerability measures on the likelihood of reductions in transit accessibility during the pandemic lockdown period and found that that block groups with higher Black populations, higher poverty rates, and lower rates of car ownership were more likely to experience reductions in transit access to food and healthcare. Reed et al. ( 41 ) evaluate the equity of pandemic-era service changes for one transit agency (Riverside Transit Agency in Riverside County, California). They related transit service changes (with respect to the number of jobs accessible within 30 min and the number of hourly vehicle arrivals within a census tract) to a disadvantage index that combines (and equally weights) a census tract’s median income, percentage of residents with at least a high school education, and percent of residents with incomes below the poverty level. The find a moderately inequitable relationship between their measures of disadvantage and changes in transit service.
All three of the studies described above conceptualize equity with respect to the degree to which marginalized populations experienced greater impacts than more privileged populations. An alternative conceptualization of equity could assess the evenness of the distribution of service cuts, for example, through the use of a Gini coefficient ( 42 ). However, the question these studies address (and with which we are concerned in this paper) is not whether service cuts are concentrated in a particular location, but whether there is a correlation between the degree of service cuts a location experiences and other measures of privilege, such as income or education. This is consistent with Walzer’s ( 43 ) theory of “complex equality,” which holds that goods in difference spheres (such as money, political power, educational opportunities, or in this case, access to transit services) may be unevenly distributed, but the distribution of goods in one sphere should not control the distribution of goods in another.
None of the studies described above attempt to describe variation in the equity of pandemic-era service changes across cities. DeWeese et al. ( 9 ) do make comparisons across 40 cities and agencies in the U.S.A. and Canada. They measure the supply of transit service as the number of scheduled weekday transit trips serving a given census block group (for cities in the U.S.A.) or dissemination area (for cities in Canada). They calculate the percent change in transit service between the pre-pandemic and early-pandemic time periods for each block group or dissemination area as well as a vulnerability index for each that incorporates information about race, income, education, and employment levels. They generate scatter plots comparing transit service changes and vulnerability for each of the 40 cities in their sample, and fit trend lines based on a univariate linear regression for each city. They discuss differences in the slopes of these trend lines, arguing that the slopes closer to zero represent greater horizontal equity (e.g., all areas experienced similar changes to service), more negative slopes represent greater vertical equity (e.g., marginalized areas are more protected from service cuts), and more positive slopes represent inequitable service changes (e.g., privileged areas are more protected from service cuts). DeWeese et al. ( 9 ) do not attempt to explain the differences in the apparent equity of transit service changes they identify among the transit agencies in their sample. One possible explanation for these differences might lie in demographic differences among the transit boards who must approve such changes.
Based on the literature on representative bureaucracy and corporate boards, we might expect transit boards with greater representation by people of color to make service changes that are more beneficial (or less harmful) to neighborhoods with greater proportions of residents of color. More broadly, we might expect that transit boards with more members from marginalized groups (based on race, gender, or [dis]ability) would be more likely to privilege their own or other marginalized populations when making service changes. It is also possible that transit agencies with a strong orientation toward equity considerations are both more likely to have greater board representation of marginalized groups and more likely to privilege marginalized group when planning service changes. Either of these mechanisms would result in a correlation between the presence of people from marginalized populations on a transit board and a pattern of service changes that privileges places with higher populations of marginalized residents.
Data and Methods
We collected transit service data from published general transit feed specification (GTFS) feeds archived by Open Mobility Data ( 44 ) or Interline Technologies ( 45 ). We selected our sample of 36 transit agencies from a transit governance database developed by Fischer et al. ( 46 ). Each agency in the sample is governed by a transit board, is the primary transit agency in its service area, and publishes route and schedule data in the GTFS format.
Regression-Based Equity Metrics
For each transit agency in our sample, we calculated the average number of daily transit trips serving each block group in in the agency’s service area for two seven-day periods: one before substantial pandemic-related changes in travel patterns would have occurred (February 2–8, 2020) and the other after such changes had taken place and agencies would have had time to respond with changes in transit service patterns (May 31–June 6, 2020). In instances where an agency implemented service changes during one of those seven-day periods, the study week was shifted by up to two days earlier or later so that it represented a single service pattern.
For each block group, we calculated the percent change in transit service frequency as shown in Equation 1:

where
The percent difference is truncated at a 100% increase to impose a degree of symmetry on what would otherwise be an asymmetrical measure of the difference in service, since the minimum possible value for a service reduction is a reduction of −100%, but without truncation, there would be no upper limit on the percent increase in service. This truncation did not affect more than 1% of all block groups in any individual service area except in Philadelphia, where 2.5% of all block groups had truncated values, and in New York City, where just under 10% of all block groups had truncated values. This is likely because the population density of New York City results in block groups that cover smaller geographies, making our frequency measures more sensitive to minor service changes.
We also gathered the following metrics from the 2017–2021 five-year sample of the American Community Survey:
median income;
percent of population identifying as non-Hispanic White;
percent of population with a four-year college degree.
Following DeWeese et al. ( 9 ), we normalized each of these metrics within each service area as a z-score. We also took the average of these z-scores to calculate a combined privilege index, where higher values indicate greater sociodemographic privilege (higher income, whiter, and more formal education).
We likewise followed DeWeese et al. ( 9 ) in evaluating the relationships between changes in block-group-level measures of transit service frequency and these measures of sociodemographic privilege. Our analysis includes many of the same cities included in DeWeese et al. ( 9 ), but we base our frequency calculations on slightly different dates, we use an average frequency over a full seven-day period rather than focusing exclusively on weekday service, and we truncated outliers at a 100% increase rather than removing the highest 1% of increases from the sample as DeWeese et al. ( 9 ) did. The DeWeese et al. study described relationships with respect to fitted linear trend lines. We likewise fit a simple linear regression model predicting changes in transit frequency based on each measure of privilege described above. The regression coefficient (the slope of the fitted regression line) is our outcome of interest.
A significant, positive slope in the fitted regression line indicates inequitable service cuts: locations with greater sociodemographic privilege were less affected by reductions in transit service. A significant, negative slope indicates vertically equitable service cuts: service was more likely to be maintained or increased in areas with less privilege. A non-significant coefficient indicates a slope that is not significantly different from zero, suggesting that the magnitude of service cuts or increases was not related to (these particular measures of) sociodemographic privilege. The number of block groups in a given service area in our sample ranged from 318 (Oklahoma City) to 8479 (New York City), with a median of 873 (Cleveland). Since these are reasonably large samples within each city, we evaluated the significance of the block-group-level analysis at a 95% confidence level.
We use these regression slopes to define the following outcome variables for each transit agency.
Income-based inequity: The slope of a regression line predicting change in transit service frequency based on a block group’s median income.
Race-based inequity: The slope of a regression line predicting change in transit service frequency based on the percentage of a block group’s population that is non-Hispanic White.
Education-based inequity: The slope of a regression line predicting change in transit service frequency based on the percent of college-educated residents in a block group.
Combined inequity: The slope of a regression line predicting change in transit service frequency based on a block group’s combined privilege index.
All values for all for metrics were between −0.1 and 0.1, so we multiplied all values by 100 to make differences more legible on a scale from approximately −10 to 10.
Transit Board Representation
For the 36 agencies in our sample, we also gathered data on transit board demographics. The gender of each transit board member was recorded based on the pronouns used to describe them in published statements and online profiles. Race and disability were recorded based on explicit references in published statements and personal or professional social media profiles. In the absence of explicit information to the contrary, board members were assumed to be White and able-bodied. There were no explicit textual references to any board members being White, and no published materials about any board member explicitly mentioned the absence of any disability.
We recognize that a wide diversity of disabilities exist and that our reliance on self-reported or publicly reported disability status is most likely to capture the most visible types of disability.
For each transit board, we calculated the following metrics.
A binary indicator for whether any board member has a disability. Any board with one or more members identified as having a disability would be assigned a value of “Yes”; any board without any members identified as having a disability would be assigned a value of “No.”
Percent of board members who are female.
Percent of board members who are people of color.
Percent of board members who are people of color, female, or have a disability.
Relationships between Equity and Representation
To answer the question of whether transit board demographics might relate to equity in transit service planning, we calculated the relationship of each of metrics (correlations for percentages and the difference-in-means for the disability indicator) with each of the inequity variables described above. Since our sample of service areas is relatively small (36 agencies), we evaluated the significance of these relationships using a 90% confidence level.
Even when the correlation between two variables is statistically significant, it does not necessarily follow that one of the variables can explain a substantial proportion of the variation in the other. However, the square of the correlation does indicate the percentage of the variation in either variable that can be predicted based on the value of the other. The square of the correlation is also called the R-squared value of a simple linear model predicting the value of one variable from the other. To illustrate the implications of the strongest correlation we found between transit board demographics and equity in transit service planning, we estimated a simple univariate linear regression model predicting the associated inequity metric from the associated transit board representation metric. Based on the results of that regression, we generated 10,000 simulated values for the inequity metric for each of four hypothetical scenarios representing a range of hypothetical values for the transit board representation metric. The simulation was conducted using the simulate_lm function in the nlraa R package ( 47 ), which adjusts model-predicted values by adding random variation that accounts for both the proportion of the variation in the outcome that is not explained by the model and for the uncertainty in the regression coefficient. We use a Rademacher distribution (resid.type = “wild” in the simulate_lm function) to simulate residuals, which does not assume constant variance, but does assume symmetry ( 47 ).
Results
The agencies in our sample can be divided into three categories: inequity (advantaging places that are already privileged); horizontal equity (no advantages associated with existing privilege or marginalization); and vertical equity (advantaging places that are otherwise marginalized). Over half of transit agencies made service changes characterized by vertical equity. Ten to twenty percent made service changes characterized by inequity.
We also found considerable variation in the representation of marginalized groups on boards in our sample. Five transit boards in our sample of 36 (14%) had at least one member with an identified disability. On average, transit boards in our sample were comprised of 29% members of color (ranging from 0% to 89%), 38% women (ranging from 0% to 75%), and 55% members who had an identified disability, were female, or were people of color (ranging from 12% to 100%).
Transit boards with more women had significantly higher levels of vertical equity, at a 90% confidence level. The equity measures for the five transit boards with members with identified disabilities generally indicated greater equity than those that did not, but those differences were not statistically significant at a 90% confidence level.
Regression-Based Equity Metrics
Figure 1 illustrates the results of the regression analyses used to generate our income-based inequity metric, which is indicated in the figure as beta: the slope of the fitted line for the relationship between income and changes in transit service. Steeper upward-sloping lines with higher positive values for beta indicate less equitable patterns of service changes, where higher-income block groups had, on average, fewer reductions in service than lower-income block groups. Steeper downward-sloping lines with more negative values for beta indicate that lower-income block groups had less reduction in service, on average.
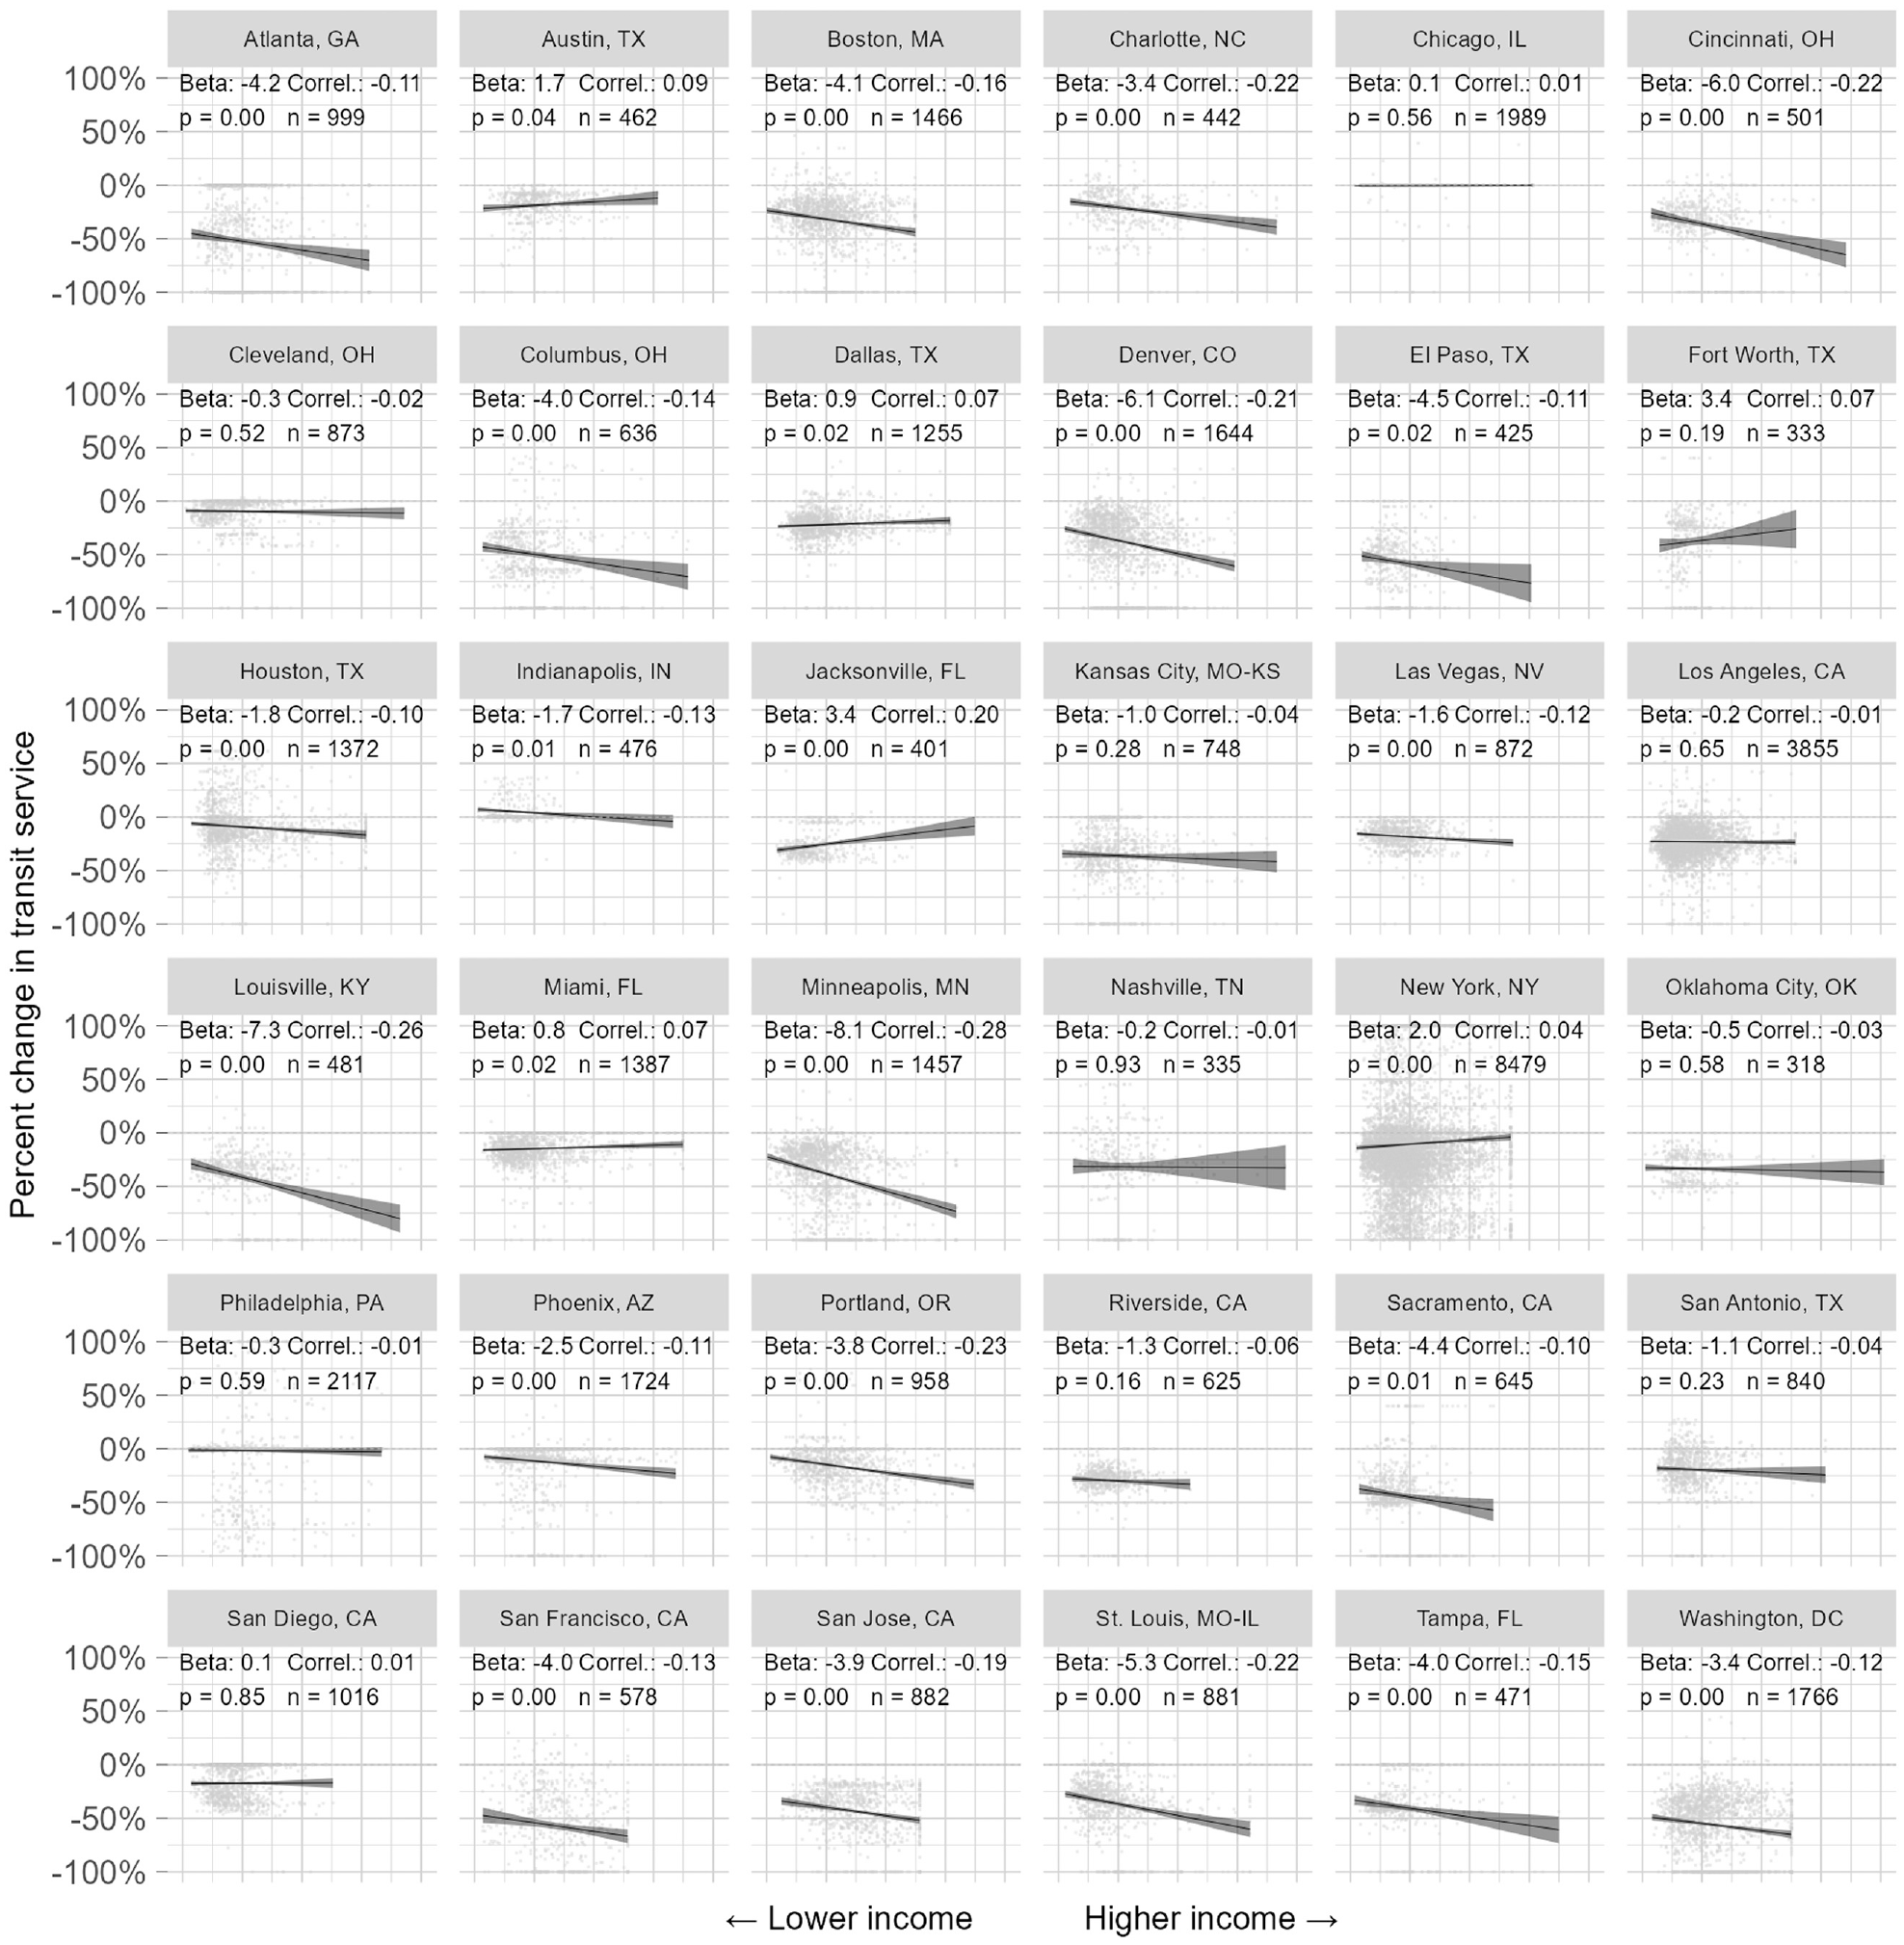
Regression results for income-based inequity metric.
Figure 2 illustrates the results of the regression analyses used to generate our race-based inequity metric, which again is indicated in the figure as beta. Steeper upward-sloping lines with higher positive values for beta indicate more inequitable patterns of service changes, where block groups with higher proportions of White residents had, on average, fewer reductions in service than those with higher proportions of residents of color. Steeper downward-sloping lines with more negative values for beta indicate that block groups with lower proportions of White residents had less reduction in service, on average.
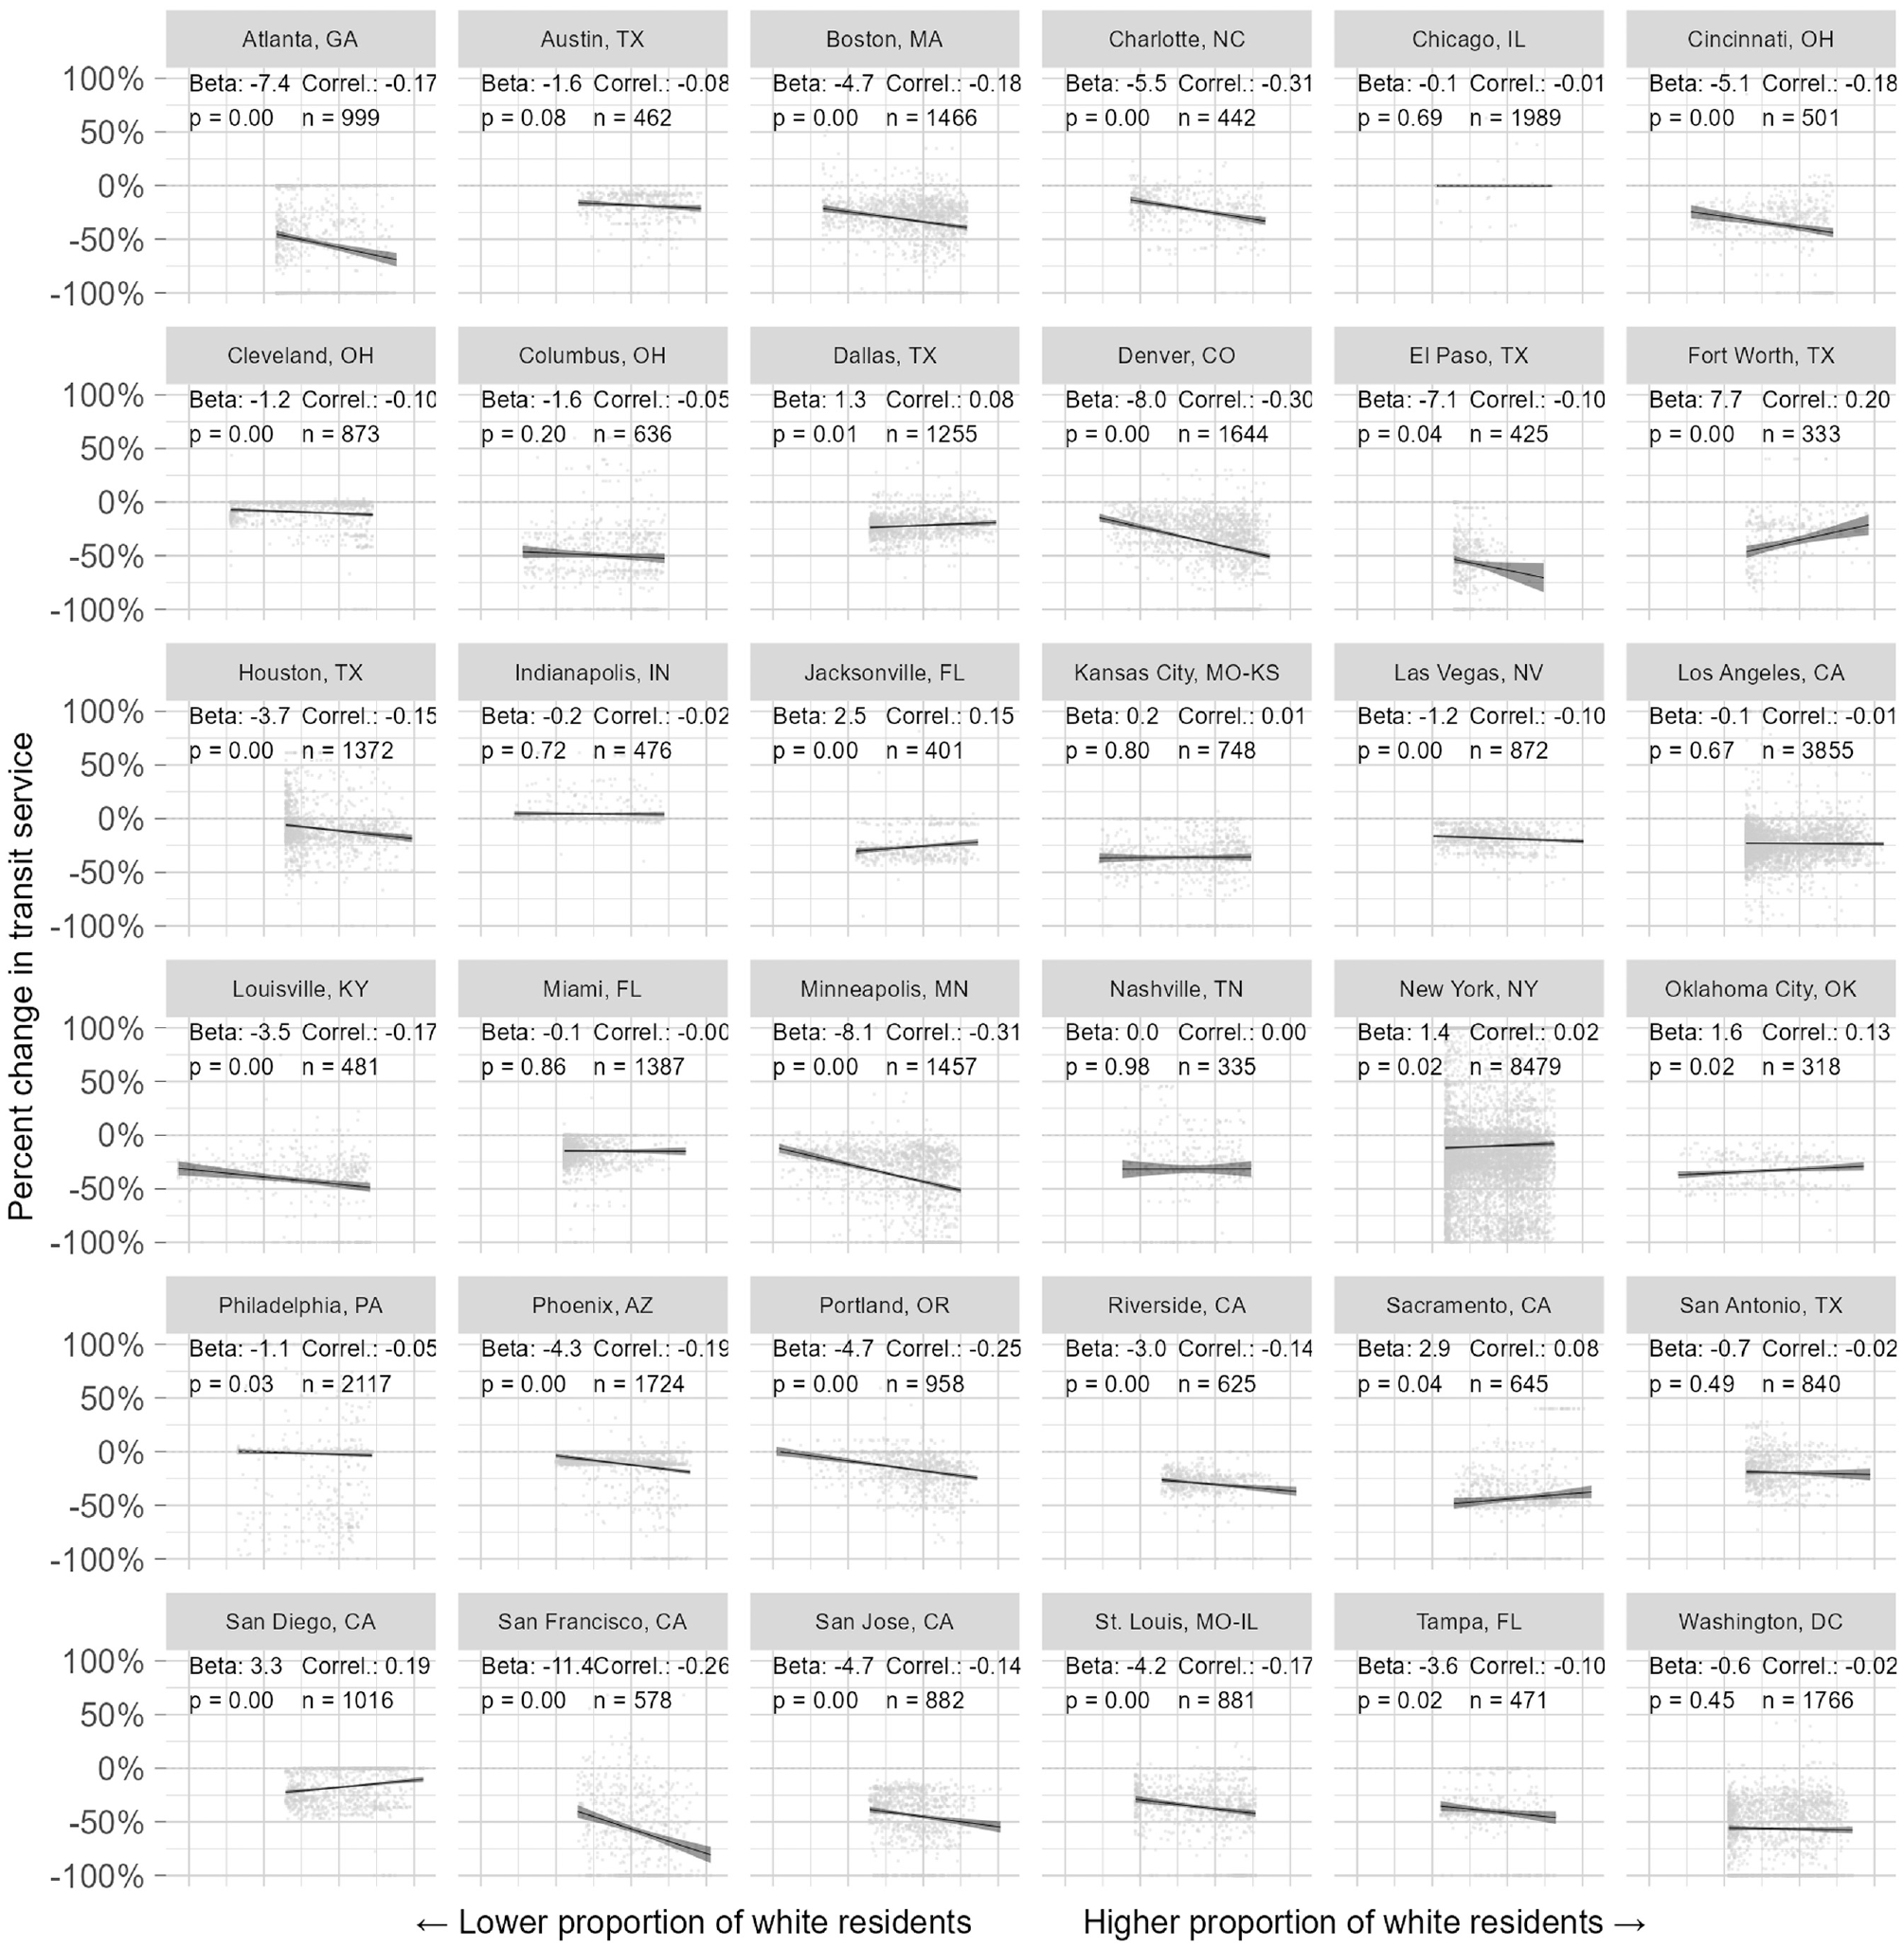
Regression results for race-based inequity metric.
Figure 3 illustrates the results of the regression analyses used to generate our education-based inequity metric. Steeper upward-sloping lines with higher positive values for beta indicate more inequitable patterns of service changes, where block groups with higher proportions of residents with a four-year college degree had, on average, fewer reductions in service than those with higher proportions of residents without a four-year degree. Steeper downward-sloping lines with more negative values for beta indicate that block groups with lower proportions of college-educated residents had less reduction in service, on average.
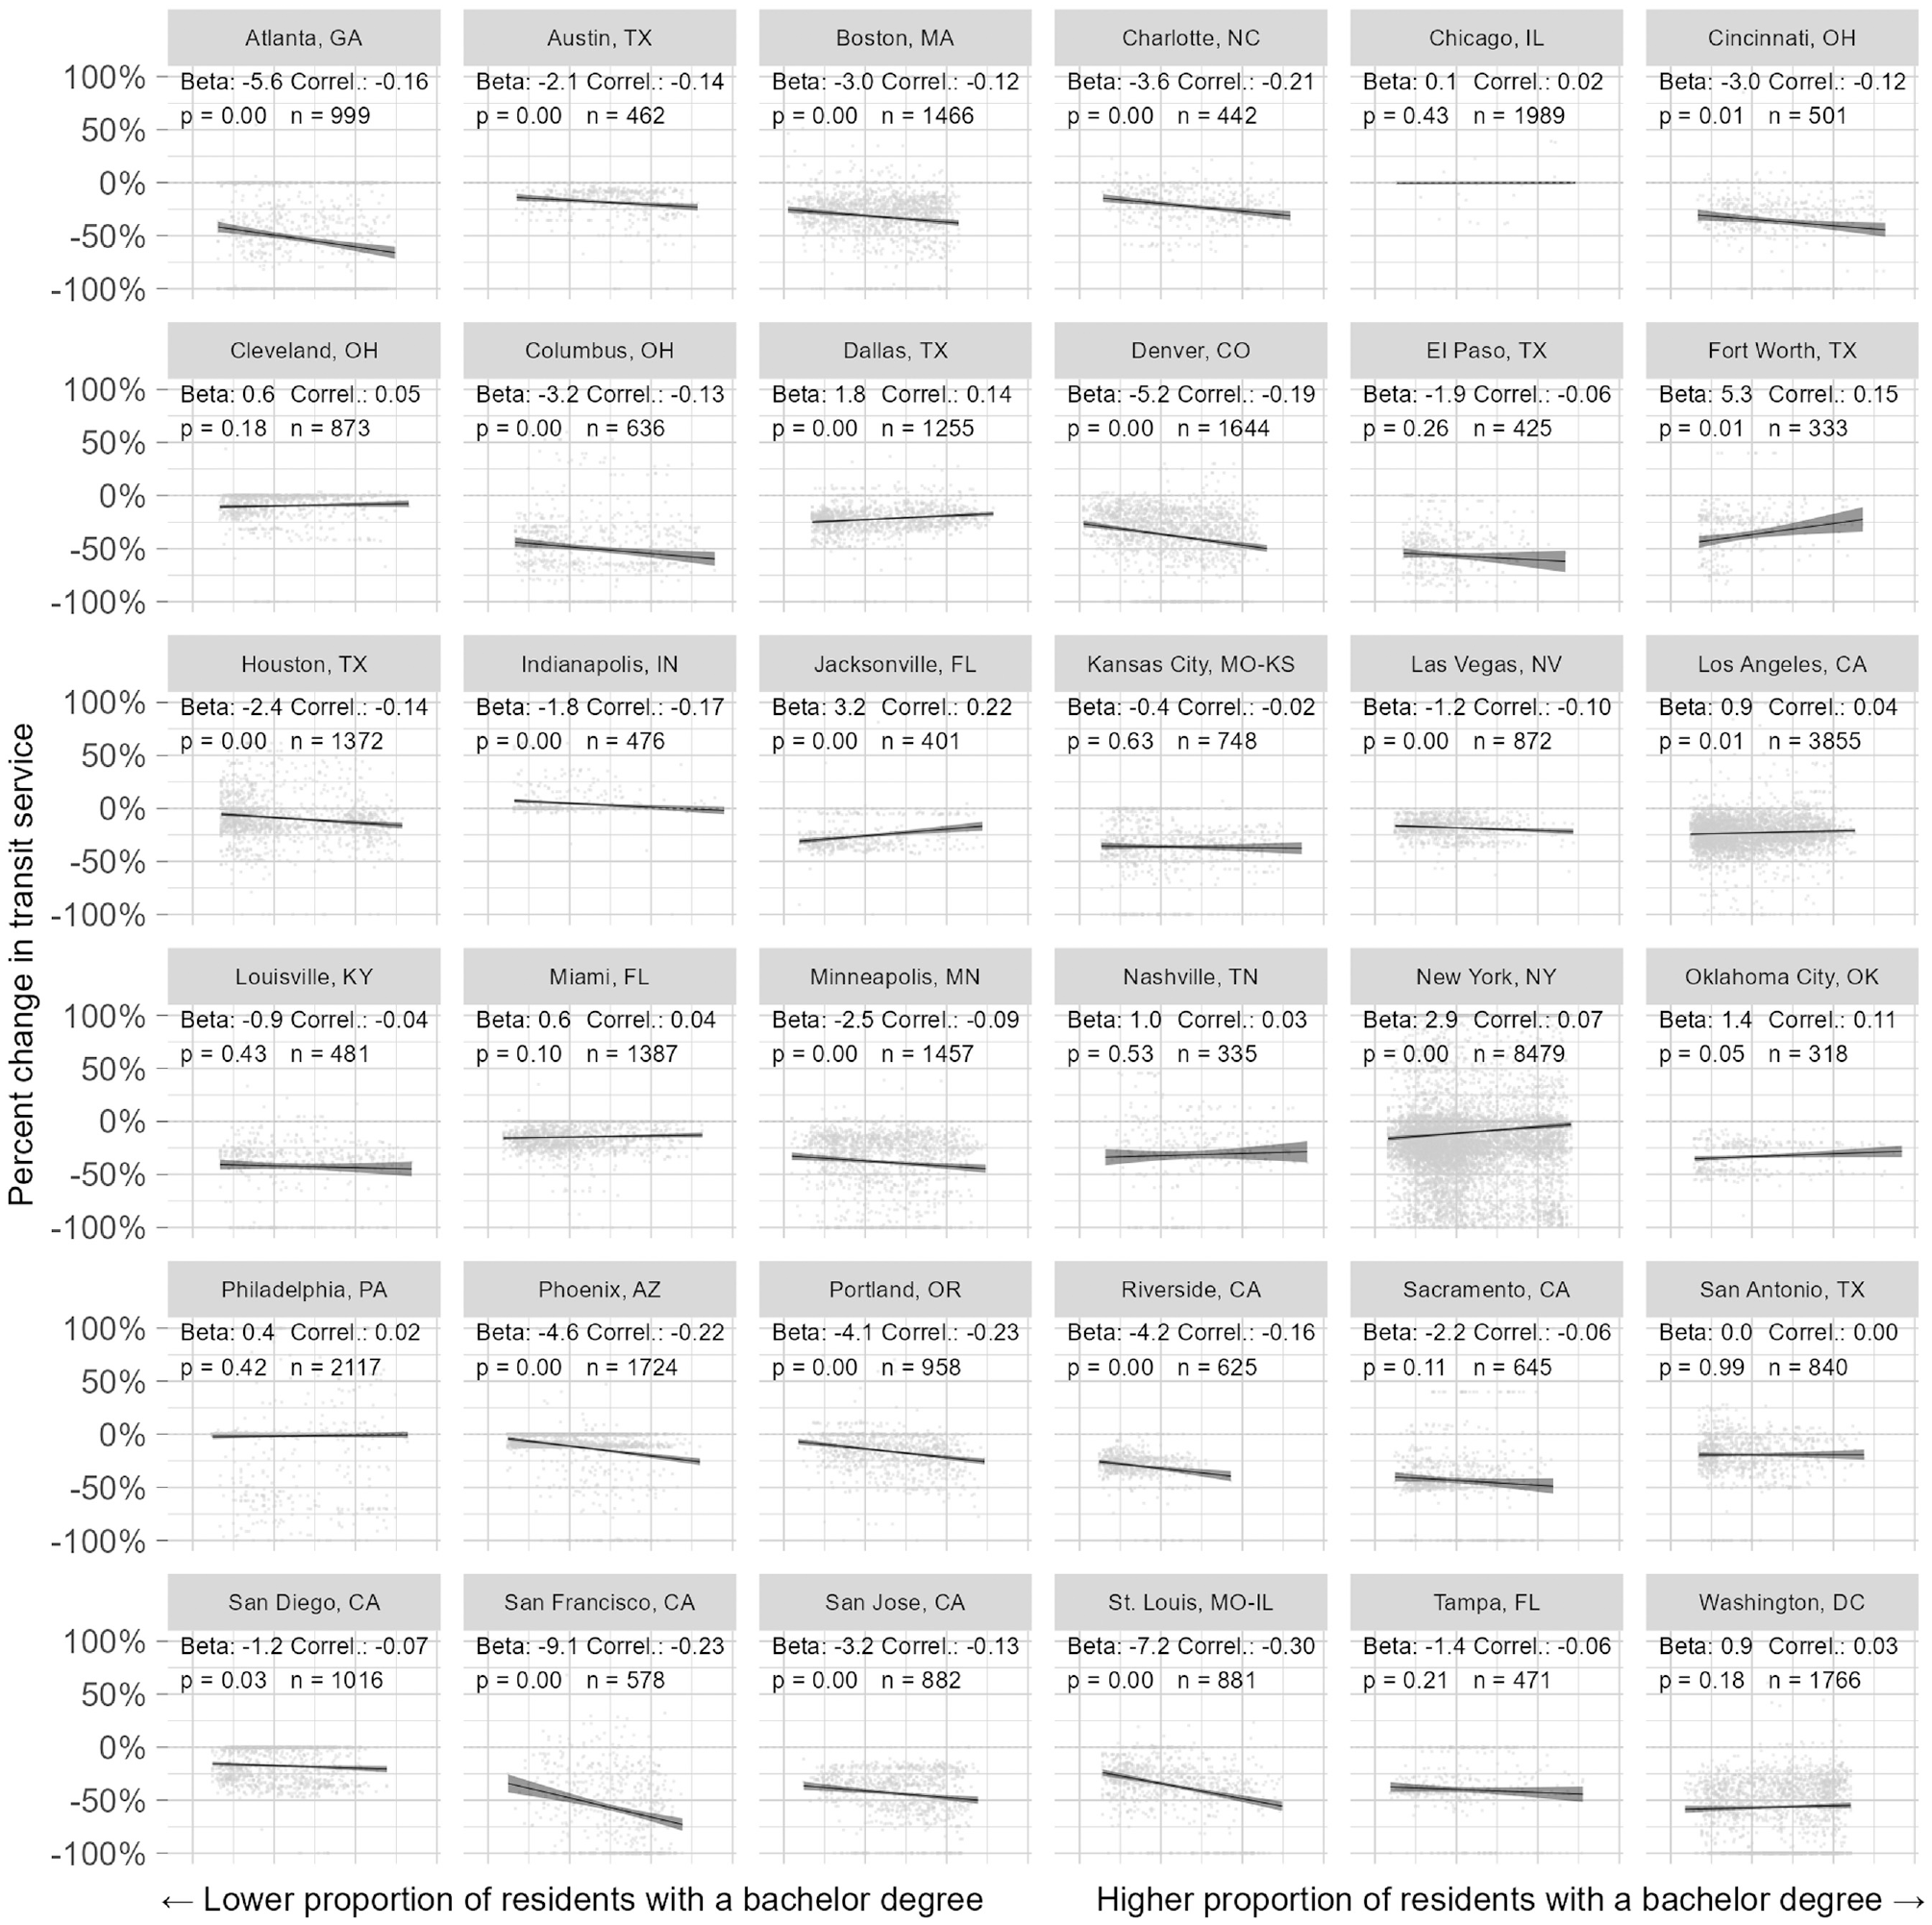
Regression results for education-based inequity metric.
Figure 4 illustrates the results of the regression analyses used to generate our overall privilege-based inequity metric. Steeper upward-sloping lines with higher positive values for beta indicate more inequitable patterns of service changes, where block groups with a greater measure of combined privilege had, on average, fewer reductions in service than those with a lower measure of combined privilege. Steeper downward-sloping lines with more negative values for beta indicate that block groups with less privilege had less reduction in service, on average.
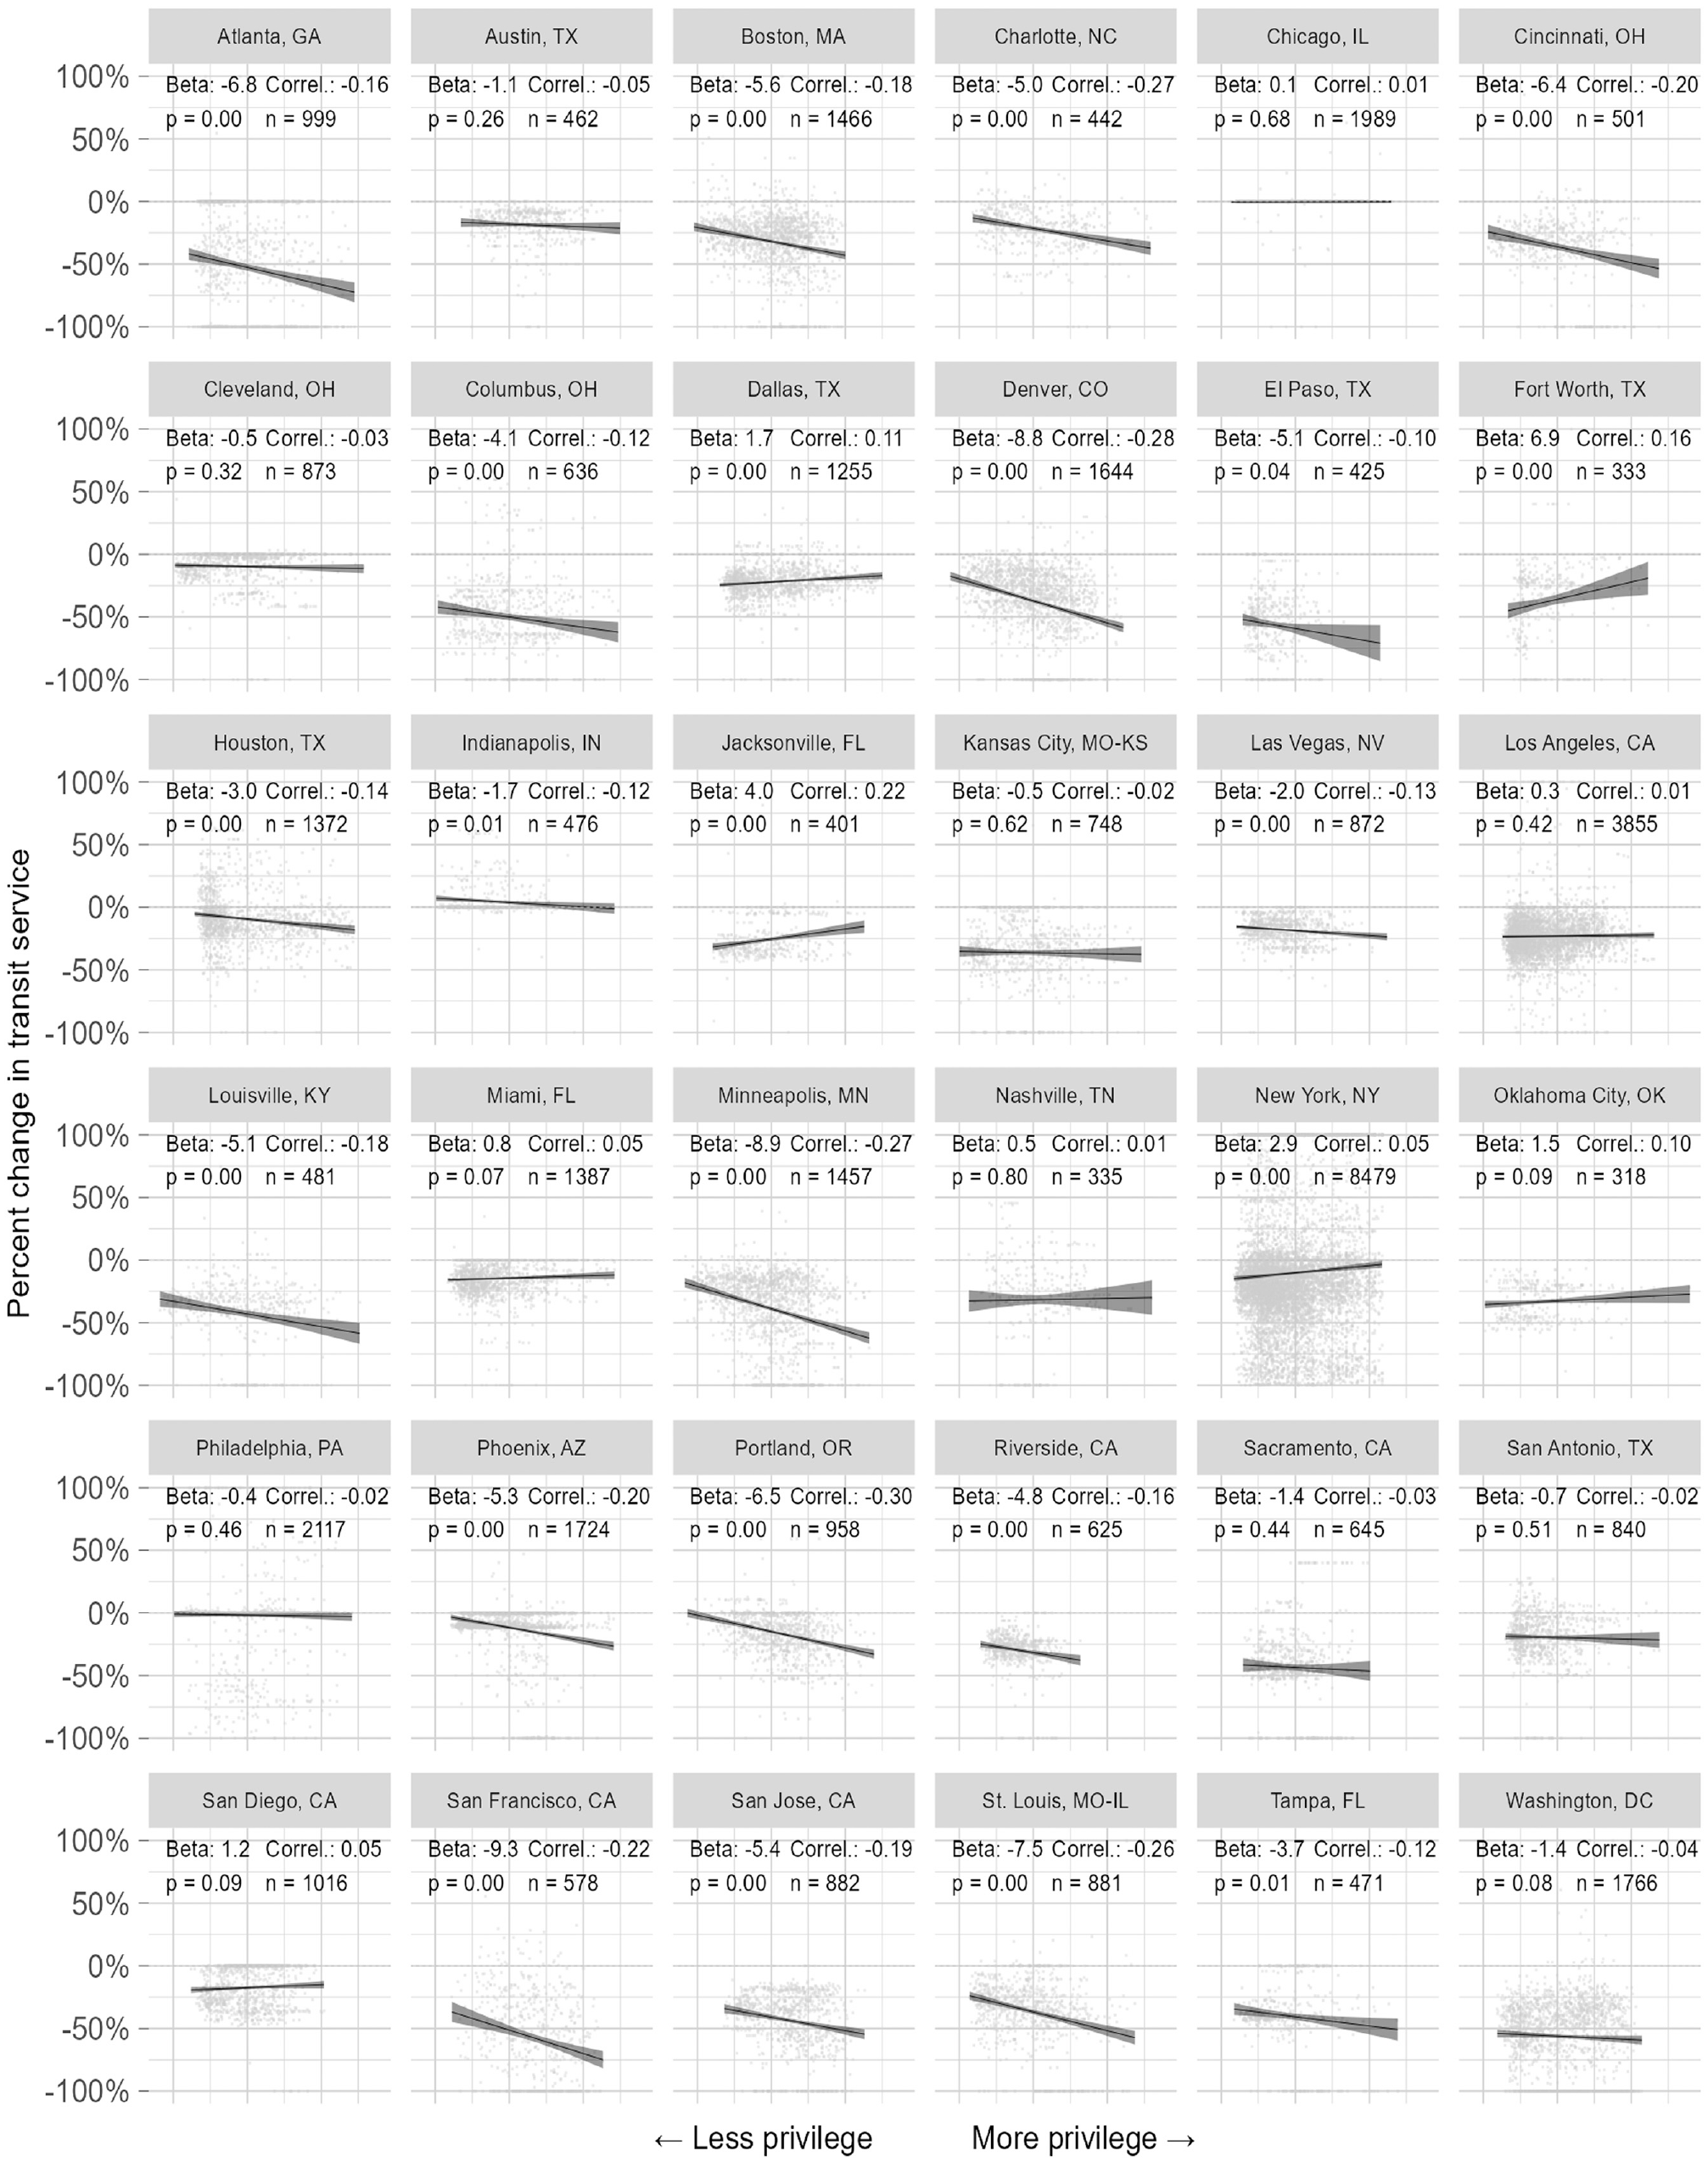
Regression results for overall privilege-based inequity metric.
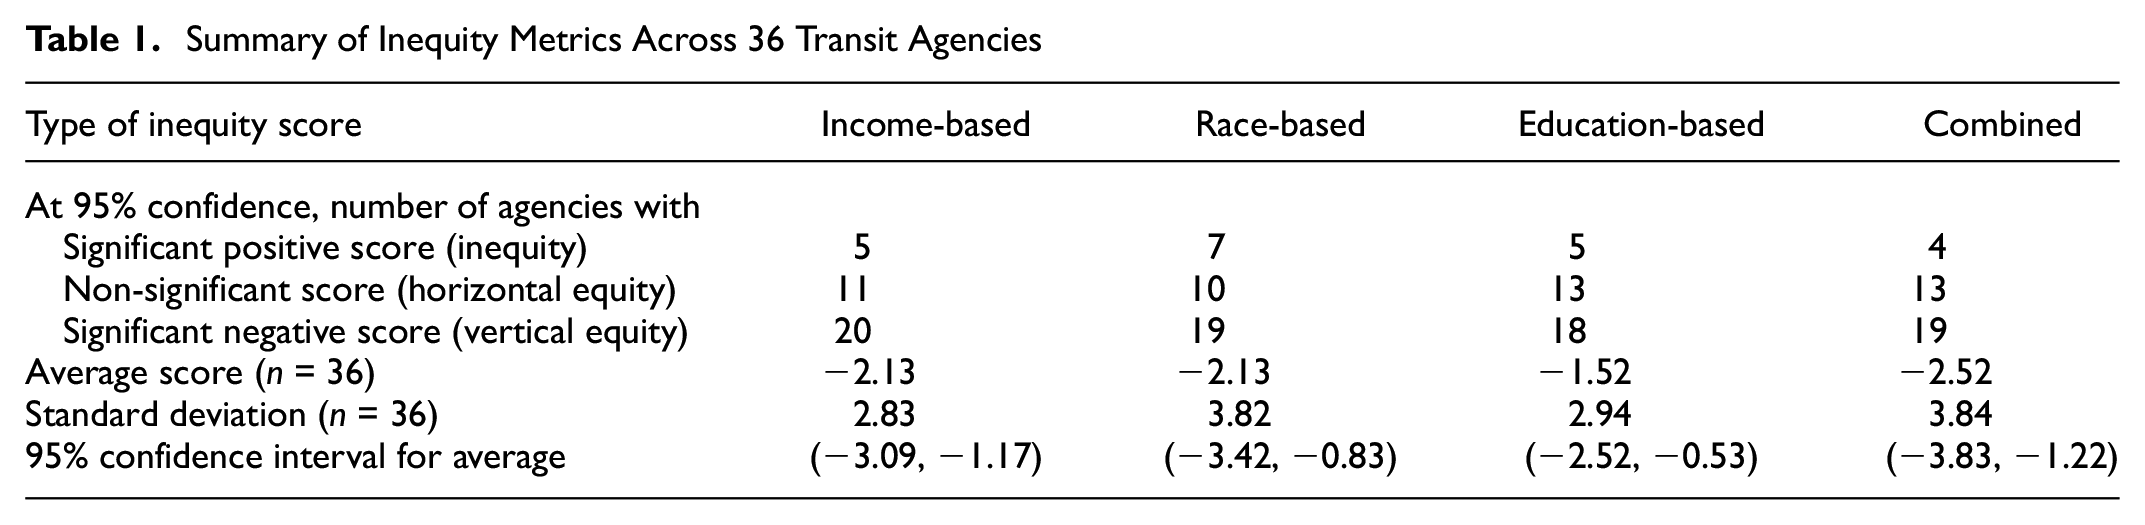
Table 1 summarizes all four inequity metrics across the 36 agencies in our sample. Average values for all four inequity metrics were negative (suggesting a tendency toward vertical equity). About a 10th of all agencies (four out of 36) had significant, positive values for the combined inequity metric, meaning that locations with more privilege were less affected by service cuts. The greatest proportion of agencies with significant positive inequity scores was one-fifth (seven out of 36) for race-based inequity. At least half of all agencies in the sample had significant, negative values for each of the four inequity metrics.
Summary of Inequity Metrics Across 36 Transit Agencies
Transit Board Representation
Table 2 summarizes the continuous measures of transit board representation for the boards of the transit agencies included in our sample. The proportion of the board comprised of women ranged from 0% to 75%, with an average of 38%. The share of the board comprised of members of color ranged from 0% to 89%, with an average of 29%. No board was comprised exclusively of White, able-bodied men.
Summary of Continuous Measures of Transit Board Identities
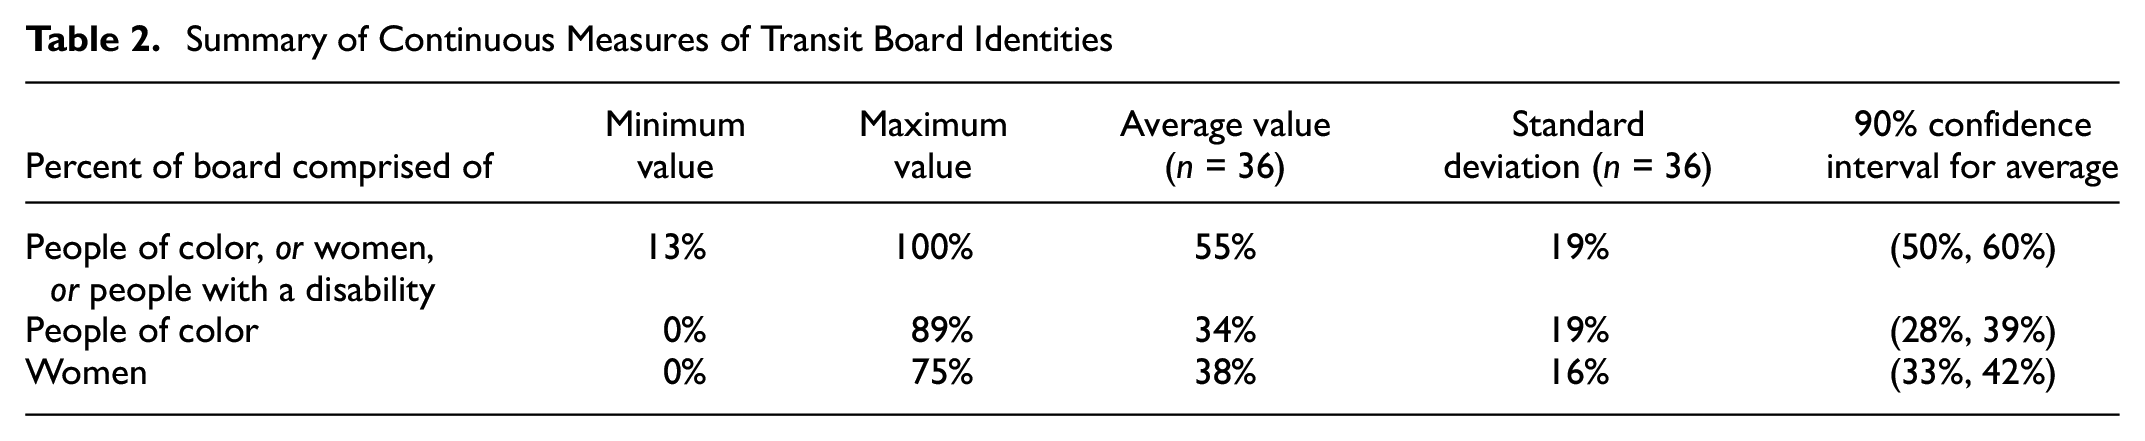
In addition to the continuous measures of board representation, our analysis also includes a binary categorical variable indicating whether each transit board includes a member with an identified disability. Five out of 36 boards (14%, corresponding to a 90% confidence interval of 6%–28%) had at least one member with an identified disability. We acknowledge that our reliance on self-reported or publicly reported disability status may fail to capture the full diversity of disabilities that may exist, since we are most likely to find reports of the most visible disabilities. The identified disabilities of the five board members in our sample include the following:
blindness;
quadriplegia;
HIV/hemophilia.
It is worth noting that the transit board members in our sample whom we identified as having a disability generally self-identified not only as people with disabilities but also as disability rights advocates.
Relationships between Equity and Representation
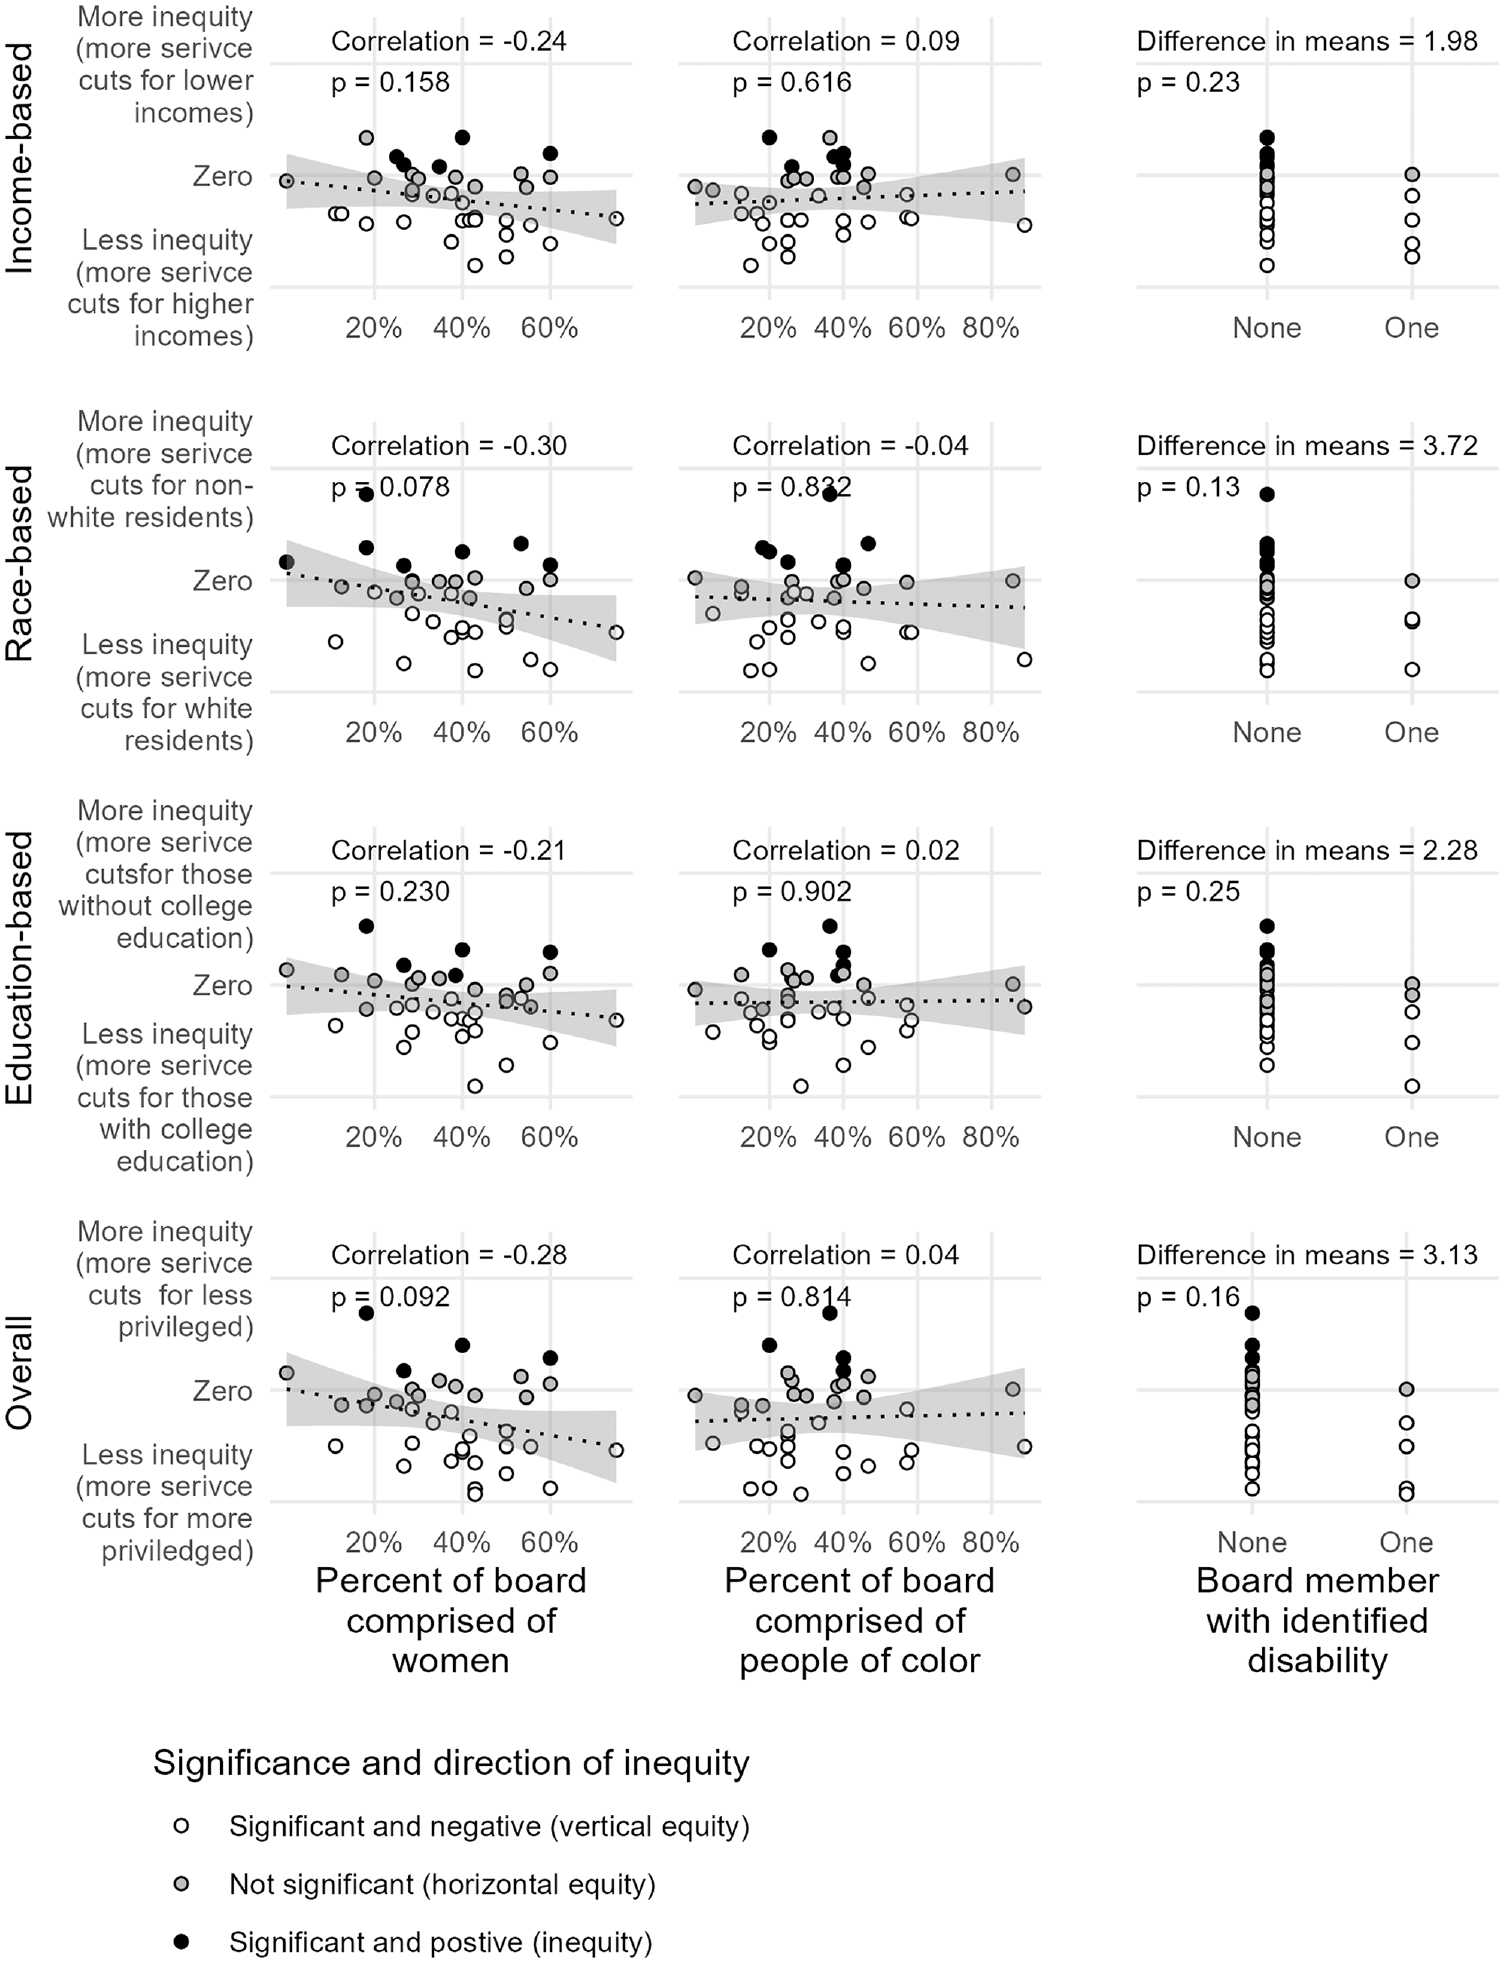
Table 3 summarizes the relationships between transit board demographics and each of the three continuous inequity measures we developed for this study. The only correlations that are significant at a 90% confidence level are between race-based inequity and the percent of board members who are women and between overall privilege-based inequity and the percent of board members who are women. Both of these correlations are negative, indicating that boards with more women had, on average, lower inequity scores (suggesting more equitable patterns of service changes).
Summary of Correlations Between Continuous Measures of Transit Board Representation and Measures of Inequity in Transit Service Changes
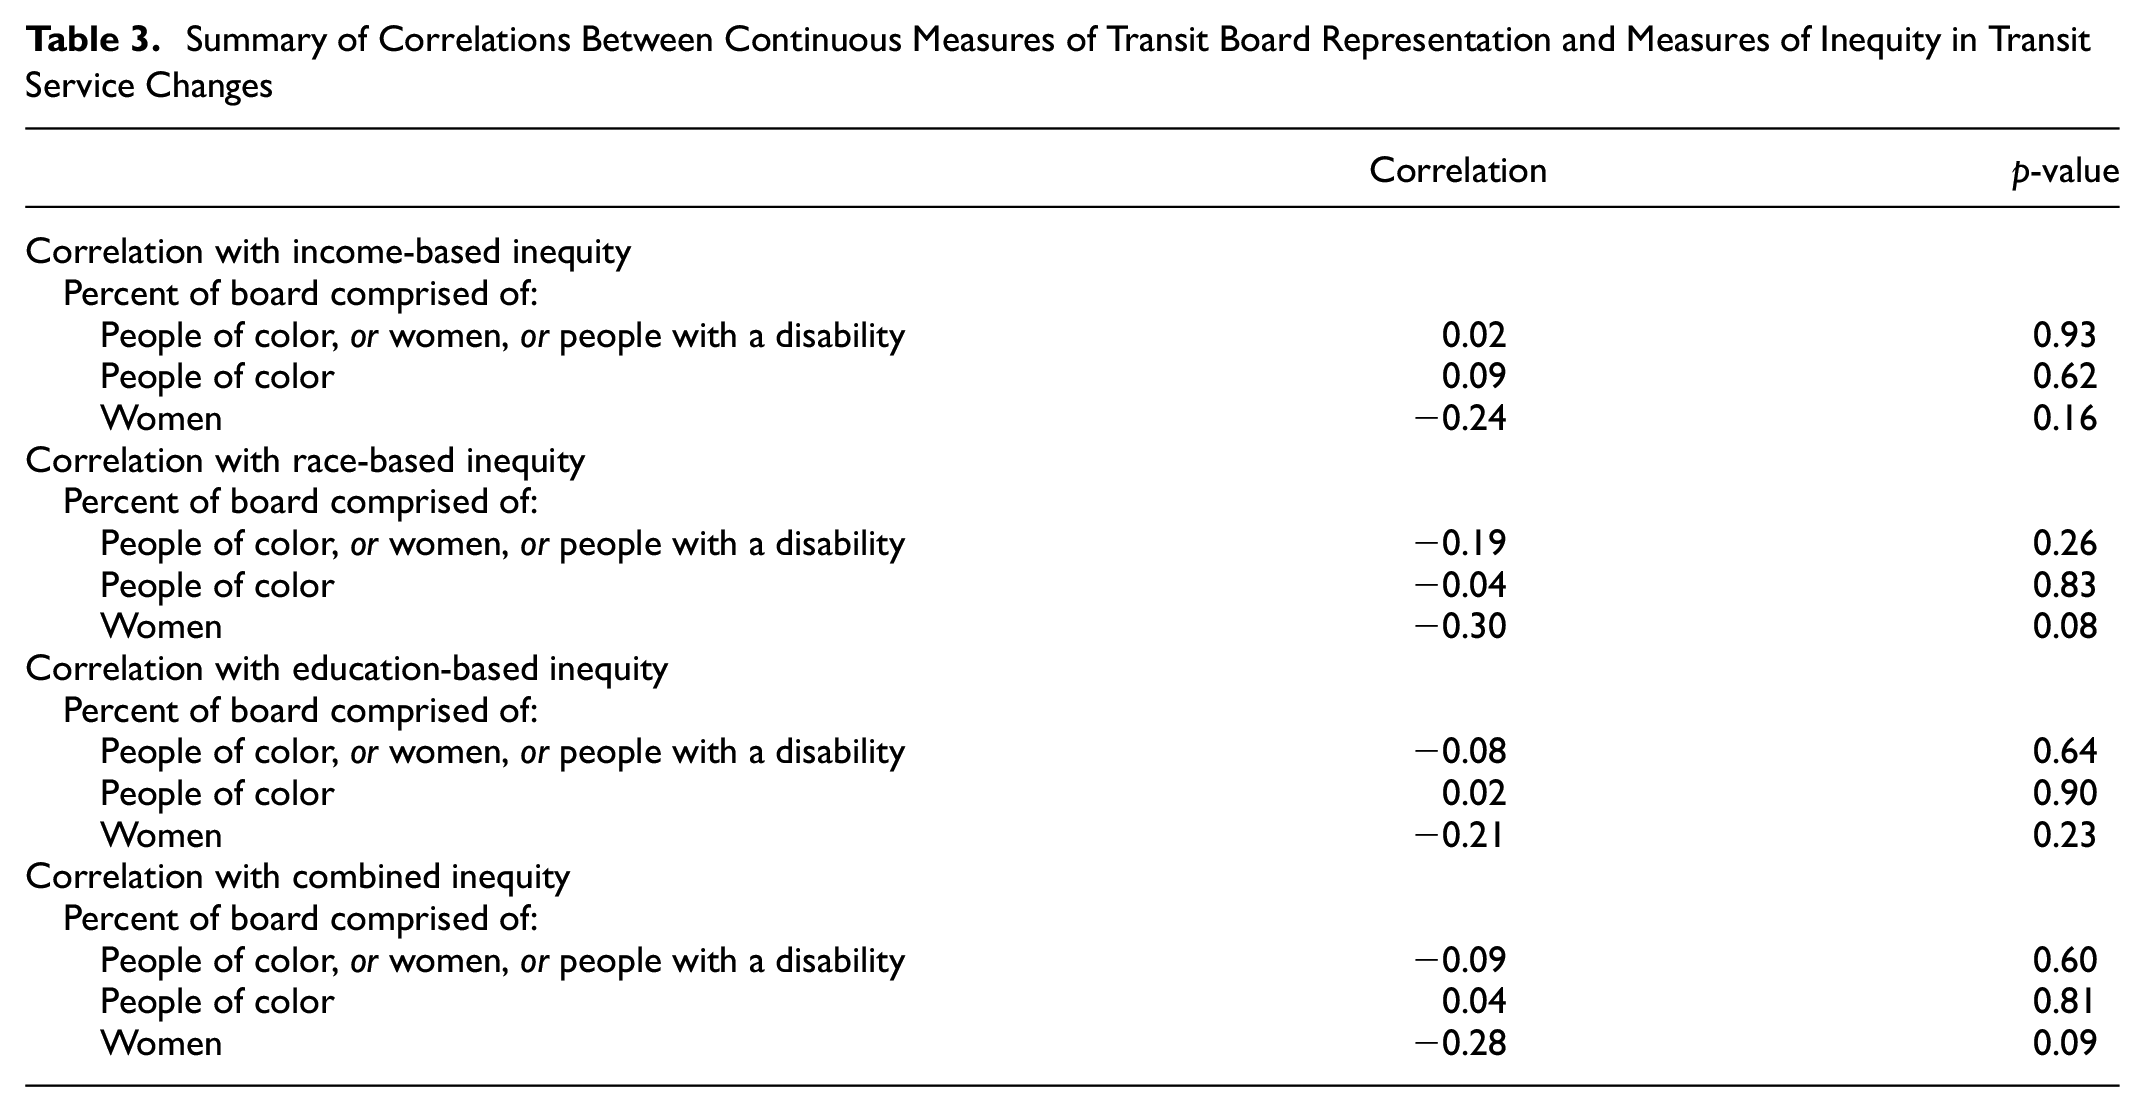
Table 4 summarizes the results of the difference-in-means tests comparing the equity of service changes for transit agencies with a person with a disability on the board to those without. Ten agencies had a significant, positive score for at least one of the four inequity metrics (suggesting neither vertical nor horizontal equity) and none of those 10 agencies were among the five with at least one board member with an identified disability. Inequity scores were generally lower (suggesting greater equity) at transit agencies with at least one board member with an identified disability, although none of these differences were significant at a 90% confidence level.
Summary of Differences in Inequity Measures for Boards With and Without a Member With a Disability
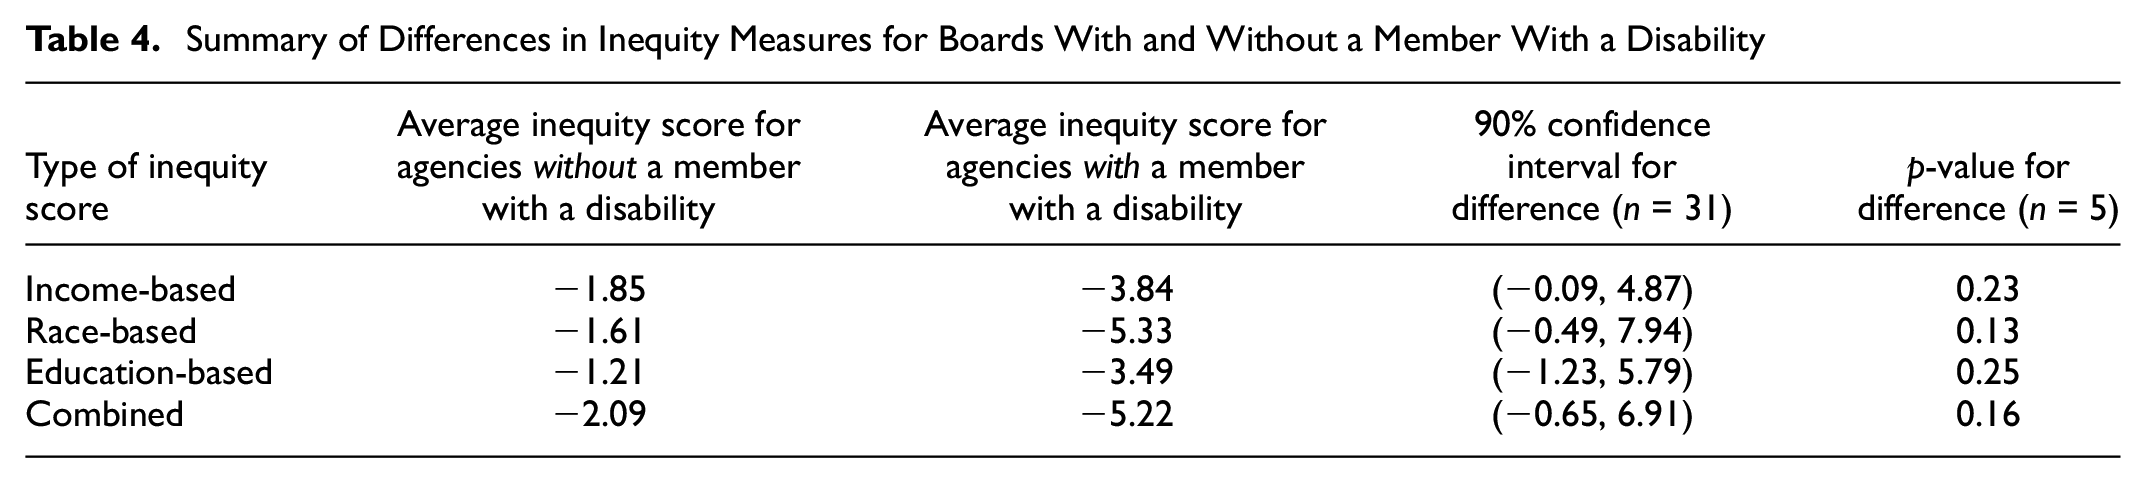
Figure 5 illustrates the relationships summarized in Tables 3 and 4.
Relationships between transit board representation and inequity in service cuts.
The two significant relationships we identified were between the percentage of a board comprised of women and race-based inequity and between the percentage of a board comprised of women and overall privilege-based inequity (which incorporates race-based inequity). The relationship with race-based inequity is strongest, with a correlation of −0.3. The square of this correlation would be 0.09, and this is the R-squared value that would be associated with a univariate linear regression predicting the value of the race-based inequity metric from the percentage of transit board members who are women. This suggests that 9% of the variation in race-based inequity is explained by gender representation on the transit board. To assist in the interpretation of this relationship, we have simulated a hypothetical set of 10,000 transit agencies for each of four scenarios:
one with no women on a transit board (the minimum share of women in our sample);
one in which a quarter of board members are women;
one in which half of board members are women; and
one in which three quarters of board members are women (the maximum share of women in our sample).
For each of these scenarios, we simulated a value for race-based inequity based on the observed relationship with the percentage of board members who are female, including random variation for the proportion of the variation in race-based inequity that is not explained by the gender composition of the board. The results of these simulations are illustrated in Figure 6 and summarized in Table 5.
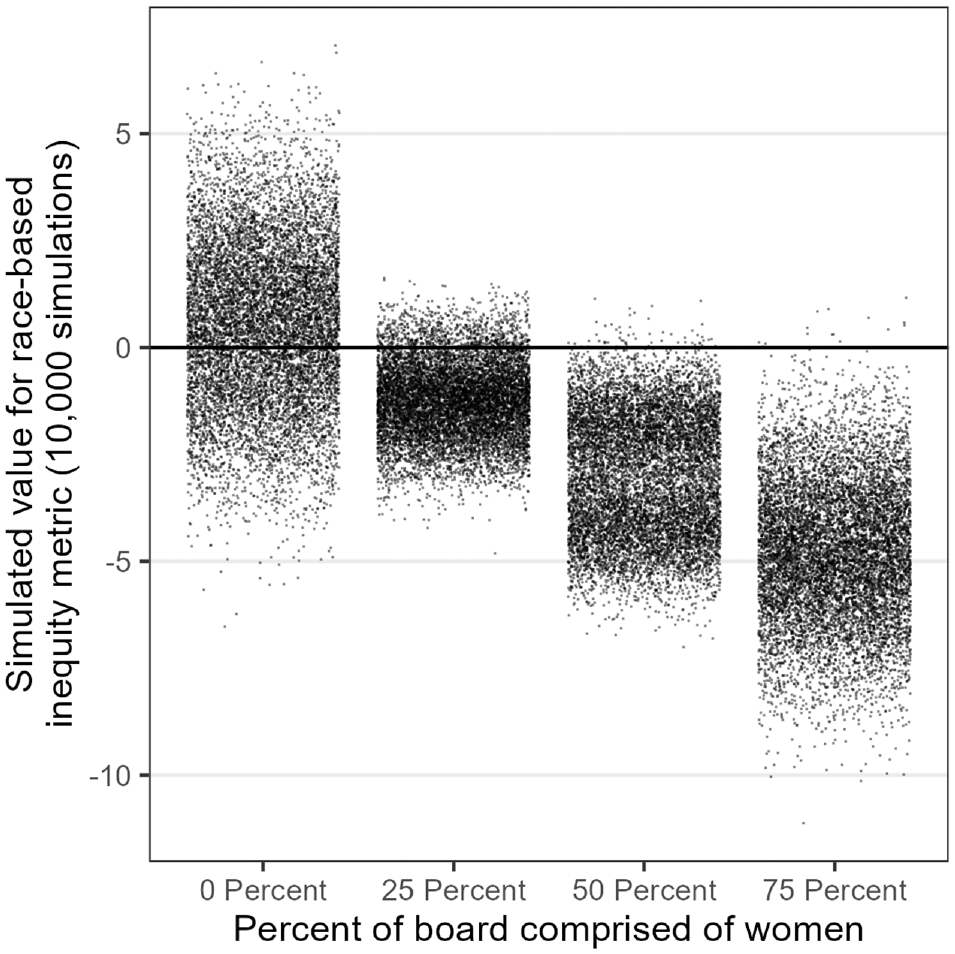
Simulated values for race-based inequity for four gender representation scenarios.
Summary of 10,000 Simulated Values for Race-Based Inequality for Each of Four Gender Representation Scenarios
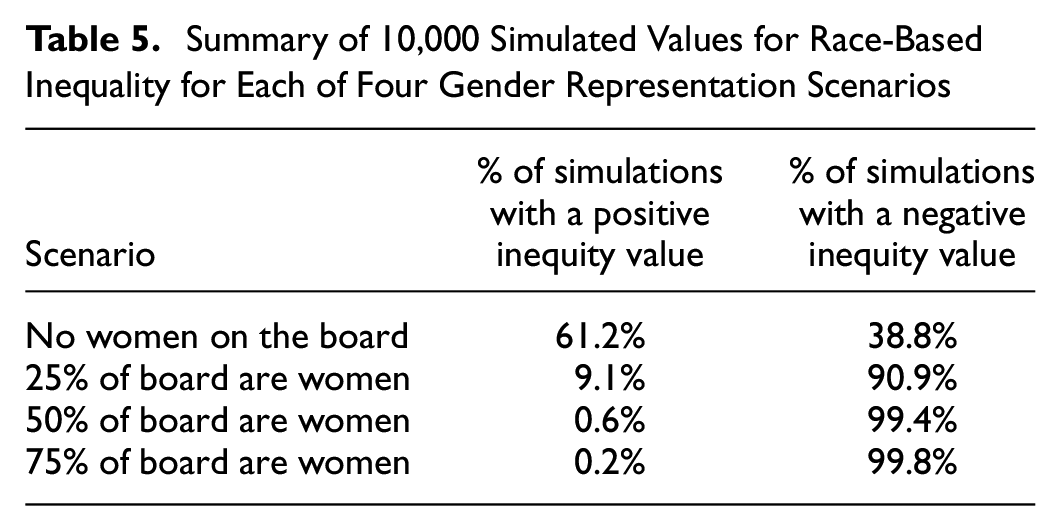
The proportion of simulations with a positive race-based inequity metric (those where locations with greater shares of White residents experienced fewer reductions in service) was over 60% in the scenario with no women on the board and less than 1% in the scenarios in which at least half of all board members are women.
Discussion
Based on the representative bureaucracy literature, we would expect that boards with greater passive representation among people of color would have more equitable service changes in response to COVID-19, particularly as measured by race-based in equity metrics. The literature on bureaucratic representation would not necessarily suggest that the gender of transit board members would have an effect, except to the extent that there is a pattern of service changes that might particularly advantage or disadvantage women. On the other hand, research on corporate boards would expect the inclusion of women, at least, to have an effect on outcomes, if only through changing the group dynamics of board decision-making.
The results of our study on transit boards and pandemic service cuts are much more in line with the findings from the corporate board literature, that is, the strongest effect is for gender. The percent of the board that is female is negatively correlated with two measures of inequity—one based on race, and the other based on a combined measure of privilege that incorporates race, income, and education. In other words, boards with more women made more equitable service choices. The stronger of these two correlations is with race, and since race is included in the overall privilege metric, the relationship between gender representation and race-based inequity may be driving the relationship between gender representation and overall privilege-based inequity.
To illustrate the relationship between gender representation on a transit board and the race-based inequity of pandemic-era transit service changes, we estimated a simple linear regression predicting race-based inequity based on the percentage of transit board members who are women. We used the results of that model to simulate inequity values for 10,000 hypothetical transit agencies under each of four scenarios: one with no women on the board, one in which a quarter of board members are women, one with a board in which half of all members are women, and one in which three quarters of board members are women. Under scenarios with no women on the board, the simulation was somewhat more likely to produce an inequitable pattern of service changes (one in which locations with more White residents would experience less reduction in service) than an equitable pattern of changes (one in which locations with fewer White residents would experience less reduction in service). Under scenarios where at least half of board members were women, the simulation produced an inequitable outcome less than 1% of the time.
The presence of a board member with a disability might also be associated with more equitable service cuts, but we did not find this association to be statistically significant. The racial composition of transit boards, when measured as the percent of board members who are people of color, did not have a discernible effect on any of our measures of the equity of COVID-era service changes.
How do we make sense of these findings? Firstly, it is important to note that we are asking a slightly different question than the representative bureaucracy literature, particularly for gender. Because the data on service cuts is geographic, and there is generally no residential segregation by gender, the percent male variable evaluates whether an increase in passive representation for women improves policy outcomes for other historically marginalized communities. This is distinct from asking if representation for women improves outcomes for women. That said, as women are disproportionately more likely to be transit riders than men, there is still some implicit same-group representation. In future analysis, additional insights on the role of gender in shaping board outcomes may be drawn from the representative bureaucracy and corporate board literature, although both suggest that these relationships may be industry-specific.
The most likely explanation for the findings presented in this paper is that there is a latent variable that links transit agencies that are likely to make more equitable service cuts with board strategies that prioritize diversity and passive representation. The evidence from the literature on changing board roles suggests that differences in how agency staff utilize board members’ expertise and input, and concurrently influence the diversity of board perspectives, deserves additional attention. Testing the strength of these relationships and governance processes requires a qualitative analysis that asks questions of agency staff and board members on their views of the board’s purpose and decision-making processes.
A few limitations: firstly, our findings on correlations do not necessarily suggest a causal relationship. As noted above, it is possible that a local political environment in which diversity on transit boards is valued will also be one in which equity considerations drive transit planning decisions. Further work would be needed to establish a causal mechanism. Also, our analysis does not account for the baseline distribution of transit service. Transit service patterns that offer minimal or no service in certain areas might not be making cuts there because there is nothing left to cut. We also do not account for differences in transit service use by different populations—a more marginalized neighborhood might experience the same service cuts as a more privileged neighborhood, but the social impact in the more marginalized neighborhood would be greater because of a higher reliance on transit. Using a metric based on accessibility could be more informative than using frequency metrics alone. Very frequent service is not useful if it does not serve the destinations people need to reach. Importantly, changes in the spatial distribution of useful destinations (including education and employment) during the COVID pandemic may make this type of analysis difficult.
Conclusion
In the above sections, we provide an analysis of the relationships between the race and gender composition of transit boards and service adjustments made during the COVID pandemic. Transit board composition for the 36 agencies showed considerable variation: The proportion of the board comprised of women ranged from 0% to 75%, with an average of 38%, while the share of White board members ranged from 0% to 89%, with an average of 29%. Although not fully comparable, our findings show more race and gender diversity in board composition than Ugboro and Obeng’s ( 30 ) analysis conducted more than two decades ago, with a sample of board members that was 76% male, 76% White, and 17% Black. While only 14% of boards in our sample (five out of 36) had at least one member with an identified disability, none of them were comprised exclusively of White, able-bodied men.
Agencies also exhibited variation with respect to the equity of the service cuts made during the COVID pandemic. About a quarter of all agencies had significant positive values for at least one of the four inequity metrics, meaning that locations with more privilege were less affected by service cuts. At least half of agencies in the sample had significant, negative values for each of the four inequity metrics, meaning that locations with less privilege were more affected by service cuts. None of the five agencies that had a board member with a disability enacted inequitable service cuts, that is, all of them increased or maintained service in more vulnerable neighborhoods during the pandemic. We find that transit agencies with greater proportions of women on their boards enacted more equitable service cuts with respect to both race-based equity and an overall equity metric incorporating race, income, and education.
While our analysis only provides assessments of correlations between board governance and equitable service decisions, it suggests that additional research into board governance of transit agencies is important for understanding how to improve the equity of transit service in general. As an understudied and theorized area of urban transit research, board governance deserves additional scholarly attention and most likely requires the use of mixed and qualitative methods to illuminate the politics and processes of decision-making across context. To understand why transit agencies with more women or with people with disabilities on their boards had more equitable service changes during the early months of the COVID pandemic, future research should examine the following questions:
What are the criteria that elected bodies consider when appointing individuals to serve on transit boards?
How do transit board members understand their role in shaping or implementing the mission and values of the agency?
How do transit agency staff members’ understanding of board members’ priorities influence the plans and proposals they present to the board?
Additional analysis and engagement with board governance may also be helpful for improving local practice by providing insights for agency staff on the implications and potential benefits of approaching board composition as a strategic governance activity.
Footnotes
Acknowledgements
The authors would like to thank Grayson Wylie and Sophia Staska for their assistance gathering demographic data about transit board members.
Author Contributions
The authors confirm contribution to the paper as follows: study conception and design: C.T. Voulgaris, R.S. Ray, L.A. Fischer; data collection: R.S. Ray, L.A. Fischer, C.T. Voulgaris; analysis and interpretation of results: C.T. Voulgaris; draft manuscript preparation: R.S. Ray, C.T. Voulgaris, L.A. Fischer. All authors reviewed the results and approved the final version of the manuscript.
Declaration of Conflicting Interests
The author(s) declared no potential conflicts of interest with respect to the research, authorship, and/or publication of this article.
Funding
The author(s) received no financial support for the research, authorship, and/or publication of this article.