
Abstract
Vision is one of the most important human senses, accounting for most of the external information pedestrians receive while crossing the street. However, distracted mobile phone usage during street crossing consumes pedestrians’ cognitive resources and diverts their visual attention. As a result, pedestrians may be unable to fully concentrate on observing the traffic environment and effectively planning their crossing path and behavior. This study evaluated the effect of pedestrian behavioral activities at street crossings on eye-movement (EM) characteristics. The crossing tasks were natural behavior, voice call, text messaging, and listening to music. The tasks were further categorized as simple or complex. A total of 29 participants were recruited in Nanjing: 18 males (62.1%) and 11 females (37.9%) with an average age of 23.59 years (SD = 2.44). The Friedman test was used to analyze differences in saccade frequency, fixation time, browsing number, and browsing time across different scenarios. Text messaging had the most significant impact on pedestrians’ EM characteristics, followed by voice call; music listening had a relatively weaker effect. Secondary task difficulty influenced the percentage of browsing, viewing, and to some extent gaze time. On the other hand, music rhythm and style only partially influenced the percentage of gaze and gaze time. Mobile phones substantially affected pedestrians’ EM characteristics and attention allocation for the same level of secondary task difficulty. These findings contribute to a better understanding of pedestrians’ visual characteristics under distracted mobile phone usage conditions and provide valuable insights for developing appropriate measures to enhance pedestrian safety.
Keywords
Vision is one of the most important human senses: about 80% of the external information pedestrians receive when they cross the street comes from vision ( 1 ). During the process of street crossing, mobile phone distractions will occupy the cognitive resources of pedestrians and some of their visual resources, especially screen fixation (e.g., reading WeChat text messages) and screen fixation plus operation (e.g., viewing and replying to WeChat text messages) behaviors. Such visual distractions can disrupt the allocation of pedestrians’ attention, preventing them from entirely observing the traffic environment, from planning to cross roads safely, and from making behavioral decisions based on the external information they receive ( 2 ).
Previous studies on distracted driving behavior related to mobile phone usage show that secondary tasks will significantly affect drivers’ eye-movement (EM) characteristics, such as visual search patterns and attention allocation ( 3 – 5 ). It is therefore reasonable to assume that distracted mobile phone usage will similarly have an impact on pedestrians’ EM characteristics during street crossing. However, the studies on the effects of secondary tasks on pedestrian EM characteristics are limited.
In visual attention, the process of shifting focus from one target to another through EM is called explicit attention because EM provides an observable signal for this shift of attention. The other type of attention that corresponds to this is internal recessive attention, also known as looking at the stimulus object through the “corner of the eye,”—no EM is involved in this type of attention shift ( 6 ).
Situational awareness is the process of perceiving and understanding elements of the environment at a given time and space and predicting their state ( 7 ). For pedestrians in a street crossing scene, situational awareness refers to their perception, understanding, and prediction of various elements in the entire road environment, such as vehicle running status, traffic signs/markings/signals, other pedestrians, and obstacles. Inattentional blindness refers to attention–detection failures, when an individual’s attention required to participate in a task ignores stimuli and objects unrelated to the task, even if these objects are dynamic, massive, or unusual ( 8 ). When pedestrians focus their attention on secondary tasks, such as mobile phone use while walking, they may ignore oncoming vehicles, other pedestrians, and static/fixed obstacles (e.g., lampposts and steps). This is a nonattentional blindness phenomenon that may lead to certain safety risks. In dual-task walking with mobile phones, pedestrians’ visual attention and situational awareness may be affected. The literature on this aspect mainly focuses on experimental studies based on virtual or natural scenes.
Nasar et al. placed five objects along the experiment walking path without the knowledge of the participants ( 9 ). They found that the number of objects recalled by the participants in the language-talking group was significantly fewer than in the nondistracted group. They pointed out that the cognitive distraction caused by voice call decreased pedestrians’ situational awareness and practical observation of the surrounding environment during walking. Hyman et al. found that compared with nondistracted pedestrians, when pedestrians use mobile phones, they change their walking direction more frequently, are less likely to pay attention to other pedestrians around their walking path, and may even have inattentive blindness, ignoring unusual events happening along the way, such as clowns riding unicycles ( 10 ). In a subsequent study by Hyman et al., this was verified, and pedestrians distracted by voice call and text messaging on mobile phones were less likely to notice the banknotes placed in advance by the researchers on trees along the road ( 11 ).
Using simulation experiments, Kim et al. found that the fixation time and number of pedestrians using mobile phones on the curb significantly decreased when approaching and alighting the curb ( 12 ). They pointed out that distraction caused by mobile phone use may negatively affect path navigation during pedestrian movements, by lowering visual attention to approaching task-related areas on the path. Tapiro et al. observed that all age groups’ crossing behaviors were affected by mobile phone conversations ( 13 ). Moreover, when exposed to environmental distractions, participants were found to choose smaller crossing gaps, take more time making crossing decisions, be slower responding to the crossing opportunity, and allocated less visual attention to the peripheral regions of the road. When not related to mobile phone use, these effects were age-related ( 14 ). Utilizing virtual reality scenarios projected on a large dome screen, Tapiro et al. found that children aged 9 to 10 and 11 to 13 had a wider spread of gazes across the scene ( 15 ).
Lin and Huang conducted a dual-task walking experiment using semi-virtual walking scenarios and found that reading news while walking produced a higher cognitive load and impaired pedestrians’ perceptions of their surroundings more than text messaging or using picture drag apps ( 16 ). Compared with the picture drag app, pedestrians took more time to perceive roadside events under text messaging and reading news visually. In addition, when text messaging and dual-task walking, pedestrians’ perceptions of roadside events depended more on the central visual field, and their attention to the environment either side decreased. Ling conducted pedestrian crossing experiments at a signalized intersection and found that, compared with the nondistracted crossing, when pedestrians used mobile phones to cross the street, while distracted their saccade frequency decreased, pupil diameter increased, and their attention allocation strategy changed, resulting in less attention paid to crosswalks and traffic lights ( 17 ). He found that text messaging had the greatest impact on pedestrian crossing safety followed by voice call, and listening to music (hereafter music listening) had the smallest traffic safety risk.
Pai found that compared with nondistracted street crossing, the likelihood of pedestrians noticing clowns across the street was significantly decreased while text messaging ( 18 ), that is, distracted message-sending may lead to pedestrian inattentive blindness. In addition, when using mobile phones, the probability of pedestrians noticing external auditory stimuli (e.g., the sound of a clown honking a horn) also decreased significantly, especially when music listening. They noted that text messaging had the most significant effect on unsafe pedestrian behavior and inattentional blindness. Davis and Barton used nonvisual simulation scenarios to study the impact of mobile phone distraction on pedestrians’ auditory perception, and the results showed that pedestrians needed a shorter distance to detect oncoming vehicles when making phone calls ( 19 ). Nonetheless, the impact of phone calls and message distraction on the crossing threshold was insignificant. They pointed out that the distracting effect of talking on the phone mainly manifests in a failure to perceive vehicles in the auditory domain rather than having an impact on the ability to judge a safe crossing threshold. They refer to multiple resource theory as an explanation: unlike the initial perception of oncoming vehicles, assessing a safe crossing threshold can be viewed as engaging appropriate resources from the response selection/execution level of information processing, rather than at the perception/cognition level. Therefore, voice call relies heavily on perception, which competes less vigorously with crossing threshold judgment than perceived distance.
Silva et al. focused on sensory processing in considering the effects of receiving mobile phone audio information on individuals’ perceptions of other pedestrians. The results showed that compared with the nondistracted condition, the obstacle detection time and information reporting accuracy of elderly/young individuals did not change significantly ( 20 ). Compared with audio data, the accuracy of the data reported by older people under text information decreased significantly. Silva et al. concluded that text messages on mobile phones prolong individuals’ perceptions of other pedestrians, which is not conducive to pedestrian safety, especially for older people who may be at greater risk of collisions. Courtemanche et al. used electroencephalographic data to explore the root causes of pedestrians’ impaired judgment ability caused by text messaging ( 21 ). They found that text messaging while walking distracted pedestrians, making it harder for them to recognize the crossing direction of oncoming dot-like animated characters in a virtual experimental scene. The alpha brain wave results showed a negative relationship between task performance and task set inhibition when text messaging and walking, meaning that the more inhibition required, the greater the negative impact of text messaging distraction on task performance. They found that when text messaging on foot, task switching and its cognitive cost significantly affected pedestrian safety performance.
The results of the preceding literature show that mobile phone use can distract pedestrians’ visual and auditory attention, resulting in a decline in situational awareness and even leading to inattentional blindness. These distraction effects caused by mobile phone usage primarily manifest as interference with pedestrians’ perception of external environmental factors that could hinder timely and effective responses to emergencies.
The current study is a preliminary exploration of this field, which analyzes pedestrians’ visual search modes and attention distribution rules under the condition of mobile phone distraction, and refines and distinguishes the effects of factors such as mobile phone use and the secondary task difficulty, to reveal the impact of mobile phone distraction on pedestrians’ EM characteristics. Specifically, this study (1) collected pedestrian EM data at a street crossing in real traffic scenes under three types of distraction, (2) analyzed the effects of mobile phone distraction and secondary tasks on EM characteristics: talking, text messaging, and listening to music, and (3) analyzed the effect of mobile phone use on EM characteristics by controlling for secondary task difficulty. Our results showed that attention paid to the traffic environment significantly decreased when pedestrians used mobile phones, making street crossing unsafe. In addition, mobile phone use affected pedestrians’ visual information, adversely affecting their direction and distance perception. An outline of the study activities is given in Figure 1.
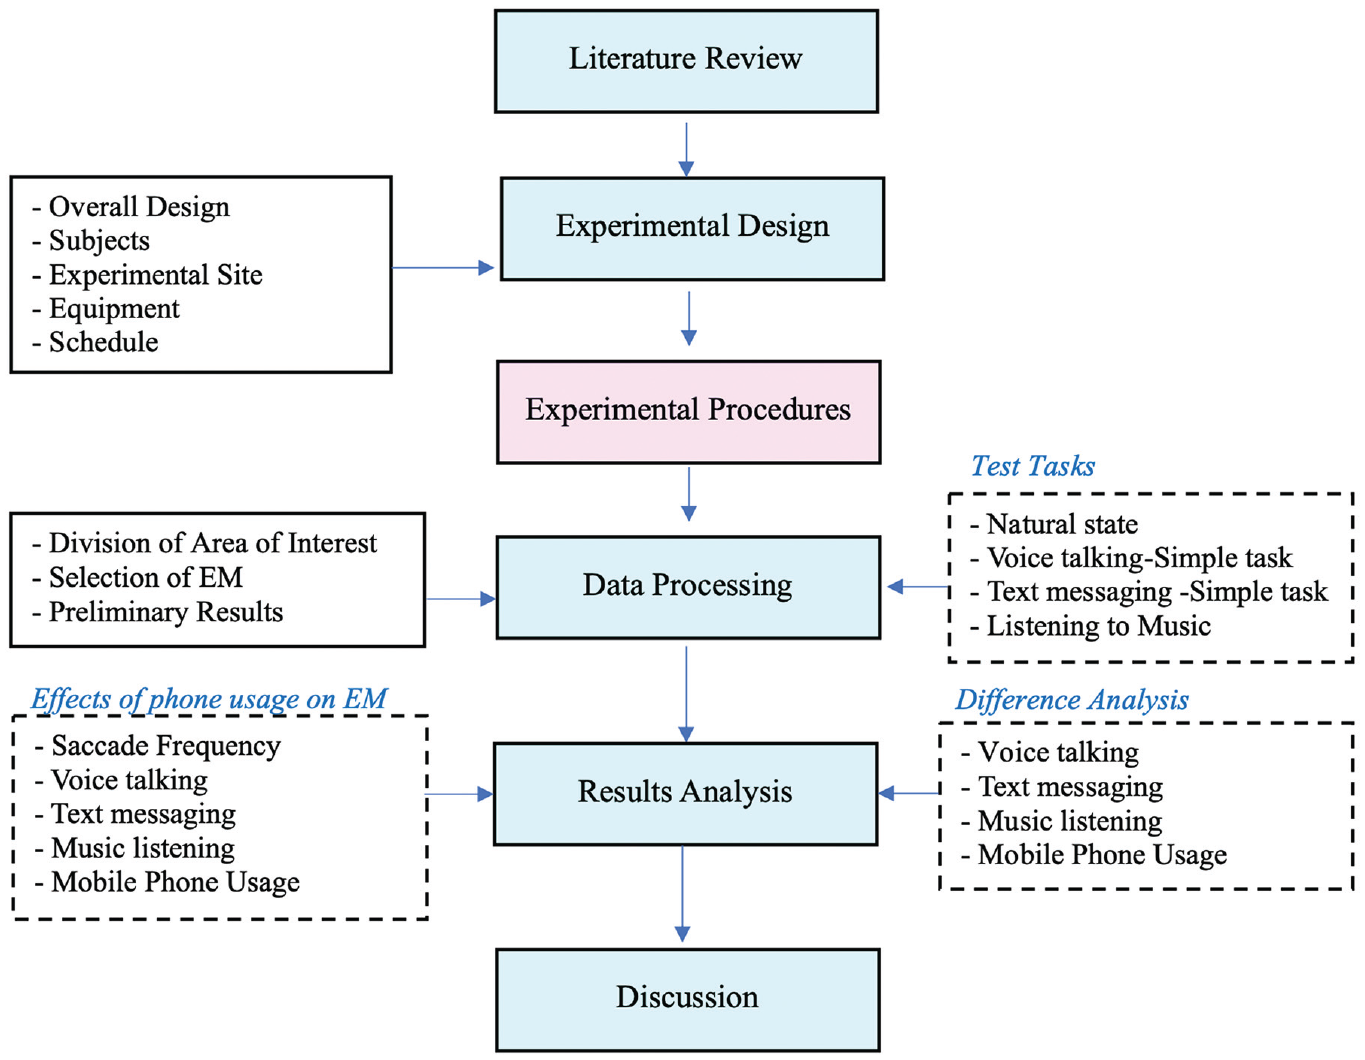
Outline of study activities.
Experimental Design
Overall Design
The EM experiment was a between-subjects design (selected to control for differences among participants) that evaluated the effects of different mobile phone usage conditions on EM characteristics when crossing the street. First, the participants’ EM index data were collected through street crossing experiments in natural road scenes. Then, statistical methods were used to analyze the differences.
The EM experiments implemented three typical mobile phone use modes: voice call, text messaging, and music listening. Simple and complex calculations represented the first two modes’ difficulty levels, whereas slow-rhythm light music (LM) and fast-rhythm rock music (RM) represented the third mode difficulty. Finally, the control group had the task of crossing the street naturally without distraction. Therefore, consistent with gait experiments (22), the EM experiments included seven tasks, corresponding to seven experimental conditions: natural state crossing, voice call-simple task (ST) crossing, voice call-complex task (CT) crossing, message-ST crossing, message-CT crossing, listening to LM crossing, and listening to RM crossing.
In the natural road scene, an intersection satisfying the experimental requirements was selected. The participants wore an eye tracker to complete the task of crossing the street under the different distraction conditions. After the experiments were completed, various EM index data were output through the auxiliary software of the eye tracker for statistical analysis. Voice call and text messaging involved completing a mathematical calculation with two difficulty levels: simple and complex. For music listening, the music repertoire was divided into LM and RM.
Participants
Participants were recruited on the campus of Southeast University in an offline way, and were remunerated for their time. Because the participants in the experiment needed to wear an eye tracker to complete the tasks, they were required to have no eye diseases, normal vision, and not to wear glasses for myopia. A total of 29 participants were recruited to meet the requirements of the experiment. All were smartphone users with at least 1 year of smartphone experience. None of them had participated in similar behavioral experiments before, nor had they participated in the gait experiment. Among them, there were 18 males (62.1%) and 11 females (37.9%), with an average age of 23.59 (SD = 2.442); 23 of the participants (79.3%) reported using a mobile phone for more than 4 h a day. Participants’ demographic information is given in Table 1.
Demographic Information and Basic Characteristics of the Participants (N = 29)
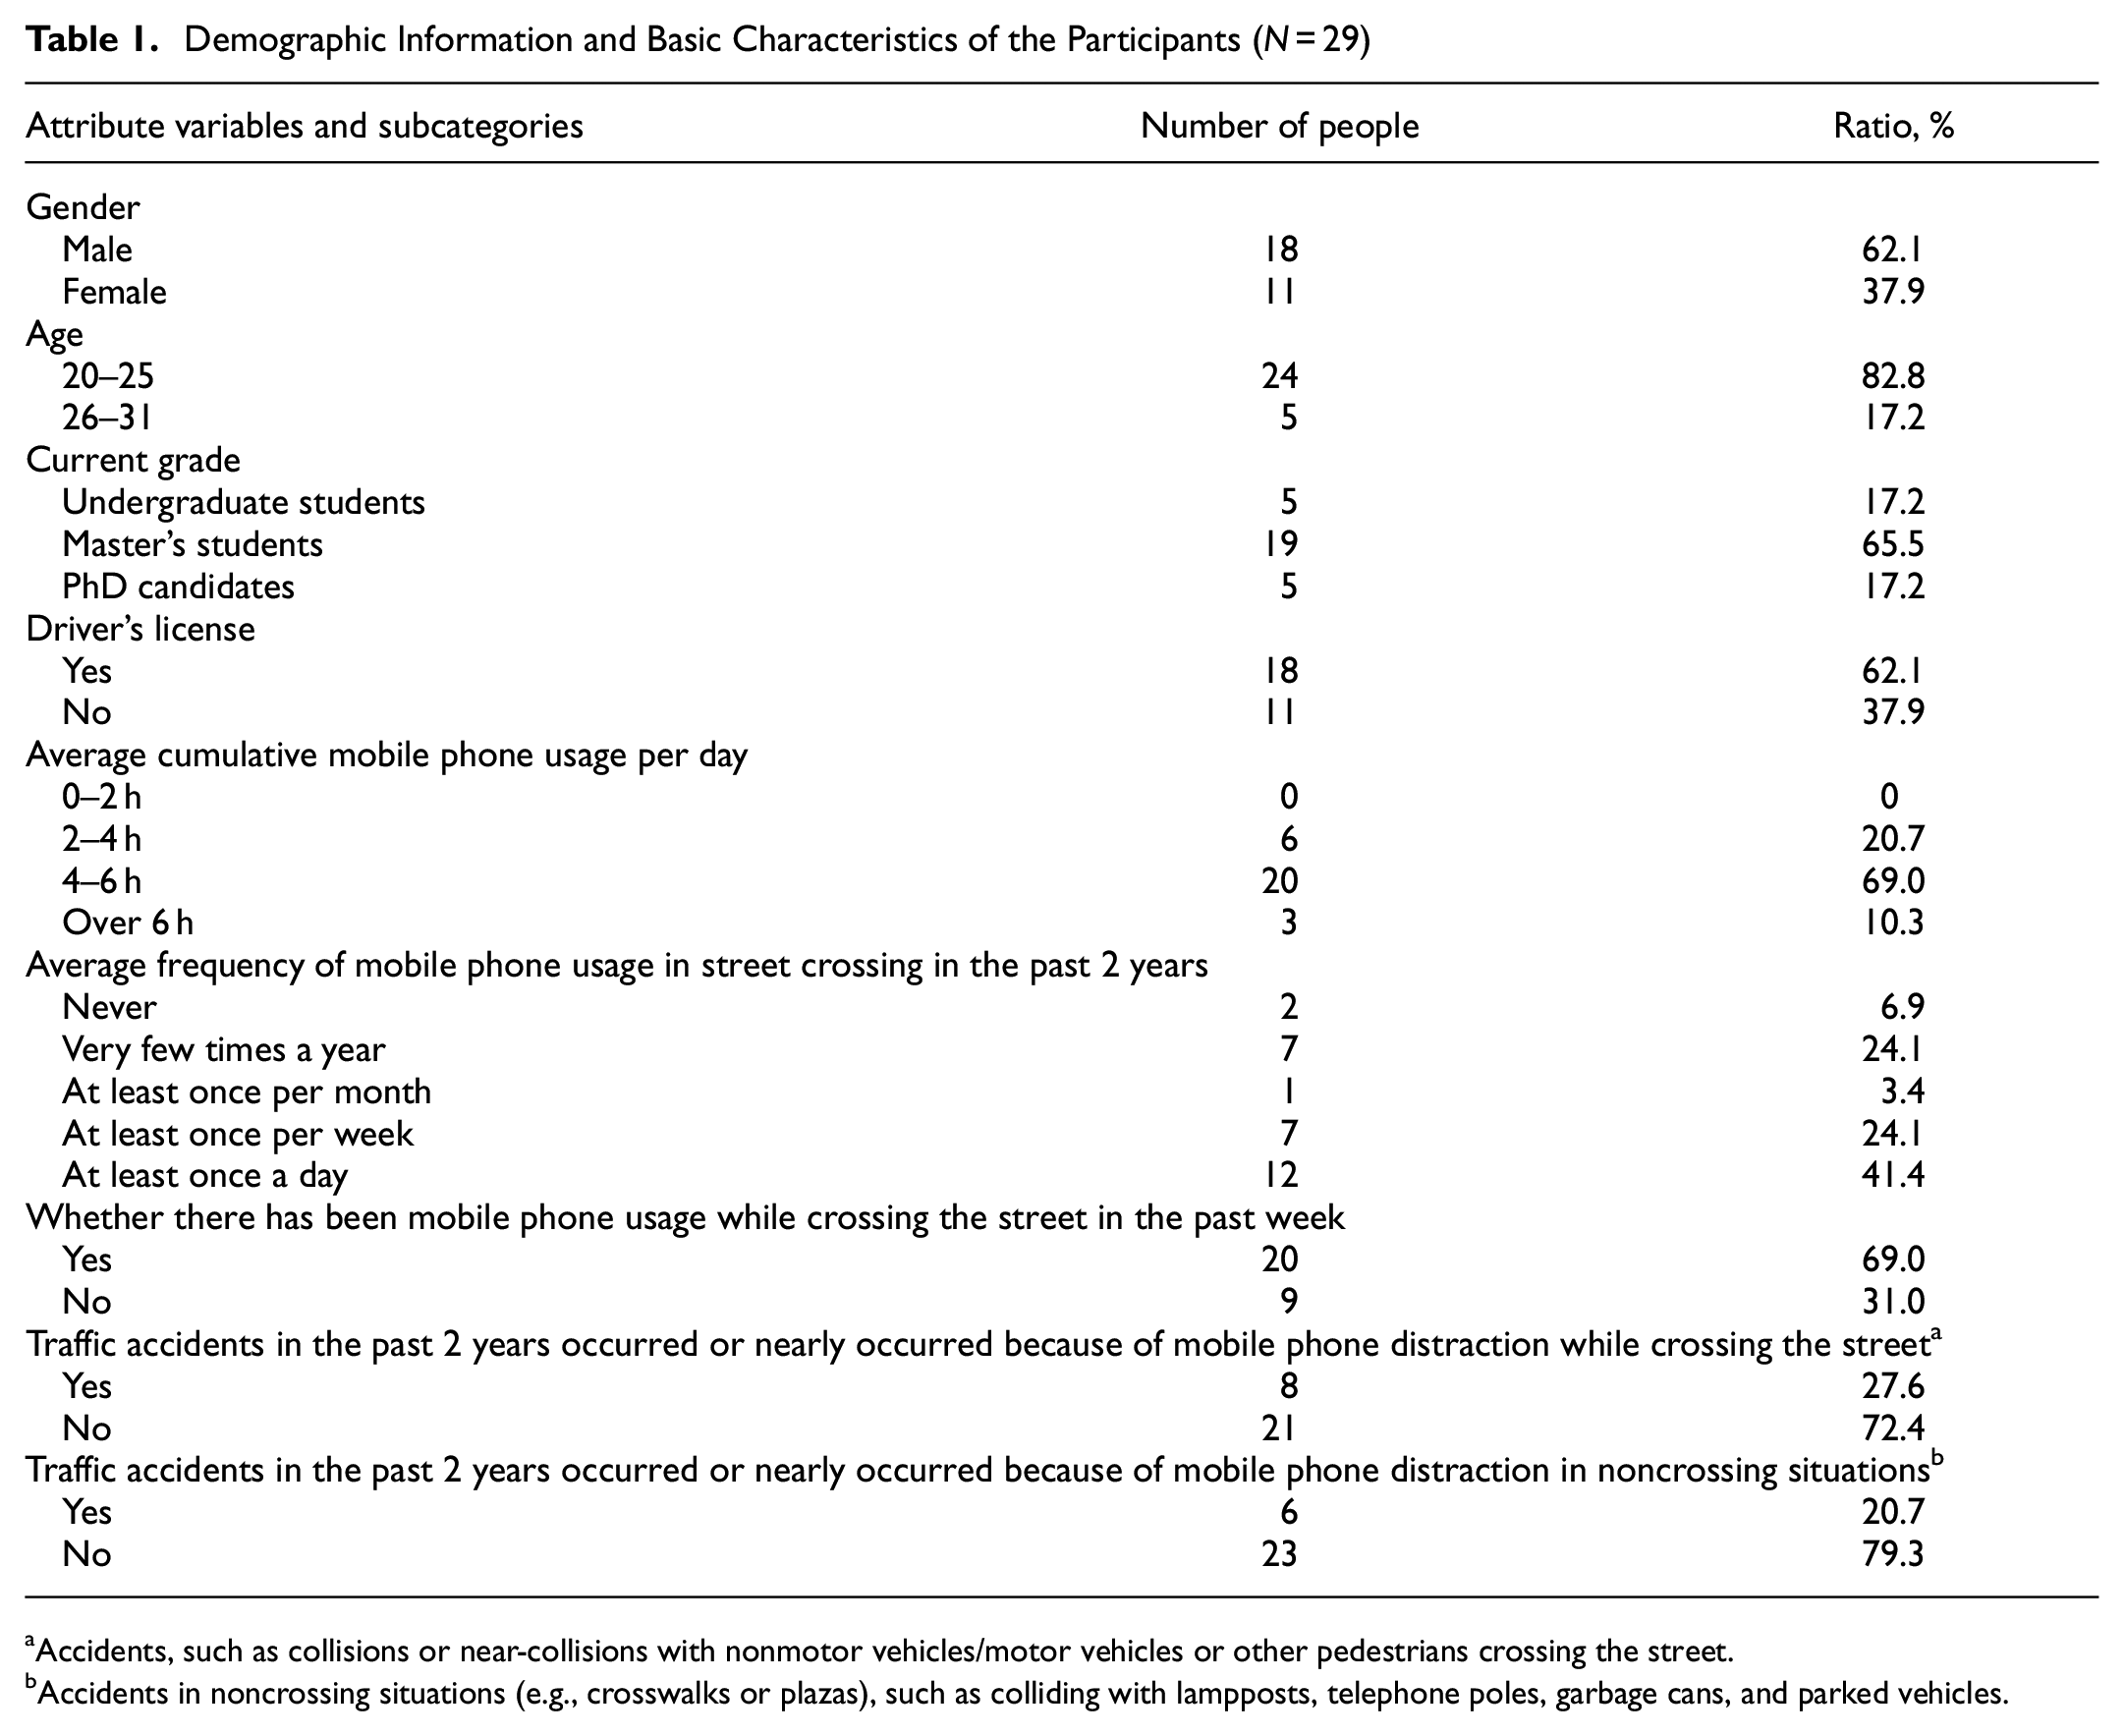
Accidents, such as collisions or near-collisions with nonmotor vehicles/motor vehicles or other pedestrians crossing the street.
Accidents in noncrossing situations (e.g., crosswalks or plazas), such as colliding with lampposts, telephone poles, garbage cans, and parked vehicles.
Experimental Site
The study intersection was located on the Southeast University Jiulonghu Campus. The intersecting roads were two-way, with four and two lanes. The experimental crosswalk was east–west, with clearly visible white crosswalk lines set according to the standard, and the road crossed was a two-way, two-lane road with a central divider. The length of the available crosswalk in the experiments was approximately 25.2 m, including the area marked with clear crosswalk lines and a small section without crosswalk lines between the two sides of the curb. Figure 2 shows the overhead view of the intersection crossing and crosswalk. The experiments were conducted between 08:00 and 11:00 a.m. and between 2:00 and 5:00 p.m. (in 2022) during low to moderate pedestrian volumes to avoid interfering with the natural street crossing behavior of the participants.
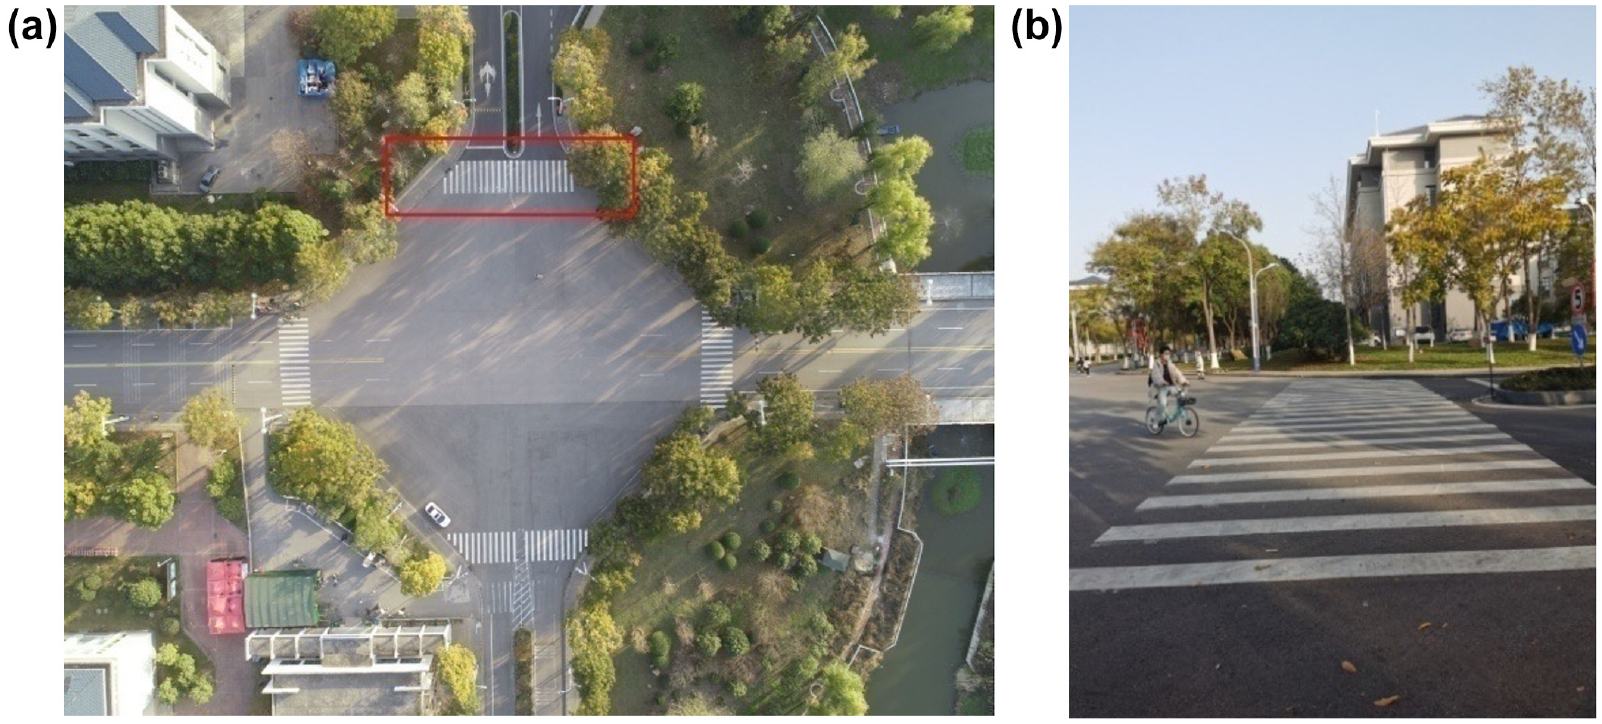
Test intersection crossing and crosswalk: (a) intersection crossing and (b) crosswalk.
Equipment
Participant eye-tracking data were collected using the Tobii Glasses 2 wearable eye tracker (Figure 3a). The eye-tracking data during the test were stored on the SD card of the recording module (Figure 3b), and the corresponding D-Lab software was used to process and export the eye-tracking data in the later stage. The sampling rate of the Tobii Glasses 2 eye tracker was 50/100 Hz, and the headwear module weighed only 45 g, ensuring the participants’ comfort and freedom of movement during the experiment, conducive to obtaining data on natural pedestrian behavior. Participants used a Huawei P30 Pro mobile phone and an in-ear Bluetooth headset. The D-Lab software on the laptop controlled the eye tracker to calibrate the pupil position and the start/end of the recording. In addition, to ensure safety, all the test personnel and participants at the site wore reflective vests.
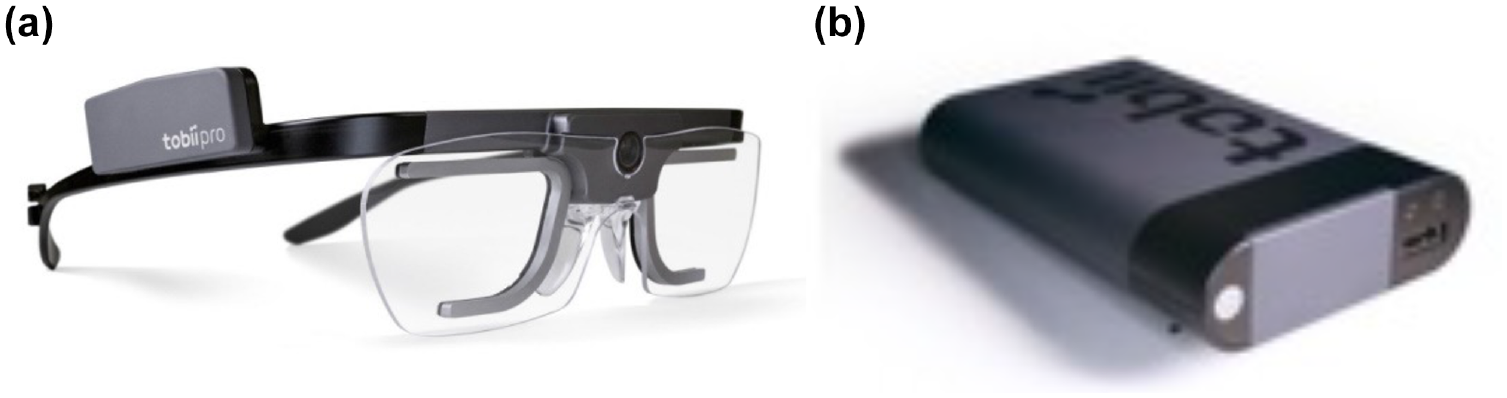
Tobii Glasses: (a) wearable eye module and (b) SD card.
Experimental Schedule
The experimental equipment (e.g., eye tracker and laptop) was tested to ensure it was all in working order. Participants were asked to get adequate sleep the day before the test. Several activities were conducted before the test started. First, the researchers briefed the participants about the purpose, content, and process involved, especially the possible safety risks—participants were given the opportunity to opt out of the experiment at this stage. Second, the participants wore the eye trackers for adaptive training: they received guidance on wearing the eye tracker, adjusting the position for comfort, and given time to walk on the side of the road for 3 to 5 min to get used to the equipment. Third, the participants were informed that their data would be anonymized and that the results would only be used for academic research. Participants were asked to complete a questionnaire eliciting demographic information and details of daily mobile phone usage. Finally, the eye tracker was calibrated in preparation for the formal trial.
Calibration was based on the Tobii Pro Glasses 2 user manual ( 23 ). During calibration, each participant’s eyes were within the effective range of the eye tracker’s sensors. The participant was instructed to focus on specific points displayed on the screen, which generally followed a pattern encompassing the entire screen area. The eye tracker then captured and recorded the position of the eyes as the participant viewed each point.
Experimental Procedures
Test Tasks
The EM experiment comprised seven tasks, each of which was repeated for three trials. Trial 1 was an adaptive operation exercise, and the EM data were not formally recorded. Trials 2 and 3 recorded the EM data. The average value of each EM index in the latter two trials (Trials 2 and 3) was taken for statistical analysis in subsequent data processing. Therefore, each participant was required to complete 21 (7 × 3) trials. In addition, to improve the reliability of the results, none of the calculation questions were repeated in the voice call and message crossing task. The music tracks were not repeated in the listening music crossing task. As shown in Table 2, the mobile phone usage mode and its difficulty level were set for the secondary tasks. The seven tasks were conducted randomly, but the three experiments within the same task were conducted consecutively. The interval between each experiment was 1 min, and between each task was 2 min to avoid fatigue effects. As stated, in all scenarios, the researcher controlled when the data recording began and finished via the D-Lab software.
Use Mode and Level Setting of Mobile Phone in the Eye-Movement Experiment
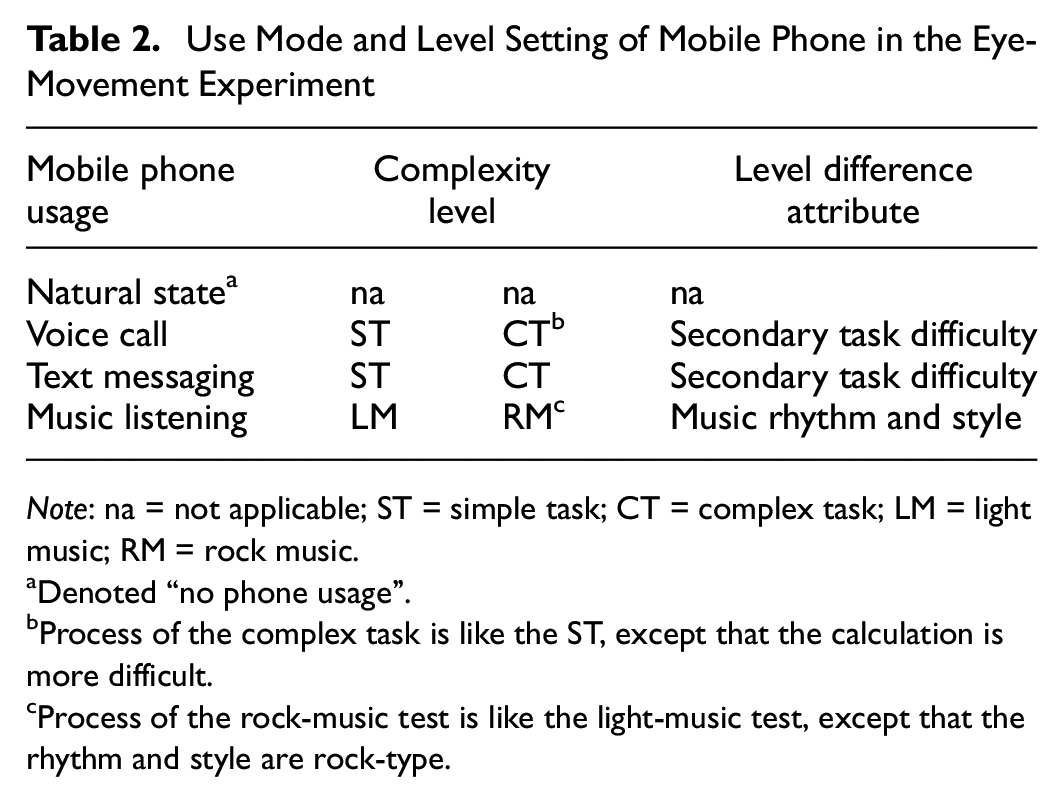
Note: na = not applicable; ST = simple task; CT = complex task; LM = light music; RM = rock music.
Denoted “no phone usage”.
Process of the complex task is like the ST, except that the calculation is more difficult.
Process of the rock-music test is like the light-music test, except that the rhythm and style are rock-type.
Natural State
After successfully calibrating the eye tracker, the participant stood on the sidewalk, looked ahead, held the mobile phone in one hand but did not use it, the arm dropped naturally by the side of the body.
The researcher instructed the participant to start, and the participant chose the appropriate time to alight the curb and begin crossing the street at their own pace, without stopping.
When the participant reached the other side of the crosswalk, stepped onto the curb and on to the sidewalk, the natural street crossing was completed.
Voice Call-Simple Task
The participant stood on the sidewalk at the start of the crosswalk, looked ahead, held the mobile phone in his hand with one hand, and waited for the next instruction.
A researcher made a voice call, and the participant answered the call, held the mobile phone to the ear, and kept the voice call posture to simulate typical behavior.
The researcher asked them simple calculation questions (e.g., 8 + 13 = …) at a typical speed. After calculation, the participant gave the answer (e.g., Courtemanche et al. [ 21 ]). The participant had to complete five simple calculations in advance of the crossing.
The researcher then gave instructions to start crossing the road. The researcher then chose an appropriate time to step off the curb and begin crossing the street at their usual pace, without stopping, keeping their voice-call posture (i.e., phone to ear).
When starting, still at a distance from the participants, the researcher continued to ask questions, which the participant answered aloud. A total of five simple calculations were set in advance for the participant to complete during the crossing. However, there no requirement was set for the number of answers. The researcher asked the questions in line with the speed the participants answered them.
Once the participant had reached the other side of the crosswalk, stepped on the curb and onto the sidewalk, the voice call-ST crossing was completed, and the researcher recorded the participant’s answers.
The CT process was identical to that of the ST, except the calculations were more difficult.
Text Messaging-Simple Task
The process of this experiment was the same as the voice call-ST crossing EM experiment, the difference lay in the secondary task. That is, the participants needed to read and answer a simple calculation question (e.g., 8 + 13 = …) saved in advance in the mobile memo app by text and only needed to input the calculation result after “=” (e.g., Courtemanche et al. [ 21 ]). During the experiment, the participants used both hands to hold the mobile phone and input figures on the keyboard. First, they completed five simple calculations in a standing position on the sidewalk in advance of the crossing. Then, they accessed five simple questions saved in another document for completing during crossing the street—answering all the questions was not a requirement. Participants were instructed to maintain the mobile phone operation position using both hands while crossing the street and not to stop walking. As with the voice call, the CT process was identical to that of the ST, except that the calculation was more complicated. The text messaging-CT involved calculation questions that mixed addition and multiplication. For instance, “34 + 6 × 8 = …,” and the correct input text should be “82” after calculation.
Music Listening: Light Music
The music listening process was identical to the voice call test, the difference being that the secondary tasks differed. Participants wore headphones and listened to LM standing on the sidewalk for 1 min in advance and then completed the task of listening to LM without stopping when crossing the street. In addition, the participants were asked to evaluate their familiarity with and liking of the LM tracks after Trials 2 and 3. The RM process was as the LM test, except that the rhythm and style were rock.
Data Processing
Division of Area of Interest
Attentional resources are not evenly distributed across various external stimuli or observation objects. For important targets and their areas, pedestrians will observe them repeatedly. In contrast, for secondary targets and their areas, the number of pedestrian observations is significantly decreased or even ignored. That is, pedestrian attention is selective. Therefore, dividing the pedestrian’s visual field area into several sub-areas, areas of interest (AOI), is necessary. This is the premise and basis for studying pedestrian visual search patterns and attention distribution and for researching the effects of mobile phone distraction on pedestrian EM characteristics.
According to pedestrians crossing the street in real life and the purpose of this research, this study divided the pedestrian visual field area into five sub-areas: mobile phone screen, crosswalk area, crosswalk-left side (LS), crosswalk right side (RS), and front area. As shown in Figure 4a, the pedestrian visual field AOI was divided in D-Lab software. Since the natural state, voice call, and music listening conditions did not involve looking at the screen, that is, no mobile phone AOI existed, only four sub-areas are shown in Figure 4b.
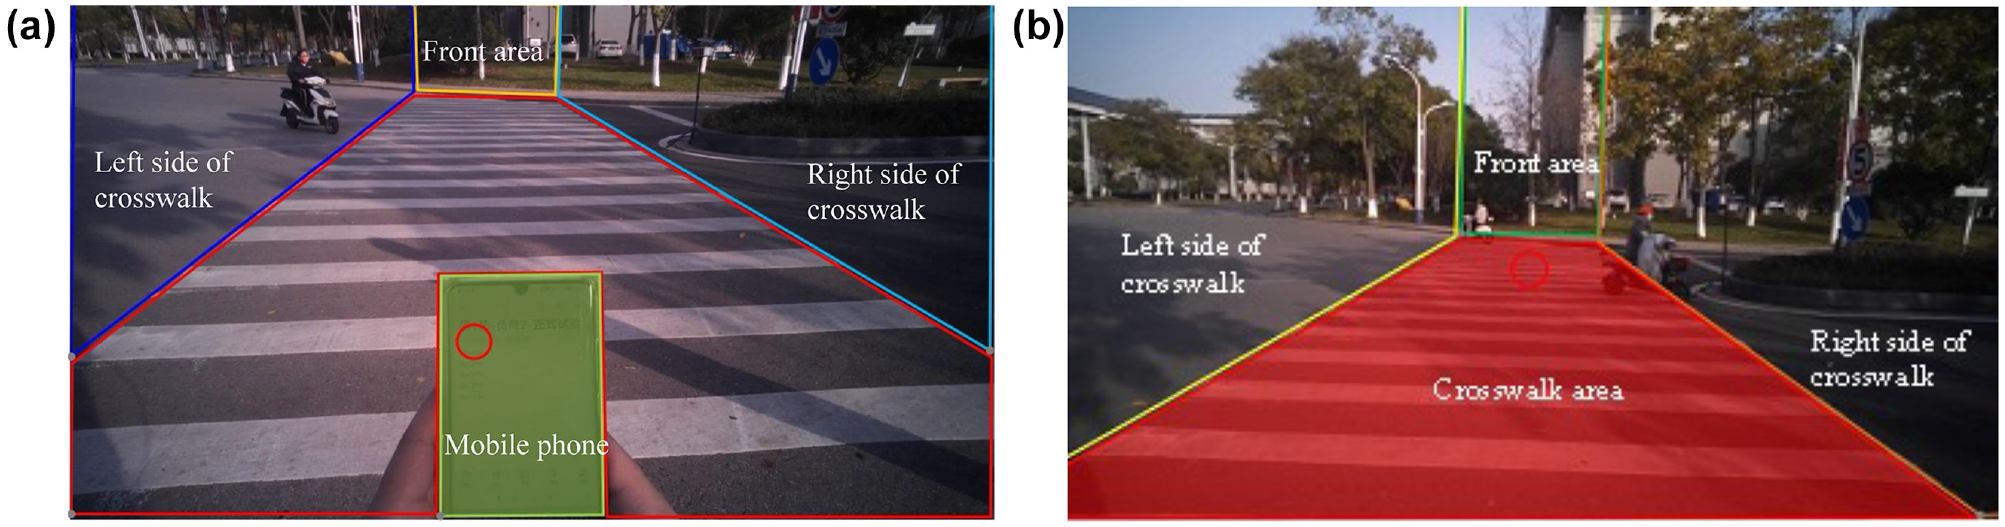
Pedestrian crossing street view and the areas of interest: (a) mobile phone used and (b) no mobile phone used.
Selection of EM Indicators
Because of individual differences in the various secondary tasks, participants’ street crossing times were generally different. To eliminate the effect of street crossing time and make EM indicators under different conditions more comparable, statistical analysis was conducted using the following indicators: saccade frequency, average browsing time, average fixation time, percentage number of browsings, percentage browsing time, percentage number of fixations, percentage fixation time.
(a) Saccade frequency: the ratio of the total number of saccades in the street crossing process to the street crossing time. This metric can be interpreted as a sign of inattention, as the eyes continually move and do not fixate long enough to process information in depth.
(b) Average browsing time (ABT): a specific AOI during the crossing process (total browsing time divided by the number of browsings). This metric is commonly used to assess how long individuals engage with content.
(c) Average fixation time (AFT): a specific AOI during the crossing process (total fixation time divided by the number of fixations). This metric is commonly used in eye-tracking technology research to assess where and how long individuals focus their attention.
(d) Percentage number of browsings (PNB): a specific AOI to the total number of browsings of all AOI during the crossing process. It is often used to gauge user engagement and behavior patterns, providing insights into inattention, distraction, and how attention is distributed.
(e) Percentage browsing time (PBT): a specific AOI to the total browsing time of all AOI during the crossing process. This measurement is useful for assessing inattention, distraction, and attention distribution across different content elements.
(f) Percentage number of fixations (PNF): a specific AOI to the total number of fixations of all AOI during the crossing process. This metric is crucial for understanding visual attention and can effectively assess inattention, distraction, and attention distribution.
(g) Percentage fixation time (PFT): a specific AOI to the total fixation time of all AOI during the crossing process. This metric is key to understanding how viewers allocate their visual attention and can be used to assess levels of inattention, distraction, and attention distribution across different elements.
Preliminary Results
In the process of EM data processing, the task segment division function in the D-Lab software was used to intercept and process only the EM data during the street crossing, that is, from the moment when the participants’ feet stepped off the curb to the moment when their feet stepped onto the curb on the other side of the crosswalk. In addition, the average values of various EM indexes in Trials 2 and 3 were taken as the results for subsequent statistical analyses, as follows:
(a) Comparing the EM characteristics in the process of street crossing under the three conditions of voice call: natural state, voice call-ST, and voice call-CT.
(b) Comparing the EM characteristics in the process of street crossing under the three conditions of text messaging: natural state, text messaging-ST, and text messaging-CT.
(c) Comparing the EM characteristics in the process of street crossing under the three conditions of music listening: natural state, music listening-LM, and music listening-RM.
(d) Evaluating the effects of different mobile phone usage modes (voice call and message sending) on the EM characteristics while crossing the street under the same level of secondary task difficulty.
Results
Effect of Mobile Phone Usage on EM Indicators
Effect on Saccade Frequency
Table 3 gives the descriptive statistics for saccade frequency and the results of the Shapiro-Wilk (S-W) normality test for voice call, text messaging, and music listening. According to the mean values, the saccade frequency of the distracted voice call crossing was higher than the natural state and increased with the secondary task difficulty. On the other hand, when text messaging while crossing, the saccade frequency was lower than the natural state, and decreased with the secondary task difficulty. The saccade frequency fluctuated slightly during music listening compared with the natural state. The post facto test modified by the Bonferroni method was used for comparison, and the results of voice call, text messaging, and music listening are given in Table 4.
Descriptive Statistics of Saccade Frequency of Voice Call, Text Messaging, and Music Listening
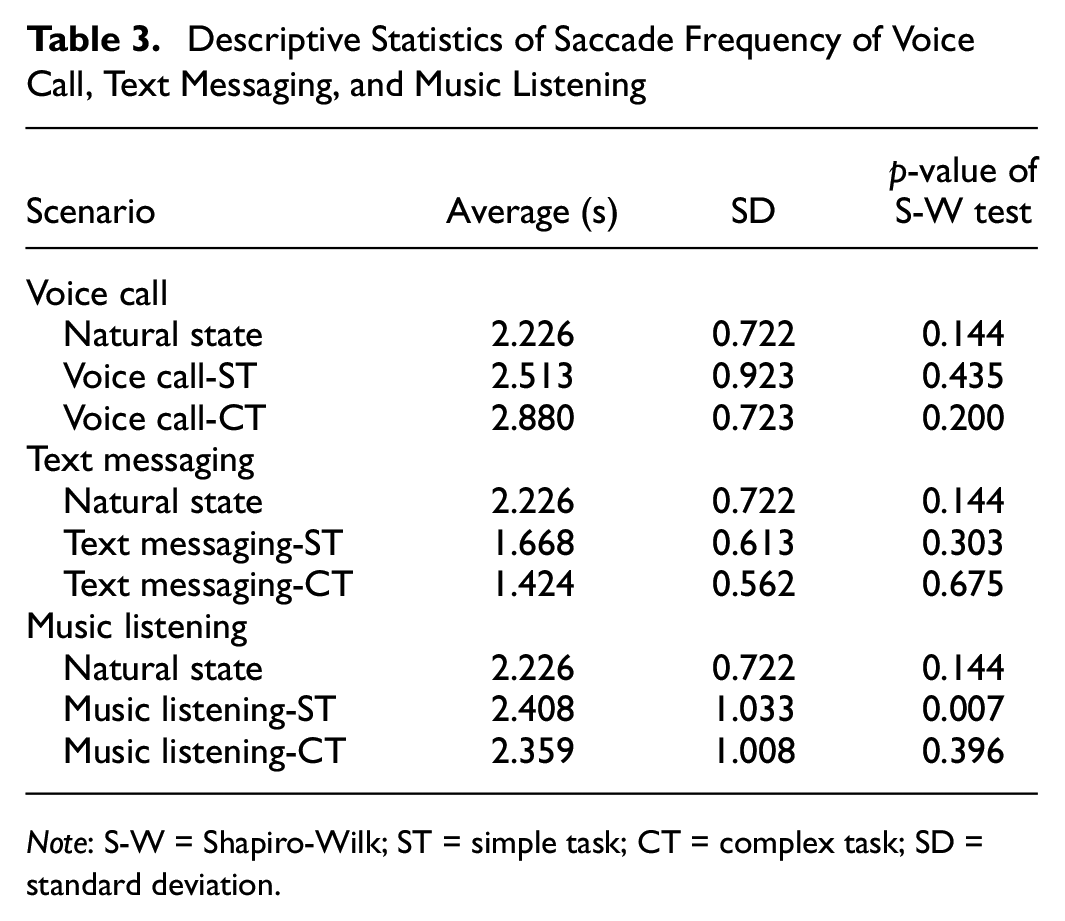
Note: S-W = Shapiro-Wilk; ST = simple task; CT = complex task; SD = standard deviation.
Comparison of Saccade Frequency in Pairs
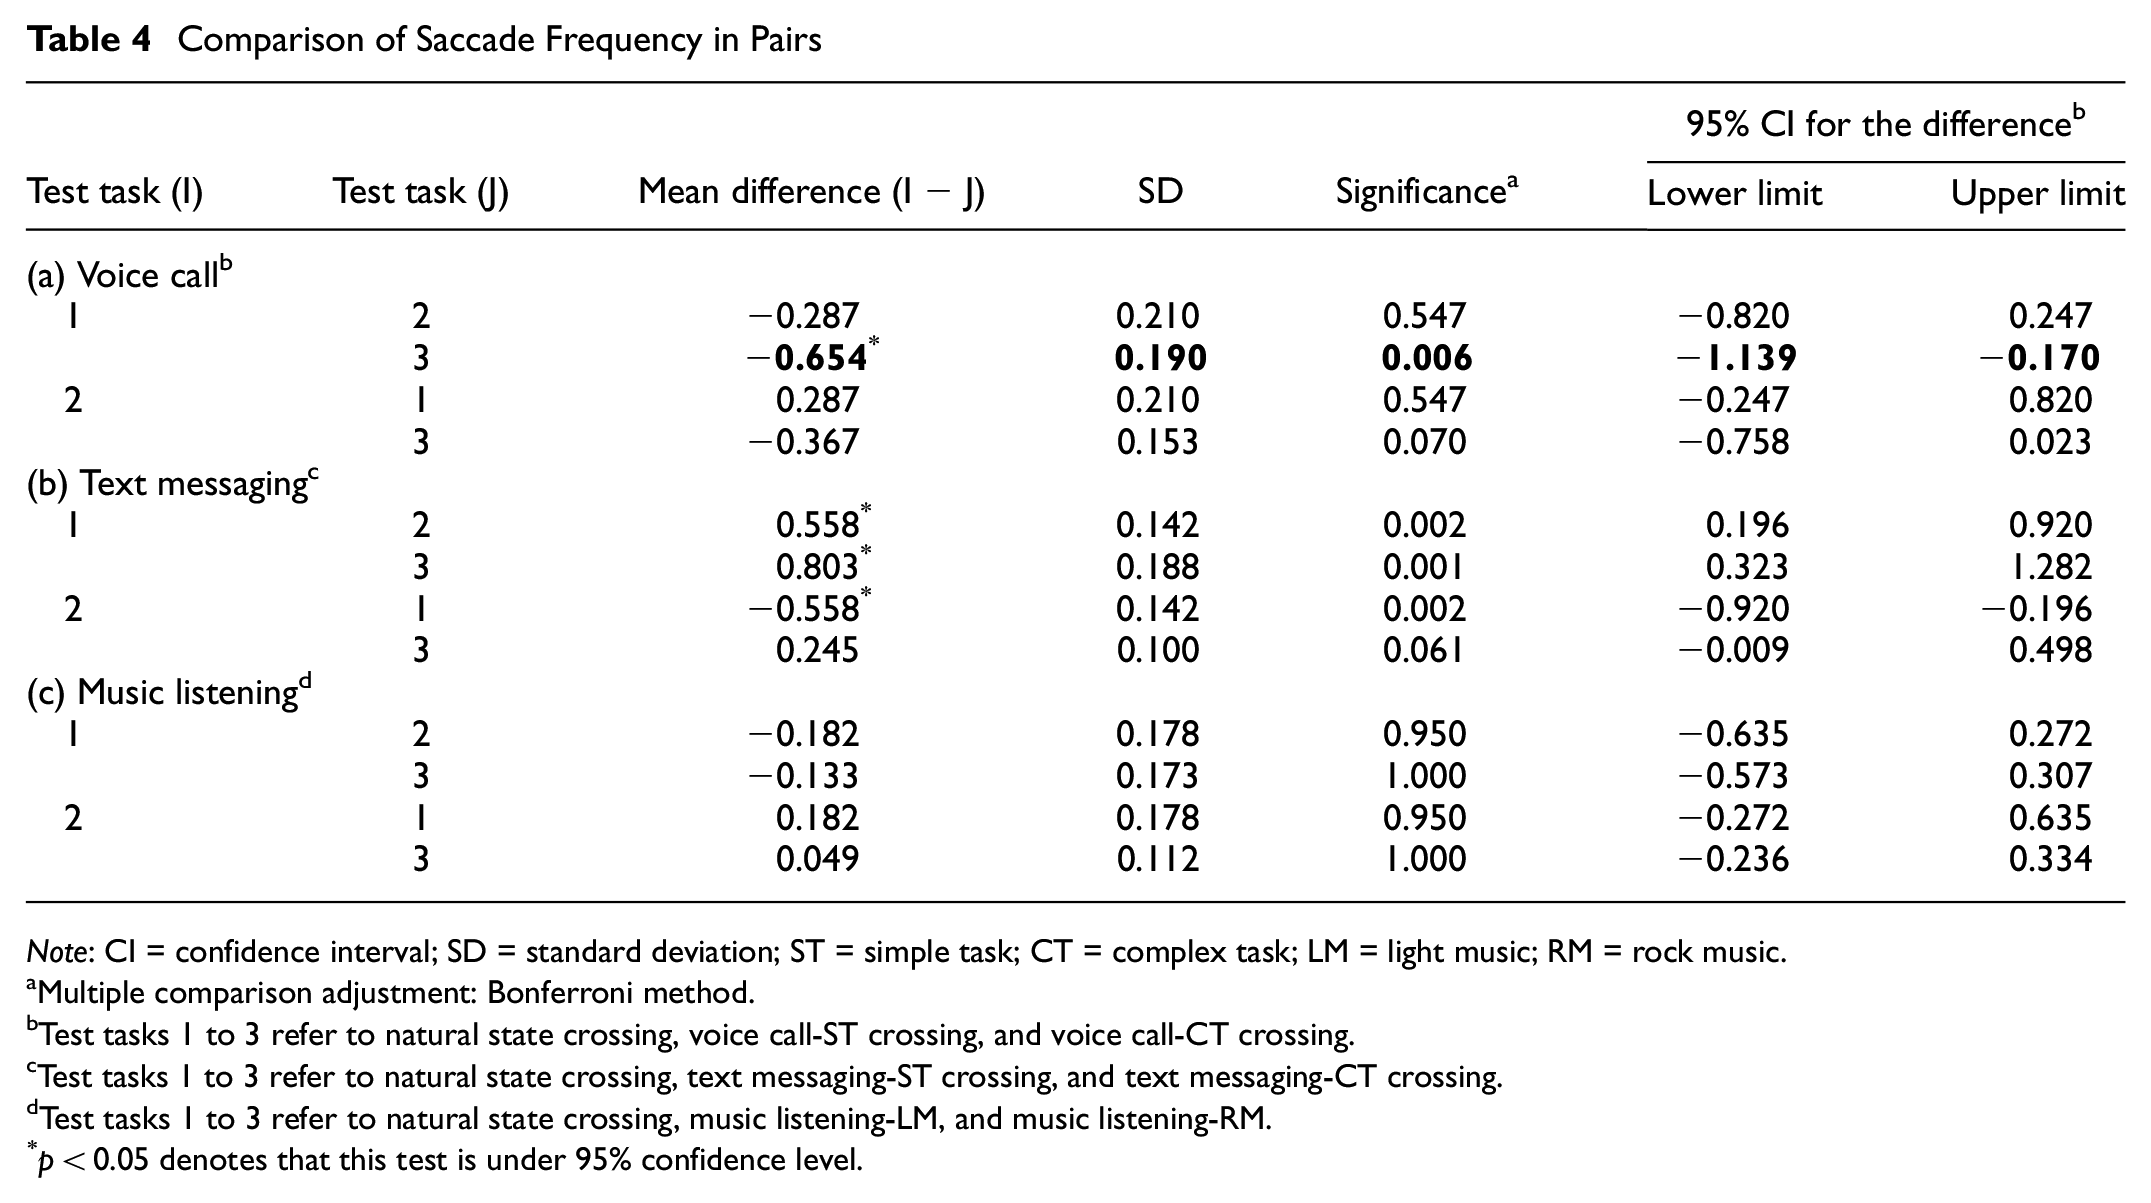
Note: CI = confidence interval; SD = standard deviation; ST = simple task; CT = complex task; LM = light music; RM = rock music.
Multiple comparison adjustment: Bonferroni method.
Test tasks 1 to 3 refer to natural state crossing, voice call-ST crossing, and voice call-CT crossing.
Test tasks 1 to 3 refer to natural state crossing, text messaging-ST crossing, and text messaging-CT crossing.
Test tasks 1 to 3 refer to natural state crossing, music listening-LM, and music listening-RM.
p < 0.05 denotes that this test is under 95% confidence level.
For voice call, the saccade frequency was higher during the call than the natural crossing. When the secondary task was complex, the difference was statistically significant (p < 0.05), whereas when the secondary task was simple, the difference was not significant (p > 0.05). In addition, although the saccade frequency for voice call-ST was smaller than the voice call-CT, the difference was nonsignificant (p = 0.070 > 0.05), indicating that the secondary task difficulty had no significant effect on saccade frequency. Compared with the natural state, when crossing the street under voice distraction (especially when the secondary task was complex) the overall cognitive load increased, visual search efficiency decreased, and to some extent, alertness to the traffic environment increased. In this case, pedestrians may observe the external environment more frequently to obtain timely, adequate information.
For text messaging (Table 4b), compared with the natural state crossing, the saccade frequency significantly decreased when text messaging (p < 0.05), but the effect of secondary task difficulty was not significant, and the difference between the saccade frequency of ST and CT crossing was nonsignificant (p > 0.05). The overall cognitive load of text messaging was higher than the natural state. However, unlike voice call, text messaging led to cognitive, visual, and operational distractions.
In the music listening condition (Table 4c), compared with the natural state, there was no significant change in saccade frequency (p > 0.05), nor was the music rhythm significant, and there was no significant difference in saccade frequency when listening to LM or RM (p > 0.05). Thus, music listening has a limited effect on cognitive distraction.
Effect on Other Indicators
For voice call, the results of the six indicators (ABT, AFT, PNB, PBT, PNF, and PFT) for each AOI for the three crossing scenarios are shown in Figure 5. Compared with the natural state, all six indicators for the crosswalk area significantly decreased under the voice call condition. In addition, the indicators decreased with an increase in secondary task difficulty. For the other three AOI, all indicators generally increased compared with the natural state crossing. This was mainly because the PNB decreased when distracted by a phone call. When crossing the street in the natural state, pedestrians paid the highest attention to the crosswalk area, where the PNF accounted for about 60% and PFT for about 50%.
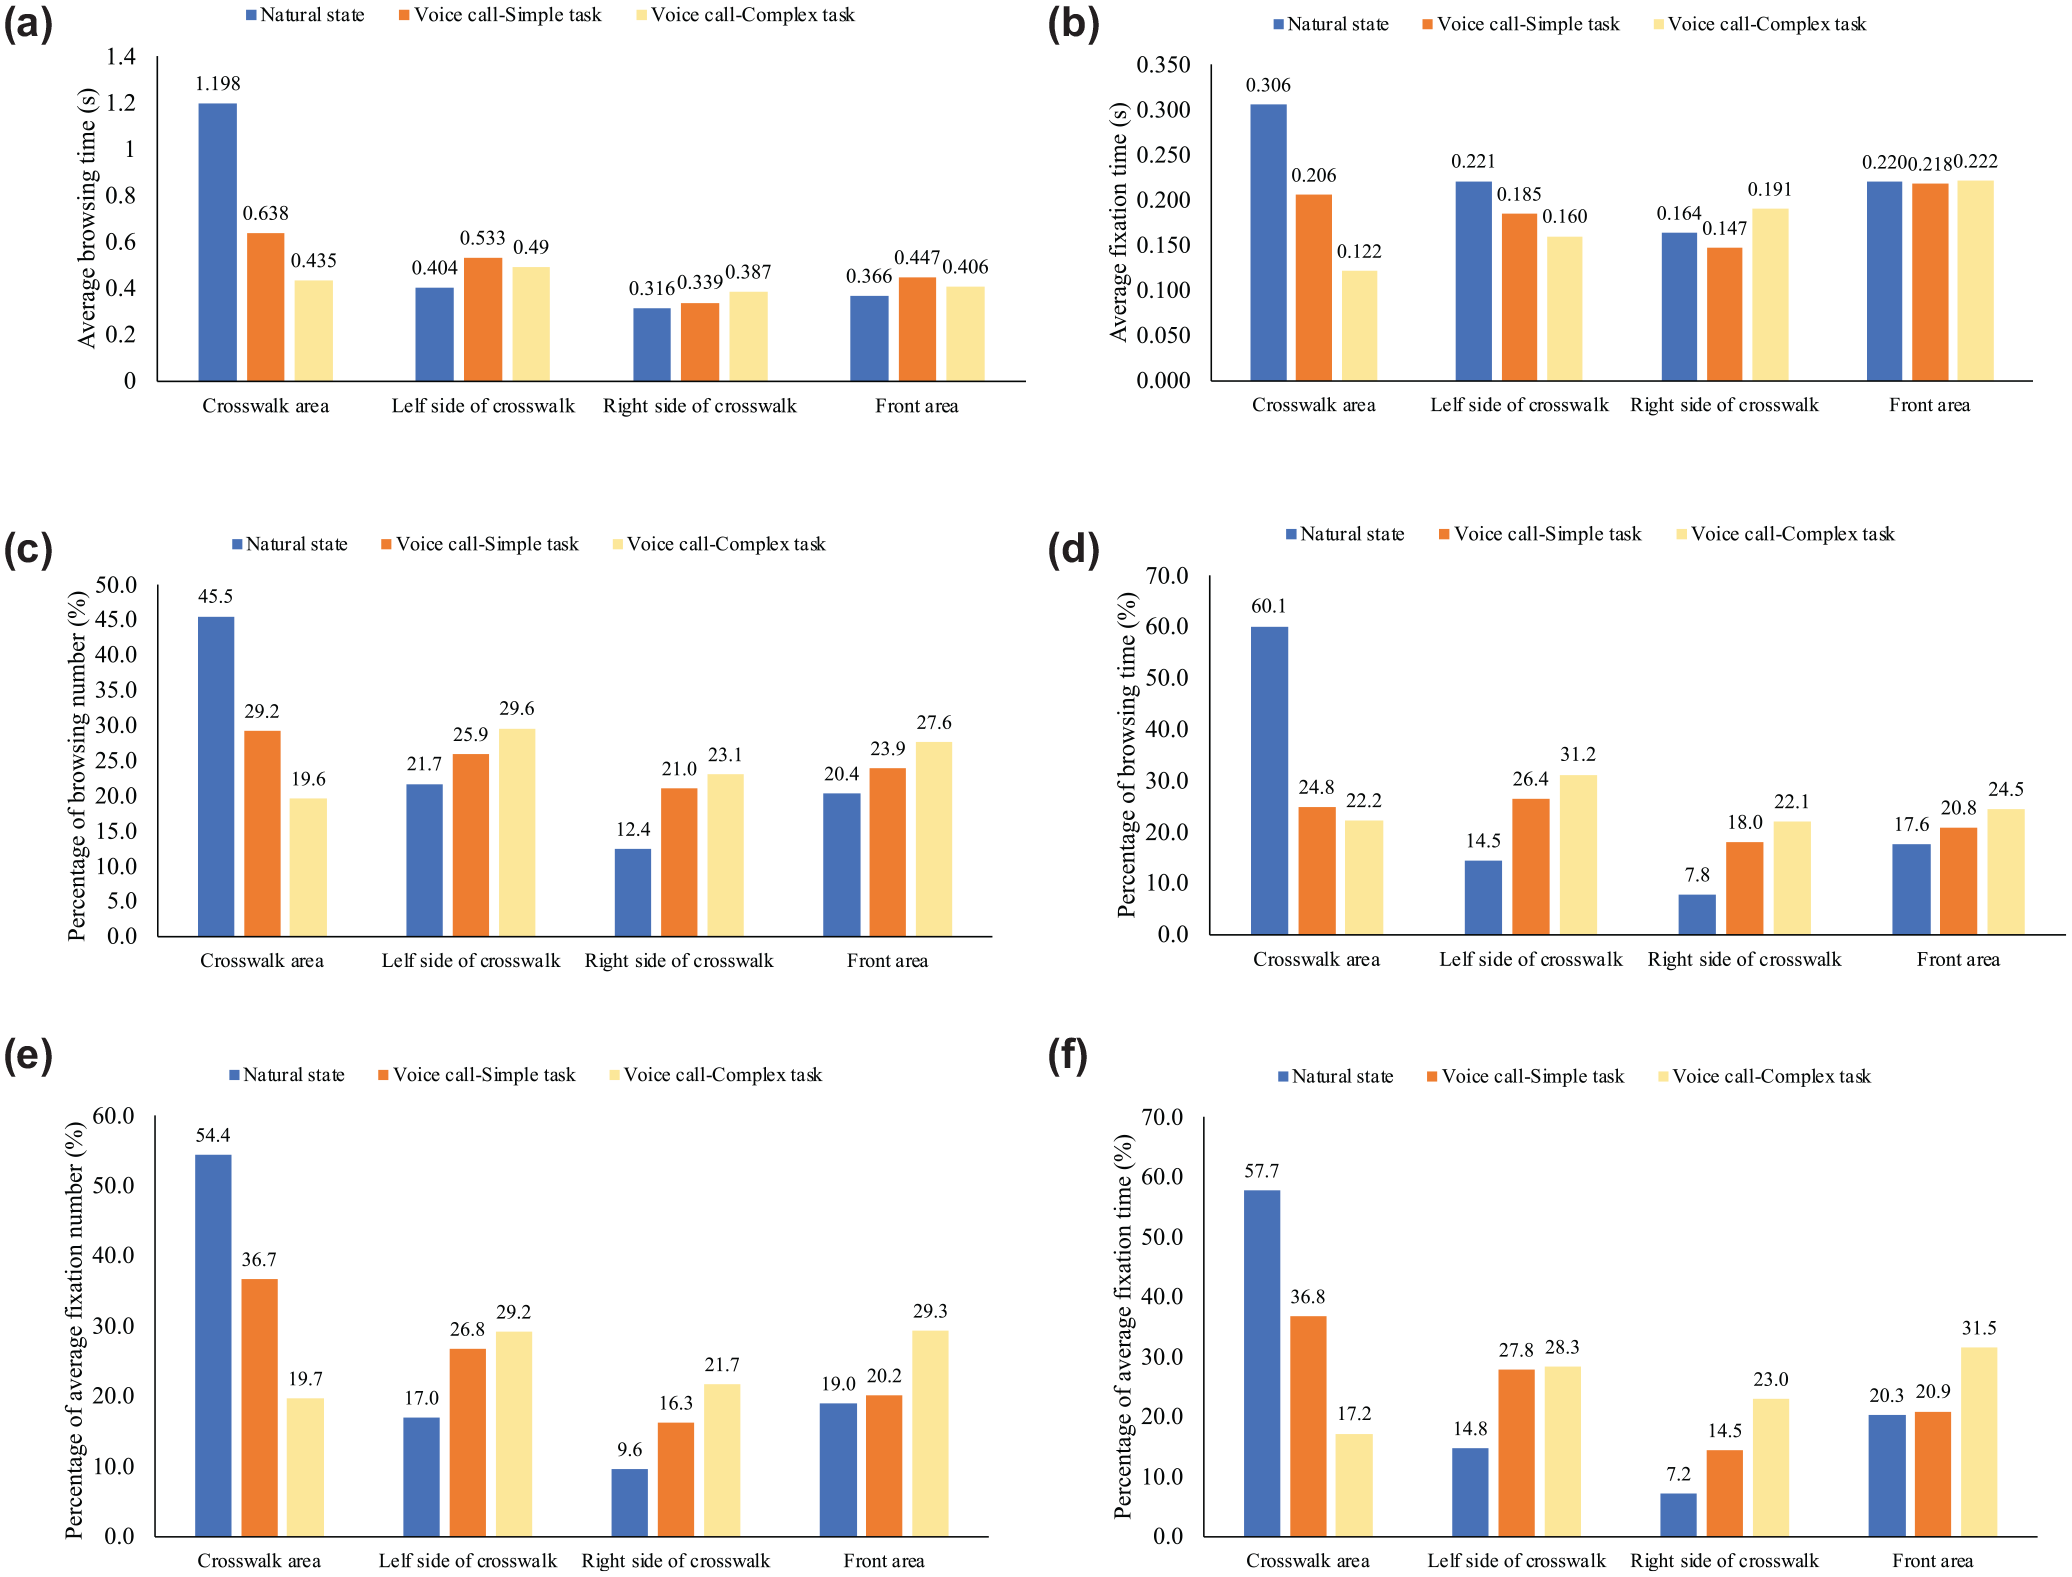
Results of the difference in various indicators of voice call in each area of interest (AOI): (a) average browsing time, (b) average fixation time, (c) percentage number of browsings, (d) percentage browsing time, (e) percentage number of fixations, and (f) percentage fixation time.
For text messaging, the results of the six indicators for each AOI for the three crossing scenarios are shown in Figure 6. Compared with the natural state, mobile phone usage for all six indicators significantly increased when text messaging and when the secondary task difficulty increased. However, for the other four AOI, the indicators decreased, especially in the crosswalk area, and the remaining three indicators showed a downward trend. The increase in the PFT accounted for more than 60%. The increase and decrease of the PFT were related to the changes in the secondary task difficulty.
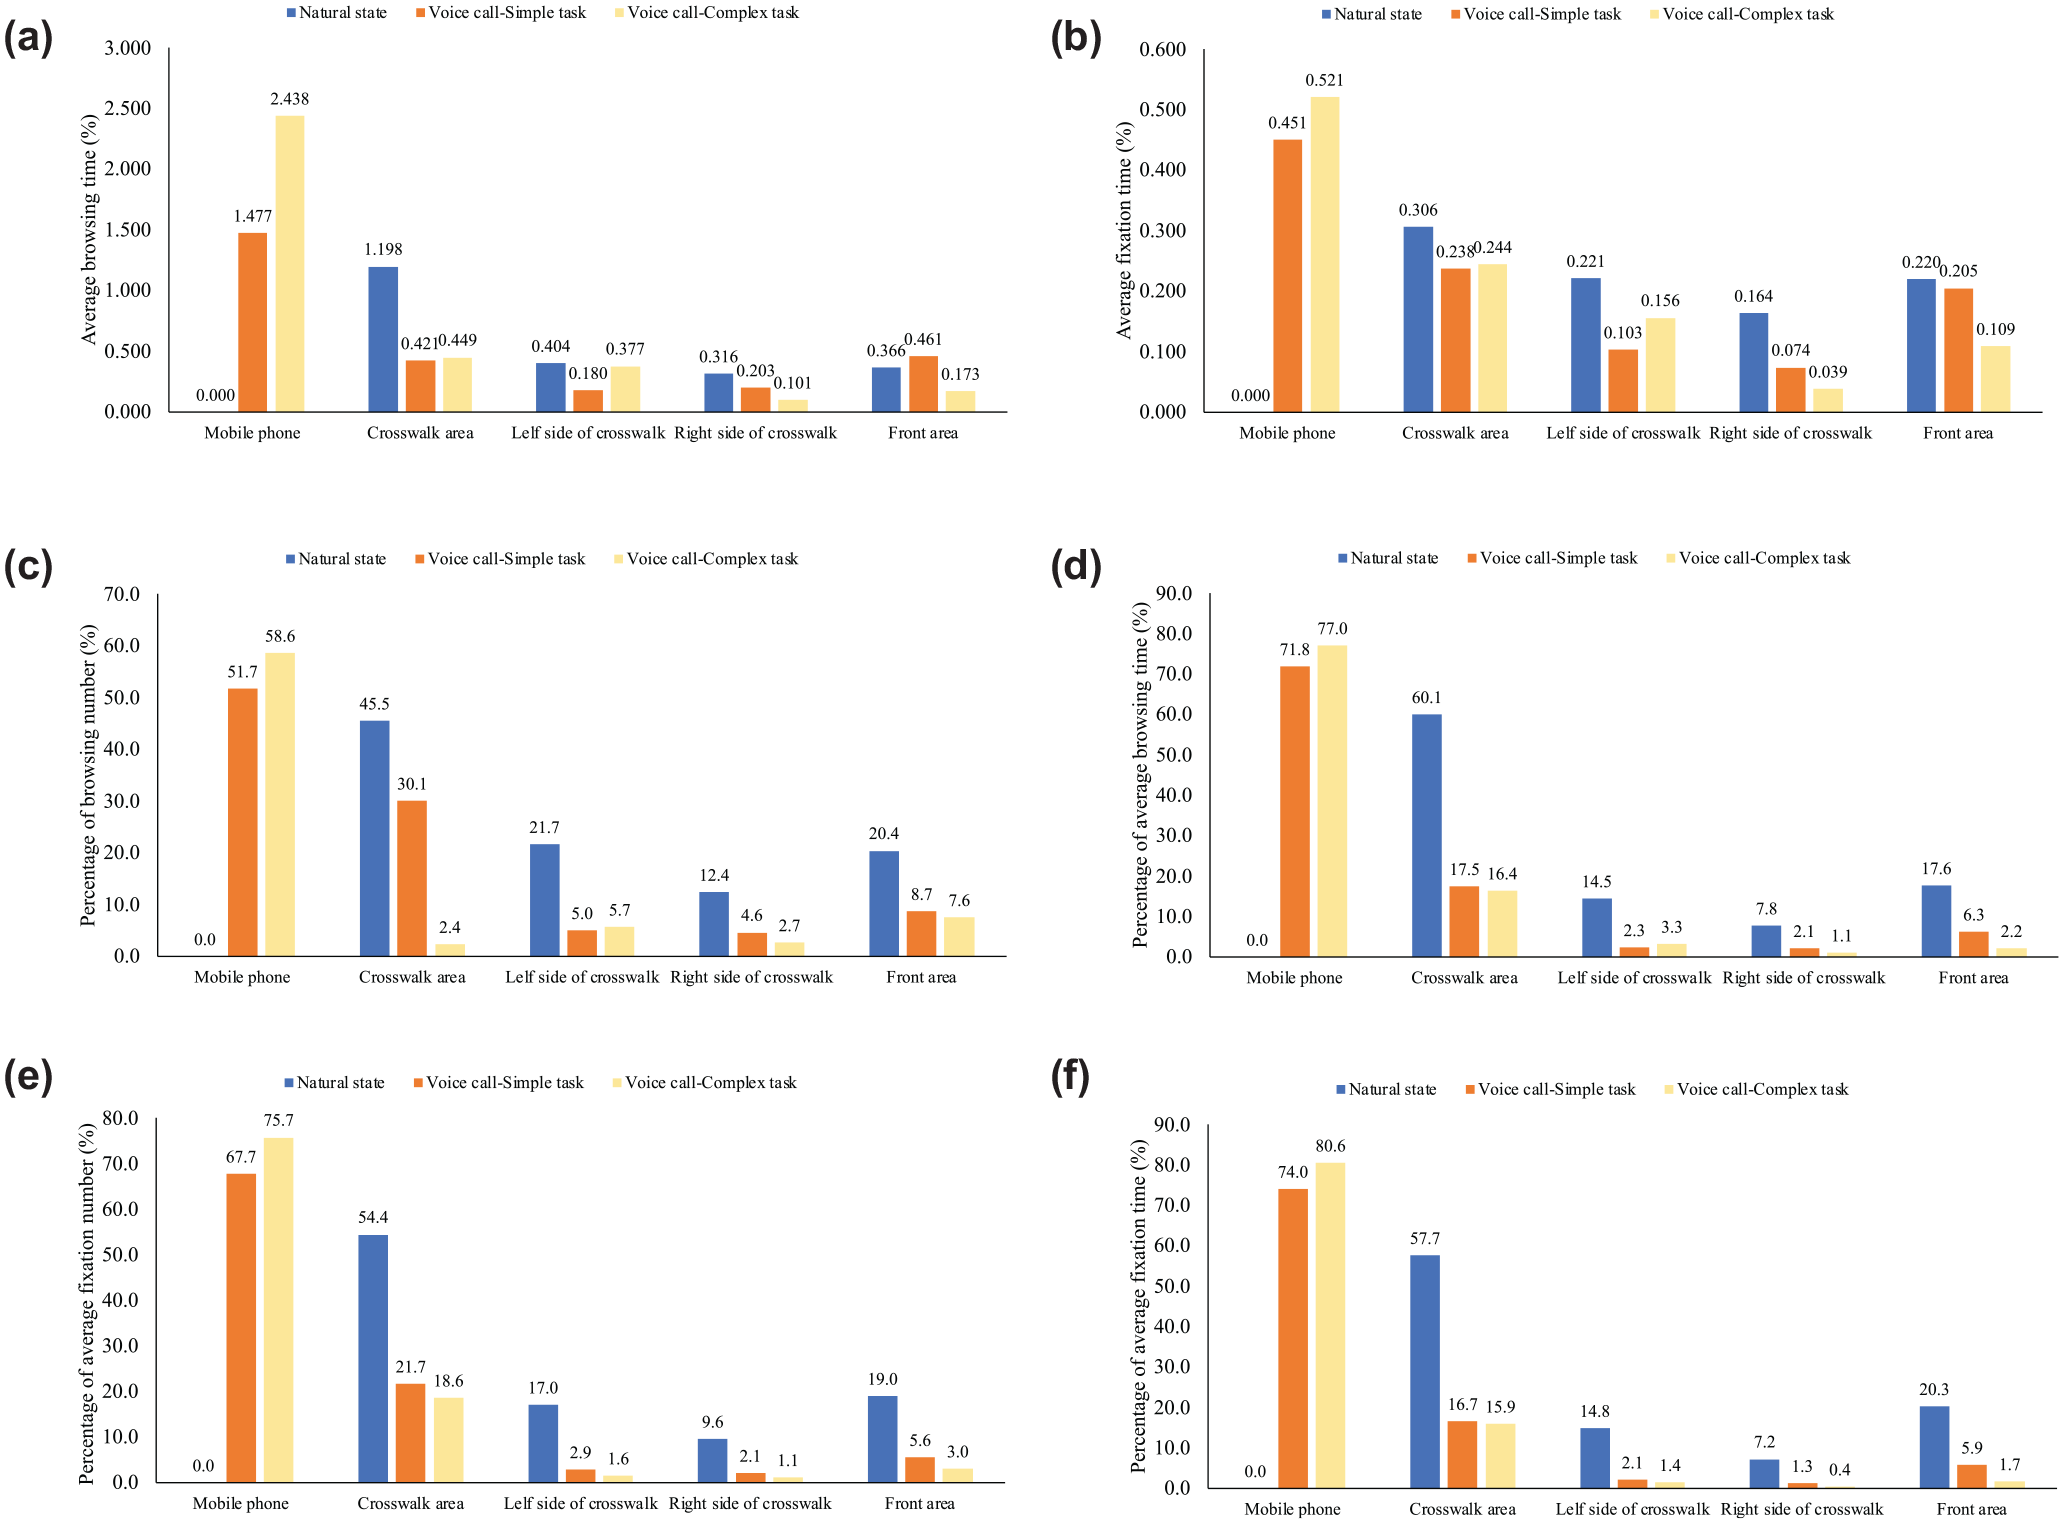
Analysis results of the difference in various indicators of text messaging in each area of interest (AOI): (a) average browsing time, (b) average fixation time, (c) percentage number of browsings, (d) percentage browsing time, (e) percentage number of fixations, and (f) percentage fixation time.
For music listening, the results of the six indicators within each AOI for the three crossing scenarios are shown in Figure 7. Compared with the natural state, all six indicators for the crosswalk area significantly decreased when music listening. However, the indicators generally increased for the other three AOI.
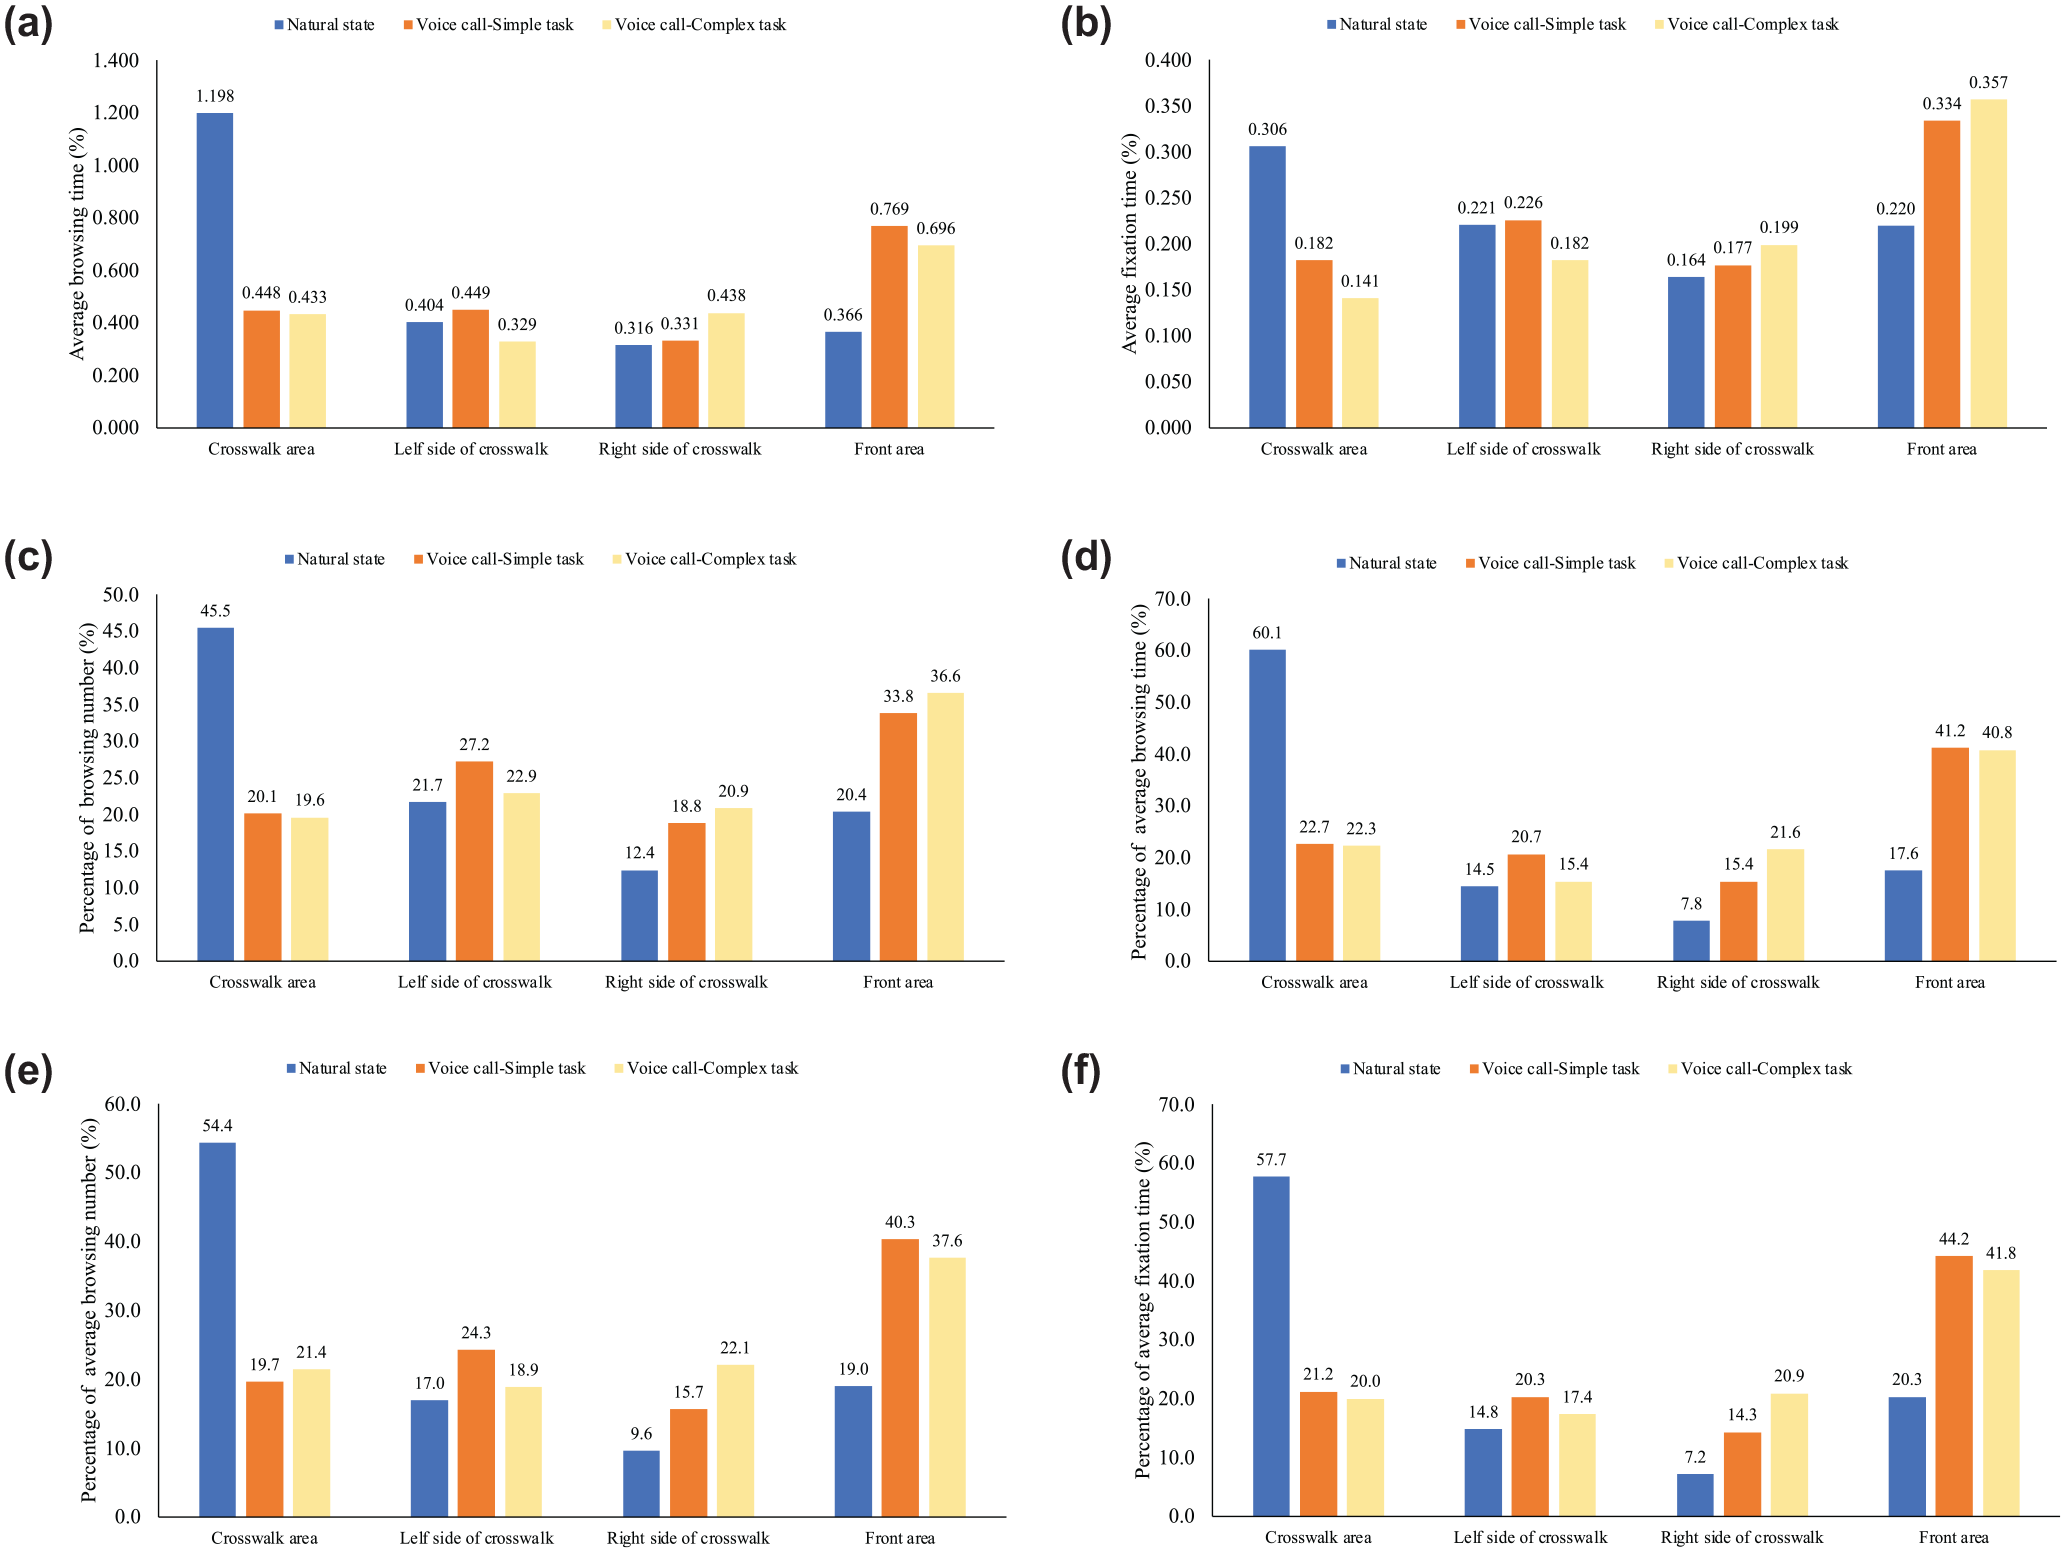
Analysis results of the difference in various indicators of music listening in each area of interest (AOI): (a) average browsing time, (b) average fixation time, (c) percentage number of browsings, (d) percentage browsing time, (e) percentage number of fixations, and (f) percentage fixation time.
With regard to mobile phone usage according to the secondary task difficulty, the effects of voice call and text messaging distraction on the EM characteristics during crossing under STs and CTs were analyzed. The box diagram of saccade frequency (Figure 8) shows that the difference between the two modes of mobile phone usage was consistent for STs and CTs. That is, the saccade frequency when text messaging while crossing was lower than during the voice call. Combined with the results of the S-W test, a paired sample t-test was used to analyze the difference. The results showed that the saccade frequency of text messaging was significantly lower than the voice call under both ST (t = 5.587, p < 0.05) and CT (t = 9.023, p < 0.05) conditions.
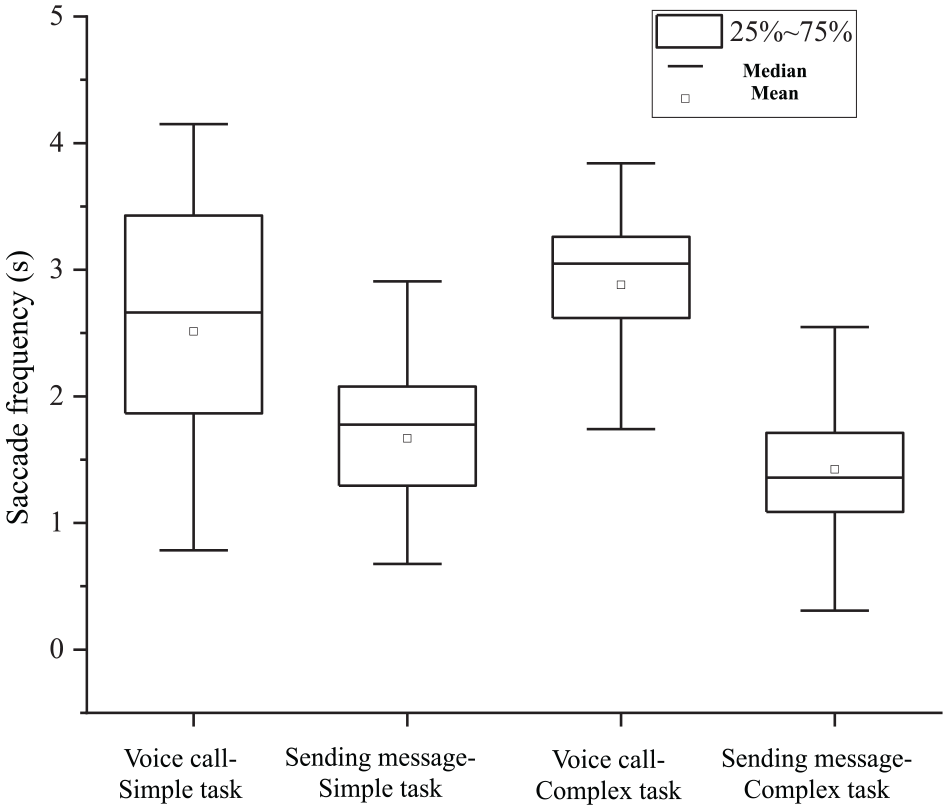
Box diagram for saccade frequency (natural state and mobile phone usage).
Difference Analysis
Figure 9 shows the difference between STs and CTs for ABT. As noted, the differences were generally similar. Compared with voice call, ABT in the mobile phone screen significantly increased whereas it decreased on both crosswalk sides. The trend was similar for AFT. Figure 10 shows that the difference between STs and CTs for PNB in the mobile phone and crosswalk area increased. In contrast, PNB in the other three areas significantly decreased when text messaging. The PBT, PNF, and PFT trends were like that of PNB.
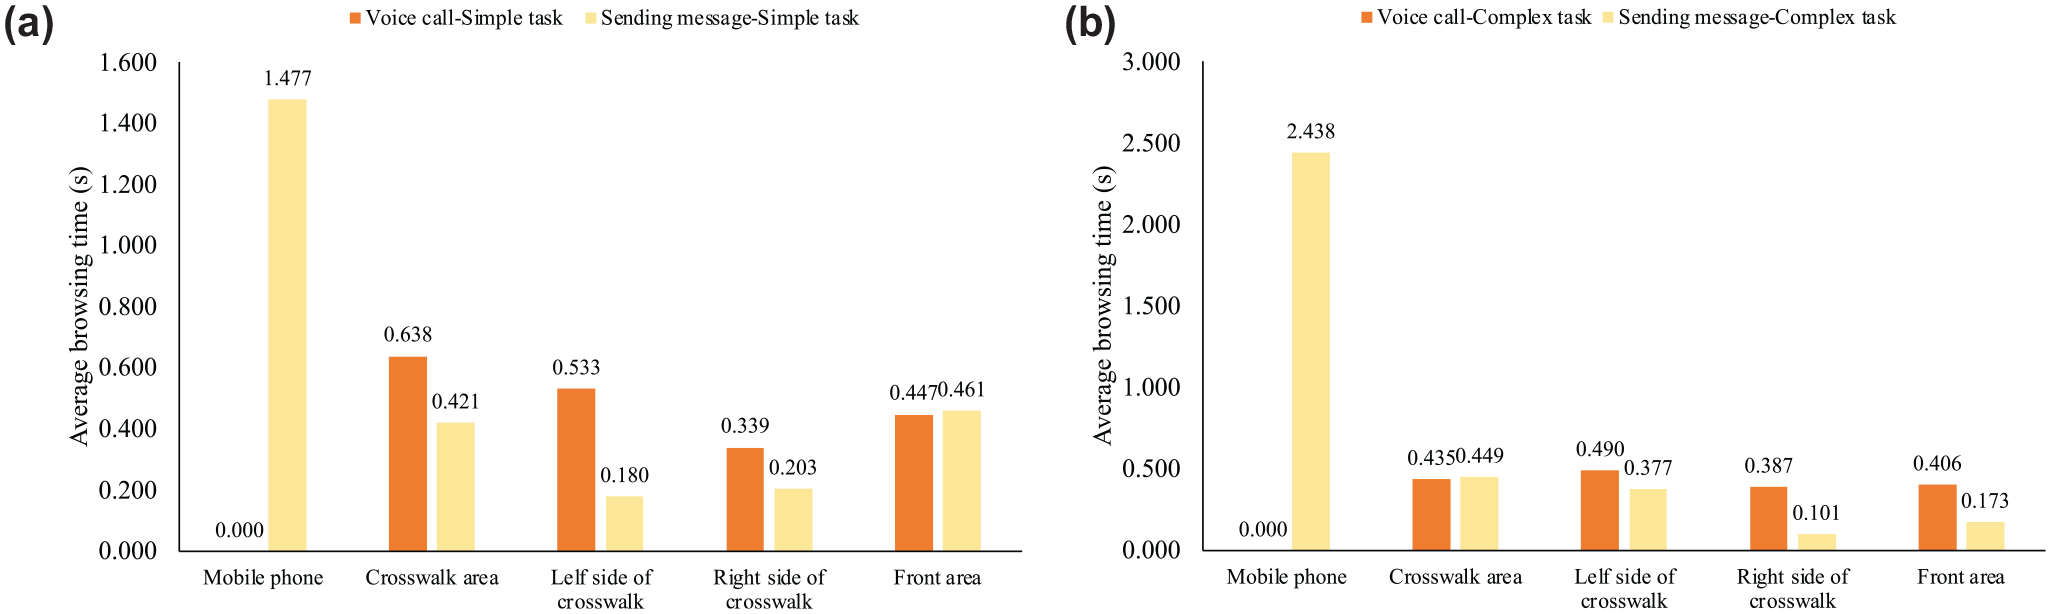
Average browsing time of mobile phone usage: (a) simple task and (b) complex task.
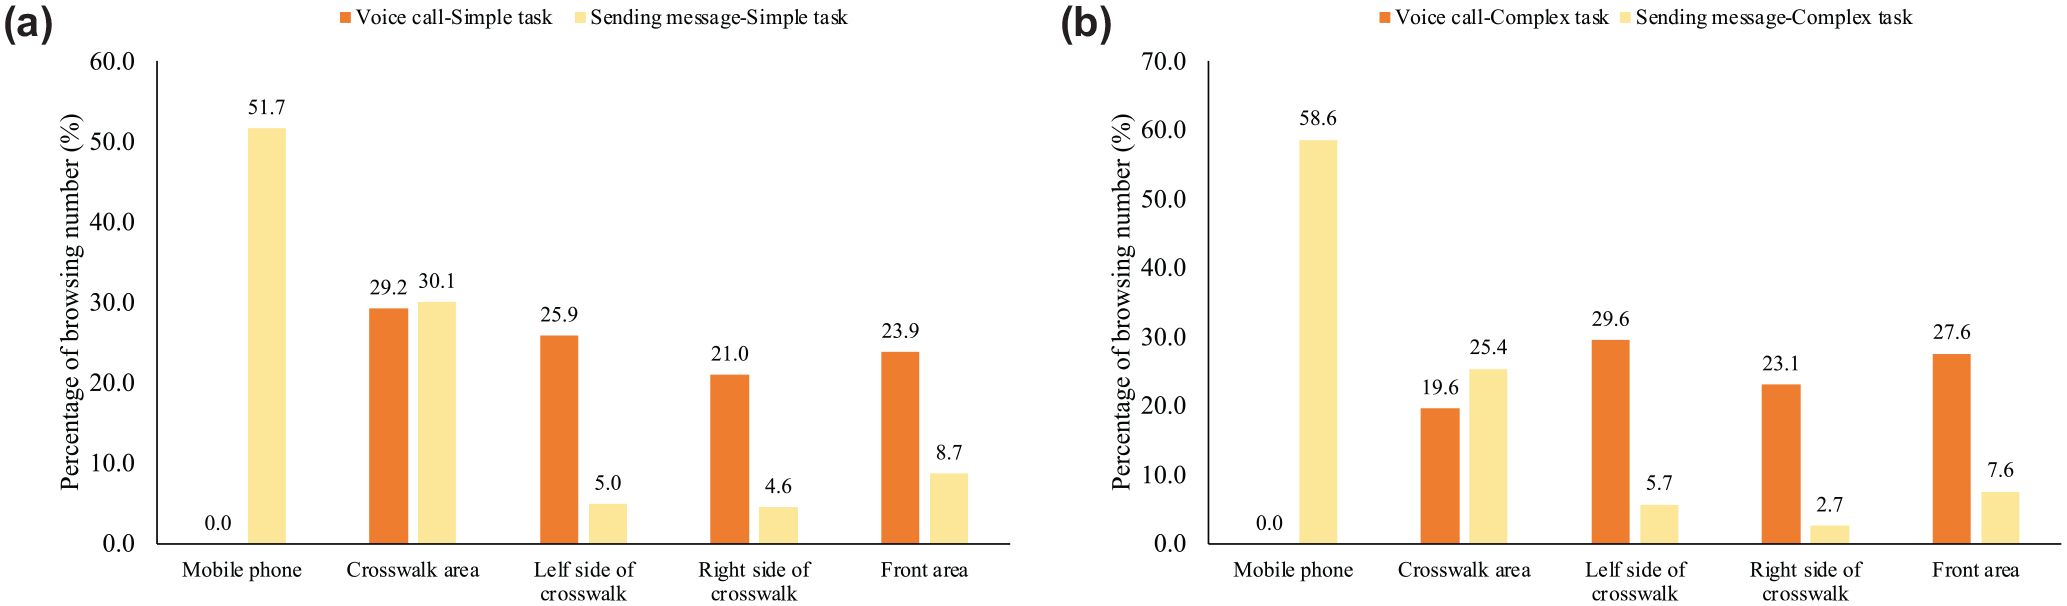
Percentage number of browsings of mobile phone usage: (a) simple task and (b) complex task.
The statistical results for the six indicators in each AOI for voice call, text messaging, and music listening are presented in Tables 5 to 7, respectively. The analysis was based on a one-way repeated measures analysis of variance and the Friedman test. For voice call (Table 5), compared with the natural state crossing, all six indicators decreased significantly (p < 0.05). The secondary task (ST, CT, or both) had a significant effect (p < 0.05). In addition, the difference between task complexity was significant for all indicators (p < 0.05 or p < 0.01), except ABT and BPT.
Results of the Difference in Various Indicators In Each AOI for Voice Call
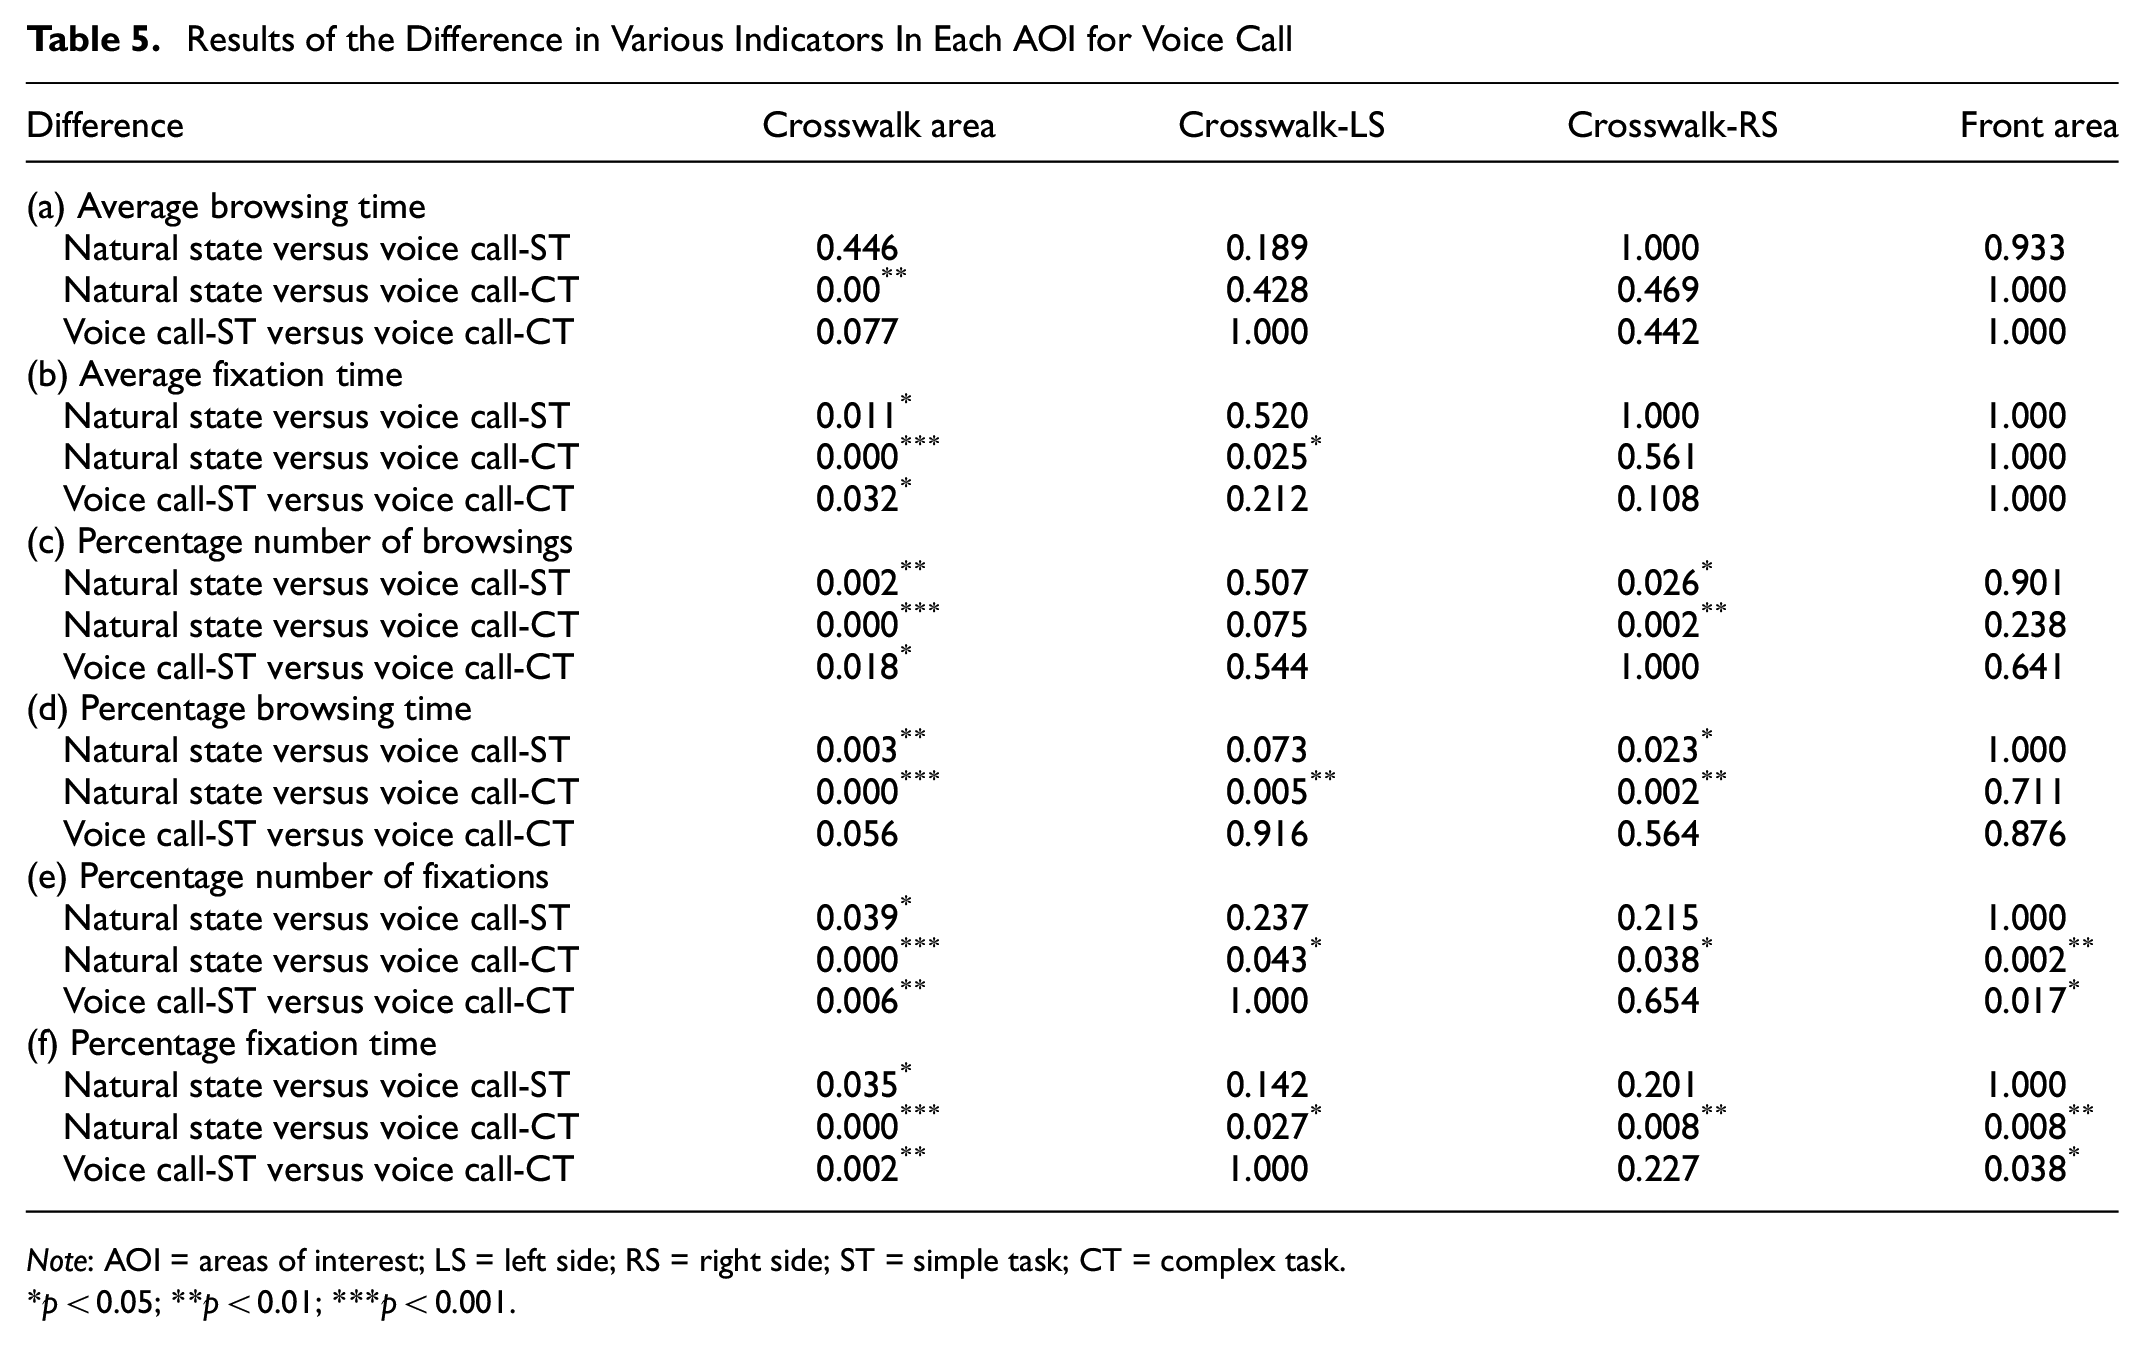
Note: AOI = areas of interest; LS = left side; RS = right side; ST = simple task; CT = complex task.
p < 0.05; **p < 0.01; ***p < 0.001.
Results of the Difference in Various Indicators in each AOI for Text Messaging
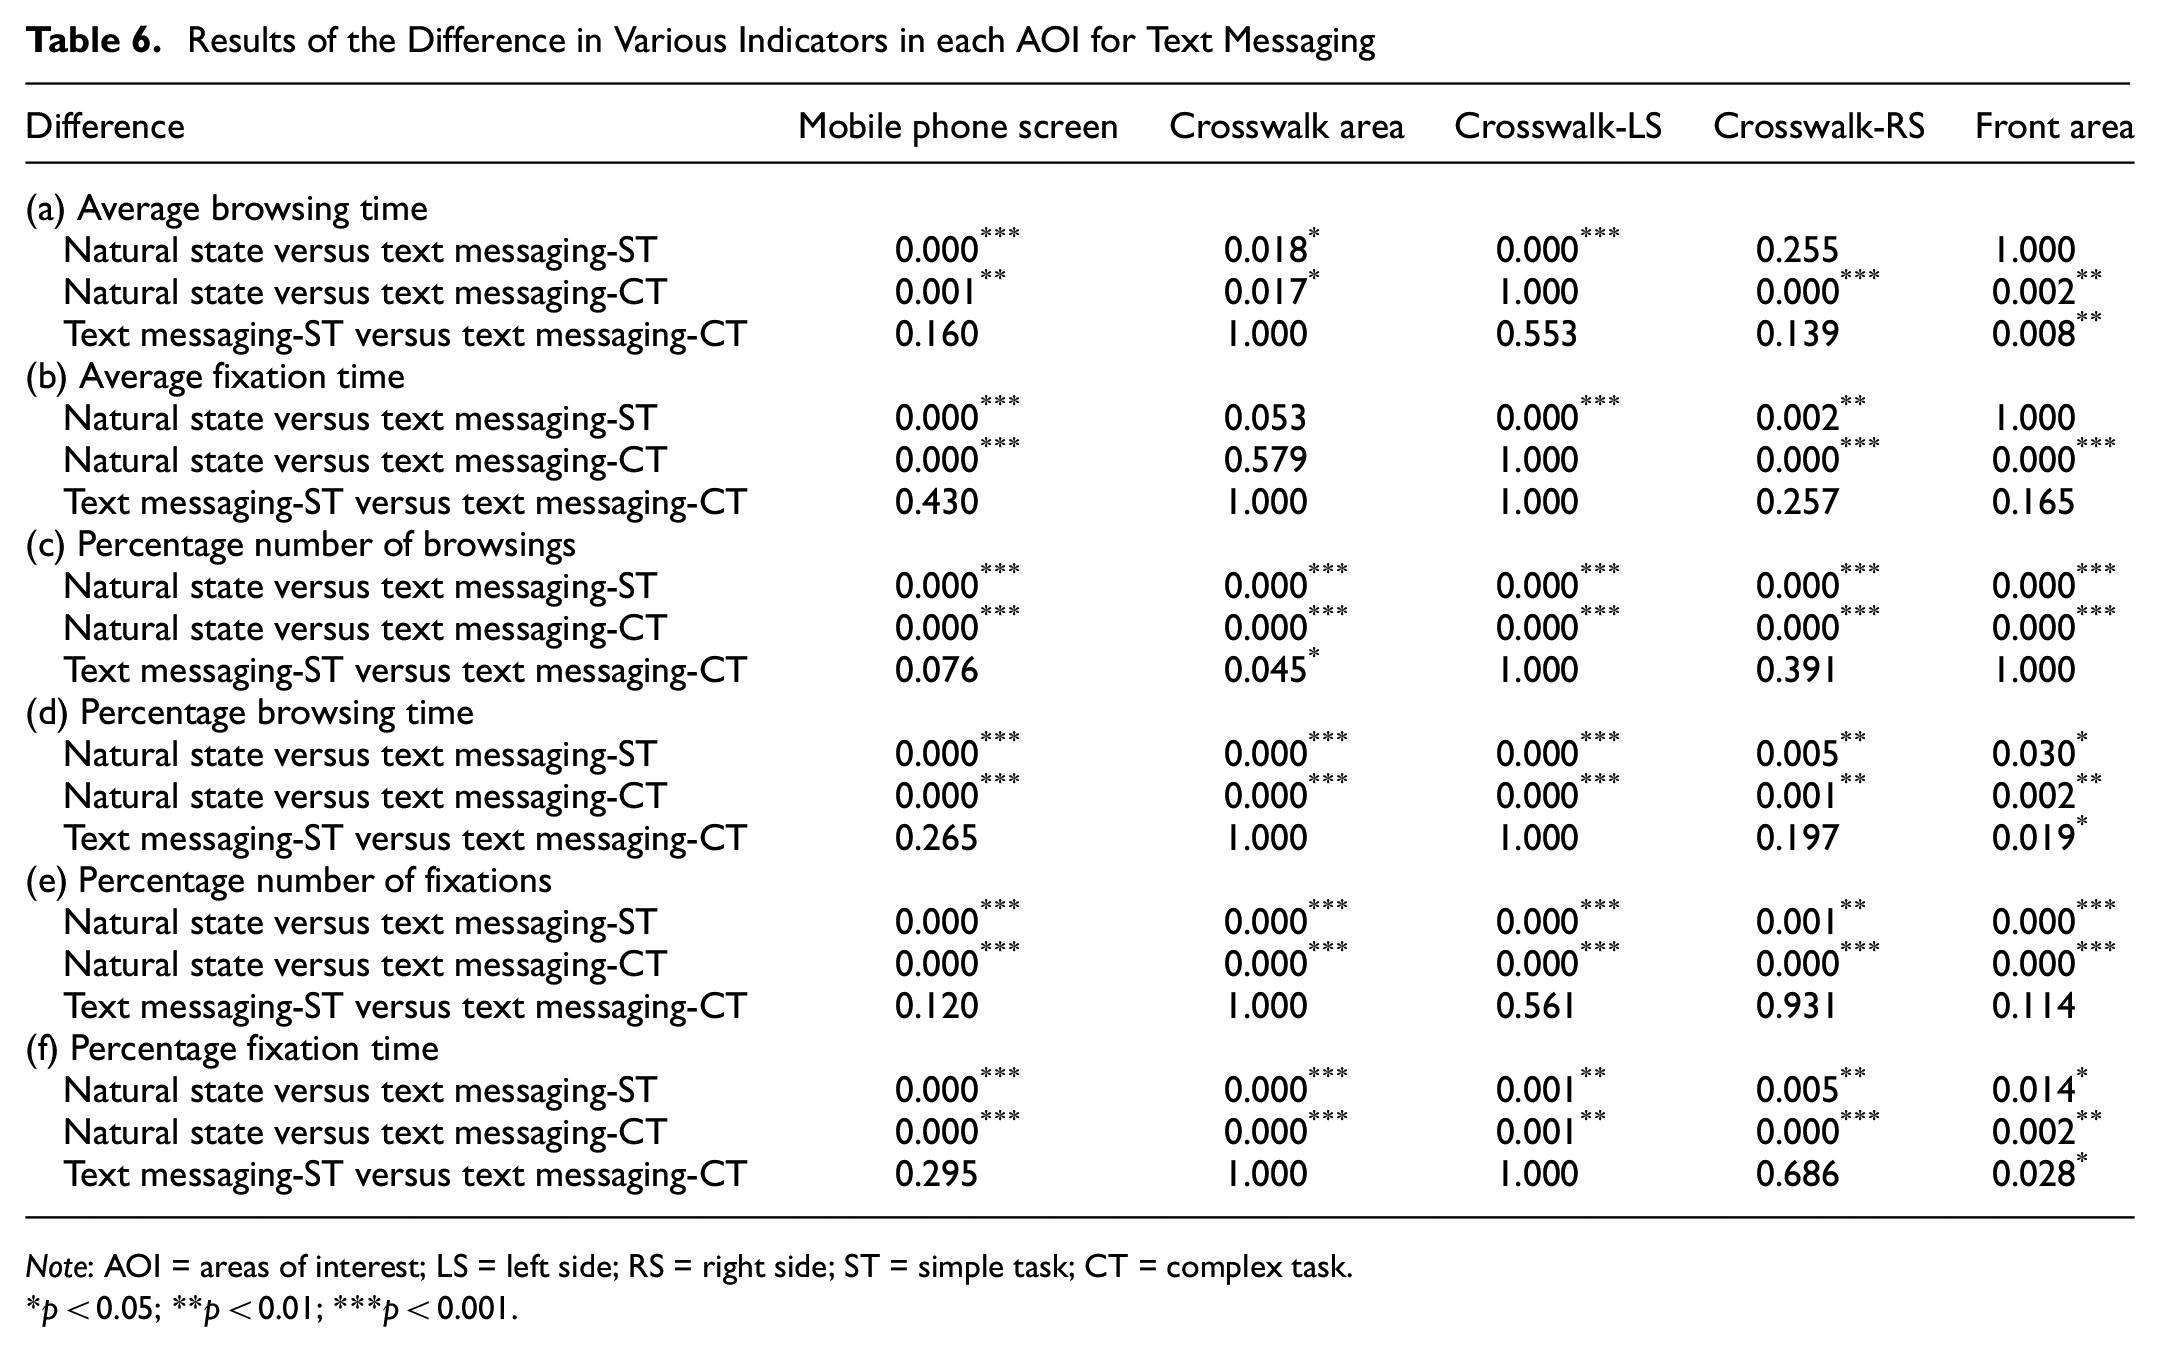
Note: AOI = areas of interest; LS = left side; RS = right side; ST = simple task; CT = complex task.
p < 0.05; **p < 0.01; ***p < 0.001.
Results of the Difference of Various Indicators in each AOI for Music Listening
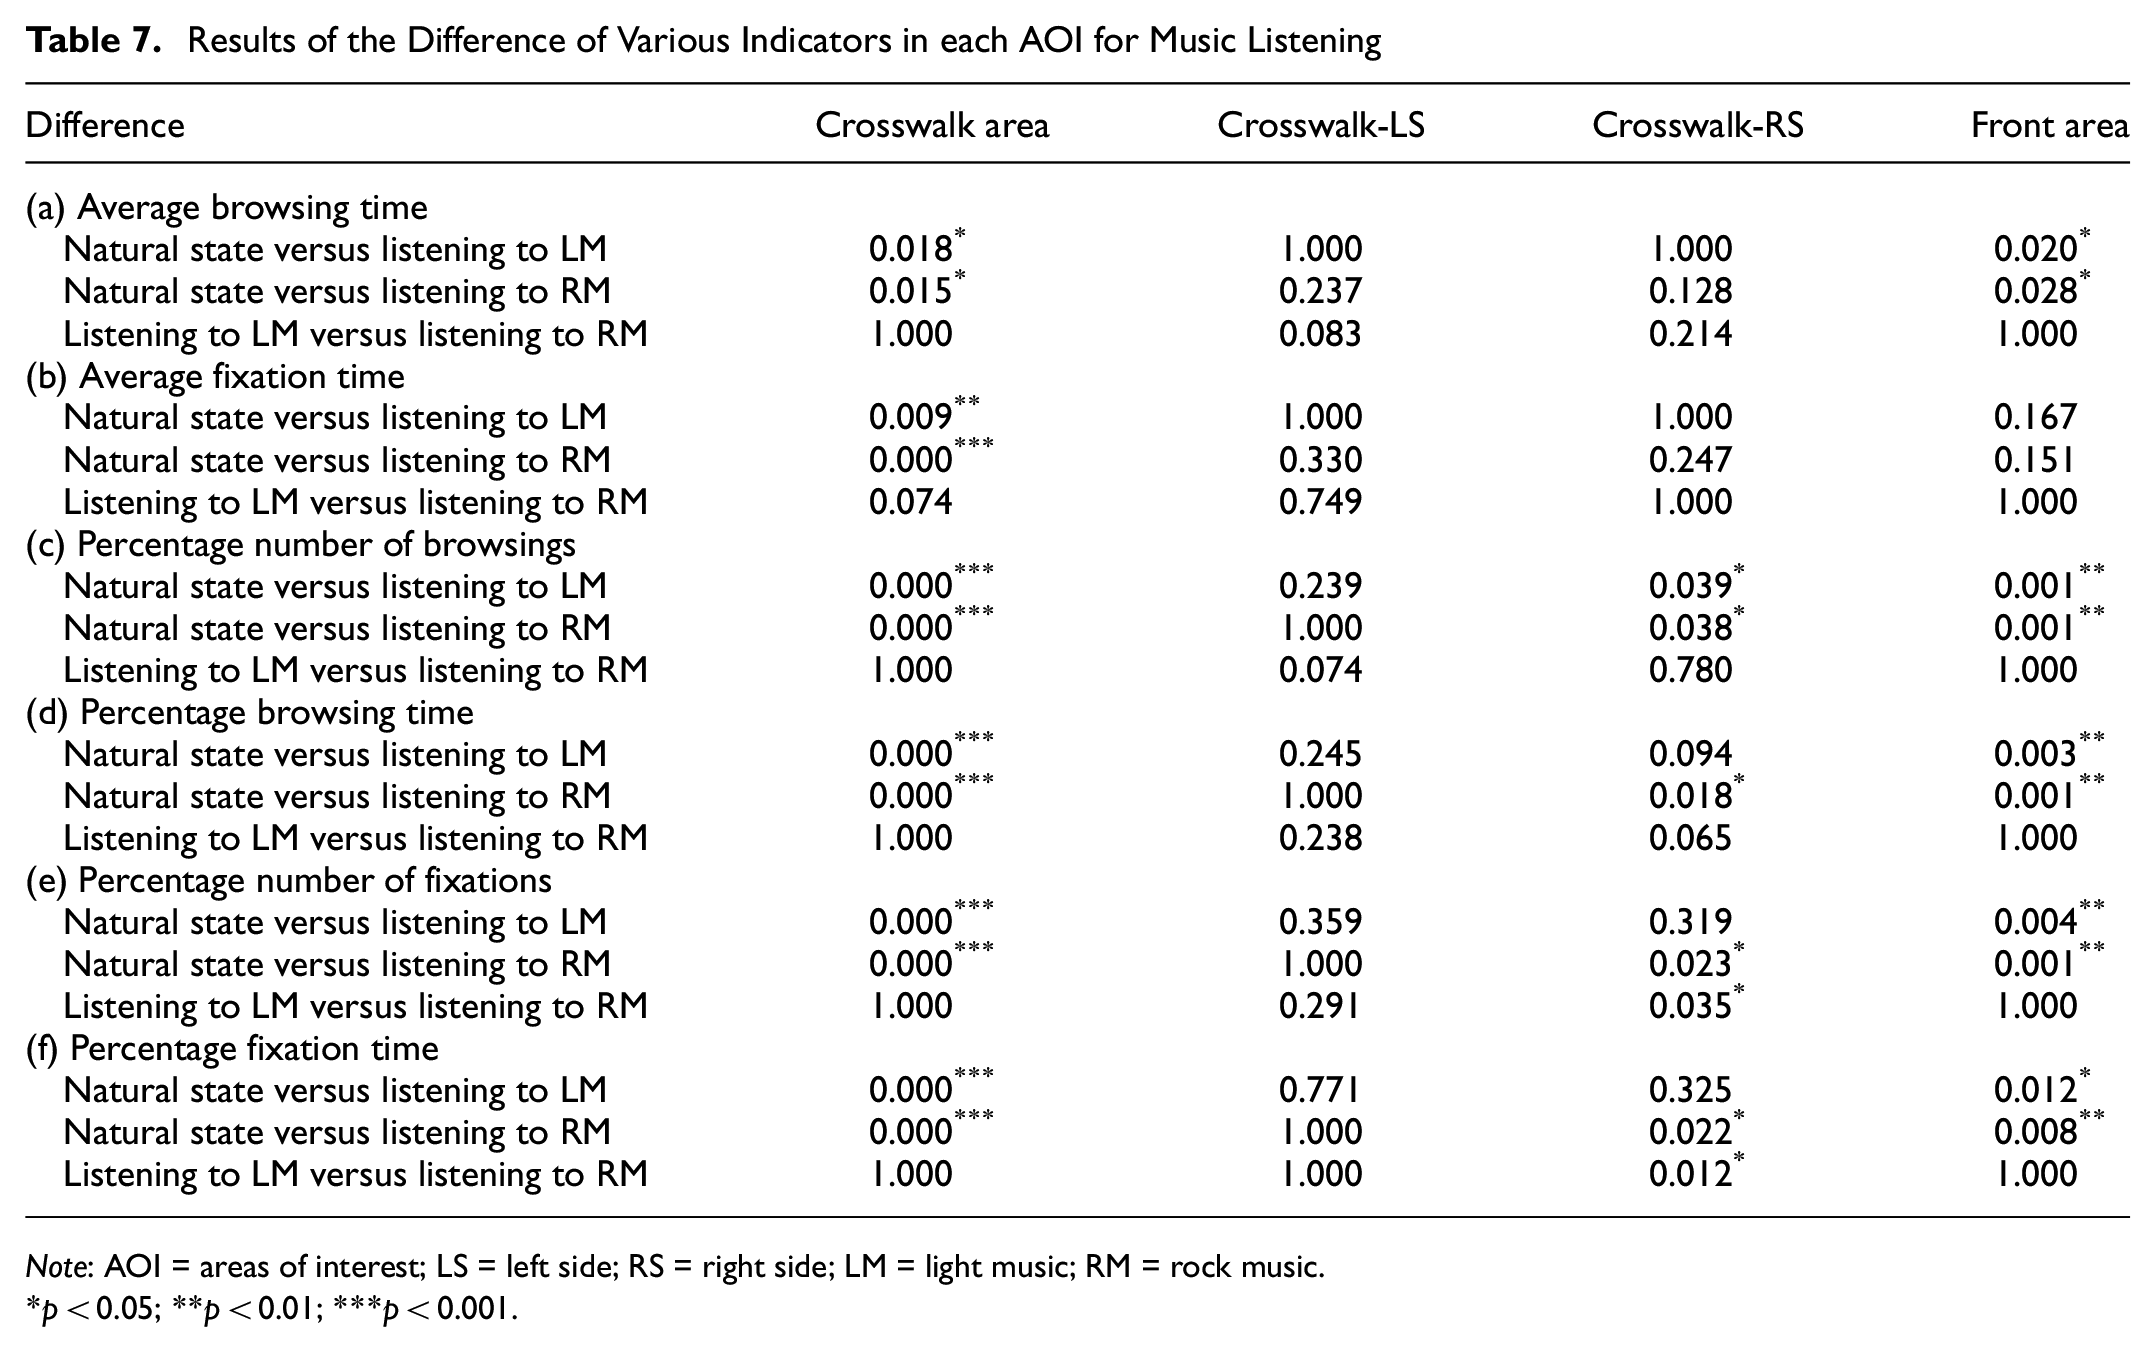
Note: AOI = areas of interest; LS = left side; RS = right side; LM = light music; RM = rock music.
p < 0.05; **p < 0.01; ***p < 0.001.
For text messaging (Table 6) compared with natural state crossing, all six indicators in the mobile phone screen increased significantly (p < 0.05). The secondary task (both ST and CT) had a significant effect (most p < 0.05). However, the difference between task complexity was nonsignificant for all indicators.
For music listening, (Table 7) compared with natural state crossing, almost all indicators in the crosswalk and front areas increased significantly (p < 0.05). However, the difference between task complexity was nonsignificant for all indicators.
The results of mobile phone usage (voice call versus text messaging) are shown in Table 8. As noted, compared with voice call, almost all six indicators in all AOI showed a significant difference when text messaging during the crossing (p < 0.05).
Results of Mobile Phone Usage (Voice Call Versus Text Messaging)
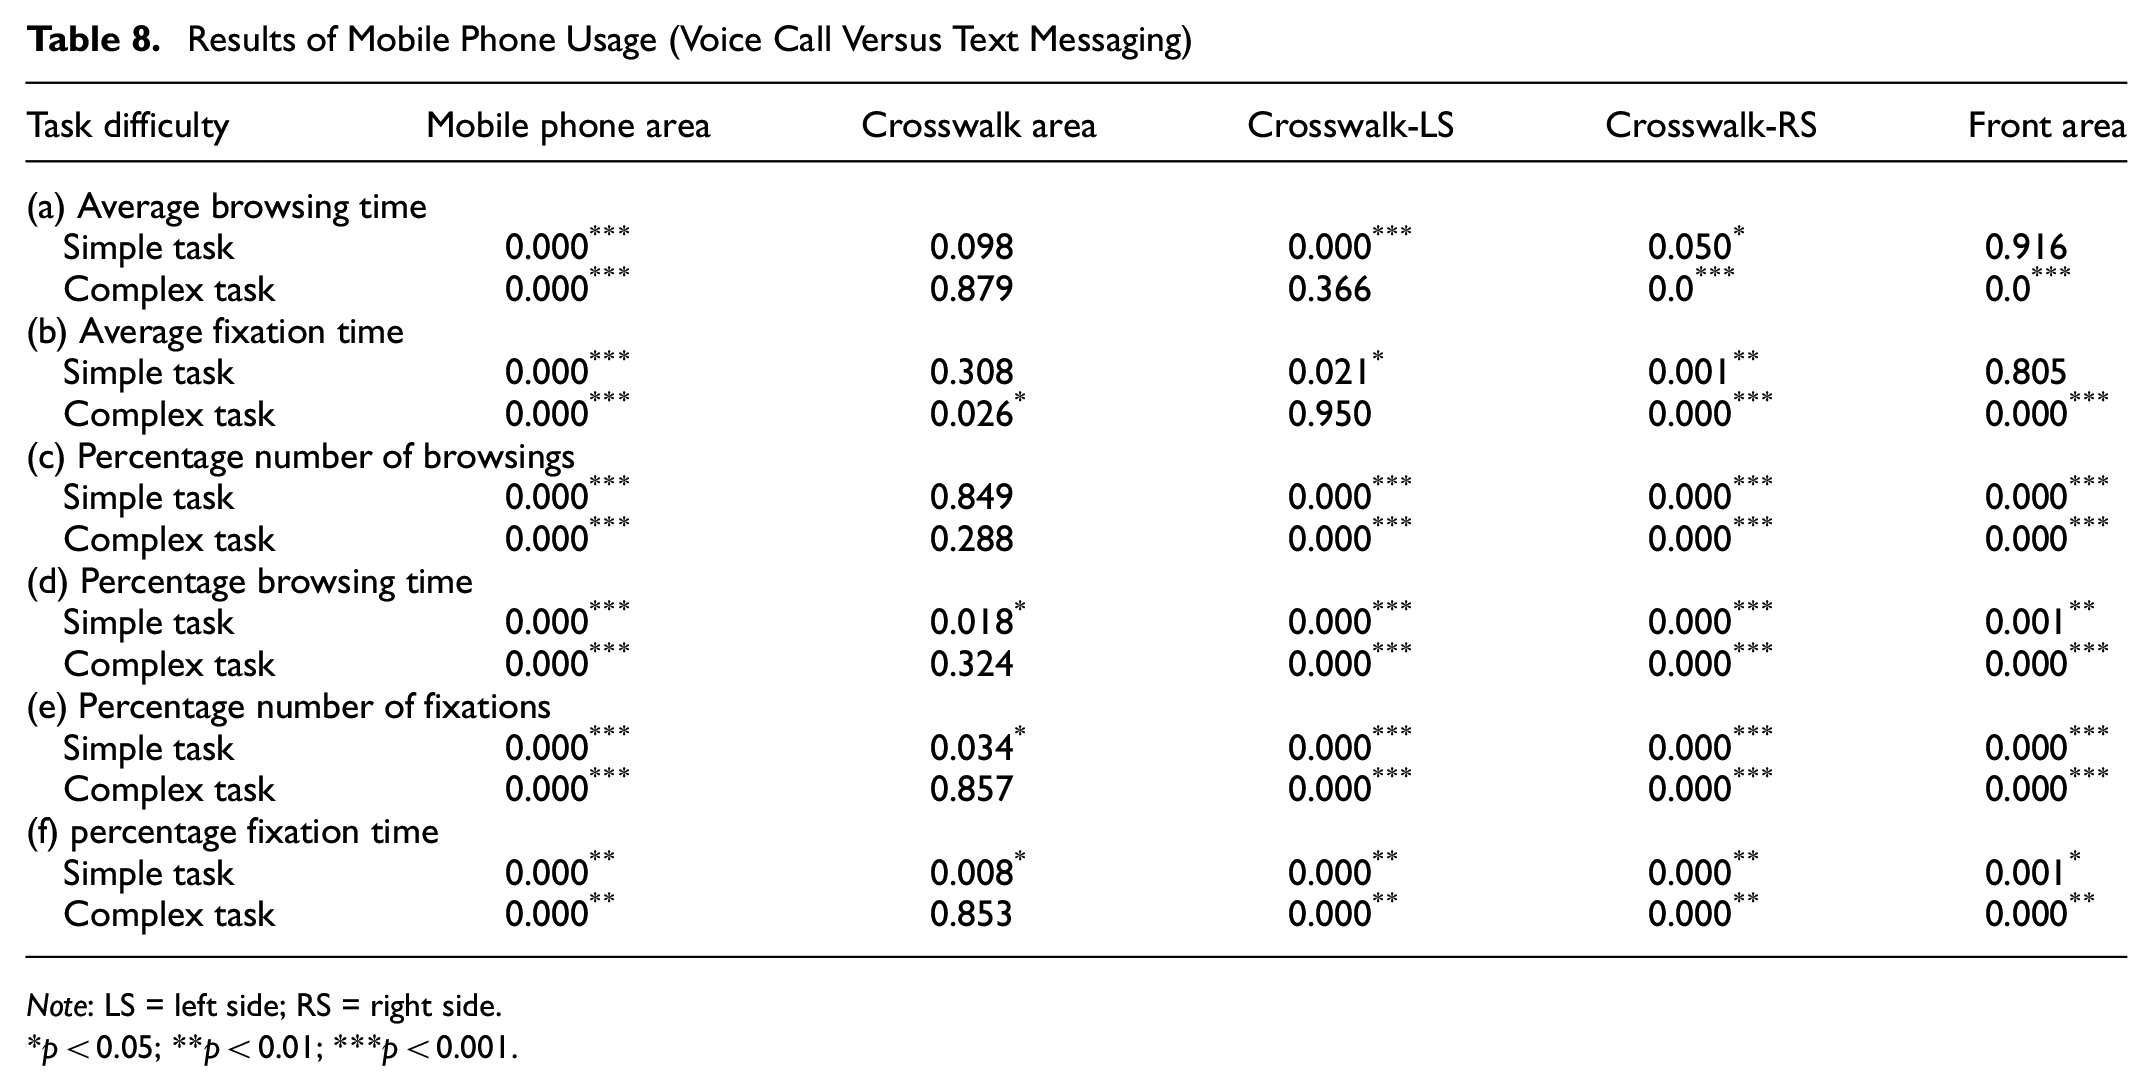
Note: LS = left side; RS = right side.
p < 0.05; **p < 0.01; ***p < 0.001.
Discussion
Interpretation
The voice call results showed that when crossing the street naturally, pedestrians primarily paid attention to the crosswalk area: the degree of attention was high, and ABT and AFT in this area were long. Following cognitive distraction caused by voice call, the attention distribution changed to some extent, decreasing on the crosswalk area and increasing to the areas either side. The main reasons for this difference included cognitive distraction, decreased concentration, increased saccade frequency, and decreased fixation frequency and fixation duration in the crosswalk area and its LS. The negative impact of such distracted behavior could be reduced by increasing observations of the traffic on both sides of the crosswalk. The change in PNB can be regarded as a pedestrian compensation strategy caused by the secondary task distraction. While text messaging on the crosswalk, pedestrians’ gaze frequency and duration of each gaze can increase, primarily directed toward the phone screen. Consequently, the frequency and rate of scanning decreased, increasing the possibility of traffic conflicts with other road users.
The difficulty of information processing increased for CTs, requiring higher cognitive resources and longer processing time. As a result, pedestrians’ overall cognitive load increased, manifested by longer gaze durations on the mobile phone screen. When distracted while crossing the street, pedestrians primarily focused on their screens. In situations of limited attentional resources, this divided attention significantly reduced the number of observations of the traffic environment. The percentage of gaze and time spent on the areas on each side of the crosswalk may even be less than 3%, thereby increasing potential traffic safety risks. While listening to music on the crosswalk, pedestrians’ focus on the crosswalk area also decreased, resulting in fewer gazes allocated to that area. On the other hand, attention toward the RS and the front area increased, leading to increased gazes. This change in pedestrians’ attention allocation may be a compensatory strategy for the lack of auditory information. The text messaging involved both visual and operational distractions.
The results were consistent with the existing literature ( 24 , 25 ). In the field of driving behavior research, Hu et al. ( 26 ) and Qiao et al. ( 27 ) found that as the complexity of the road environment increases, the challenge involved in information processing increases, which increases the driver’s psychological load, causing them to pay more attention to the surrounding environment, and increases the saccade frequency. In a study on distracted driving behavior related to mobile phone usage, Wang pointed found that drivers’ saccade frequency significantly increased during hands-free voice calls on mobiles compared with those not having to engage in secondary tasks ( 28 ).
For text messaging, the focus area changed from the crosswalk to the mobile phone, the browsing time on the mobile phone screen accounted for more than 70%, and the time spent observing the traffic environment significantly decreased. The results showed that, compared with the natural state of street crossing, mobile phone devices occupied several visual resources during text messaging, and pedestrians spent a long time staring at the phone screen, decreasing the attention resources available for observing the traffic environment. This resulted in a significant decrease in ABT in the crosswalks, affecting the timely identification of potential safety risks. As a result, the possibility of conflicts between pedestrians and other road users increased. Sending messages occupied a considerable proportion of pedestrians’ visual resources, causing pedestrians to shift their attention from the traffic environment to their devices, significantly decreasing observation time on the traffic environment. AFT under CTs was further increased on the mobile phone screen compared with STs. Although this difference was nonsignificant, the trend was consistent with theoretical expectations and existing literature ( 16 , 29 , 30 ).
The results of music listening indicated that it significantly affected the attention allocation of pedestrians. Compared with the natural state of crossing, when music listening, pedestrians paid less attention to the crosswalk area, decreasing the number of looks to this area and increasing the number of looks to the crosswalk-RS and front areas. This may be because when wearing headphones (especially noise-canceling headphones), pedestrians cannot effectively acquire auditory cues (e.g., vehicles honking). Such auditory information is fundamental to pedestrians’ decision-making and safety. Therefore, pedestrians might make up for the lack of auditory information by increasing the number of browsings of traffic conditions on both crosswalk sides. However, regardless of the rhythm of the music track, ABT on neither crosswalk side was significantly affected by this secondary task.
The results showed that mobile phone use had a significant impact on pedestrians‘ saccade frequency, mainly because voice calls do not involve visual and operational distraction, whereas during message sending, pedestrians need to look at the phone screen frequently and complete text input operations, increasing the number of gaze behaviors. The duration of a single gaze was longer, while the number of saccade behaviors was relatively decreased. Therefore, the saccade frequency was relatively low when text messaging.
Limitations
This study has some limitations, and results should therefore be interpreted in light of these. First, the study was conducted at a non-signal-controlled intersection on a university campus for safety. Second, the study focused on three typical types of pedestrian mobile phone usage. Third, the study population was university students: future research should recruit to capture a more representative population sample. Future studies might explore pedestrians’ EM behavior at signalized and nonsignalized intersections, address other uses, such as reading text messages and making video calls, and consider a more diverse participant age distribution.
Conclusions
The use of mobile phones while distracted has a certain impact on pedestrians’ EM characteristics, and this impact is related to the specific way in which the phone is used and the secondary task (task difficulty/music rhythm). Among them, the impact of text messaging was greatest, followed by voice call and music listening. When using a mobile phone to text while crossing the street, pedestrians’ attention is mainly focused on the phone screen, and most of their visual resources are occupied by the secondary task. As a result, the potential traffic safety risks pedestrians face while crossing the street increase.
With regard to the secondary task types, the saccade for text messaging during crossing decreased compared with voice call. This was because of the significant increase in the number of fixations on the mobile phone screen, resulting in increased ABT and AFT and decreased attention on both crosswalk sides and the front area. The distribution of pedestrian attention on the mobile phone screen changed significantly: PNB, ABT, PNF, and AFT increased. At the same time, they significantly decreased on both sides of the crosswalk and the front area. The above results indicated that, for the same secondary task, mobile phone usage pattern significantly affected pedestrians’ EM characteristics and attention allocation. Thus, text messaging had the most significant impact on pedestrian EM characteristics, followed by voice call and music listening. This study’s findings should help to better understand the pedestrians’ visual characteristics under mobile phone distraction and the effect and degree of mobile phone distraction on pedestrian EM characteristics.
Concerning mobile phone usage during street crossing, some effective countermeasures should be implemented, such as (a) establishing designated pedestrian safe zones where pedestrians can stop and use their phones without obstructing traffic. These zones would allow pedestrians to engage with their devices without obstructing pathways or risking accidents from inattention; (b) enhancing legal regulations and promoting penalties for illegal crossing ( 29 ), which should be applied swiftly and consistently after the infringement; and (c) implementing technologies that can detect pedestrians who are using their phones during the crossing, including warning systems to alert pedestrians to potential hazards, notify drivers of the presence of distracted pedestrians, or both.
Footnotes
Acknowledgements
The authors thank the two anonymous reviewers for their thorough and helpful comments.
Author Contributions
The authors confirm contribution to the paper as follows: study conception and design: M. Hou, C. Wang; data collection: M. Hou; analysis and interpretation of results: M. Hou, C. Wang; draft manuscript preparation: S. Easa, J. Cheng. All authors reviewed the results and approved the final version of the manuscript.
Declaration of Conflicting Interests
The authors declared no potential conflicts of interest with respect to the research, authorship, and/or publication of this article.
Funding
The authors disclosed receipt of the following financial support for the research, authorship, and/or publication of this article: This study was funded by the National Natural Science Foundation of China (grant nos. 51768063 and 51868068).