
Abstract
With the rapid growth of the e-commerce market, how to cater to the demand for last-mile deliveries to households is an important challenge for both policymakers and practitioners. Therefore, the incorporation of e-commerce-driven delivery demand into a freight transportation analysis is required. In this research, we conduct an internet-based survey in Japan to collect data on past in-person and online shopping behaviors and develop a household-based e-commerce demand model that simultaneously estimates e-commerce delivery demand in regard to the total value and order size (or order frequency) using a framework proposed by Sakai et al. Using the estimated model parameters, we conduct a sensitivity analysis using the model to understand the impact of changes in delivery service on e-commerce delivery demand. Focusing on groceries and household goods, we successfully demonstrate the ability of the model framework and obtain insights into the impact of delivery service characteristics on households’ reliance on e-commerce using the model developed based on real-world data.
Keywords
In the last few decades, the e-commerce market has been growing rapidly across countries around the world. The Covid-19 pandemic, which began in 2019, further accelerated the penetration of online shopping. The lockdown during the pandemic encouraged e-commerce usage by households that had never used e-commerce before the pandemic ( 1 ). The market share of e-commerce in retail sector reached 14.9 % in the U.S. (for the fourth quarter of 2023) and 27.2% in China in 2022 ( 2 , 3 ). Although the e-commerce market share in Japan is lower than in these countries, its growth is steady. According to the Ministry of Economy, Trade and Industry, the e-commerce market in Japan was worth 20.7 trillion Japanese yen (JPY) in 2021, increased by 37.1% from 15.1 trillion JPY in 2016 ( 4 ). In 2021, the share of online shopping in the retailing sector reached 8.8%. Existing infrastructures such as curbsides, parking lots, micro-hubs (or last-mile facilities), and local roads are often inadequate to handle the rapidly growing freight demand associated with parcel deliveries. Researchers and practitioners alike are concerned about how to respond to the fast-growing demand for e-commerce delivery.
The need for understanding e-commerce-driven freight and the associated externalities is recognized more than ever. Thus, an increasing number of studies estimate e-commerce demand using regression and discrete choice models. A growing number of urban freight simulators incorporate e-commerce-driven delivery demand models. However, new methodologies for modeling e-commerce delivery demand have not been explored much. A particular research gap is that the characteristics of delivery services are not taken into account in most freight demand models. The characteristics of delivery services, such as delivery fees and speed, have been shown to influence the decisions of the order amount and frequency of online shopping in several studies on consumer decision analyses ( 5 , 6 ). For example, e-commerce retailers (e.g., Amazon) offer services such as free shipping under certain conditions since such tactics influence consumers’ decisions ( 7 ). To estimate the potential impact of measures and policies on e-commerce delivery demand, the demand model needs to be sensitive to the characteristics of delivery services. To fulfill such research gap, Sakai et al. proposed a model framework of household-based e-commerce demand that considers both household and delivery service characteristics to predict e-commerce delivery demand ( 8 ). This model was used in an agent-based urban transportation simulator, SimMobility ( 9 , 10 ). However, because of limited data availability, the model parameters were not estimated based on a real-world data in Sakai et al. ( 8 ). Instead, they put together the data from different sources, collected from various regions and years, for setting model parameters. It has not yet been confirmed whether the model specification is suitable for estimating models based on a single set of real data and can capture the relationship between delivery service characteristics and e-commerce demand. The objective of this research is to demonstrate the data collection and model estimation based on the framework proposed by Sakai et al. ( 8 ). We collect data of past in-person and online shopping behaviors through an online questionnaire survey and evaluate the potential effects of delivery service characteristics on e-commerce delivery demand. We aim to answer three research questions. The first question is: “Can the parameters of the aforementioned Sakai et al.’s model be estimated using real-world consumer survey data on online shopping?” ( 8 ). The second question is: “Can the model capture and replicate the effects of the characteristics of the home delivery service as well as household characteristics on the e-commerce delivery demand? (If so, what can we learn from it?).” Answering the first two questions should also answer the more abstract third question: “Is the new model proposed by Sakai et al. practical for traffic demand simulation and policy analysis?” ( 8 ). By answering these questions, this research contributes to the advancement of urban freight demand modeling, particularly the modeling for e-commerce delivery demand.
The rest of the paper consists of the following. The next section is a literature review focusing on e-commerce demand model. The section after that describes the survey data used in the study, followed by a section presenting the model structure. The final section discusses the estimated model and the sensitivity analysis. The final section is the conclusion of this paper.
Literature Review
E-commerce modeling research can be divided into three broad categories. The first category is concerned with understanding the characteristics of e-commerce users. Often, the main focus of this category of research is to identify the relationship between online and in-store shopping (i.e., whether the relationship between the two is substitutive or complementary) and/or the individual, household, and location characteristics associated with online shopping propensities ( 11 – 20 ). The second category focuses on the relationship between delivery service characteristics and e-commerce demand. Studies in this category aim to provide useful insights for designing delivery options, mainly from a marketing perspective ( 7 , 21–24). These two categories of studies provide much insight into the relationship between the characteristics of e-commerce users and delivery services and online shopping demand. However, their analyses are not intended for estimating (or predicting) the amount of demand, which is, in turn, used in traffic analysis.
The study in this paper falls into the third category. That is, studies that develop models to quantify e-commerce-driven delivery demand for freight impact analysis. The past studies in this category are as follows. As an early attempt, Wang and Zhou developed a household e-commerce delivery frequency model, a negative binomial model, using the data from the 2009 U.S. National Household Travel Survey (NHTS) ( 25 ). Their model considers individual, household, and regional-specific variables to predict the number of deliveries to households. They use the model to estimate home delivery demand and associated freight trips (calculated by using conversion factors) in the New York State Capital District. Similarly, Fabusuyi et al. estimated a model to predict delivery frequencies using negative binomial regression using the data from the U.S. NHTS data (of 2017), considering household characteristics as explanatory variables ( 26 ). Using the household interview survey data conducted in Rome, Italy, Comi and Nuzzolo developed models to predict the frequency of in-store and online purchases based on individual and household characteristics and used the model to evaluate the effect of consumers’ socio-economic changes ( 27 ). Jaller and Pahwa developed a multinomial logit model using the 2016 American Time Use Survey for shopping channel choices, treating “no shopping,”“in-store,”“online,” and “both” as choice sets ( 28 ). The results showed that age, gender, household size, and household income affect e-commerce use. While it is not clear from the paper how the shopping channel choices are converted to the frequency of deliveries, they used the model to evaluate the traffic impact of shopping and delivery tours. Using the data from the WholeTraveler survey, Stinson et al. developed a model to predict adoption of e-commerce and the ratio of delivery to in-store shopping at the household level ( 29 ). This model was then incorporated into POLARIS, an urban transportation simulation model which simulates vehicle tours and is used for scenario analysis ( 30 ). The explanatory variables considered are limited to household characteristics. Reiffer et al. developed three models, each of which simulate participation in online shopping, number of parcels ordered, and delivery location (home, work, and parcel locker) using the data collected by themselves and those obtained from the NHTS ( 31 ). The independent variables considered are personal and household characteristics. They used the models as a part of a last-mile parcel delivery module, logiTopp, in an agent-based travel demand model, mobiTopp. Using the model, they simulated last-mile parcel deliveries for a 1 week period. Beckers et al. developed models to predict e-commerce delivery frequency and delivery location (home or a pickup point) as a part of simulator for estimating residential freight trips ( 32 ). These models considered only consumer and item characteristics but, again, not delivery service characteristics.
While the above-mentioned studies do not consider the effects of delivery service characteristics on e-commerce delivery demand, Le Pira et al. conducted a stated preference (SP) survey among university students and developed a latent class discrete choice model for grocery shopping channel choice (i.e., in-store shopping, home delivery, or click-and-pick) considering the service levels associated with the channels ( 33 ). They used the model to evaluate scenarios with different channel attributes and estimated impacts on shopping time and environmental impact. Le Pira et al. addressed the impact of delivery service characteristics, but the changes in delivery size and frequency were not considered ( 33 ). As mentioned in the introductory section, Sakai et al. took both consumer and delivery service characteristics into account for e-commerce delivery demand estimation at the level of delivery size and frequency and incorporated the model into SimMobility for scenario analysis ( 8 ). However, they did not estimate model parameters using real survey data.
For filling the gap in modeling delivery service characteristics sensitivity, this paper complements Sakai et al. and examines the practicality of the model that considers delivery service characteristics to predict delivery size and frequency (or per-order value and total value spent per month) ( 8 ). In this research, we conduct a web-based survey to collect data about e-commerce orders in Japan and estimate the model proposed by Sakai et al. using the real data ( 8 ). With the modeling effort, we aim to not only demonstrate the practicality of their proposed model with the associated data collection method, but also to obtain insights into how e-commerce users in Japan potentially react to changes in delivery service characteristics.
Web-Based Survey and Data Processing
Web-Based Survey
We designed a web-based survey to collect the data for developing an e-commerce demand model, specifically a model that predicts detailed e-commerce demand characteristics (i.e., per-order value and total value of orders per month) of households that adopt online shipping. The period of the data collection is May 19–25, 2022. The target is those individuals who placed purchase orders online at least once in 2022 and are primarily in charge of shopping within their households. The survey includes questions on individual and household characteristics (gender, age, occupation, education, main commuting mode, household size, children, house type, household income, and car ownership) and past in-store and online shopping behaviors. Furthermore, order value, delivery fee, date of order, date of receipt, number of packages received, and method of receipt of the last three e-commerce orders were asked. Respondents were recruited by a market research service company with over one million panel members (https://www.asmarq.co.jp/global/). Details of the incentives were confidential, but the company claimed they are designed to have no impact on responses. Nevertheless, it should be noted that, since this is a web-based survey, respondents may be biased toward those who spend more time on the internet than the average individual. To prevent the potential sampling bias, the screening was designed to include a certain number of respondents from each different household size, age, household income, and residential location group. A total of 325 individuals from different households responded. We compared the respondents with the national statistics in Japan to assess sampling bias (Table 1) ( 34 , 35 ). The average age of respondents in the survey is higher (53.4 years versus 47.6 years). Since the survey respondents were limited to those who accounted for more than 60% of the household’s consumption activity, they are often the head of the household, which explains why the average age of respondents is higher than in the national census data. Their household income is also higher than the national statistics, which is likely because households using e-commerce are less in the low-income categories. Descriptive statistics of other individual and household characteristics are shown in Table 2. A total of 57.2% of respondents are paid-up members of at least one e-commerce platform (e.g., Amazon Prime).
Characteristics of Respondents and Comparison with National Statistics
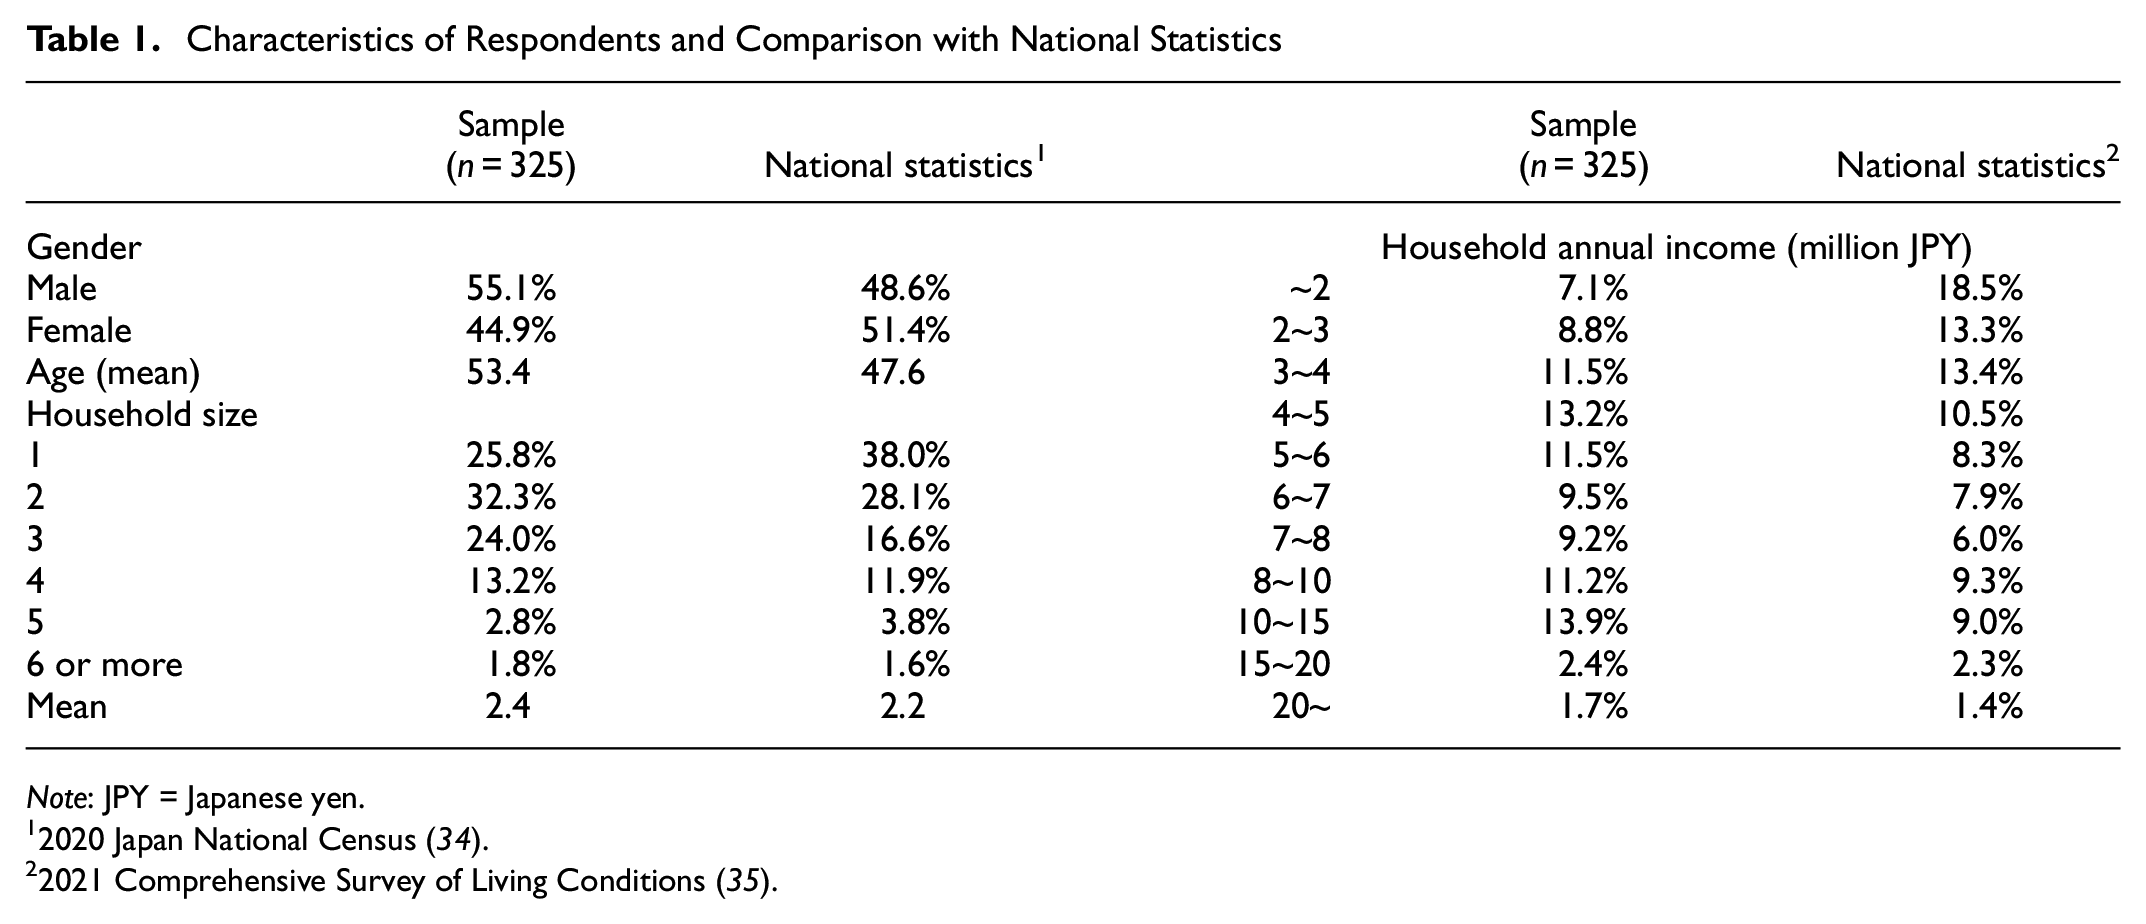
Note: JPY = Japanese yen.
2020 Japan National Census ( 34 ).
2021 Comprehensive Survey of Living Conditions ( 35 ).
Summary of Respondent Characteristics (n = 325)
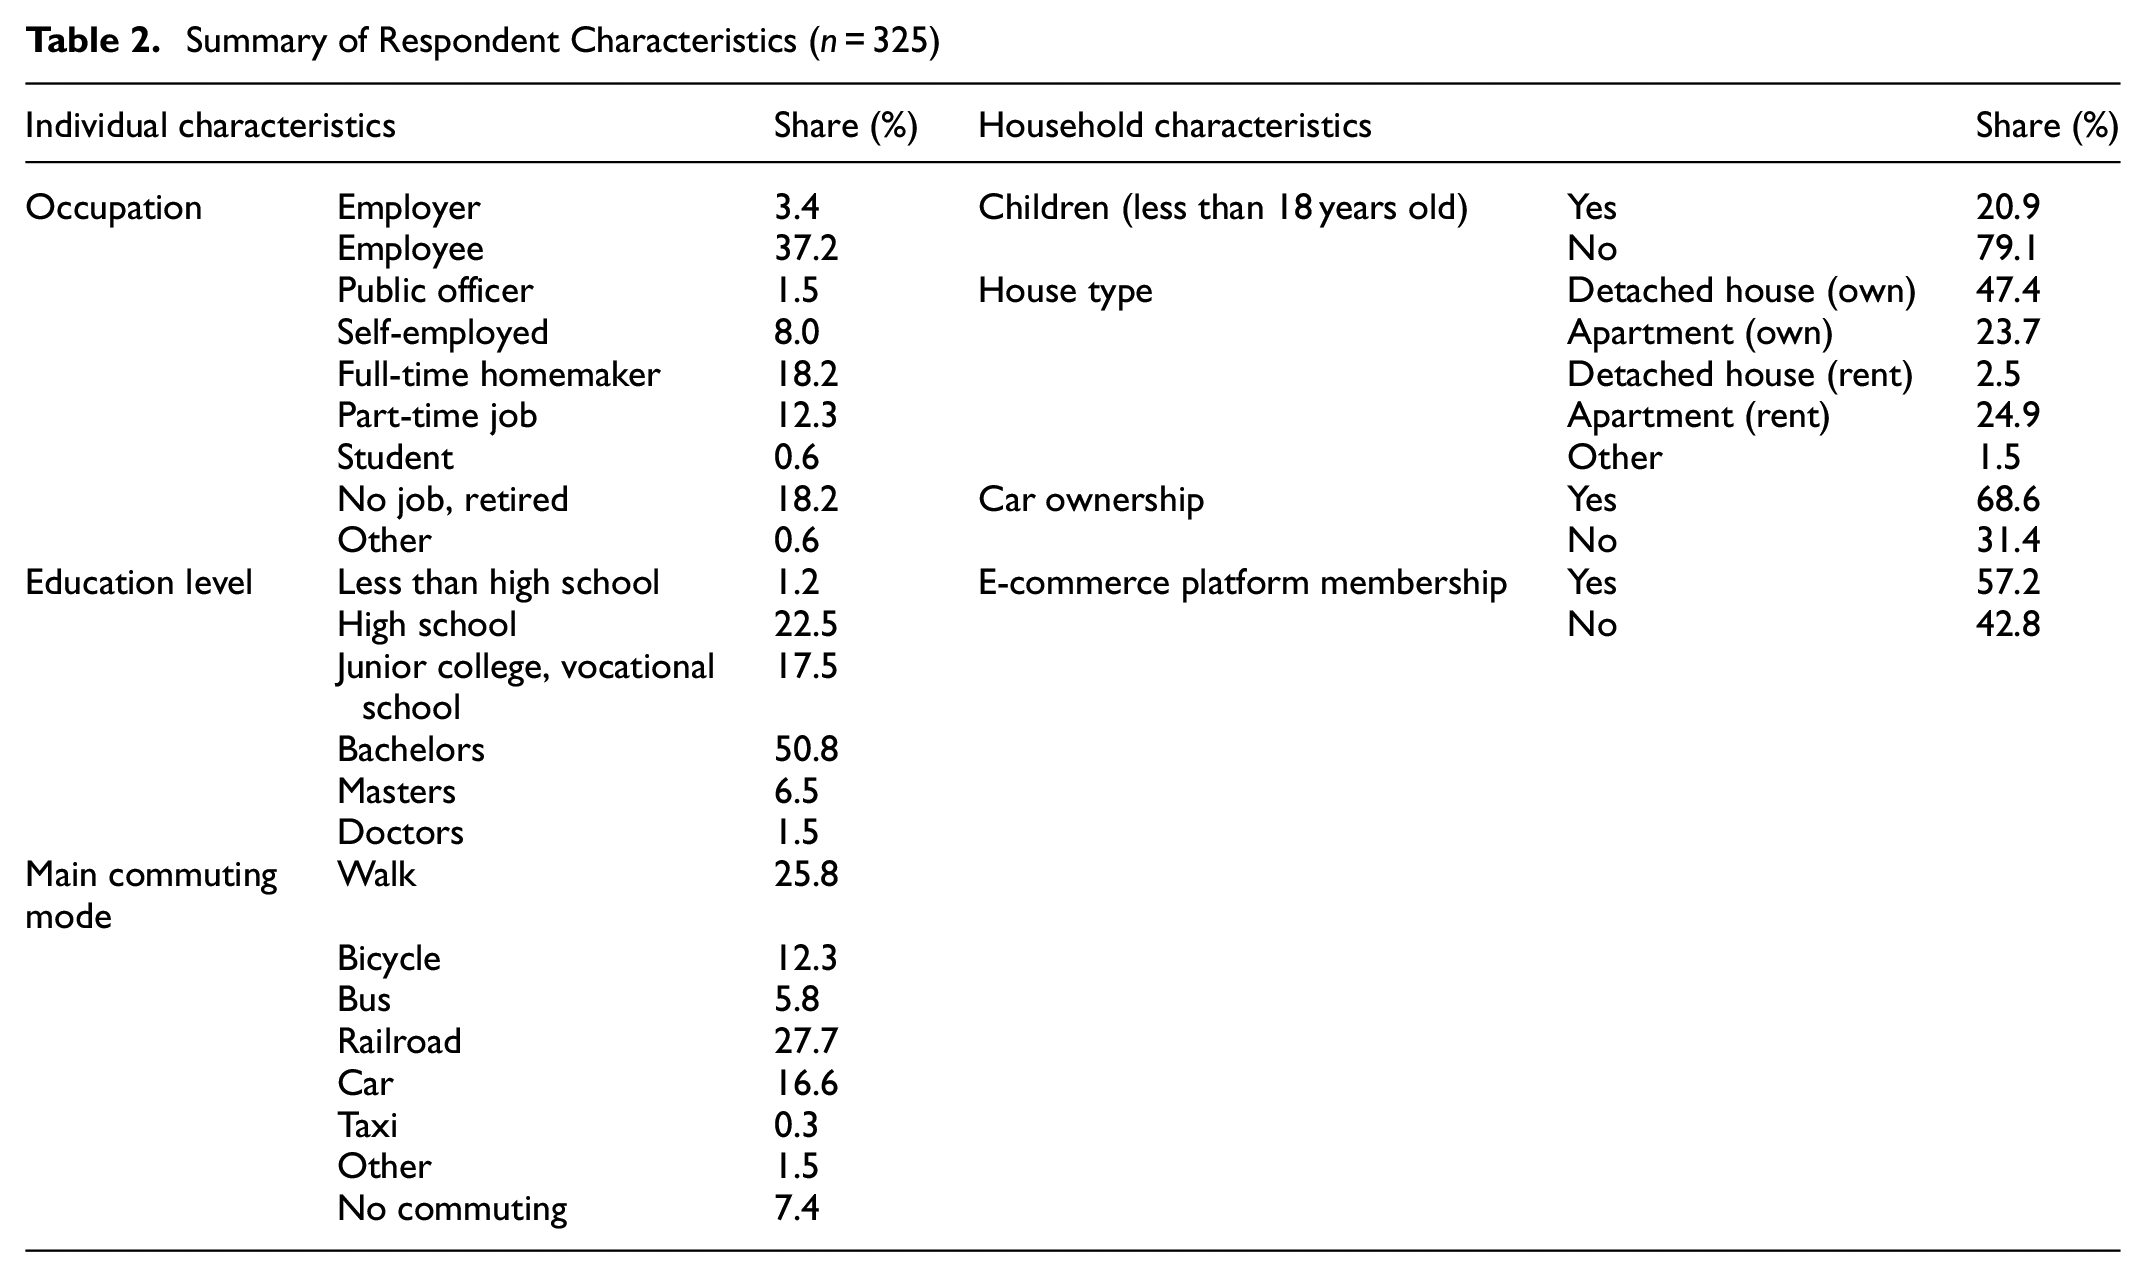
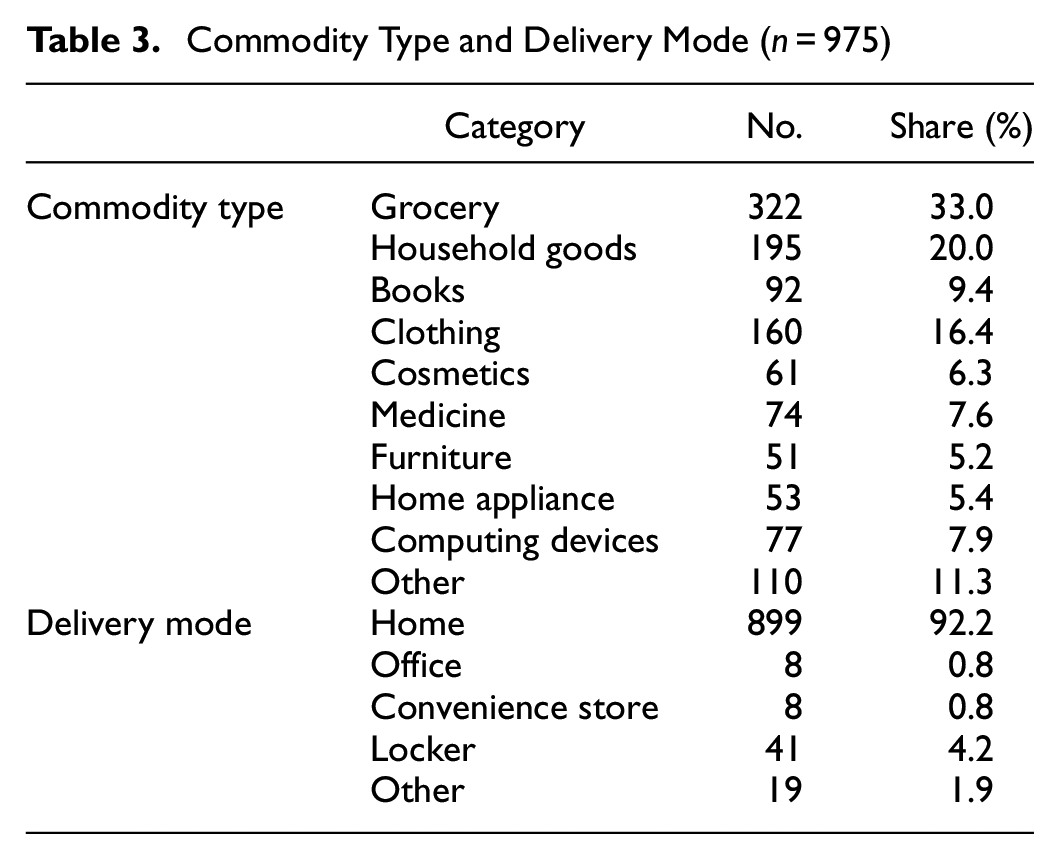
Figure 1 provides an overview of e-commerce usage frequency by respondent households. The average frequency of orders is 4.75 per month, indicating that many households order goods online more than once a week. The summary of the reported e-commerce orders is shown in Table 3. The sample size is 975, as each respondent was asked about their last three e-commerce orders. Groceries and household goods are the most purchased e-commerce items. Home delivery is the dominant delivery mode: 92.2% of deliveries are home delivery. Figure 2 provides a summary of e-commerce usage by respondent households. In most cases, one item is ordered at a time. The median delivery fee is 0 JPY, meaning that many orders are free to ship. The mean delivery speed (the time from order to receipt) is 3.16 days.
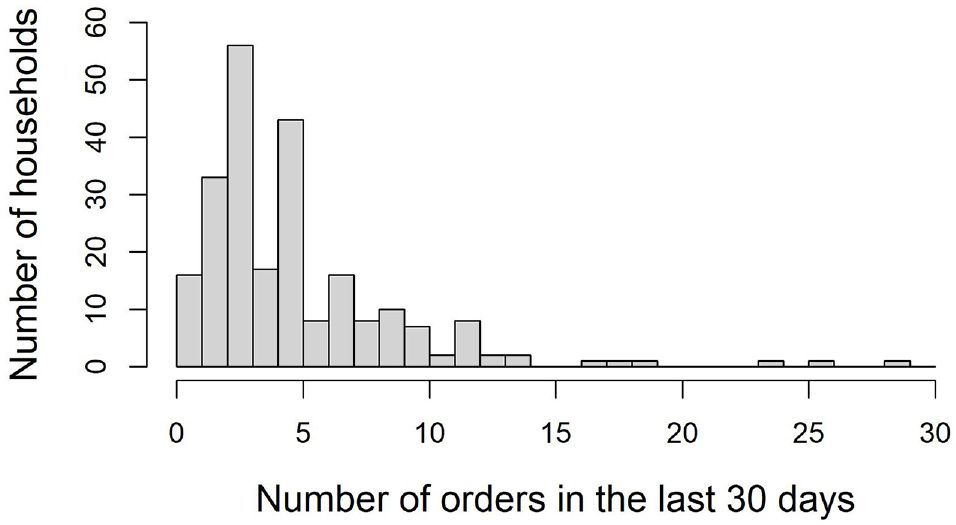
Number of orders in the last 30 days (n = 325).
Commodity Type and Delivery Mode (n = 975)
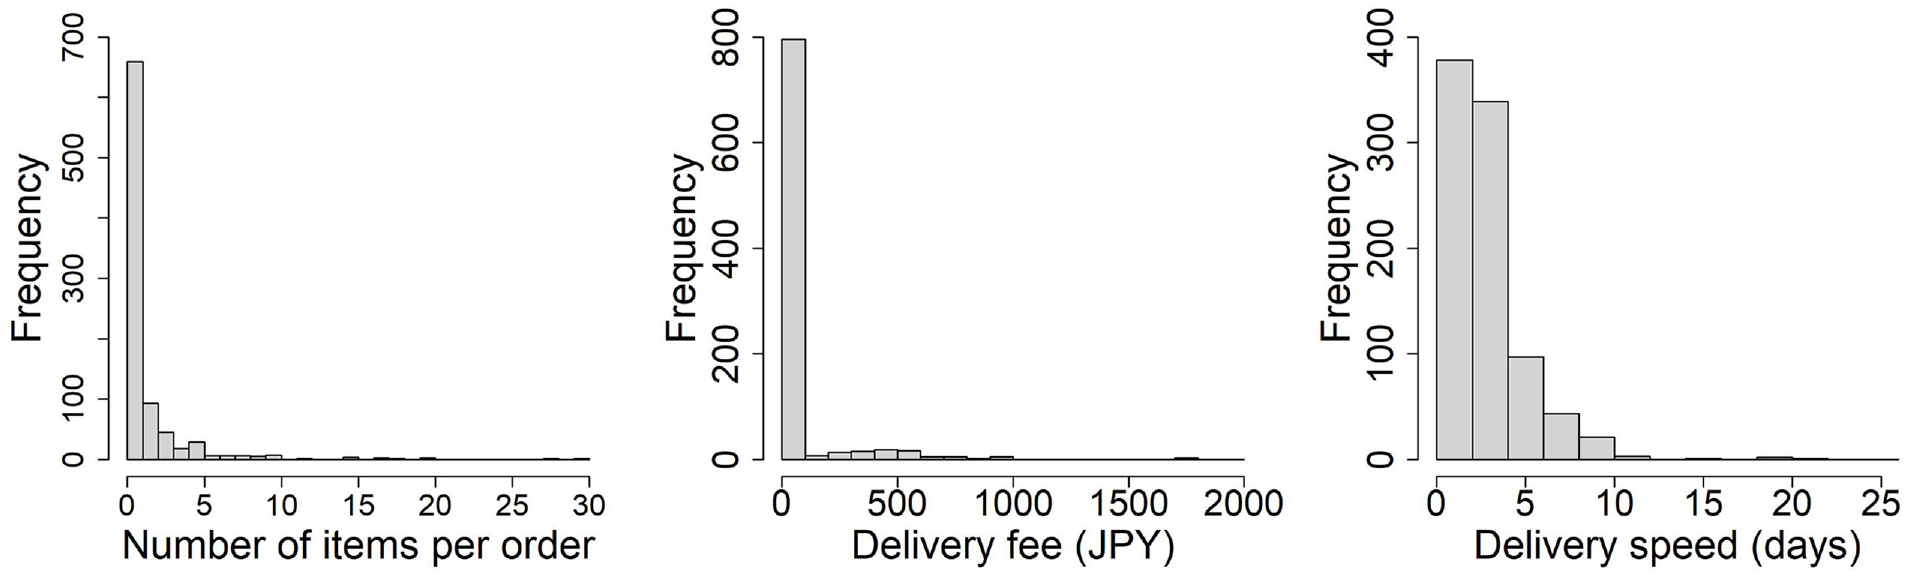
Summary of e-commerce use in respondents’ households (no. of items per order, delivery fee, and delivery speed).
Estimation of E-Commerce Order Value, Order Frequency, and Total Value for Households
For model estimation, we use the data of only 182 households that purchased groceries and/or household goods at least once in the last three e-commerce orders and with no missing data. Since consumers often purchase groceries and household goods at the same time, we lump the two categories together for the model estimation. Sakai et al. propose models for each of the three categories of groceries, household goods, and other, but we focus only on groceries and household goods ( 8 ). After evaluating the data, we found that the sample size was not sufficient to estimate models for other types of commodities, such as books and clothing. The dependent variables—average order value, order frequency, and total value (the total e-commerce expenditure in month)—are computed as follows.
The average order value
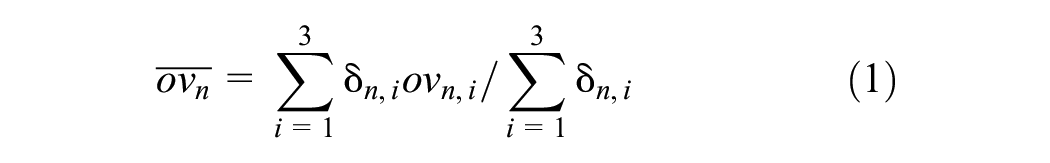
where
The order frequency

where
The total value spent online for purchasing groceries and household goods per month for household

Note that we removed four samples which had computed total value of 300,000 JPY or greater. The results are shown in Table 4.
Estimated Order Value, Order Frequency, and Total Value
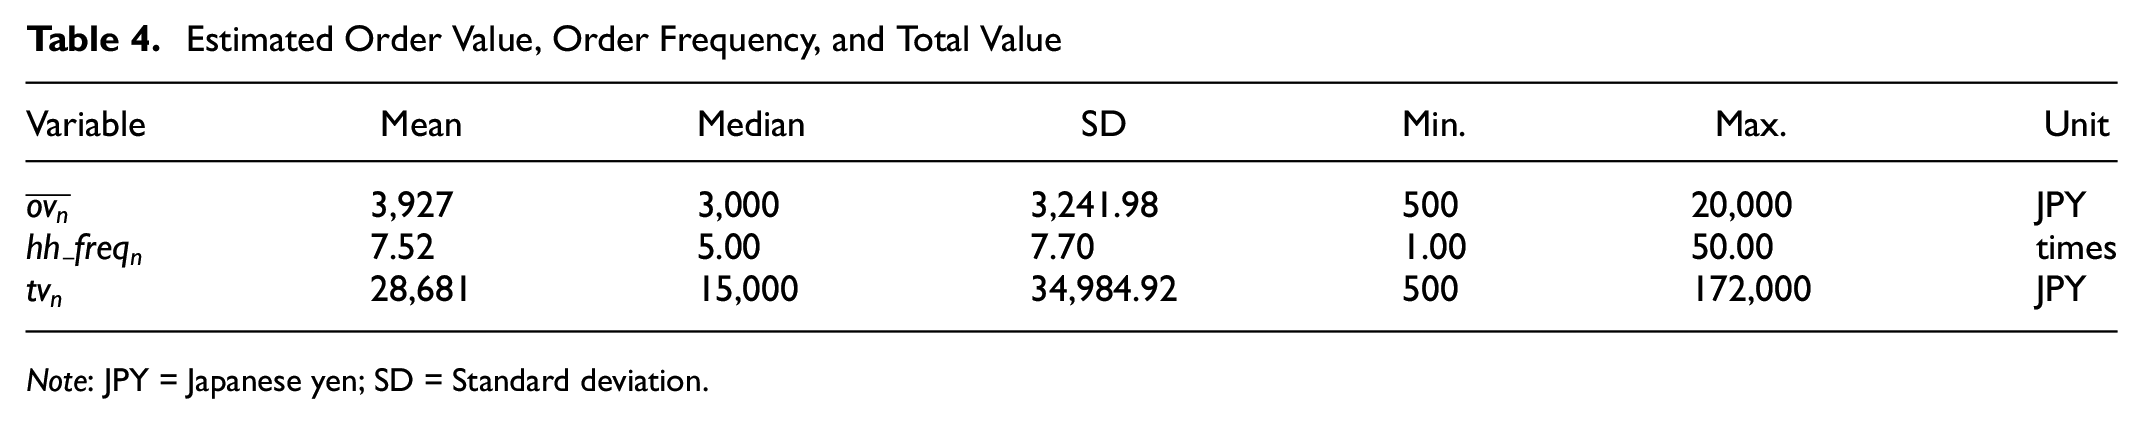
Note: JPY = Japanese yen; SD = Standard deviation.
Household-Based E-Commerce Demand Model
Overview
The household-based e-commerce demand model proposed by Sakai et al. predicts total value, order value, delivery mode, and delivery option in a joint manner to account for the bi-directional interactions among relevant decisions ( 8 ). “Total value” is the total e-commerce expenditure in a month; “order value” is the average purchase amount per e-commerce transaction; “delivery mode” is home delivery or pickup; and “delivery option” is a set of characteristics for delivery such as speed, time, date, and fee. The model uses the framework of logit model with the nested structure for four levels and considers the expected utility with the log-sum term from the lower level for the upper-level decision-making (Figure 3).
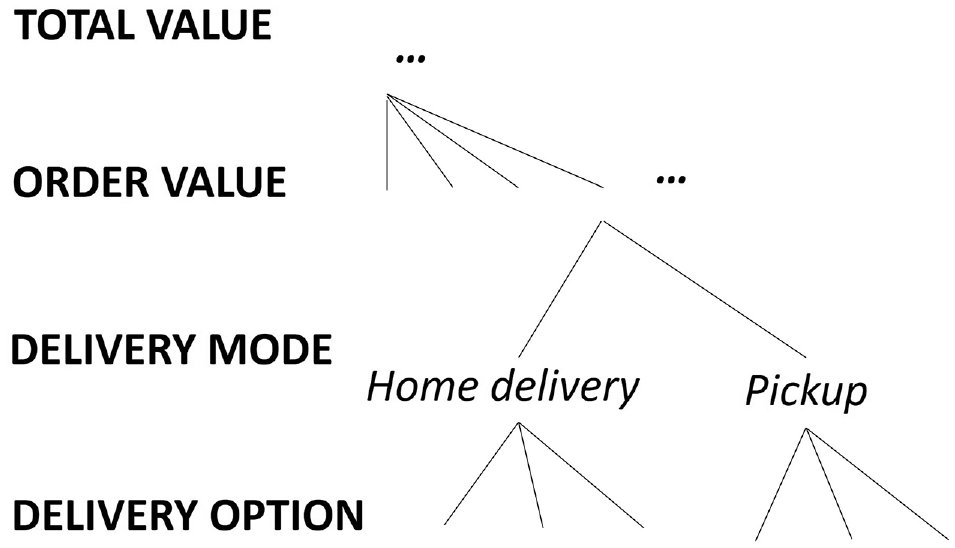
A multi-level model structure (adapted from Sakai et al.) ( 8 ).
In this paper, we demonstrate the estimation of a model for groceries and household goods. (Note that consumers often purchase groceries and household goods at the same time). It should be also noted that, while Sakai et al. proposed to include the choices for delivery mode and delivery options (the two lower levels in Figure 3) ( 8 ), we do not cover them because home delivery is the dominant delivery mode in Japan; the survey data indicate 92.2% of deliveries are home delivery (see Table 1) and, further, the information on unselected delivery options is not available to us. Therefore, we estimate a model for the joint decision of total value and order value in this study.
Model Specification
Order Value
We estimate a logit mixture model for the order value model considering heterogeneity of parameters. The choice set of “order value” is values that range between 500 and 20,000 JPY discretized at 100 JPY intervals. The utility of order value

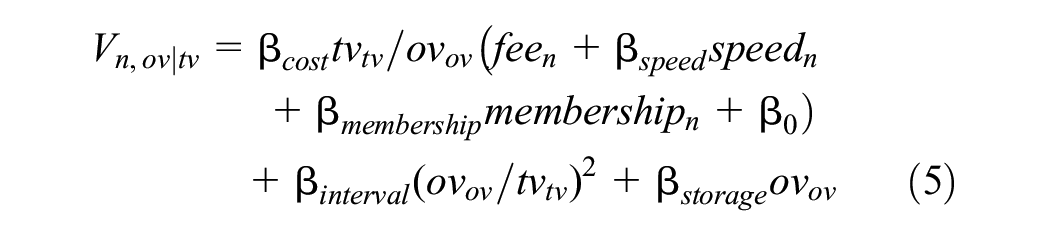
where
The first term in Equation 5 captures the effect of delivery options. The heterogeneity in households’ resistance to delivery costs is captured as a random parameter. If the delivery fee is higher, the order value is expected to be higher to reduce the delivery frequency (
21
). If the delivery speed is slower, the order value is expected to be higher; according to Nguyen et al., the coefficient on number of days required (speed) for delivery has the opposite sign to the coefficient on delivery fee, which means that the slower the delivery speed, the higher the order value (
7
). It is assumed that there is heterogeneity in the value of time relative to costs. Order value is decreased when households are registered members of an e-commerce platform. This is because e-commerce users make frequent, small purchases because of free shipping and faster delivery speeds granted to membership holders. The constant term
Given some values for
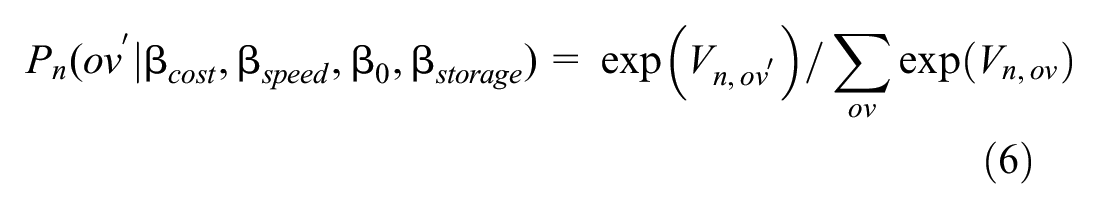
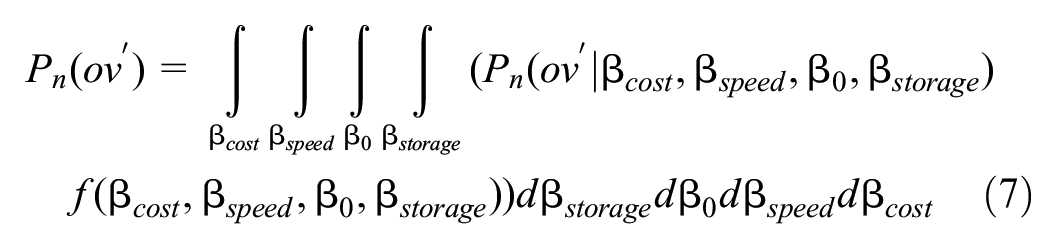
Unconditional probability is given by the following equation, using the multivariate density function of
Total Value
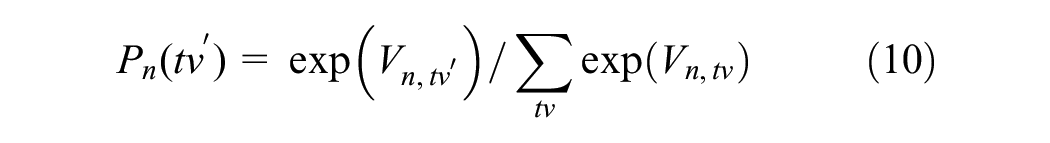
In the total value model, we also attempt to estimate a logit mixture model with randomized parameters, but t-values of coefficients are not significant, so we use the multinomial logit model. The choice set of “total value” is values that range between 500 and 200,000 JPY, again, discretized at 100 JPY intervals. The utility of total value

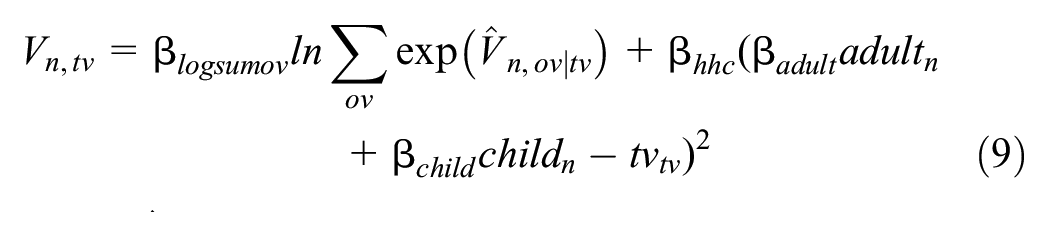
where
As the increase in household size (adult or child) should increase the total value,
Estimation
We use the data of 182 households that purchased only groceries and/or household goods at least once in the last three e-commerce orders and with no missing data from the survey for model estimation. The summary statistics of the variables used in the model are shown in Table 5. For estimating the order value model, the draws of the random terms,
Summary of Explanatory Variables for Total Value and Order Value Model
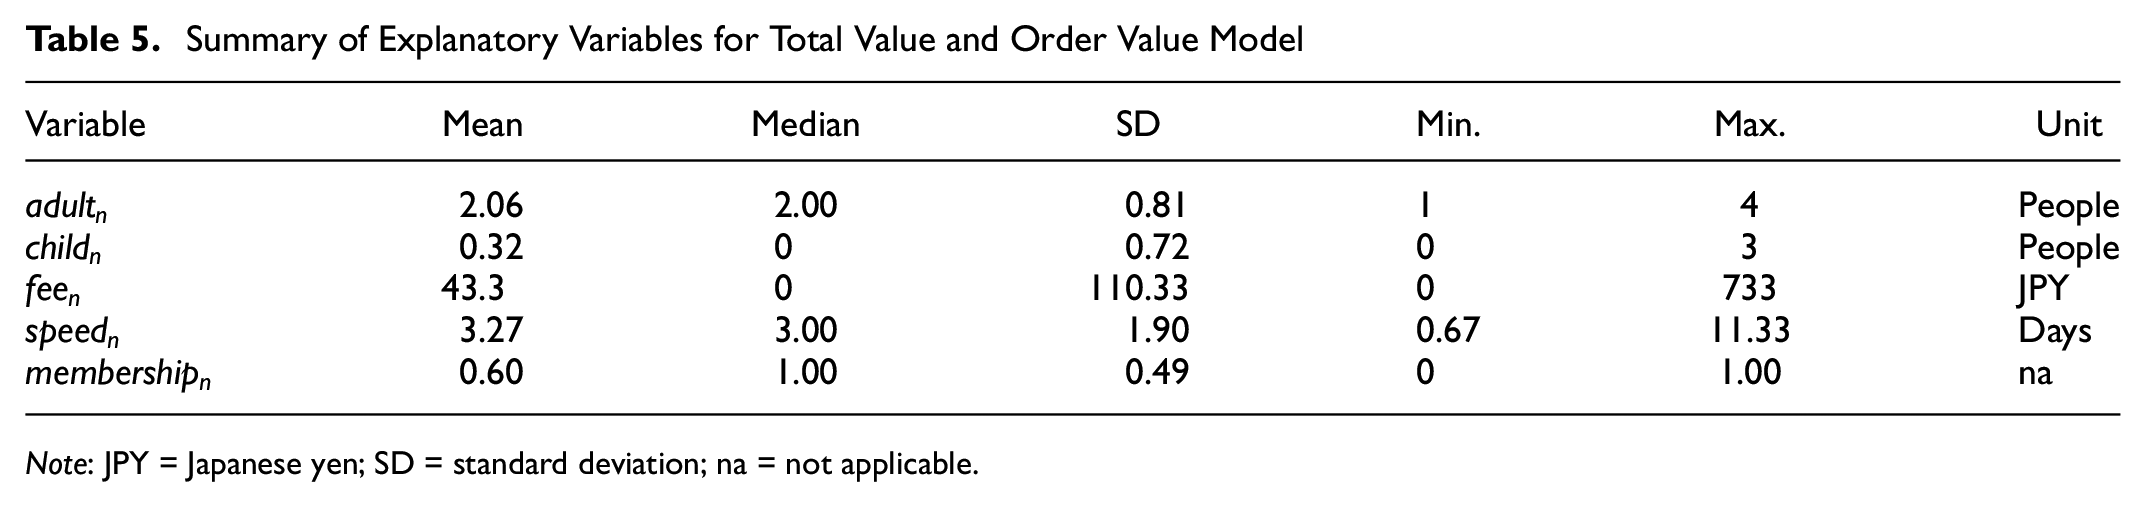
Note: JPY = Japanese yen; SD = standard deviation; na = not applicable.
We estimate the order value and total value models sequentially, using the maximum likelihood estimation method. Table 6 shows the model estimation results. In the order value model, all parameters show the expected signs. The distributed
Estimated Model Parameters (Order Value and Total Value)
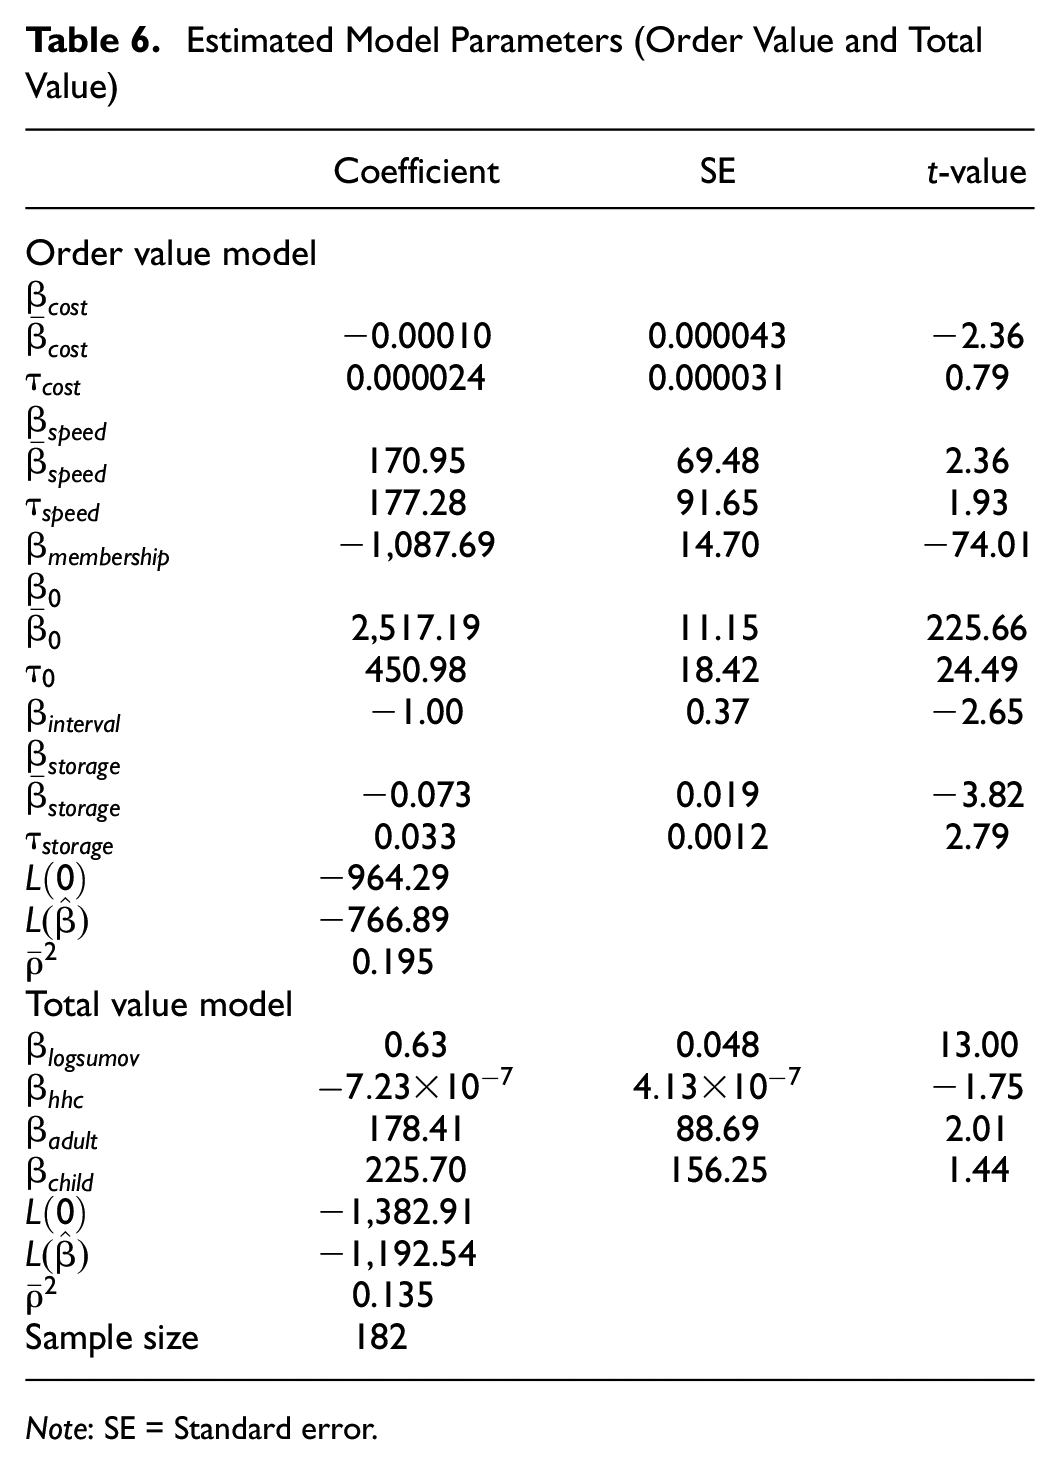
Note: SE = Standard error.
In the total value model, again, all parameters show the expected directions of effects. The significant log-sum parameter
Scenario Analysis
We consider the base and three hypothetical scenarios on delivery fees and speed to evaluate the effect of changes in these delivery service characteristics as follows:
Base scenario (Base): Observed delivery fees and delivery speed.
Scenario 1 (S1): Free delivery for all households, and delivery speed remains as observed. The average delivery fee is reduced from 43.3 to 0 JPY.
Scenario 2 (S2): For households with a delivery speed of two or more days, the delivery speed is reduced by 1 day. For households with a delivery speed of 1 day, the delivery speed remains as observed.
Scenario 3 (S3): Free delivery for all households, and delivery speed is the same as S2.
The demand for online groceries and daily goods purchases was simulated 100 times for each scenario using the estimated models, and the average for each household was computed. Table 7 shows the results for all households and, Table 8 shows the results of the analysis only for households with a delivery speed exceeding 2 days (146 households). Comparing Base and S1, free shipping decreases average order value by 1.6%, increases average total value by 2.2%, and increases average order frequency by 4.3%. Note that the observed delivery fee used in Base is quite reasonable already (43.3 JPY per delivery on average), as free delivery is a prevalent service offered by e-commerce vendors in Japan. Still, when shipping is completely free, people tend to break up their orders, decreasing the per-order value. Free shipping leads to an increase in both e-commerce order frequency and total spending, but the impact on frequency is much larger, as free shipping also affects order value. Comparing Base and S2 (note that the parentheses show the results only for households with an observed delivery speed of more than 2 days), reducing the number of days for delivery by 1 day for households with a delivery speed of two or more days decreases average order value by 0.8% (1.3%), increases average total value by 5.4% (5.7%), and increases average order frequency by 5.9% (7.0%). The results underline that the improvement in delivery speed could significantly affect the total online purchase of groceries and daily goods, while the impact on order value is limited compared with S1 (free delivery scenario). The result of S3 shows the largest decrease in average order value and the largest increase in average total value and average order frequency compared with S1 and S2. The impact of the simultaneous improvement in delivery fee and speed is slightly greater on frequency and slightly less on total value than the sum of the effects of improvements in each. The distributions of order values and total values for different scenarios are shown in Figure 4. The result indicates the effect of delivery speed (S2) on total value occurs mainly for household with relatively lower total value (less than 30,000 JPY). For households that rely heavily on e-commerce for groceries and daily goods, the improvement in delivery speed does not necessarily encourage further reliance.
Results of Sensitivity Analysis for All Respondents’ Households (n = 182)
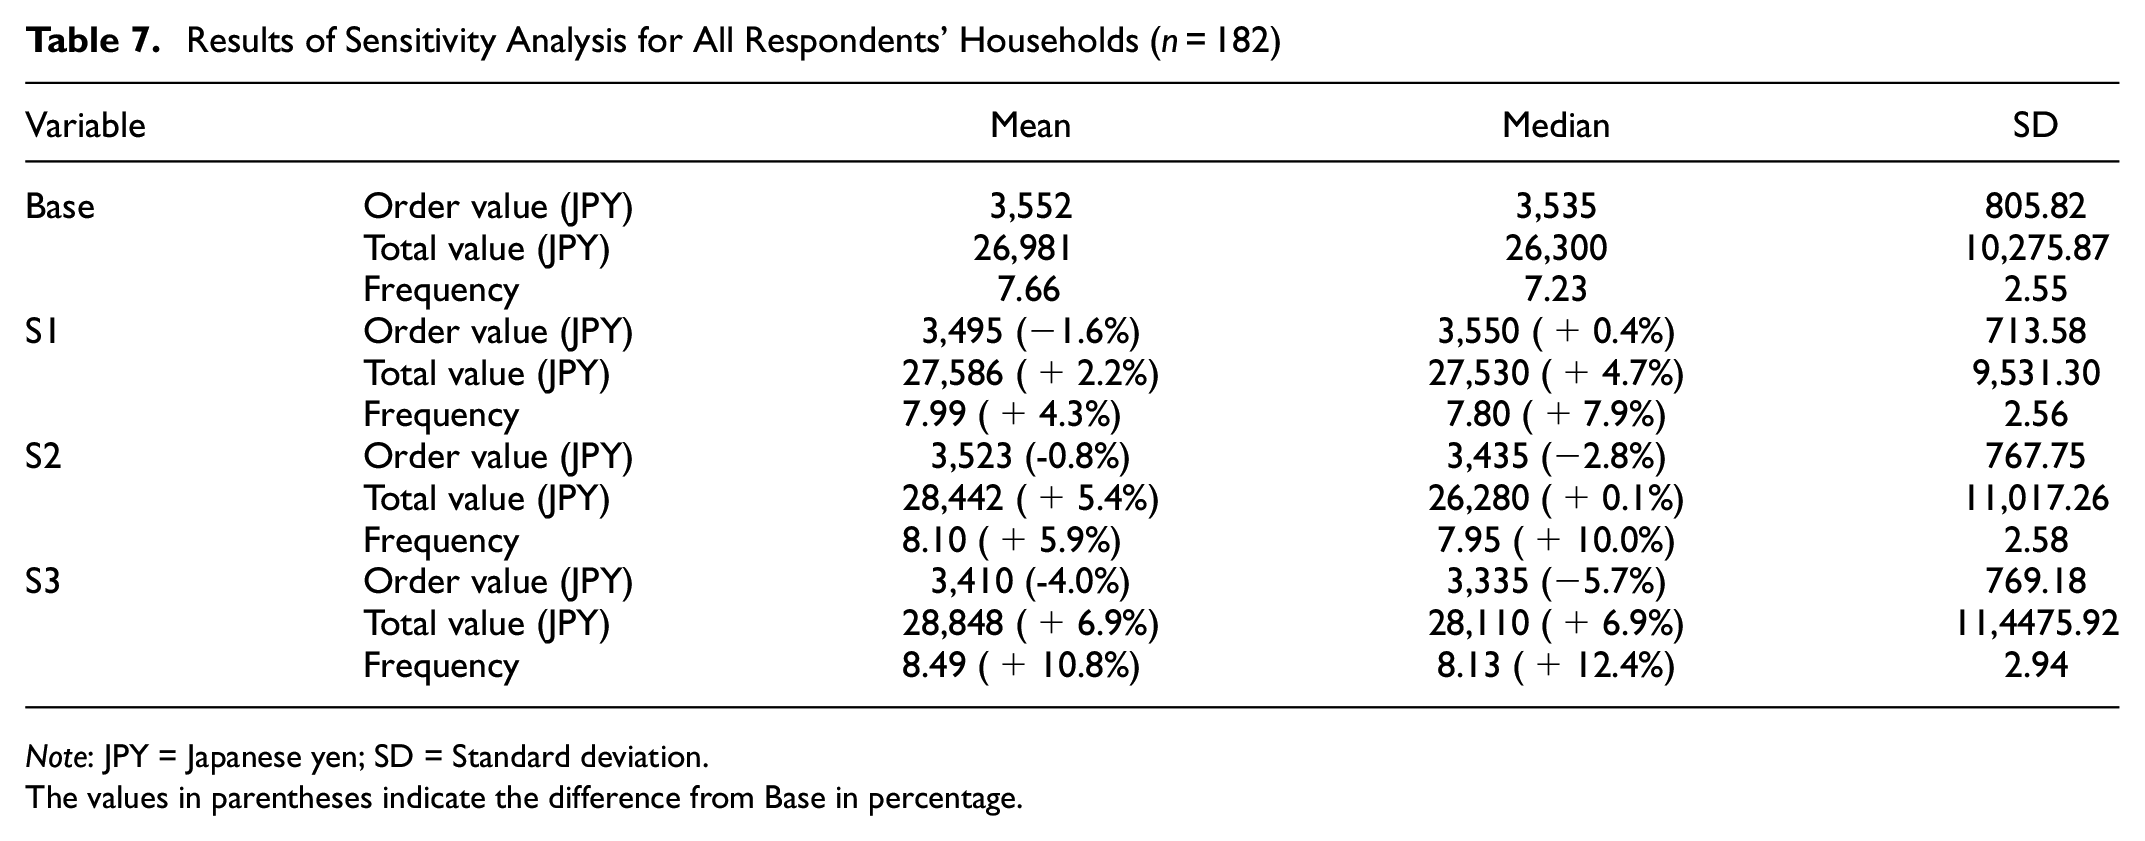
Note: JPY = Japanese yen; SD = Standard deviation.
The values in parentheses indicate the difference from Base in percentage.
Results of Sensitivity Analysis for Households with Delivery Speed Exceeding 2 days (n = 146)
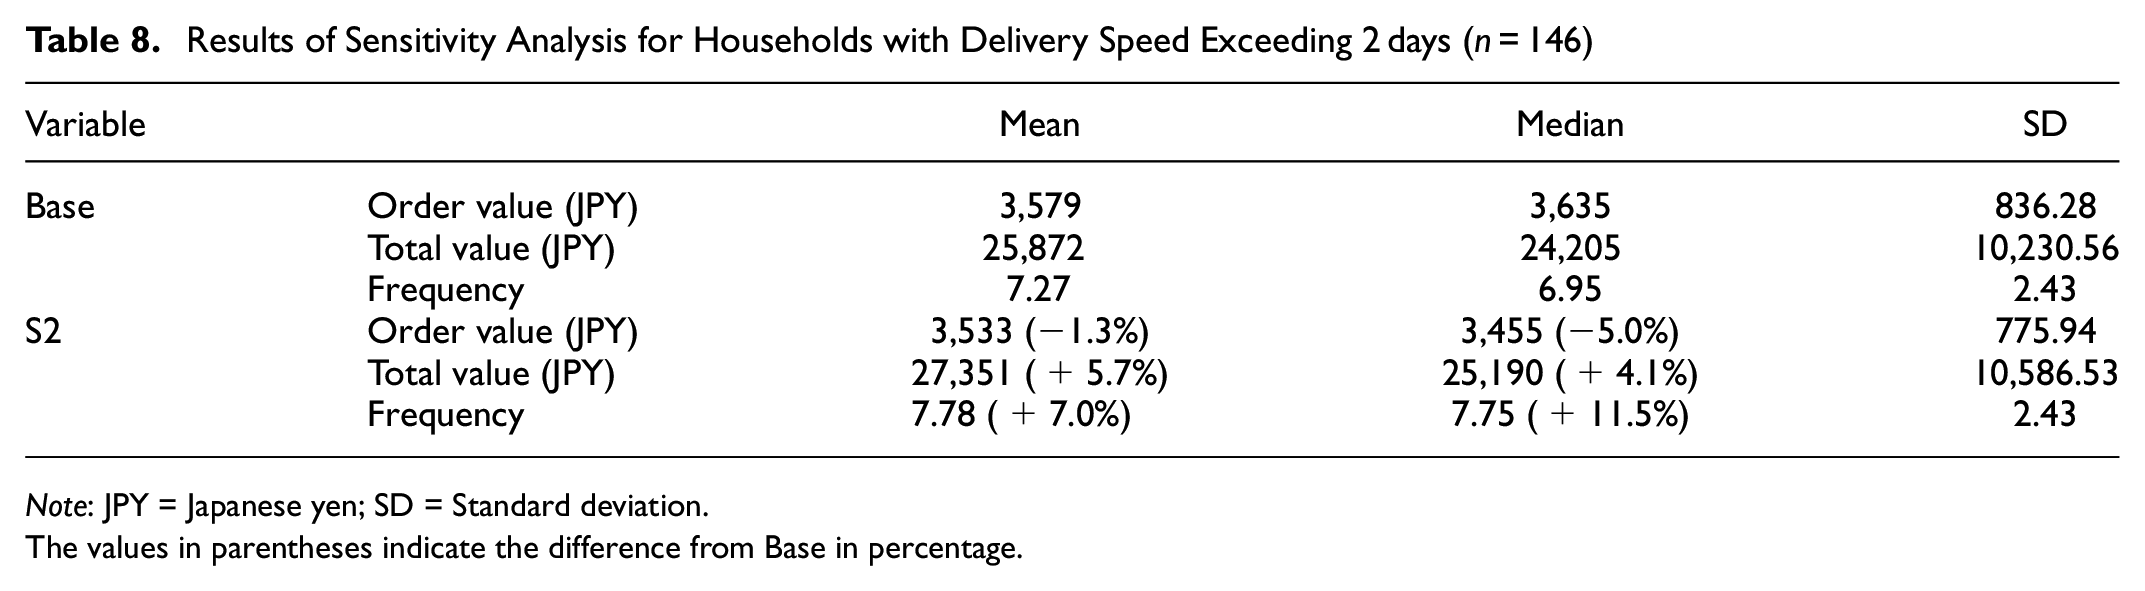
Note: JPY = Japanese yen; SD = Standard deviation.
The values in parentheses indicate the difference from Base in percentage.
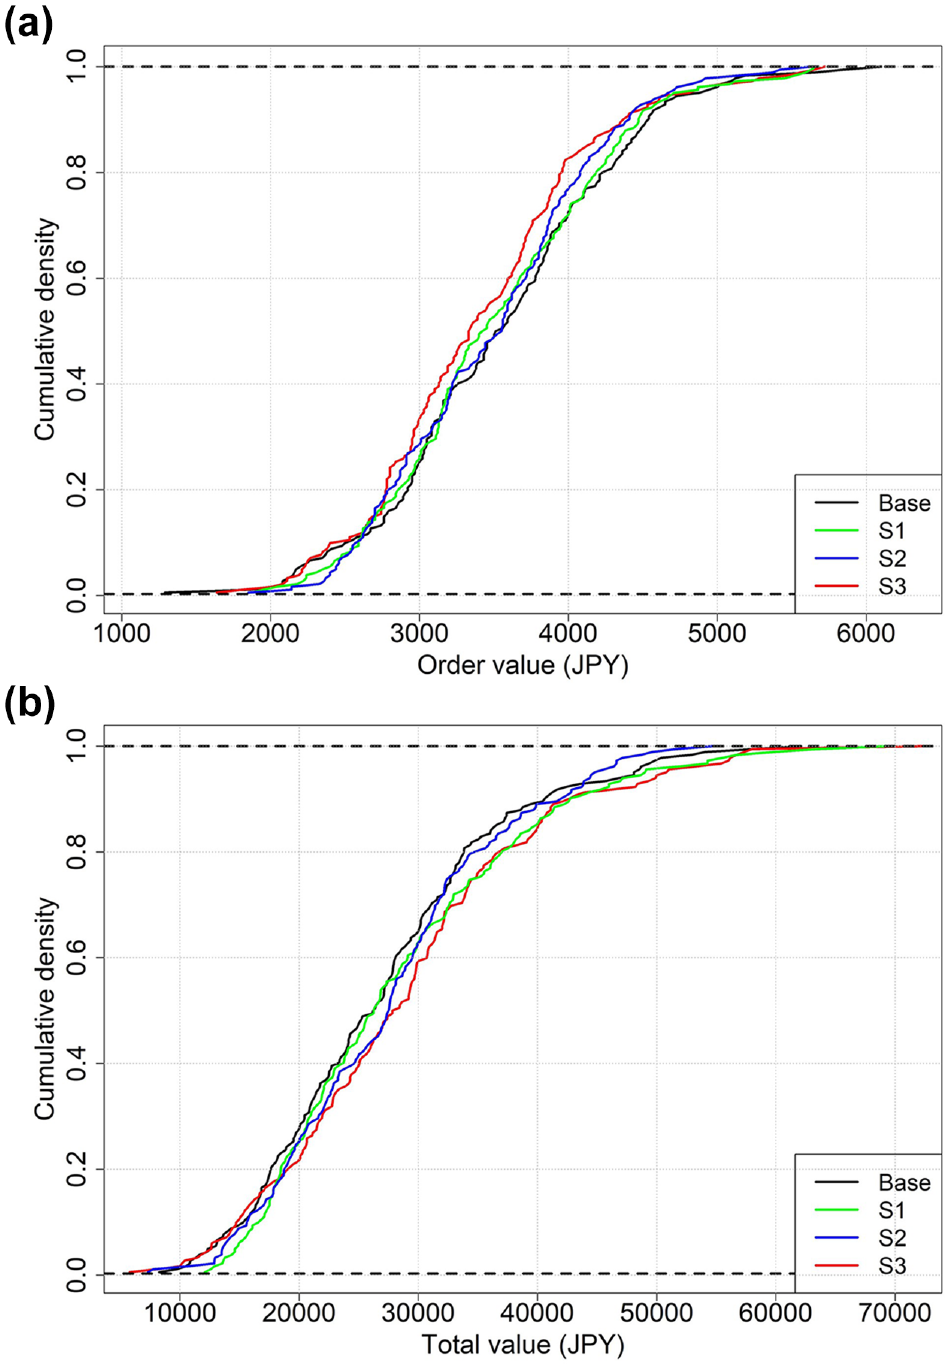
The distribution of (a) order values and (b) total values.
Conclusions
We conducted a survey of online purchases in Japan and estimated the household-based e-commerce demand model based on the framework proposed by Sakai et al. ( 8 ). The estimated model successfully captures the relationship between delivery service characteristics (i.e., delivery fee, speed, and membership) and the monthly e-commerce expenditure and the average value of orders for groceries and daily goods. By including household characteristics (i.e., the number of adults and children), the estimated model better reflects household characteristics than the previous total value model, which only took household size into account. Furthermore, the logit mixture model allowed us to account for households’ heterogeneity in parameters in the order value model. Our model also successfully takes membership status into account. The membership brings differences in the delivery service quality offered to consumers, and thus often complicates the problem.
The models and analysis of this study contribute to advancing the understanding of e-commerce delivery demand. As delivery options (delivery fee and speed) improve, household order value decreases, but total expenditures and frequency increase. We found that the number of children in a household has a greater impact on e-commerce spending than the number of adults in the household. This study also contributes to the advances in urban freight demand simulation, as the proposed model has the potential to be integrated with agent-based demand models, which are increasingly more implemented around the world.
It must be noted that the model was developed using data from samples who adopted online shopping, and the consideration of e-commerce adoption in modeling and simulation is left for future research. Furthermore, although this study was limited to groceries and daily goods, it is necessary to examine the validity of the model framework and the impact of delivery services on demand for other categories.
Footnotes
Author Contributions
The authors confirm contribution to the paper as follows: study conception and design: T. Sakai, R. Motojima, T. Hyodo; data collection: T. Sakai; analysis and interpretation of results: R. Motojima, T. Sakai; draft manuscript preparation: R. Motojima, T. Sakai. All authors reviewed the results and approved the final version of the manuscript.
Declaration of Conflicting Interests
The author(s) declared no potential conflicts of interest with respect to the research, authorship, and/or publication of this article.
Funding
The author(s) disclosed receipt of the following financial support for the research, authorship, and/or publication of this article: This work was supported by JSPS KAKENHI Grant Number 21K20445.