
Abstract
Fine aggregate matrices (FAMs) have been identified as a key constituent of asphalt concrete (AC). To accurately analyze the behavior of FAM testing specimens that represent the actual material in asphalt mixtures, mix design procedures must consider the inherent characteristics of the source material. These characteristics are often not directly obtained from tests and are instead assumed or adopted from tables available in the literature. Examples of such characteristics include specific surface area and maximum size of aggregates, binder film thickness, and the percentage of air voids to be used in sample fabrication. To enhance FAM mix design, this study incorporates characterization results of the aforementioned parameters, obtained through laboratory and digital image analysis techniques, into an existing FAM mix design concept. The findings indicate that FAMs designed using the recently developed procedures have the potential to ensure a simplistic relationship between the dynamic modulus of the FAM and its corresponding AC and to better predict the fatigue cracking phenomenon through the strain ratio relationship between the different material scales. As a result, the novel optimized FAM mix design holds great promise as a tool for predicting the overall behavior of asphalt mixtures using multiscale-based approaches.
Keywords
The most prevalent type of pavement structure worldwide is flexible, with asphalt mixtures serving as the primary material for the surface course. In general, current specifications for such mixtures are based on the analysis of their isolated constituents or the asphalt mixtures themselves. However, several researchers ( 1 – 8 ) have emphasized that the evaluation of an intermediate scale between asphalt mixtures and their constituents is very relevant, as it allows the characterization of properties that can help understanding of factors affecting the mixture service life.
The fine aggregate matrix (FAM) has been identified as a material of significant importance that requires further investigation within the paving community. FAMs represent an intermediate fraction of asphalt mixtures, consisting of fine aggregates, fillers, binder, and air voids. Many studies have demonstrated that cracking within asphalt mixtures often originates and spreads within the FAM, prompting researchers to focus their efforts on its detailed characterization ( 1 – 8 ).
Despite numerous efforts to understand the volumetric and mechanical characteristics of FAMs, recent comprehensive analyses have focused on key parameters that are crucial for establishing mix design procedures and fabrication. These parameters include the specific surface area of aggregates, the most representative maximum aggregate size for FAM specimen fabrication, the binder film thickness (BFT) surrounding aggregates, and the air void content of the asphalt mixture within the FAM ( 9 – 12 ). Determining these parameters presented challenges, thus researchers often resorted to arbitrary or empirical values that can affect the accuracy of the FAM mix design.
The specific surface area of aggregates plays a key role in FAM mix design, since the binder content needed to cover the aggregates tends to be proportional to this parameter. There are limited methods to accurately assess morphological properties of aggregates such as surface area ( 9 ). Additionally, FAM mix design procedures commonly arbitrate BFT values. For instance, Kim et al. ( 13 ) proposed a BFT of 10 µm and Karki ( 14 ), 12 µm.
Underwood ( 15 ) conducted a study on the air void content utilized in FAM fabrication. The study employed X-ray computed tomography and the threshold technique for image segmentation. The author recommended that the air void content adopted in FAM fabrication should range between 40% and 70% of the total air voids present in the asphalt mixture. However, it should be noted that the resolution used in the tomography tests conducted in this study was limited to 0.310 mm/pixel. This resolution may not be sufficient for observing the smaller particles present in asphalt composites, which require more precise resolutions.
To address this limitation, recent investigations have employed micrometric spatial resolutions and advanced digital image processing techniques. These investigations, such as the one conducted by Enríquez-León et al. ( 10 ), have provided experimental evidence supporting the strong coefficient of determination between the air void content of FAM and the air void content of the corresponding asphalt mixture.
The evaluation of the particle size of aggregates used in the fabrication of FAM requires careful consideration. Various researchers have employed different values for this parameter, including 0.60 mm (sieve No. 30) ( 16 ), 1.18 mm (sieve No. 16) ( 17 – 19 ); 2.00 mm ( 20 ), 2.36 mm (sieve No. 8) ( 21 ), and 4.00 mm (sieve No. 5) ( 20 ). Recently, Souza et al. ( 11 ) conducted a study that determined the maximum aggregate size of 2.36 mm as the most representative for FAM fabrication. It is essential to comprehend these FAM characteristics and incorporate them into the fabrication processes to create materials that accurately reflect the properties of asphalt mixtures and enable precise analysis of their volumetrics and mechanical behavior.
Study Objectives and Scope
The primary aim of this research is to optimize FAM volumetric mix design and testing sample fabrication by leveraging data from recent studies ( 9 – 12 ). Improving FAM mix design can lead to better predicting the overall performance of asphalt mixtures. The specific goals of this effort include:
to characterize the FAM stiffness and fatigue behavior using the novel mix design approach, considering linear viscoelastic properties and the simplified viscoelastic continuum damage (S-VECD) theory, respectively;
to compare the stiffness and the fatigue behavior of FAMs designed using different strategies;
to contribute to the advancement of knowledge on experimental multiscaling to estimate the mechanical behavior of asphalt materials.
FAM Mix Design Background
Despite a common sense among researchers that cracking phenomena are generally initiated in this constituent of asphalt mixtures, there is still no consensus on FAM mix design procedures that can produce materials representative of the FAM existing within the asphalt mixtures. Various researchers have developed their own methods for FAM mix design, making it difficult to evaluate and compare the properties of the composite. For instance, Kim et al. ( 13 ), Castelo Branco ( 3 ), Karki ( 14 ), Coutinho ( 22 ), Sousa et al. ( 23 ), Ng et al. ( 24 ), and Amelian et al. ( 25 ) have proposed different mix design approaches for FAM. A comparison among these methodologies is outlined below to identify the strengths and weaknesses of each FAM mix design.
Comparison of FAM Mix Design Procedures
The analysis of distinct FAM mix design methods indicates that the determination of FAM binder content relies on three main approaches: arbitrary value, complete asphalt mixture (CAM) mix design, or binder extraction. A detailed comparison of the FAM mix design methods is provided in Table 1.
Comparison of the FAM mix design procedures
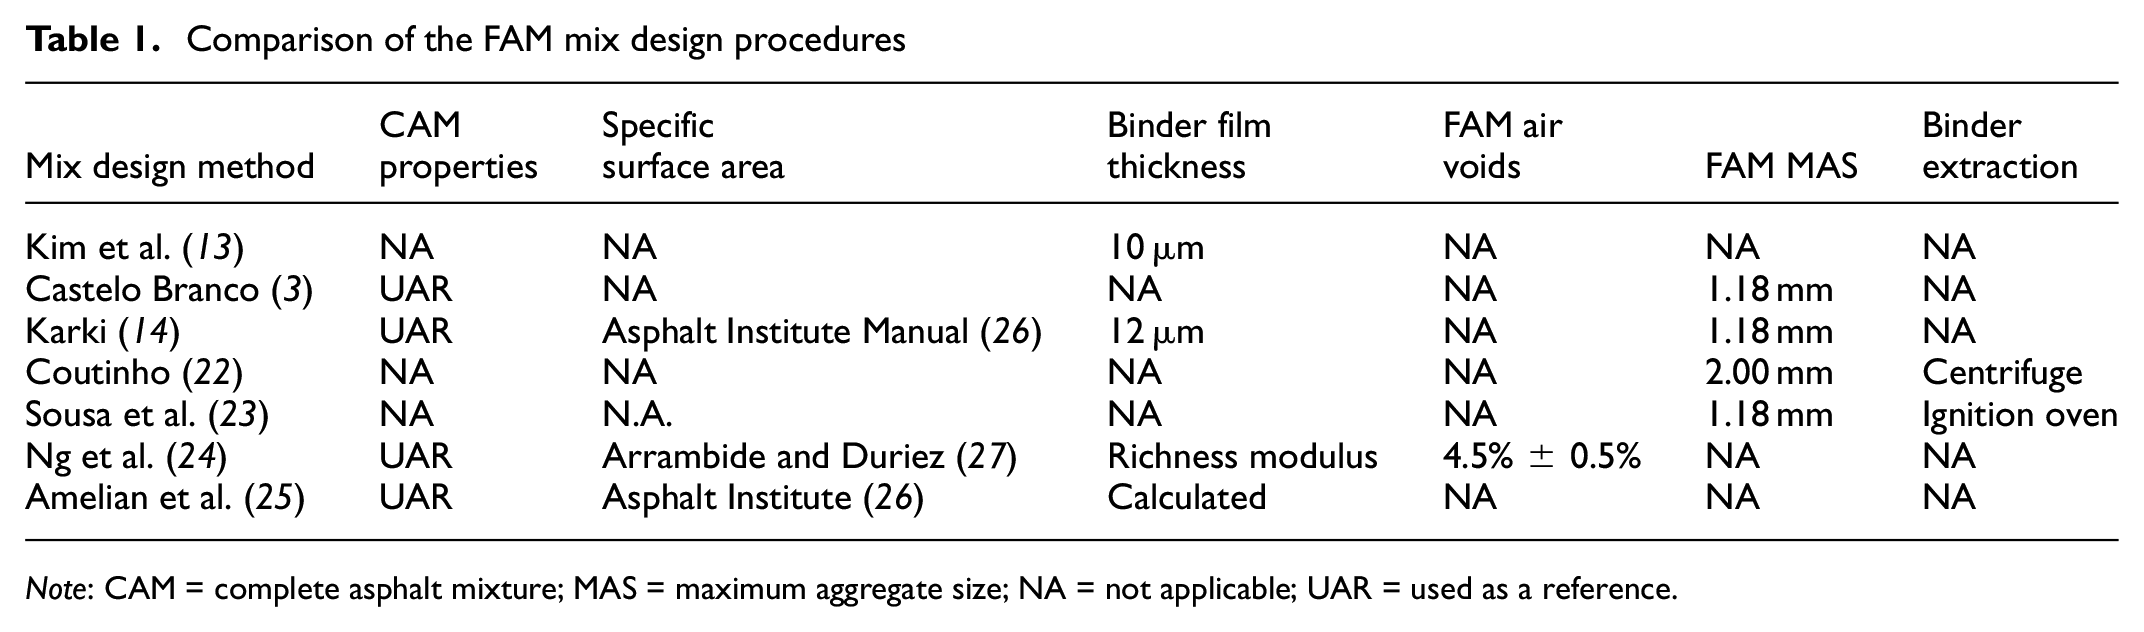
Note: CAM = complete asphalt mixture; MAS = maximum aggregate size; NA = not applicable; UAR = used as a reference.
Table 1 highlights several challenges. Firstly, there is a lack of clarity about the amount of air voids required to fabricate the FAMs, as well as the definition of the most suitable maximum aggregate size (MAS). Kim et al. ( 13 ) did not consider the CAM densities and gradation characteristics, as well as the specific surface area of the aggregates.
Castelo Branco ( 3 ) considered the CAM aggregate gradation, but failed to account for the effective binder content of coarse aggregates. As a result, higher binder contents were expected for the FAMs. In contrast, Karki ( 14 ) took into consideration the percentage of effective binder in coarse aggregates. However, Karki ( 14 ) arbitrarily set the BFT at 12 μm for all FAMs and adopted a fixed FAM MAS of 1.18 mm.
Coutinho ( 22 ) measured the weight of fine aggregates adhered to the coarse aggregates. However, the use of the centrifuge extraction method for binder extraction can lead to discrepancies in the results, as it relies on the operator’s experience and technical skills during testing. Sousa et al. ( 23 ) opted for the ignition oven method instead of centrifuge extraction, as its reduced dependence on operator skills offers higher accuracy. However, both methods failed to account for the mass of the mastic adhered to the coarse aggregates.
Ng et al. ( 24 ) introduced the richness modulus (K factor) in the mix design process, but this factor is not deterministic and allows for significant variations in binder content. Further studies on BFT could enhance the understanding of asphalt mixture volumetrics and help address this challenge. Another limitation of this method is the determination of the specific surface area of fillers, as it is assumed to be constant for all types of aggregates and mixtures.
Amelian et al. ( 25 ) defined the aggregate specific surface area based on the Asphalt Institute Manual ( 26 ), assuming that the specific surface area of fillers remains constant. In contrast, Souza et al. ( 11 ) demonstrated that the specific surface area of fillers varies significantly. They found that the variability in the specific surface area of coarse and fine aggregates is much lower than that of fillers. To simplify the characterization of aggregate specific surface area in FAM mix design, it is advisable to use only the specific surface areas of coarse and fine aggregates as input. This can be accomplished by adjusting the equations in the FAM mix design.
Integration of Key Parameters Obtained from Laboratory Testing into Fam Mix Design
Several studies by the authors of this article ( 9 – 12 ) have recently delved into the investigation of FAM BFT, FAM air voids, FAM MAS, and specific surface areas of aggregates to address the aforementioned limitations identified in the FAM mix design methods. The literature provides detailed insights into the impact of these parameters on the overall performance of FAM mixtures.
FAM BFT
Souza et al. ( 12 ) conducted an analysis on the BFT of the FAM phase in asphalt concrete (AC) mixtures. The BFT surrounding aggregates of different size intervals in the Superpave volumetric mix design was measured through scanning electron microscope and digital image processing. The researchers observed that BFT changes according to the size interval of the aggregates and can be predicted using the correlation presented in Figure 1. Overall, the BFT of FAM ranged from 7 µm to 15 µm.
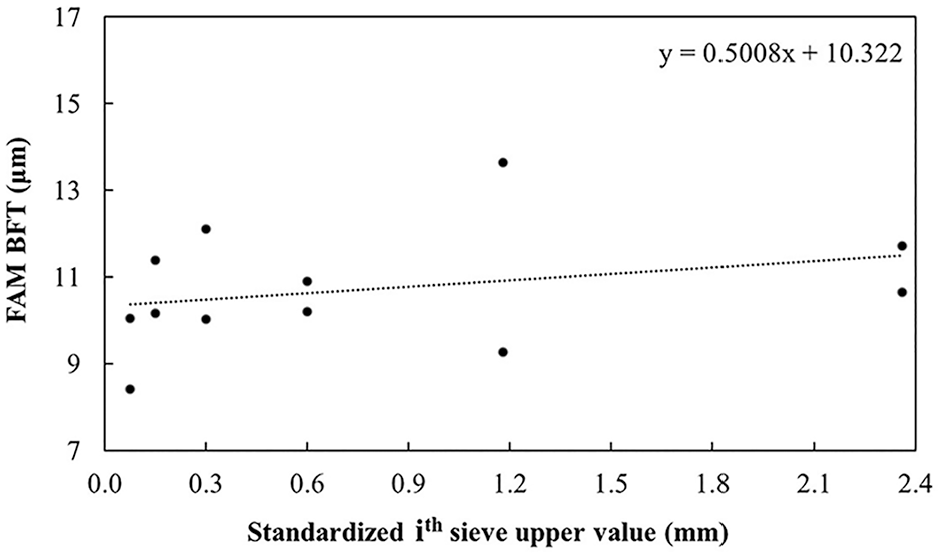
Estimating the BFT of FAM using the Superpave standardized sieves.
FAM Air Voids
Enríquez-León et al. ( 10 ) evaluated the air void content of FAMs within AC mixtures using X-ray micro-computed tomography and digital image processing. The study revealed a significant relationship between the air void content of FAMs and of their corresponding AC. Consequently, the air void content of FAMs can be predicted based on the air void content of the AC mixture, as illustrated in Figure 2.
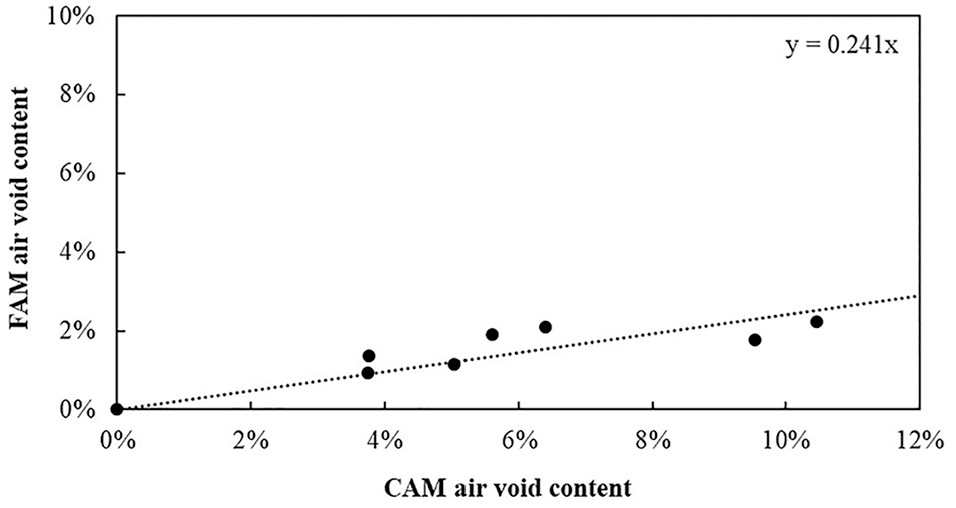
Relationship between FAM air voids and its respective CAM.
FAM MAS
Souza et al. ( 11 ) evaluated the most appropriate MAS to fabricate FAM testing specimens. To this end, AC microstructures were scanned using X-ray micro-computed tomography and digital image processing to perform the segmentation of the aggregates. This segmentation process enabled the researchers to identify the particle size that best represented the FAM phase within the ACs.
In the study, coarse aggregate was defined as a material that is not completely surrounded by mastic or mortar, since the largest air voids within the AC microstructure occupy a significant portion of the coarse aggregate perimeter. In other words, if the regions surrounding the segmented aggregate are composed of many small particles—primarily mineral fillers and fine aggregates—these can be classified as FAMs.
By conducting uniaxial tests, the researchers were able to gather data on the stiffness and fatigue cracking properties of FAMs and ACs. Based on an analysis of the microstructure, stiffness, and fatigue damage performance of the asphalt mixtures, it was determined that AC mixtures were most effectively characterized by FAMs with a MAS of 2.36 mm.
Aggregate Specific Surface Area
Souza et al. ( 8 ) devised a method for determining the specific surface area of fine aggregates through laser diffraction. Except for filler particles, the technique yielded specific surface areas comparable to those obtained using the National Cooperative Highway Research Program (NCHRP) ( 28 ) method, with mean absolute differences of 0.4%.
Moreover, a low coefficient of variation was observed for the specific surface area of both coarse and fine aggregates. Consequently, it can be inferred that the specific surface area parameter has minimal impact on FAM mix design, except in the case of filler particles. Therefore, if the specific surface area of fillers is not considered in the volumetric equations for FAM mix design, the process can be simplified, eliminating the need for an experimental step. This insight is crucial for streamlining FAM volumetric mix design for greater efficiency and practicality.
Overview of Novel Concepts for FAM Mix Design and Sample Fabrication
The five bullets below summarize the FAM mix design criteria recommended by the authors:
Input data requirement for FAM mix design: Complete AC mixture data must be utilized as the input data for designing FAM.
Maximum aggregate size definition: For AC mixtures with nominal maximum aggregate sizes of 19, 12.5, and 9.5 mm, the maximum aggregate size for FAM is defined as 2.36 mm.
Specific surface area measurement: The specific surface area of both coarse and fine aggregates can be determined using the NCHRP method ( 28 ).
BFT estimation: The binder film thickness for FAM mixtures can be estimated using the value of the ith standardized sieves from the mix design.
Evaluation of air voids: FAM air voids for specimen fabrication can be assessed using its relationship with the AC mixture air void content.
Materials
In this study, samples of ACs and FAMs were fabricated to investigate their stiffness and fatigue behavior. The AC and FAM comprised a PG 64S-22 binder and a gneiss aggregate with bulk specific gravities of 2.674 and 2.709 for coarse and fine aggregates, respectively. The Superpave mix design procedures ( 27 ) were followed to produce three ACs with different nominal maximum aggregate sizes (NMASs) of 19.0 mm, 12.5 mm, and 9.5 mm. These ACs, named AC 1, AC 2, and AC 3, had binder contents of 4.3%, 5.3%, and 5.8% respectively.
Then, FAMs corresponding to AC 1, AC 2, and AC 3 were fabricated using two different mix design methods. The first group of FAMs followed the method proposed by Ng et al. ( 24 ) and aimed for a target air void content of 4.5% ± 0.5%, as recommended by Osmari et al. ( 30 ). The second group of FAMs was designed using the framework proposed by Karki ( 14 ) and the aforementioned concepts. In this case, the target air void content for FAM fabrication was determined based on the results presented in Figure 2.
These two FAM mix design methods were selected for the following reasons: The method proposed by Ng et al. ( 24 ) is one of the most recent in the literature and considers key fatigue cracking upscaling results, such as those presented by Osmari et al. ( 32 ). The method proposed by Karki ( 14 ) aligns closely with recent advancements in the characterization of FAM mix design parameters, as discussed in the previous section of this article, thus it was also selected.
The binder film thickness covers both the coarse aggregates and the air voids surrounding them, as proposed by Karki ( 14 ). This assertion was verified through X-ray micro-computed tomography tests and microstructural AC images ( 10 , 11 , 31 ). Furthermore, the aggregate specific surface area determined by Karki ( 14 ) using its FAM mix design method corresponds to the coarse aggregates. As pointed out by Souza et al. (8), coarser aggregates have minimal variations in relation to specific surface area and thus have a negligible effect on the FAM mix design. Therefore, this method was also chosen as a reference for fabricating the FAMs in this study.
In total, three ACs and six FAMs were evaluated in this experimental matrix. The naming convention used for the ACs and FAMs included an identifier (AC or FAM) and a number indicating the related AC mix number. The FAMs designed using the Ng et al. ( 24 ) and Karki ( 14 ) optimized methods were named as NG-FAM and KO-FAM, respectively. For example, NG-FAM 1 represented the FAM derived from AC 1 using the Ng et al. ( 22 ) mix design method. The gradations of the ACs and FAMs are shown in Figure 3. It is noteworthy that the FAM gradations and MAS (2.36 mm) were consistent for both mix design methods, as recommended by Souza et al. ( 11 ). Table 2 provides information on the binder content and target air voids for the fabrication and testing of the ACs and FAMs.
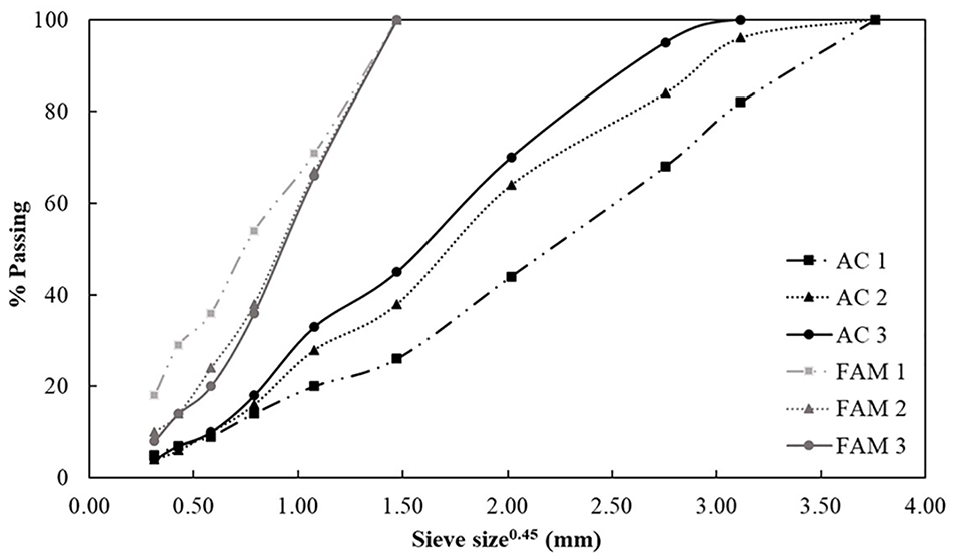
AC and FAM gradation curves.
AC and FAM volumetric characteristics
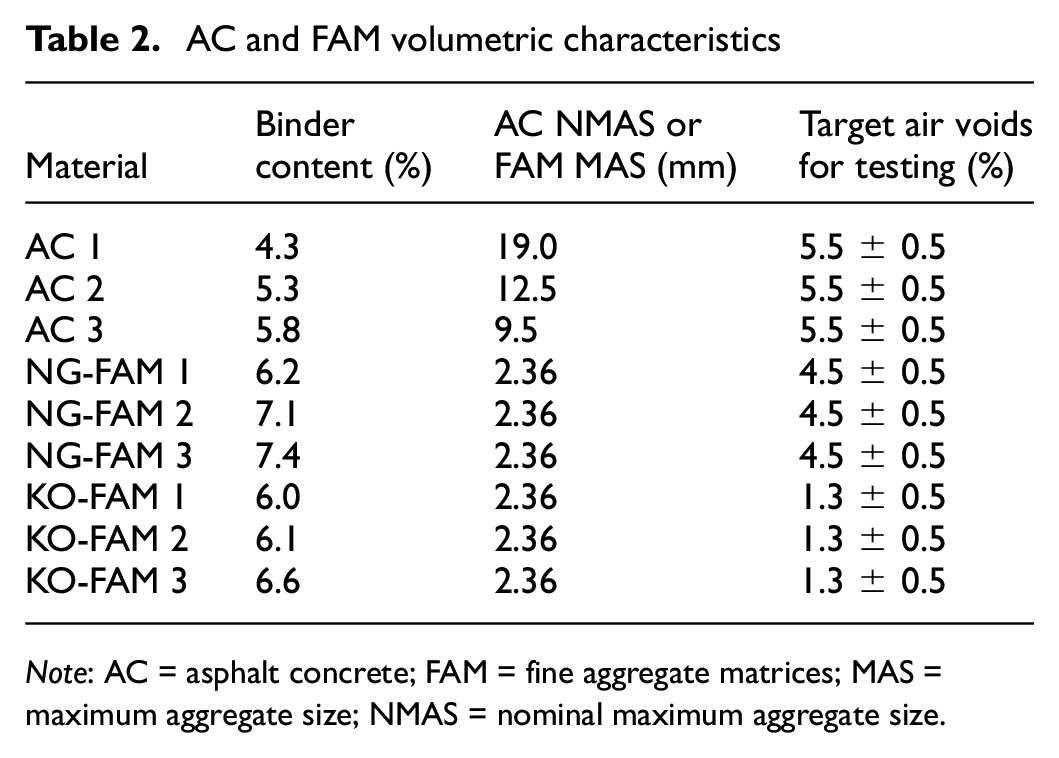
Note: AC = asphalt concrete; FAM = fine aggregate matrices; MAS = maximum aggregate size; NMAS = nominal maximum aggregate size.
Experimental Program
The experimental program consisted of four main steps: FAM mix design, sample preparation, sample testing, and strain ratio analysis. These steps are described below.
FAM Mix Design
The initial step in FAM mix design involved selecting the MAS of the FAMs as 2.36 mm, as recommended by Souza et al. ( 11 ). Subsequently, equations 1 to 3 were employed to determine the mass and percentage of effective binder in the coarse aggregates.


where
i is the value of the ith standardized sieve, in mm.
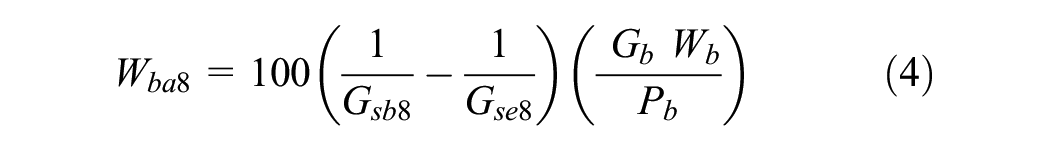
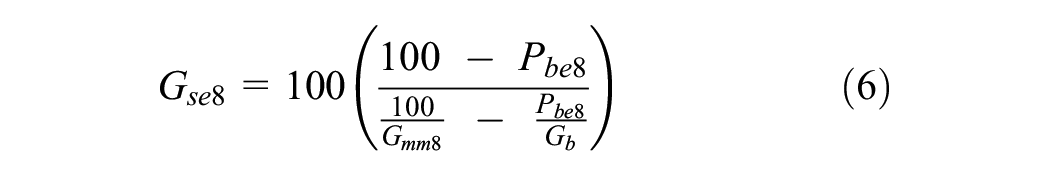
Equations 4 to 6 are employed to calculate the mass and percentage of absorbed binder by coarse aggregates in the subsequent stage.

where
Equation 7 allows for the determination of the binder mass present within the FAM based on the absorbed and effective binder masses of coarse aggregates. Additionally, Equation 8 provides a means to calculate the mass of aggregates that are part of the FAM by subtracting the masses of CAM aggregates and coarse aggregates.


where.
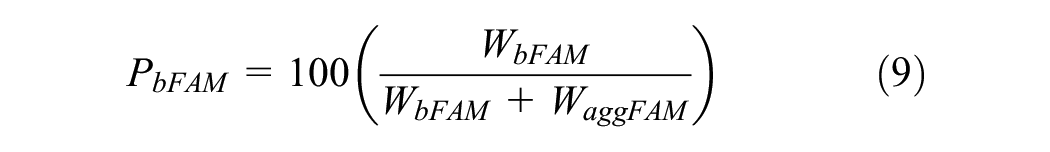
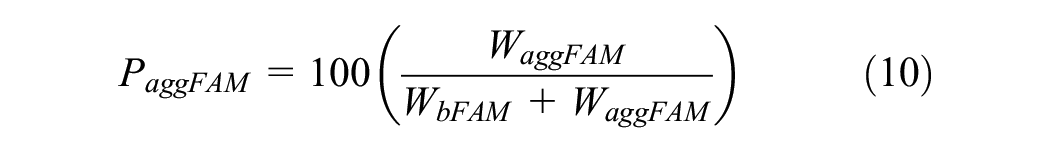
Finally, the percentage of binder and aggregates within the FAM can be calculated using Equations 9 and 10.
where
Sample Preparation
AC specimens measuring 100 mm in diameter and 100 mm in height were compacted using a Superpave gyratory compactor (SGC) at a rate of 30 gyrations per minute, compaction pressure of 600 kPa, and internal gyration angle of 1.16°. Prior to fabrication, the loose AC mixtures were kept in an oven for two hours at the compaction temperature to simulate short-term aging. The compaction process was based on a fixed height of 100 mm and the maximum specific gravity of the mixture, rather than a set number of gyrations.
FAM samples, on the other hand, had a diameter of 150 mm and a height of 100 mm, and were initially compacted under the same conditions as the AC samples. Each of the six FAMs in Table 2 was compacted into a single gyratory sample, which was then cut to a height of 50 mm using a saw. Testing specimens were cored from these samples using a drill with an inner diameter of 25 mm to produce smaller FAM specimens ( 30 ). Cold water was continuously provided to the saw and to the drill to ease the trimming and coring processes.
Sample Testing
Three samples of each AC mixture with air voids of 5.5% ± 0.5% were chosen for analysis of their linear viscoelastic properties using a servo-hydraulic testing machine. The dynamic modulus (|E*|) of the AC mixtures was determined through uniaxial loading frequency sweep tests according to AASHTO T 342 ( 34 ). The haversine cyclic loads were adjusted to ensure linearity of the viscoelastic responses at strain levels between 50 με and 75 με ( 15 ).
The testing conditions included frequencies of 25 Hz, 10 Hz, 5 Hz, 1 Hz, 0.5 Hz, and 0.1 Hz, in descending order, and temperatures of 4°C, 20°C, and 40°C, from lowest to highest. The AC |E*| master curves were plotted at 20°C using the frequency–temperature superposition principle.
Five specimens of each AC mixture with 5.5% ± 0.5% air voids were utilized to assess their fatigue damage performance with a servo-hydraulic testing machine. Uniaxial tensile-compressive loading tests with controlled deformations were conducted to establish the damage characteristic curve of the ACs based on the S-VECD theory.
The damage characteristic curve of the AC mixture calculates the material damage evolution (S) and the pseudo secant modulus (C), also known as integrity. Failure was assumed to occur at the cycle (Nf) corresponding to the maximum phase angle during cyclic fatigue tests, following the fatigue failure criterion proposed by Sabouri and Kim ( 35 ). The average pseudo strain energy release rate (GR) was determined to evaluate the fatigue performance of the ACs, in accordance with AASHTO TP107 ( 36 ) recommendations.
FAM testing adhered to the same principles outlined for AC mixtures. In contrast to the AC mixtures, the typical strain levels applied during the FAM tests ranged from 500 με to 1000 με (peak-to-peak). Three small samples cored from each FAM specimen with air void contents of 1.3% ± 0.5% were chosen to evaluate their |E*| using a servo-hydraulic testing apparatus. This air void content was determined based on the identification of FAM air voids within AC mixtures using X-ray micro-computed tomography tests ( 10 ). Additionally, five testing samples of each FAM with identical air void content as for the |E*| were selected to assess their fatigue damage performance.
Strain Ratio Analysis
An analysis was conducted to determine the strain levels experienced by the AC and the corresponding FAM mixtures, resulting in equivalent fatigue lives for both materials. Firstly, the strains of 100 µε and 200 µε were used to determine the area under the Nf versus strain curve for the ACs. These results were so-called AC fatigue factors (FFAC), as suggested by Nascimento ( 37 ). Then, the strains levels were adjusted for the FAMs to obtain the same FFAC found for the corresponding AC.
It is noteworthy that for the simulations, it was supposed that all AC damage occurred in the FAM, thus possible interfacial damage between the aggregates and the binder and within the aggregates were neglected ( 30 ). The strain ratio was defined as the ratio between the FFAC and the FAM fatigue factors (FFFAM).
Osmari et al. ( 30 ) suggested an analytical method to incorporate the volumetric effect of the FAM content into the damage properties of the asphaltic materials. To this end, an adaptation to the S-VECD formulation was proposed to calculate the damage level in the AC mixture and in the corresponding FAM. This method was also applied in this article to study the FAM/AC strain ratio.
Results and Discussion
This section is divided into two parts: stiffness characterization and fatigue damage performance.
Stiffness Characterization
Figures 4 to 9 present the results of the |E*| master curves and phase angle for the ACs and for their respective FAMs at the reference temperature of 20°C. It is worth noting that the initial part of the |E*| master curve was not considered, as the stiffness of the FAMs at high temperatures such as 40°C or 54°C was not evaluated. As shown, the FAMs designed with the KO-FAM methodology were stiffer than those designed with the NG-FAM methodology. This fact can be justified by the lower binder content of KO-FAM when compared to NG-FAM.
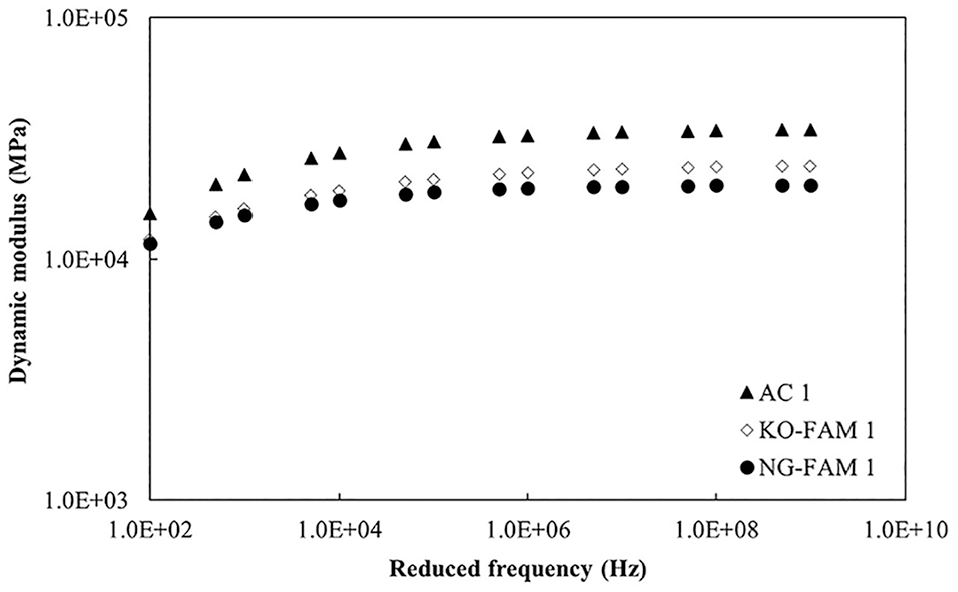
Dynamic modulus of AC 1 and of its respective FAMs.
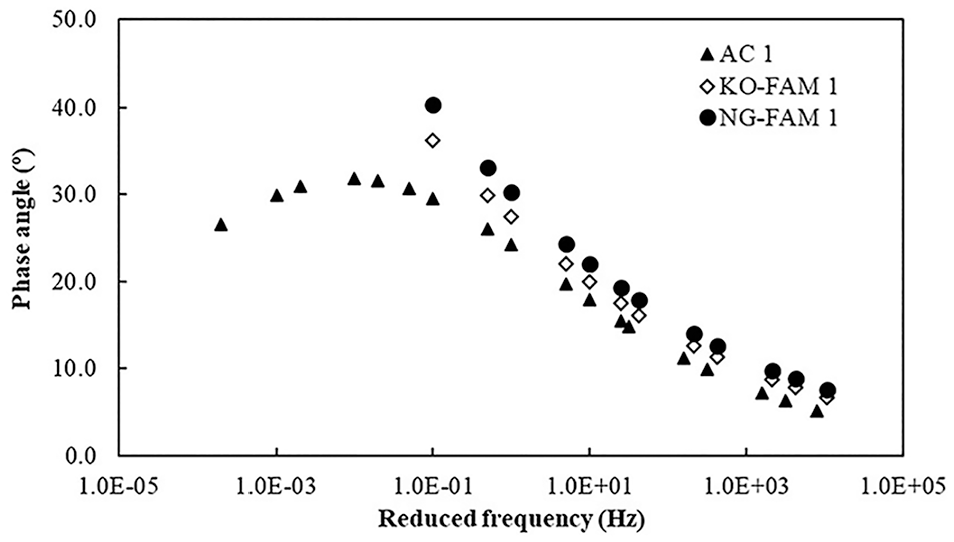
Phase angle of AC 1 and of its respective FAMs.
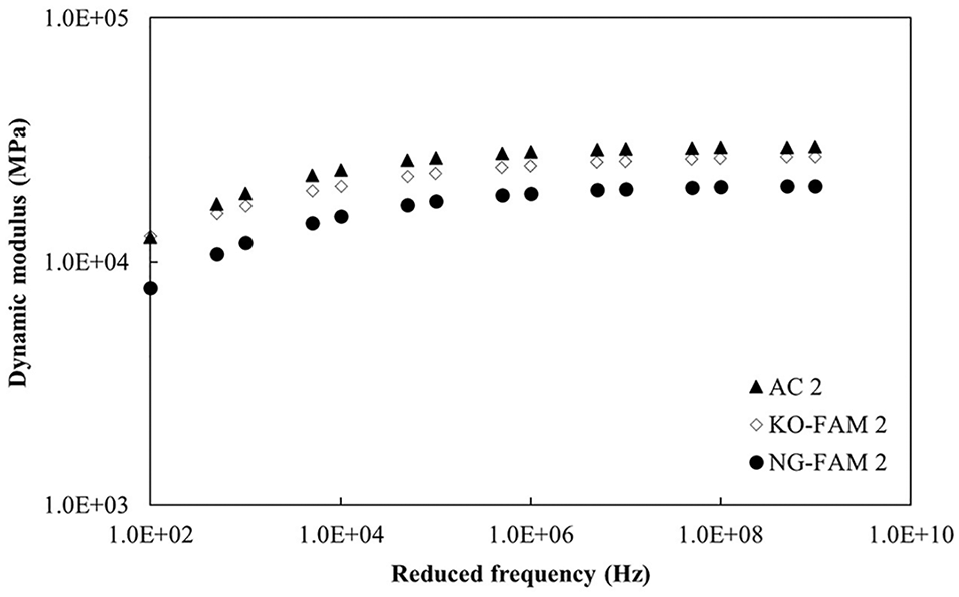
Dynamic modulus of AC 2 and of its respective FAMs.
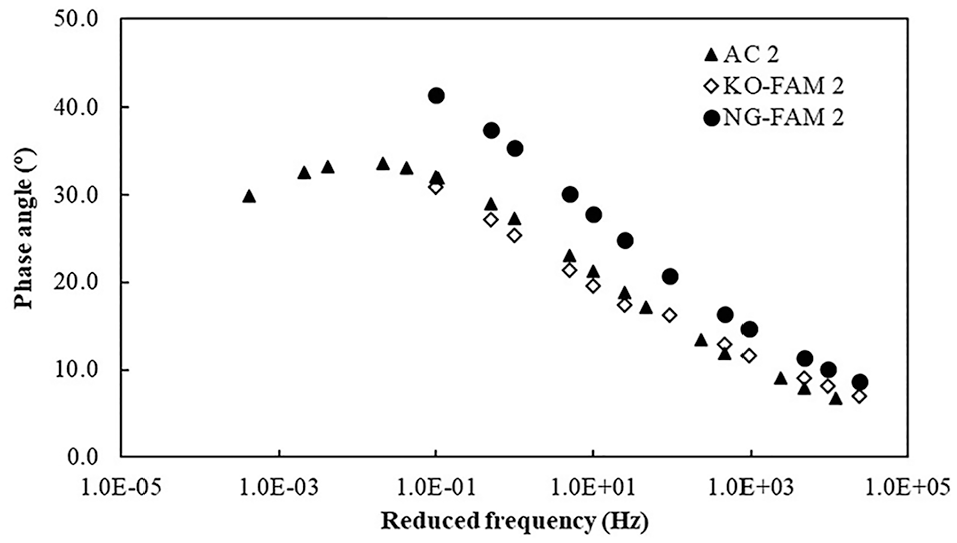
Phase angle of AC 2 and of its respective FAMs.
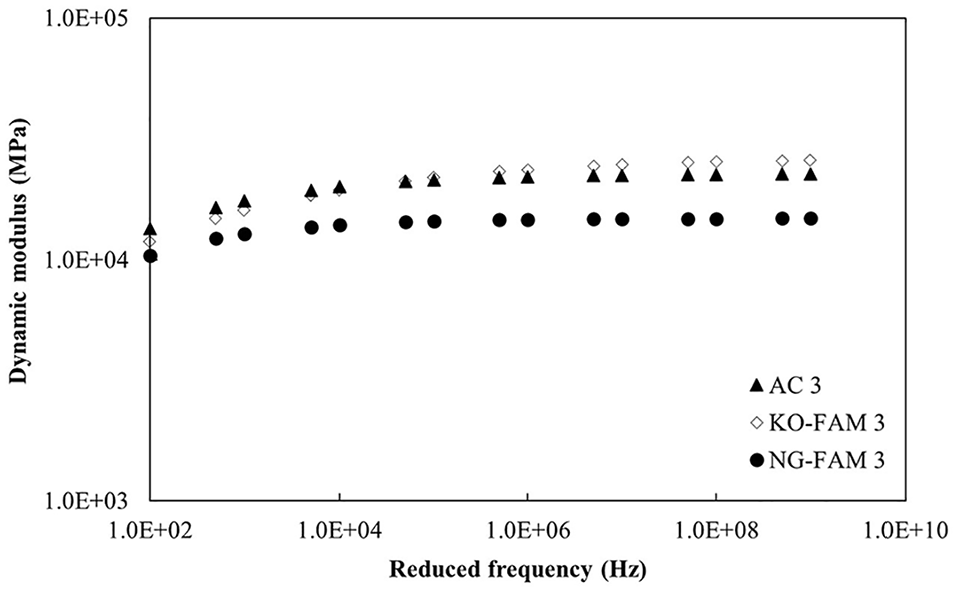
Dynamic modulus of AC 3 and of its respective FAMs.
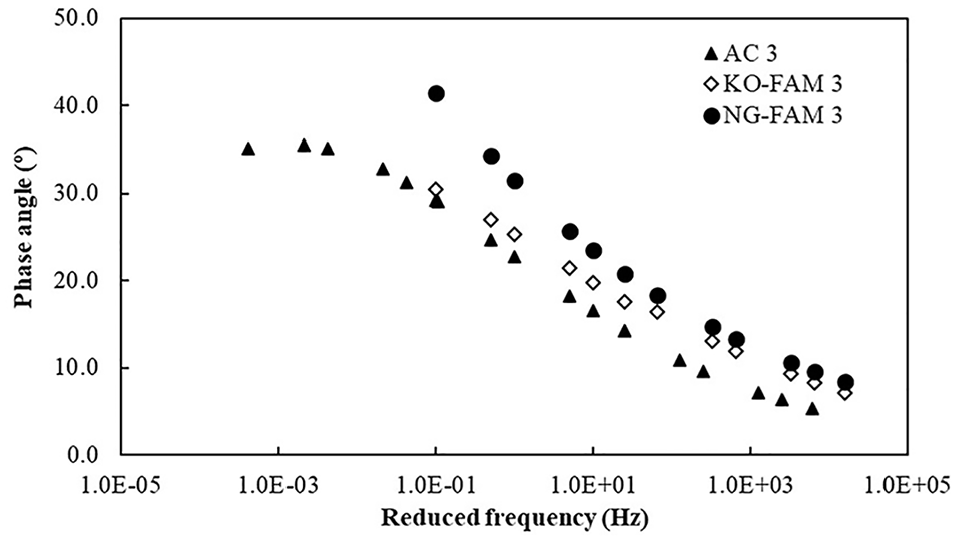
Phase angle of AC 3 and of its respective FAMs.
The |E*| results did not vary significantly between the different FAMs. Therefore, Fisher-Snedecor ( 38 ) statistical analyses were performed to confirm whether they were statistically equivalent. Considering the F-distribution ( 38 ) and a significance level of 0.05, the F-statistics were 1.06, 1.21, and 1.37 for the FAMs corresponding to AC 1, AC 2, and AC 3, respectively. If the F-statistic is smaller than the one-sided critical F, it can be concluded that the results are statistically equivalent. In these cases, the one-sided critical F was 2.82. This result indicates the equivalence of the mean |E*| results for the FAMs of ACs 1 to 3.
Although the results of |E*| were statistically equivalent, KO-FAM exhibited |E*| and phase angle master curves that were more closely aligned with those of the corresponding ACs, compared to the |E*| and phase angle master curves of NG-FAM, especially for ACs 2 and 3. This implies that the coarse aggregate particles in the mixture primarily contributed to the elastic behavior of the materials, without introducing significant complexities to their time-dependent response. When considering the ACs as a reference, the |E*| root-mean-square error (RMSE) values for KO-FAM 1 to 3, and NG-FAM 1 to 3 were 7,611.9, 4,082.6, 2,948.4, 8,514.6, 7,776.9, and 5,249.8, respectively. This indicates that the |E*| RMSE results for KO-FAM differed from those of NG-FAM by 10.6%, 47.5%, and 43.8% for materials 1 to 3, respectively.
This finding supports the concept that the FAM mix design proposed in this study offers the potential to ensure a simplistic relationship between the modulus of the FAM and the AC. If a straightforward correlation exists, it could simplify modeling and prediction of the mechanical behavior of such composite materials, allowing the development of more accurate upscaling models.
Fatigue Damage Performance
Figures 10 to 12 show the damage characteristic curves of the FAMs and ACs. Initially, with less damage, the integrity of the ACs was significantly higher. However, as the degree of damage increased, the integrity of the ACs deteriorated faster than that of the corresponding FAMs. Interestingly, FAMs designed using the KO-FAM method exhibited poorer behavior when exposed to lower levels of damage; nevertheless, they exhibited greater resistance to fatigue as the level of damage increased. A more detailed analysis to identify the reasons for this behavior is beyond the scope of the current study.
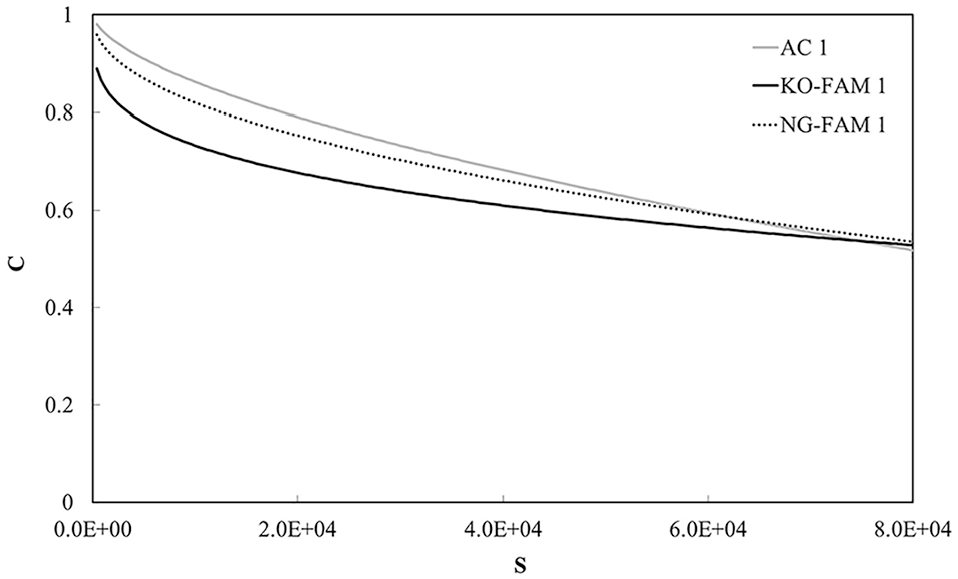
Damage characteristic curve for AC 1 and its respective FAMs.
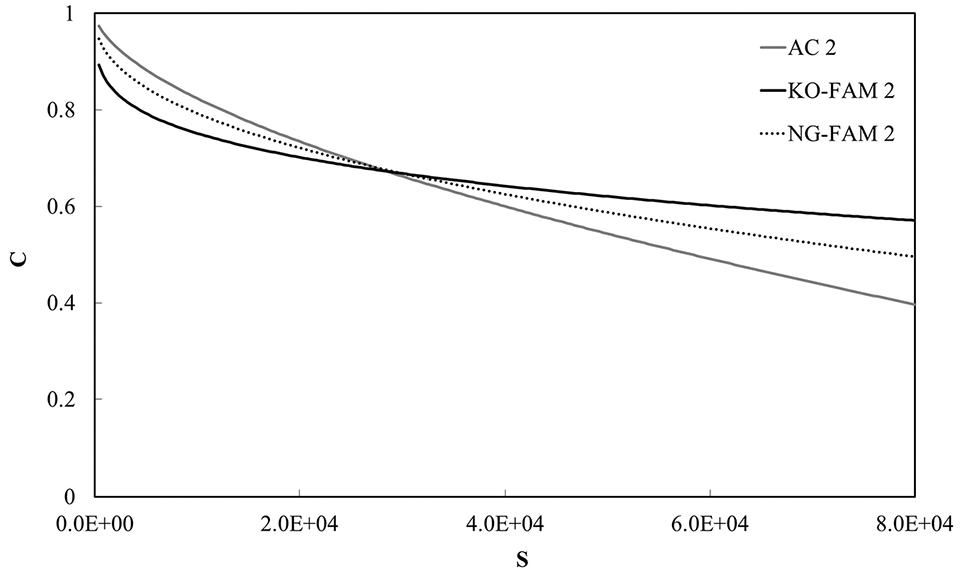
Damage characteristic curve for AC 2 and its respective FAMs.
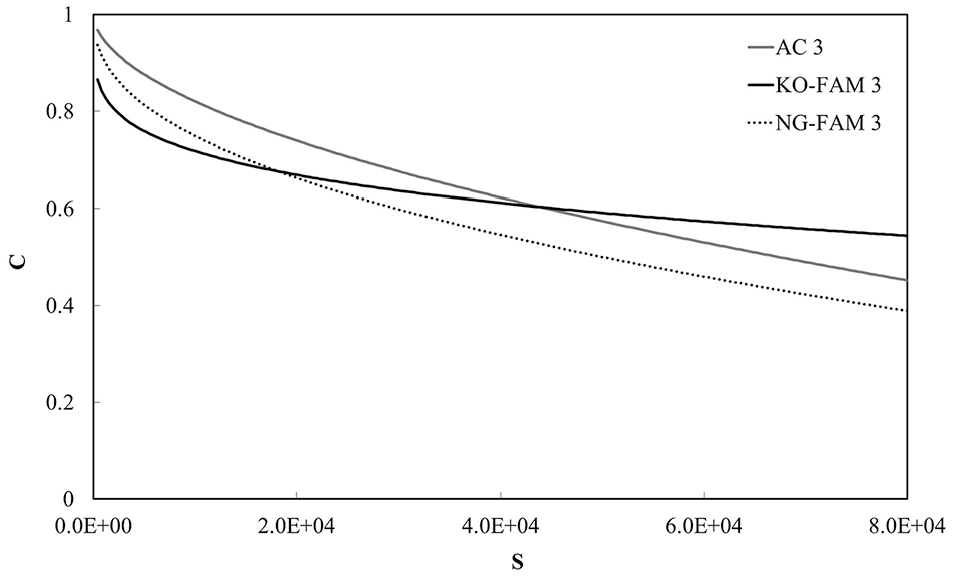
Damage characteristic curve for AC 3 and its respective FAMs.
The damage characteristic curve results did not vary significantly between the different FAMs. Therefore, Fisher-Snedecor ( 38 ) statistical analyses were performed to confirm whether they were statistically equivalent. Considering the F-distribution ( 38 ) and a significance level of 0.05, the F-statistics were 0.47, 0.34, and 0.21 for the FAMs corresponding to AC 1, AC 2, and AC 3, respectively. If the F-statistic is smaller than the one-sided critical F, it can be concluded that the results are statistically equivalent. In these cases, the one-sided critical F was 0.84. This result indicates the equivalence of the results of the damage characteristic curve results for the FAMs from ACs 1 and 3.
To facilitate the comparison of fatigue properties between the materials, a fatigue life simulation was then performed. Figures 13 to 15 show the analytical fatigue life (Nf) versus strain (µε) simulation data obtained from the C versus S curve regression constants and the fatigue failure criterion GR, according to AASHTO TP 107 ( 36 ) for the ACs and their corresponding FAMs.
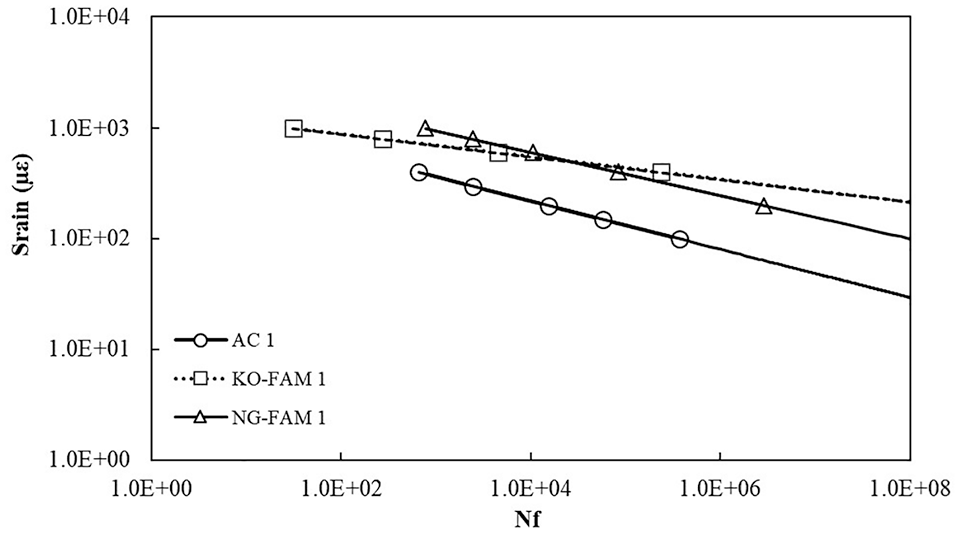
Fatigue life for AC 1 and its respective FAMs.
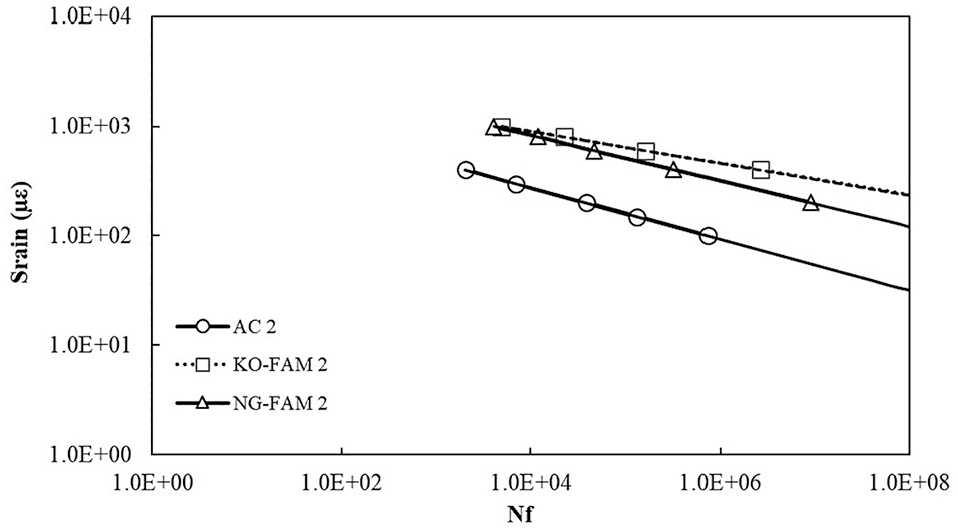
Fatigue life for AC 2 and its respective FAMs.
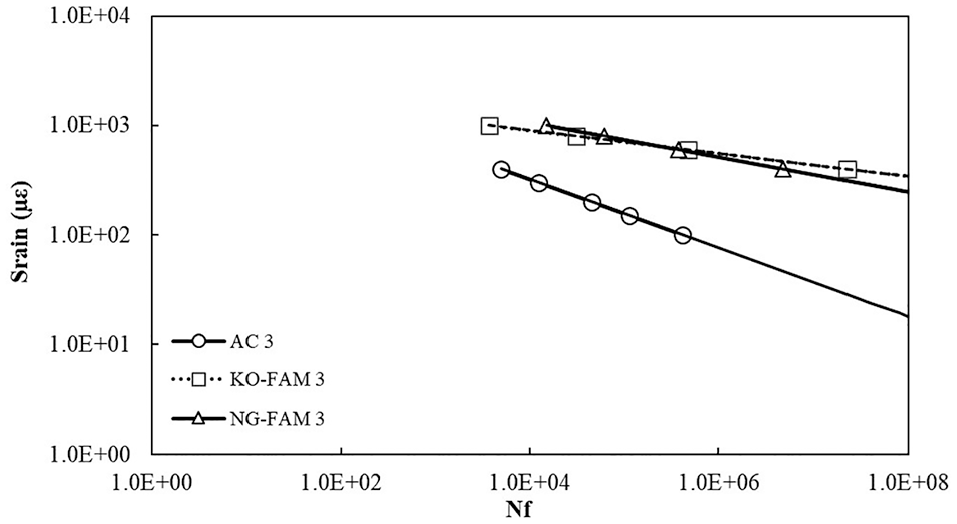
Fatigue life for AC 3 and its respective FAMs.
The fatigue performance of mixtures AC 2 and 3 demonstrated similar results, showcasing an overall longer fatigue life compared to AC 1 across all strain magnitudes assessed. This observation may be attributed to the NMAS utilized in the composition of these mixtures. It appears that employing smaller NMAS contributes to an extended fatigue life. FAMs 2 and 3 exhibited comparable fatigue lives regardless of the FAM mix design utilized, whereas FAM 1 displayed varying fatigue lives based on the FAM mix design.
With the exception of AC 2, KO-FAM displayed similar trends to the corresponding ACs in contrast to NG-FAM for Nf values below 1.0E+04. Figures 16 and 17 depict the correlations between the FAM/AC strain ratio and the FAM content in each AC mixture for the two sets of data, namely FFFAM derived from NG-FAM and KO-FAM materials in conjunction with the findings reported by Osmari ( 39 ). Furthermore, the newly derived power-law curves from this study are illustrated in Figures 16 and 17.
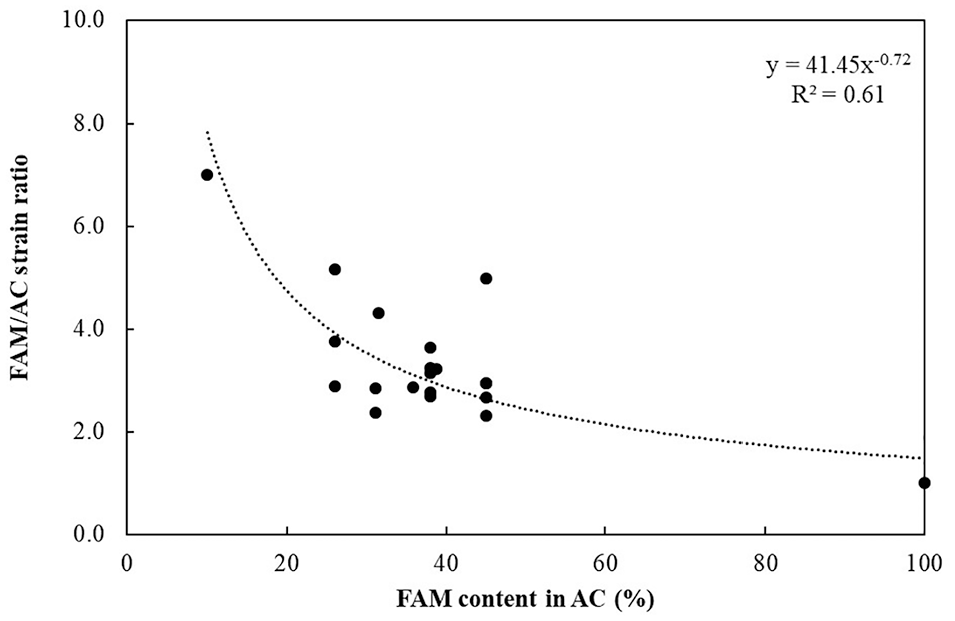
FAM/AC strain ratio considering NG and Osmari ( 39 ) FAMs.
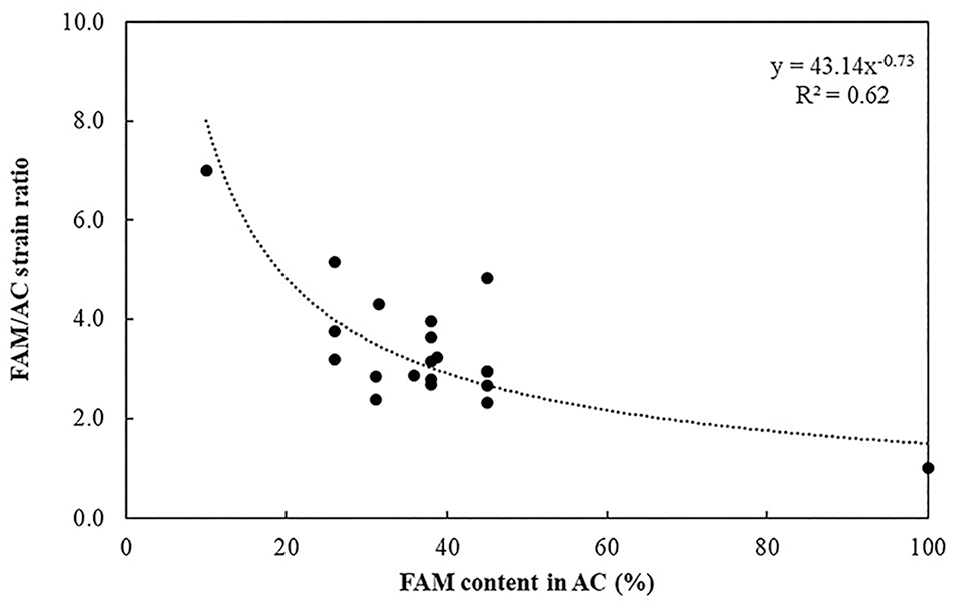
FAM/AC strain ratio considering KO and Osmari ( 39 ) FAMs.
The FAM/AC strain ratio for both FAM mix designs evaluated in this study ranged from 2.9 to 5.0 using the analytical method proposed by Osmari ( 39 ). Gudipudi et al. ( 5 ) discovered a strain ratio between 3.0 and 5.4, which aligns with the findings of this study.
In Figures 16 and 17, higher amounts of FAM resulted in increased overall deformability of the corresponding AC, indicating that the FAM/AC strain ratios were significantly affected by the amount of FAM present in the AC mixtures. These results illustrate a connection between the NMAS and the FAM/AC strain ratio. It is anticipated that finer AC mixtures, that is those with smaller NMAS, will behave more similarly to their FAMs. This is in line with the strain ratios observed for the larger NMAS mixtures, as an increase in the amount of larger aggregates may affect the strain distribution in the materials.
The KO-FAM and NG-FAM mix designs exhibited about the same power law coefficient of determination, 0.62 and 0.61, respectively. Therefore, it can be concluded that both methods matched similarly the FAM/AC strain ratio, offering a relatively good accuracy in predicting the fatigue life of AC mixtures through upscaling. However, future studies should focus in a comprehensive comparison among various FAM mix design methods, including those proposed in this research, as well as in the evaluation of the results for other types of binders, aggregates, FAMs, and AC mixtures. Additional statistical analysis is essential to compare the effectiveness of different FAM mix design approaches.
Summary and Conclusions
This article introduced an innovative optimized volumetric FAM mix design and fabrication technique that incorporates recent developments in characterizing key asphalt material parameters, such as asphalt binder film thickness, aggregate specific surface area, FAM air voids, and FAM maximum aggregate size. The main findings of this study can be summarized as follows:
The advancement of a standardized method for FAM mix design plays a crucial role in the progress of upscaling approaches. This procedure should focus on defining FAM mix design criteria and guidelines to reduce variability in testing, guaranteeing uniform FAM volumetric and mechanical characteristics. Standardizing this process is critical for forecasting the overall performance of asphalt materials. This research presents insights for the future implementation of this procedure.
Unlike some current FAM mix design methods in the literature, the approach detailed in this research incorporates data derived from laboratory tests. This methodology improves the dependability of the process by minimizing dependence on arbitrary or empirical values in FAM mix design.
The FAM mixtures designed using the developed mix design procedures have the potential to ensure a simplistic relationship between the dynamic modulus of the FAM and the AC, and to better predict the fatigue cracking phenomenon through the strain ratio relationship between the different material scales. Therefore, the novel optimized FAM mix design shows potential as a promising tool for replicating the mechanical and volumetric characteristics of the corresponding asphalt mixture.
Other key factors that significantly influence the performance of asphaltic materials include aggregate packing, shape, and texture, and binder type. The authors recommend that future FAM mix design refinements and studies incorporate an analysis of aggregate packing at both the FAM and AC scales, evaluations of shape and texture, and the replication of experiments using different types of binders.
This research focused on a comprehensive investigation for the refinement of volumetric-based FAM mix design and sample fabrication procedures. The findings presented in the article are pivotal for advancing FAM mix design protocols and contribute to the fabrication of representative testing specimens that closely reproduce the FAM found in AC mixtures. By utilizing upscaling techniques, the methodology presented in the study may facilitate the generation of more durable asphalt materials and provide insights into the complex behavior of asphalt mixtures when subjected to varying traffic and environmental conditions in real-world scenarios.
Footnotes
Author Contributions
The authors confirm contribution to the paper as follows: study conception and design: T. D. de Souza, F. T. S. Aragão; data collection: T. D. de Souza, F. T. S. Aragão, C. R. R. R. de Souza, M. L. Rocha, A. J. Enríquez-León; analysis and interpretation of results: T. D. de Souza, F. T. S. Aragão; draft manuscript preparation: T. D. de Souza, F. T. S. Aragão. All authors reviewed the results and approved the final version of the manuscript.
Declaration of Conflicting Interests
The author(s) declared no potential conflicts of interest with respect to the research, authorship, and/or publication of this article.
Funding
The author(s) disclosed receipt of the following financial support for the research, authorship, and/or publication of this article: The authors are grateful for the financial support received from the Brazilian National Council for Scientific and Technological Development (CNPq), the Carlos Chagas Filho Foundation for Research Support in Rio de Janeiro (FAPERJ), the Brazilian Coordination for the Improvement of Higher Education Personnel (CAPES)—Finance Code 001, and the CENPES/PETROBRAS Research Center.