
Abstract
To reduce the environmental effect of transportation, departments of transportation are incorporating cold recycling technologies, such as full-depth reclamation (FDR) in their rehabilitation strategies. One of the limitations of FDR is the paucity of available information on the material properties of these mixtures and their long-term performance. The aim of this project is to compare the long-term performance and life-cycle costs of FDR with those of traditional mill-and-overlay. For each alternative, a set of reference sections across Colorado was analyzed. Historical information of costs, maintenance history, and pavement roughness conditions were characterized using statistical analyses. This information was then incorporated in a probabilistic analysis using Monte Carlo simulation to estimate life-cycle costs, long-term roughness conditions, and cost-effectiveness for both rehabilitation alternatives. FDR was found to be a more cost-effective rehabilitation solution than overlays. On average, the life-cycle cost of FDR pavements is $259,886 per lane mile less expensive than overlay pavements, resulting in a potential cost saving of 38%. FDR pavements also have a better long-term roughness performance than overlays. Over the 10-year analysis, FDR pavements have an average roughness, measured using the International Roughness Index, of 100 in./mi, compared with 107 in./mi for overlays. Future research to analyze the environmental effects of these alternatives is recommended to fully capture the benefits of FDR rehabilitation.
Keywords
Transportation plays a critical economic role and is now the U.S.A.’s biggest emitter of greenhouse gas emissions ( 1 ). To reduce the environmental effect of transportation, departments of transportation (DOTs) are incorporating cold recycling technologies, such as full-depth reclamation (FDR) as an alternative for pavement rehabilitation ( 2 ). FDR involves pulverizing and reusing materials from distressed pavements, producing a new base mixture. One of the limitations hindering the deployment of FDR is the paucity of information available on the material properties of these mixtures ( 2 – 7 ). Previous research ( 7 – 9 ) has shown that default values used in the mechanistic-empirical design of recycled pavements are non-representative and overly conservative, leading to an underestimation of the true performance capabilities of these materials. This ultimately results in a significant loss of potential for cost and resource savings or even reluctance from some DOTs to specify the use of cold recycling techniques, such as FDR ( 9 ). To better understand the characteristics of FDR mixes, researchers have performed laboratory studies and provided reference values of the modulus and structural properties of FDR materials ( 5 , 7 , 10–12). To select the most appropriate pavement design or rehabilitation for a given situation, it is necessary to understand how the pavement properties and in-service conditions relate to performance and life-cycle cost ( 13 ). The aim of this study is to further advance our knowledge in FDR and perform a life-cycle cost analysis (LCCA) to compare traditional rehabilitation strategies based on mill-and-overlay with FDR.
There are relatively few studies analyzing the deterioration and life-cycle costs of FDR. Bemanian et al. ( 14 ) conducted a study in which FDR was used when pavements began to exhibit structural deficiencies. Using a deterministic LCCA, they found that the use of FDR resulted in cost savings in the rehabilitation of low-volume roads. Diefenderfer and Apeagyei ( 15 ) found, through periodic deflection testing, that the structural capacity of asphalt and cement-based FDR pavements increased between 3 weeks and 24 months after construction, and found that cost savings derived from FDR could approach $37,000 per lane mile. Beesam and Torres-Machi ( 7 ) compared actual pavement roughness and mechanistic-empirical predictions and found that the International Roughness Index (IRI) is often overestimated for FDR projects. FDR was found to display better performance over time than predicted; although the economic implications of this finding were not estimated. Evers and Torres-Machi ( 16 ) developed machine learning models to estimate the roughness, rutting, and fatigue cracking of FDR pavements and compared the accuracy of these models with results derived from mechanistic-empirical models used in pavement design. They found that FDR is significantly more cost-effective than predicted by mechanistic-empirical models and that improvements in the accuracy of FDR deterioration may result in better informed decision-making.
Overall, these studies demonstrate the potential of FDR as a cost-effective and environmentally friendly alternative for pavement design. These studies, however, are limited to FDR and do not include comparisons with other rehabilitation alternatives—a critical aspect to support decision-making. To our knowledge, the only study comparing FDR with other rehabilitation alternatives is the work by Braham ( 17 ), who analyzed the costs of chip seals, overlays, mill and fill, and complete reconstruction for three different FDR solutions. In that study, rehabilitation alternatives were compared from an economic and structural perspective and FDR was found to be an economically competitive alternative to other rehabilitation methods.
A review of the existing literature suggests that a substantial quantity of research is needed to explore both the deterioration and costs of FDR pavements using a probabilistic LCCA. To address this gap, this study is a comparison of the long-term roughness performance of 10 FDR and 12 overlay sites constructed through the state of Colorado. The comparison includes an analysis of long-term deterioration, as well as life-cycle cost, using a probabilistic approach with Monte Carlo simulations to capture the uncertainty in model inputs. A probabilistic analysis includes a mean, variance, and probability distribution to characterize the variables influencing the evaluation, in contrast to a more simplistic deterministic approach that incorporates a single point value ( 13 ). This probabilistic perspective is strongly recommended by the Federal Highway Administration (FHWA) in the comparison of design alternatives ( 18 ) and is used in this study to account for uncertainties in the deterioration process, the effect of maintenance activities in pavement performance, and the cost of construction and maintenance. This study is valuable for researchers and pavement designers interested in having a better understanding of the deterioration trends and life-cycle costs of FDR pavements, compared with traditional overlays.
Methods
The objective of this study is to analyze the long-term performance and life-cycle costs of FDR and compare this rehabilitation solution with traditional overlays. To accomplish this, three steps were followed.
Reference Sections. Ten FDR and twelve overlay sites were selected for this study. The sites are located throughout several areas in the state of Colorado. We obtained long-term performance data of these reference sections from the Colorado DOT (CDOT) pavement management system. Economic data related to construction and maintenance were also collected.
Analysis of Long-Term Performance. The long-term performance of the reference sections was analyzed, using roughness, cracking, and rutting to derive conclusions on the long-term performance and maintenance needs of both pavement types.
Life-Cycle Cost and Long-Term Performance Analysis. To compare the life-cycle costs of FDR and overlay pavements and account for the uncertainties in costs, deterioration, and performance, a probabilistic approach was taken.
Reference Sections
In this project, two rehabilitation strategies were analyzed: FDR and traditional overlays (the latter including both mill and overlays and leveling and overlays). The sites in our analysis (10 FDR and 12 overlay sites) are evenly spread out across all the five CDOT regions (Figure 1). Eight sites are located in Region 1 (the Denver metropolitan area or Central Colorado), one in Region 2 (Southeast Colorado), three in Region 3 (Northwest Colorado), five in Region 4 (Northeast Colorado), and four in Region 5 (Southwest or South Central Colorado). Many of the sites neighbor at least one other site, with the exclusion of FDR 3, 7, 9, 10, and OL 7. These sites have no close or neighboring roads with a similar climate.
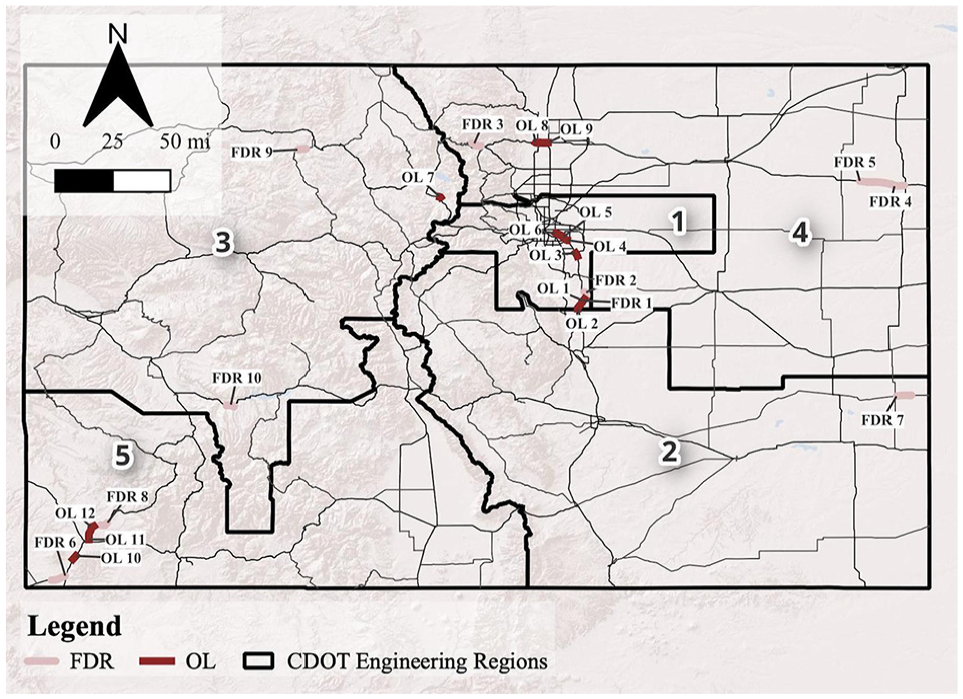
Site locations.
The FDR pavements analyzed in this study are composed of 8 to 12 in. of FDR, followed by 4 to 5 in. of hot-mix asphalt. Overlay roads consist of a 2–4 in. layer of hot-mix asphalt that is added on top of the existing pavement. It is worth noting that both mill-and-overlay and level-and-overlay strategies were used at the overlay sites; this might affect the performance of these overlay solutions. Given the limited number of cases available for analysis, both strategies were analyzed as overlay solutions and future research is recommended to further analyze the distinction. The sites under analysis were rehabilitated between 2005 and 2014. As of 2023, the average age for FDR roads is 14 years, whereas that for overlay roads is 12 years. Tables 1 and 2 show the ages of each of the sites and the types and thicknesses of the layers. Note that the surface course of pavements is subdivided into two layers: the wearing course (sometimes referred to as the top lift) and the binder course (also known as the bottom lift). These layers are SuperPave mix designs that include performance graded (PG) asphalt binder, a gyratory compaction level (75 for most of the mixes in this case study), and aggregate gradation (S or SX in most of the sites analyzed in this study). It is worth noting that two of the overlay sites include layers of stone matrix asphalt (SMA) and one hot bituminous pavement (HBP). The technical specifications for these mixes are detailed in CDOT’s construction specifications ( 19 ).
Age, Thicknesses, and Layer Type of Full-Depth Reclamation (FDR) Pavements
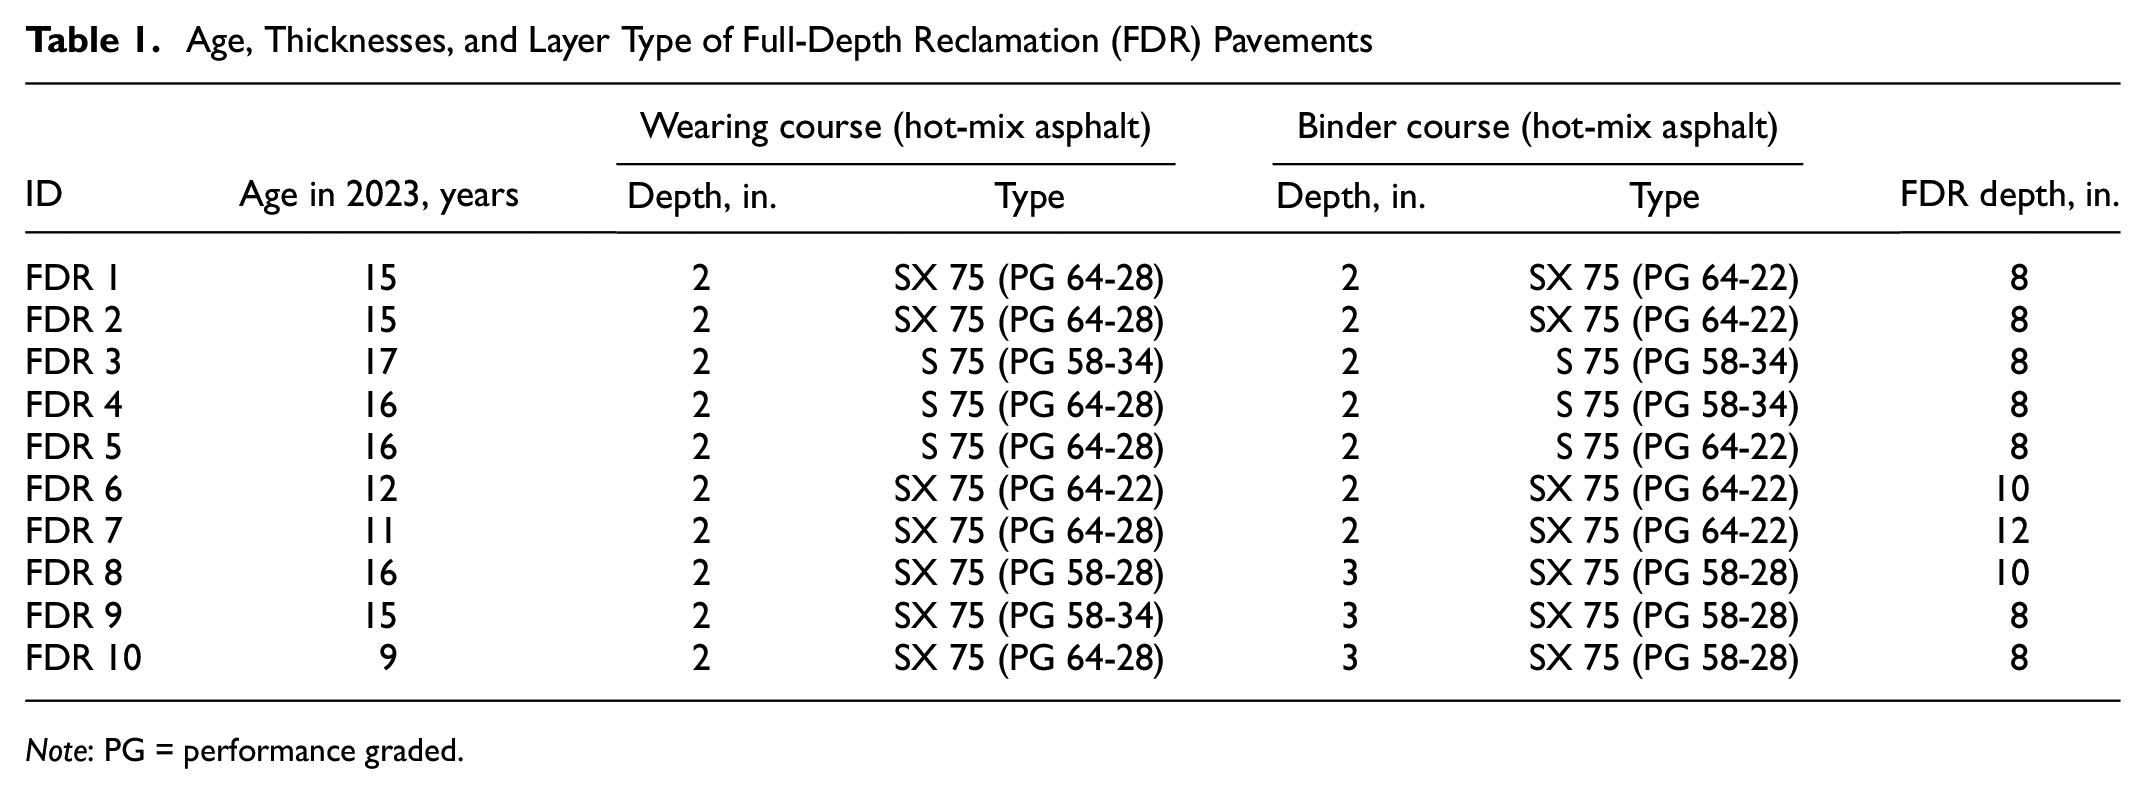
Note: PG = performance graded.
Age, Thicknesses, and Layer Type of Overlay (OL) Pavements
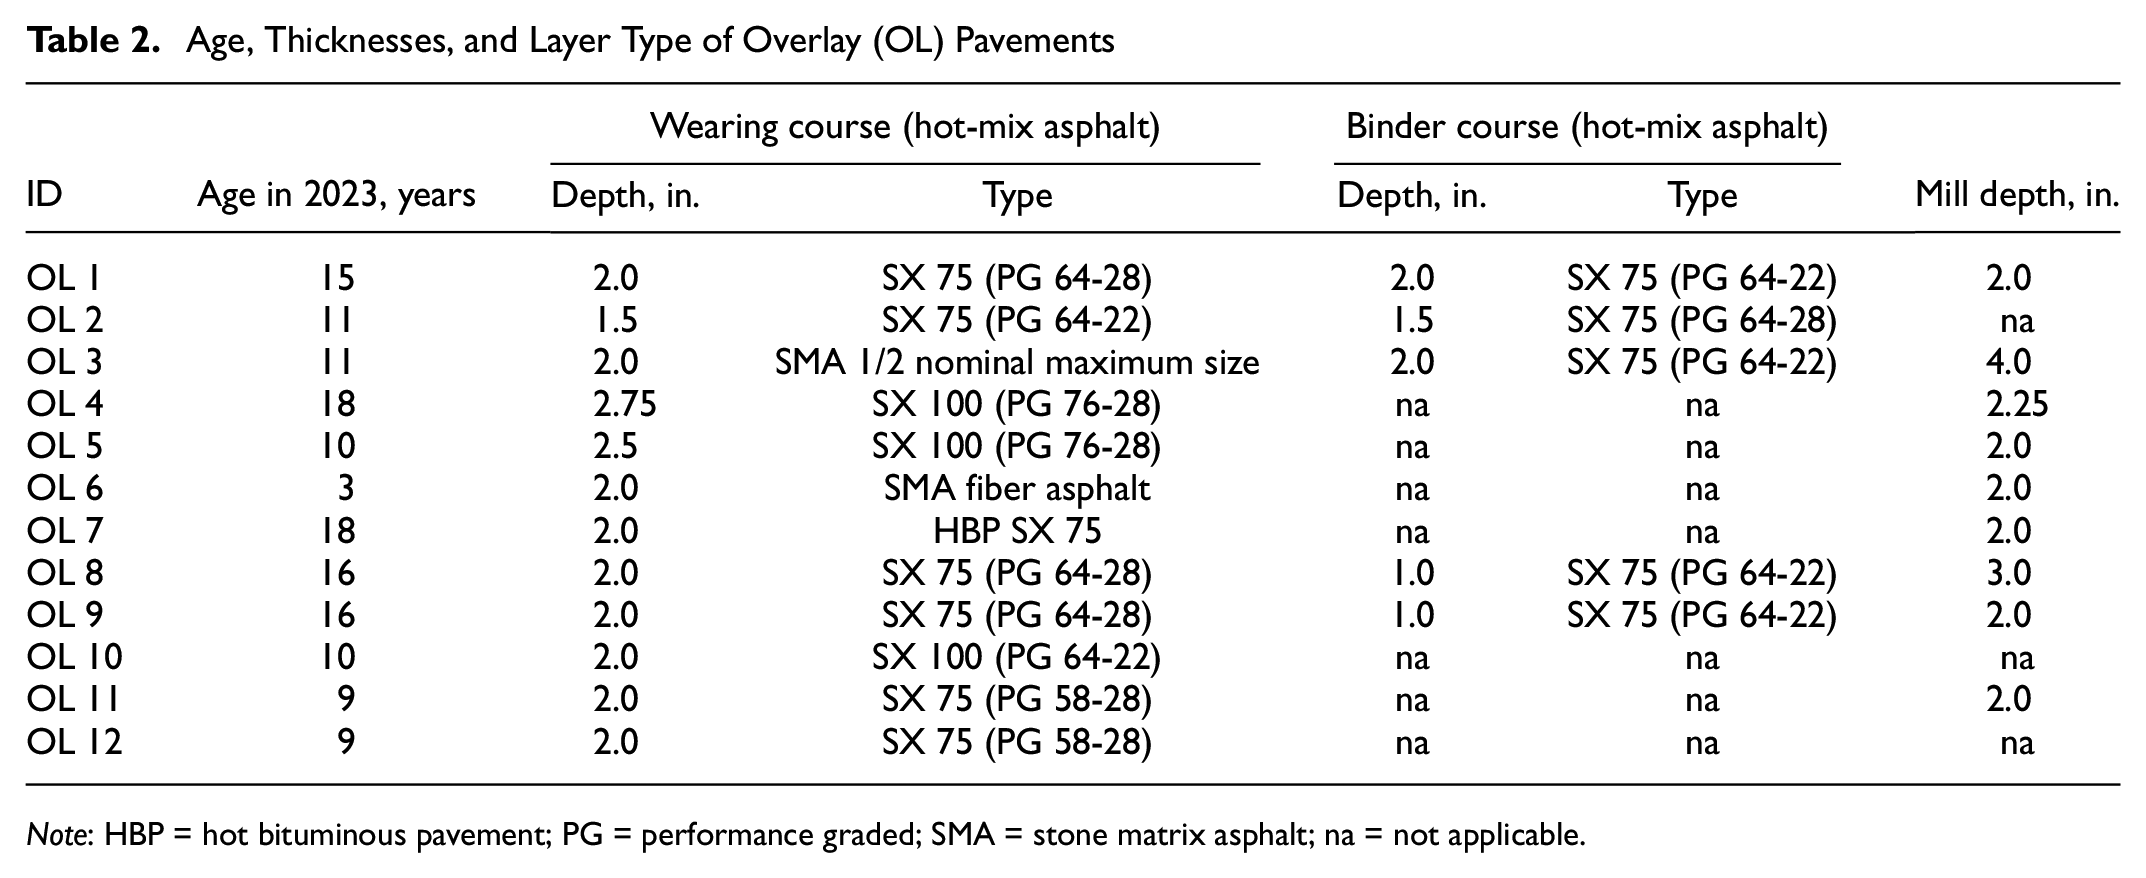
Note: HBP = hot bituminous pavement; PG = performance graded; SMA = stone matrix asphalt; na = not applicable.
Analysis of Long-Term Roughness Performance
The long-term performance data used in this study consist of measured roughness (using the IRI), cracking, and rutting at the reference sites between 2008 and 2021. For the purposes of this work, we organized the data into sites and segments. A project site includes a range of mileposts on a given highway. Within each site, pavement condition is measured every tenth of a mile, and these are referred to as segments. For example, site FDR 2 contains the segments 36.5 to 36.6, 36.6 to 36.7, all the way up to 41.1 to 42.2. Several factors require us to clean the raw data before subsequent analyses.
Pavement distress is not always measured in the same direction every year. Approximately 10% of the data were recorded in the direction of decreasing milepost values and were discarded from the analysis. This resulted in some segments missing a single year’s worth of data. In these cases, a missing value was linearly interpolated between the previous and following years’ values.
Some segments show unrealistic year-to-year changes in condition (e.g., IRI ± 100 in./mi). These segments were discarded from subsequent analyses because of potential measurement errors.
After applying the exclusion criteria, the dataset included pavements in five CDOT regions, 21 sites, 740 unique segments, and a total of 8396 data points. Using this dataset, we analyzed the performance of FDR and overlay sites to determine whether the deterioration of FDR is substantially different from that of overlay sites. This analysis was then used to define a deterioration model, characterizing the deterioration of both FDR and overlay pavements for long-term and life-cycle cost analyses.
Criteria for Comparison of FDR and Overlay Sites
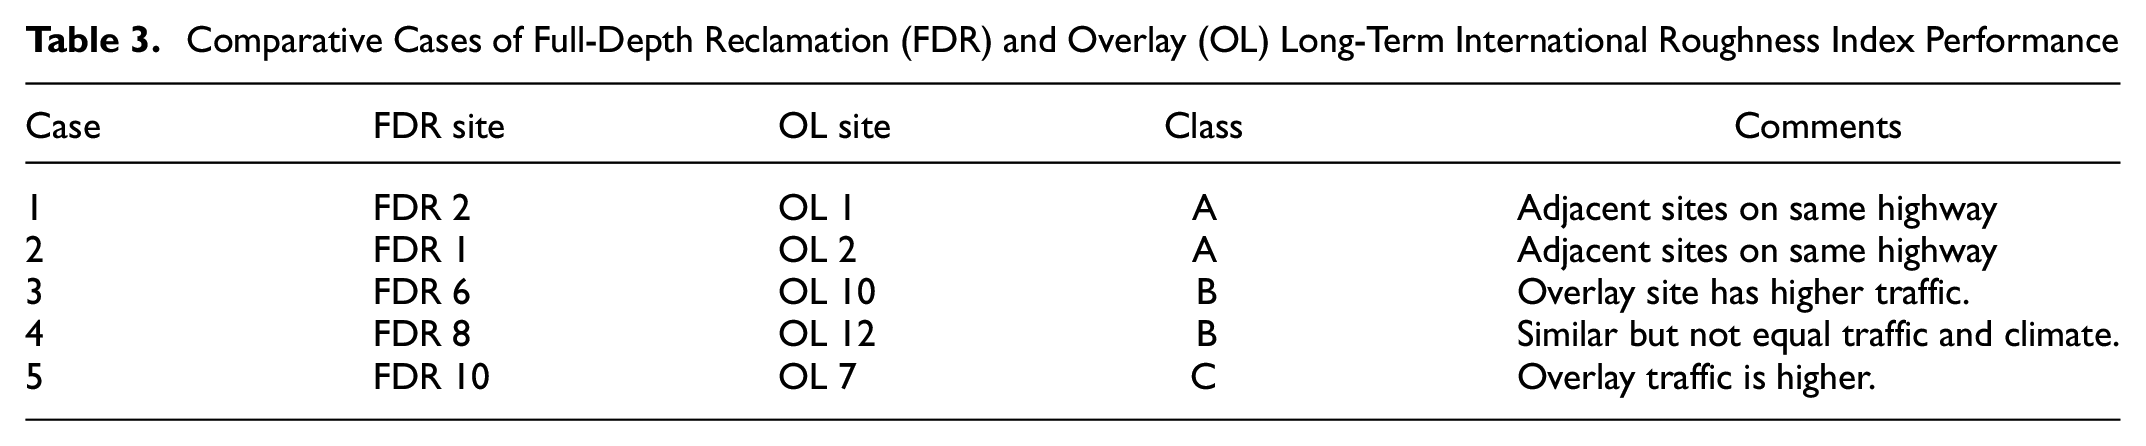
An overarching goal of this research is to address the question: “Is the performance of FDR sites substantially different from that of overlay sites?” Many different factors will affect the deterioration of a given road segment, including the initial condition (at age 0), thickness and properties of surface course, base course, and subgrade materials, traffic, climate, and maintenance activities. To provide a fair comparison between rehabilitation strategies sites, we would ideally identify FDR and overlay sites that are matched on all of these factors, or develop deterioration models that explicitly adjust for the differences. The number of sites available for this analysis, however, is limited, making these approaches impractical. Instead, we pair sites based on a simpler proximity-based criteria that attempts to adjust for as many of the potential differences as possible. This results in three classes of comparison, ranging from adjacent sites on the same highway (A, best) to sites on different highways of the same functional classification (C, worst). Table 3 summarizes the cases of FDR and overlay sites selected for pairwise comparison.
Comparative Cases of Full-Depth Reclamation (FDR) and Overlay (OL) Long-Term International Roughness Index Performance
Deterioration Modeling of FDR and Overlay Sites
In the most general setting, a probabilistic model for pavement condition deterioration takes the form of a stochastic process (collection of random variables):

where
Fully specifying a general stochastic process involves defining the joint distribution of all the random variables (finite-dimensional distributions), which will generally have a complicated dependency structure. A homogeneous first-order Markov model, such as the one proposed by Osorio-Lird et al. (
20
), simplifies the full specification of the finite-dimensional distribution to only require that the conditional distribution

where
In this project, we explored more advanced models aimed at capturing the various factors affecting deterioration but found that, given the high variability in the data and the limited number of cases for analysis, the added complexity of these models did not result in significantly higher prediction accuracies. Based on these results, we can implement the previously mentioned incremental deterioration model with single
Parameters for Markov models are typically estimated by least squares (or summary statistics), maximum likelihood, or Bayesian procedures. In this study, we adopt a Bayesian approach because of its natural handling of both aleatory (model) and epistemic (parameter) uncertainty. Thorough introductions to Bayesian statistics can be found in Gelman et al. ( 21 ), Kruschke ( 22 ), or Robert ( 23 ). Briefly, the Bayesian approach seeks to answer the question: “Given the data we observed, what values of the parameters were likely to have generated it?” Formally, this is addressed through Bayes theorem:

where
Once we have obtained the posterior distribution,

For a Bayesian analysis, the model parameters (in our case,

where

Here, the exponential distribution is parametrized by its rate parameter, so 0.1 gives a prior mean of 10.
LCCA
To calculate the life-cycle costs, long-term IRI performance, and cost-effectiveness of maintenance alternatives, we followed a four-step approach (Figure 2). First, we defined deterministic and probabilistic input parameters for the LCCA. Deterministic inputs relate to the length of the analysis period, the criteria used to measure the value of pavements at the end of the analysis period (i.e., the salvage value), and the discount rate considered to account for the effect of time on the value of money. Probabilistic inputs, however, include: (1) initial costs of rehabilitation (i.e., FDR and overlays), (2) the cost of maintenance treatments applied over the pavement life-cycle, and (3) the effect of these activities on pavement condition. Next, distributions for probabilistic inputs were determined and sampled using Monte Carlo simulation to estimate various condition trajectories. In Monte Carlo simulation, a random sampling is used to formulate a probability distribution of outcomes that accounts for correlation and dependencies. This approach has been widely used in probabilistic LCCA applied to pavements, for example, in the work of Swei et al. ( 24 , 25 ). Finally, probabilistic outputs related to life-cycle costs, long-term IRI performance, and cost-effectiveness were estimated for each rehabilitation alternative (i.e., FDR and overlays).
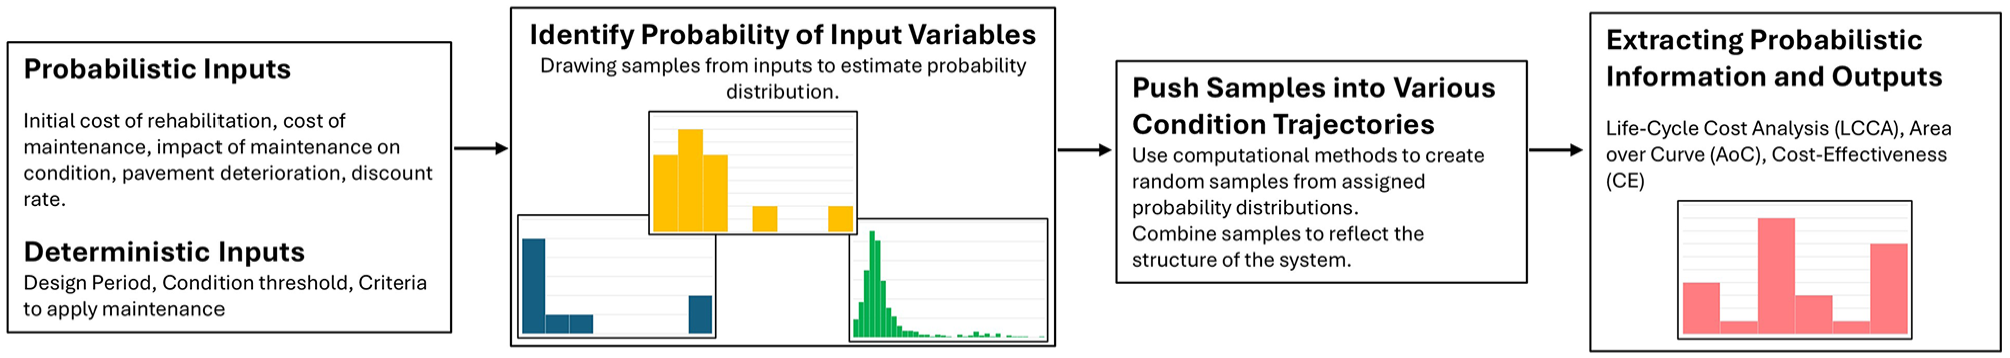
Monte Carlo simulation used in long-term International Roughness Index performance and life-cycle cost analysis.
The following subsections summarize the analysis process using Monte Carlo simulation.
Deterministic Inputs
Analysis Period
The analysis period denotes the duration during which the pavement is subject to study. The analysis period should be long enough to demonstrate the total differences between the alternatives being compared ( 26 ). The most common analysis periods used to evaluate pavement design alternatives range between 25 and 40 years ( 27 – 30 ), and CDOT’s default value to use in mechanistic-empirical pavement design is 40 years ( 31 ). For rehabilitation strategies, however, the analysis periods are usually considerably shorter than these. In this study, we considered the analysis period to be CDOT’s recommended design period for rehabilitation strategies (i.e., 10 years), an approach considered in previous studies ( 16 ). Longer analysis periods were deemed inappropriate because of the limited availability of empirical data, which would have resulted in an analysis outside of the inference space of our sample.
Discount Rate
This rate accounts for the time value of resources. This concept differs from inflation (which most people are familiar with) and accounts for the opportunity costs of resources. Detailed information on the differences between inflation and discount rates can be found in the FHWA Economic Analysis Primer ( 32 ). Common ranges of discount rates have traditionally varied from 3% to 5% ( 28 , 29 ). In recent studies, however, lower values, such as 2%–4% ( 27 ) and 1.5% ( 30 ), were considered. In the most recent pavement design guide, CDOT recommends a value of 1.06 ± 0.562% ( 31 ), and this is the range considered in our analysis. This value matches rates recommended by other DOTs in the U.S.A. (e.g., Minnesota DOT recommends using 2% [ 33 ]) and the recommendations of the U.S. DOT based on annual estimates of the 5-year rolling average of the real interest rates published by the U.S. Office of Management and Budget, which recommended a real interest rate of 2.3% for 10-year analyses in 2023 ( 34 ).
Salvage Value
The salvage value is the estimated residual worth of a pavement at the end of its service life, that is, the potential value that the pavement may provide through recycling or rehabilitation. Since different maintenance alternatives might result in different pavement conditions at the end of the analysis period, the estimated salvage value is an important factor in LCCA. The most common approach to estimating salvage value involves calculating the relative value of the remaining serviceability with respect to the cost of rehabilitation:
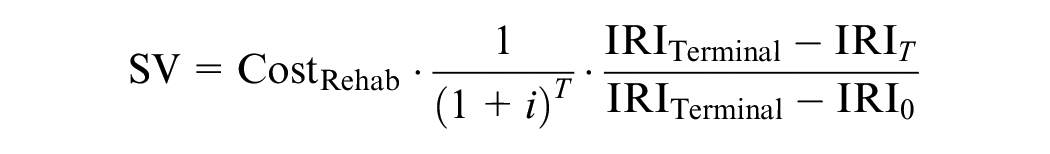
where SV is the salvage value,
Probabilistic Inputs
Details of the distributions considered in the probabilistic inputs of the model are given in Table 4. A goodness of fit test was performed to determine the most appropriate distribution to characterize the probabilistic inputs of the LCCA. In this analysis, different continuous distributions, such as normal, lognormal, and exponential, were considered. The Akaike information criterion (AIC) was the measure used to compare different models, since it balances the goodness of fit with model complexity. The model with the smallest AIC was selected as the best fit. All cases with sample sizes (N in Table 4) larger than 4 show a good fit to lognormal distributions. Although most of these variables also showed a good fit for normal distribution, considering a lognormal guarantees positive outcomes, which is particularly valuable in this problem to model variables, such as cost, that can only take positive values. Instances with small sample sizes did not show an appropriate goodness of fit for these continuous distributions. In these cases, the variables were modeled as triangular distributions.
Characterization of Probabilistic Inputs
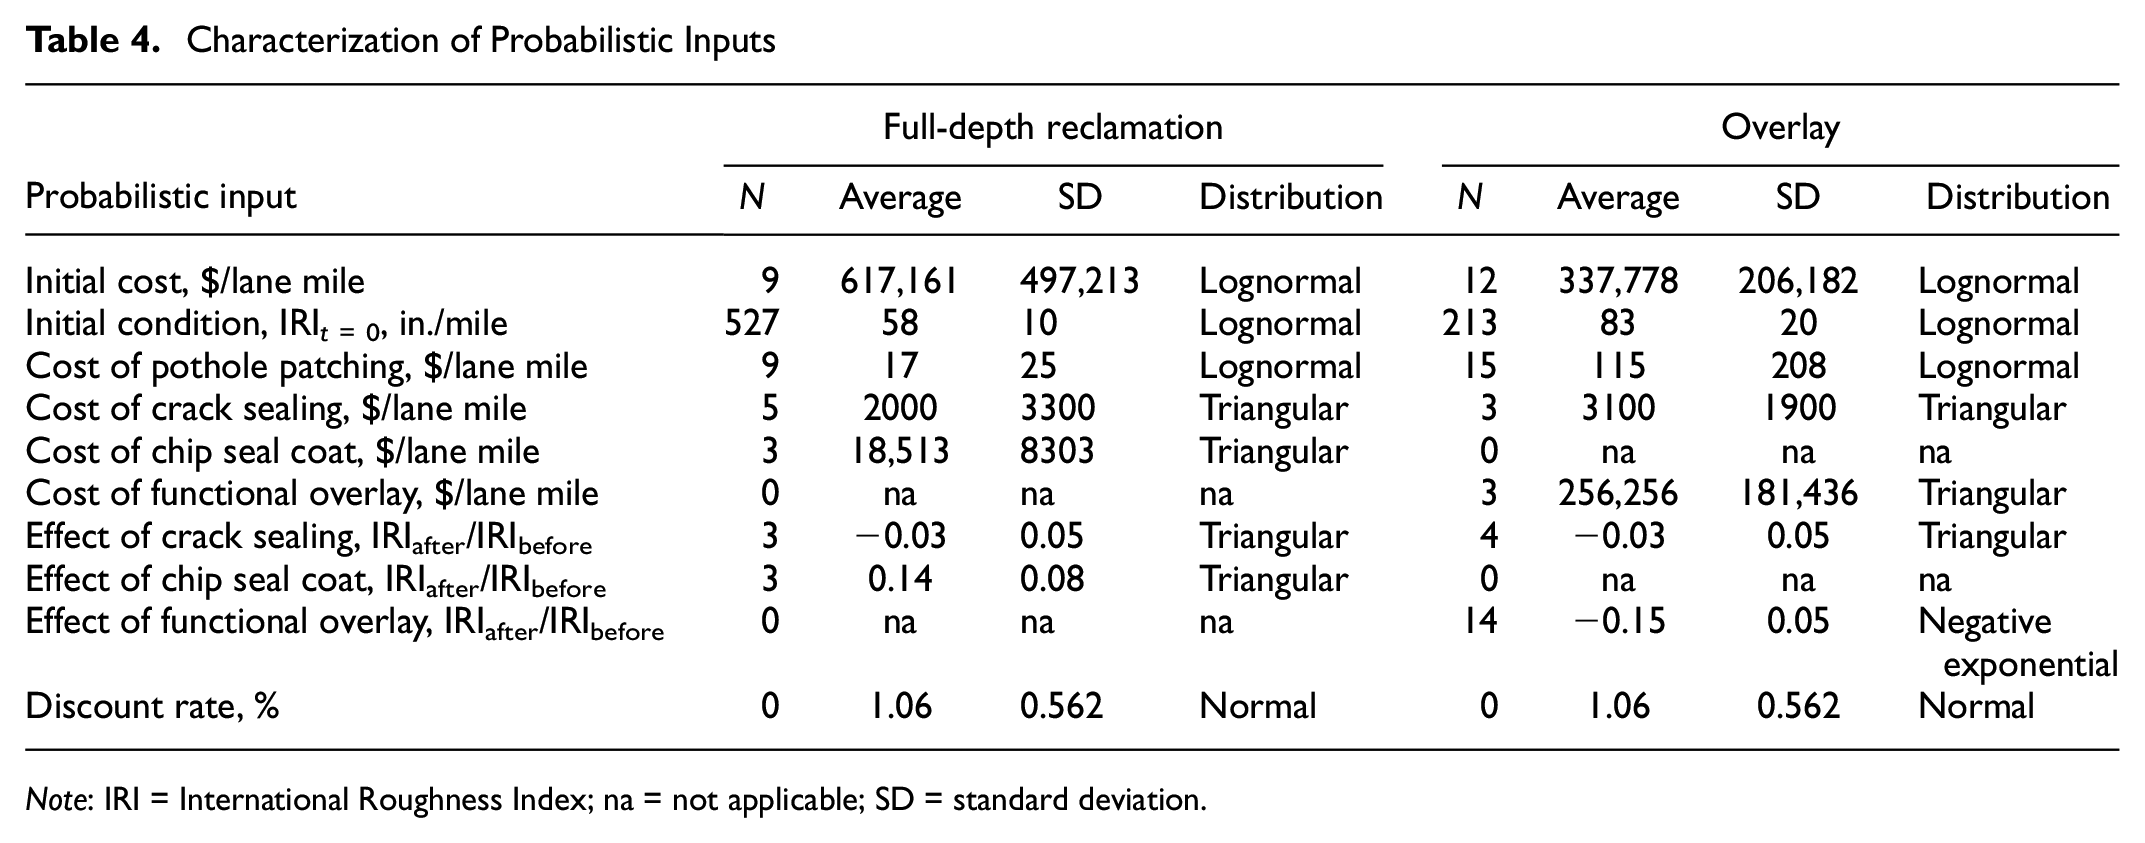
Note: IRI = International Roughness Index; na = not applicable; SD = standard deviation.
Initial costs of rehabilitation were estimated from the historical costs of construction of the reference sites, which were adjusted using quantity take offs from as-builts to estimate unit costs. To translate costs to present value, consumer price index values were collected from the U.S. Federal Reserve Bank database ( 35 ) and used to convert all prices to those for the year 2021. In this case study, the initial cost of FDR is, on average, 82% larger than the initial cost of overlays (Table 4). This difference in initial cost highlights the need for LCCA to quantify whether this difference may be offset by lower maintenance costs over the pavement service life.
For maintenance activities that occurred after the initial rehabilitation, we analyzed the maintenance records for each site and their associated cost. These data were categorized based on the type of maintenance activity performed and analyzed using statistical analysis to derive reference values of the cost of maintenance. Maintenance records include four different treatments: (1) pothole patching, (2) crack sealing, (3) chip seal coat, and (4) functional overlay. The first two maintenance treatments (i.e., pothole patching and crack sealing) are applied to both FDR and overlay sites. For the sections under analysis, chip seal coats have only been applied in FDR pavements. Similarly, functional overlays have exclusively been applied to overlay sites. We considered this historical practice to reflect the availability of maintenance treatments for FDR and overlay sites.
To conduct an accurate LCCA for a roadway, the maintenance activities assumed in the analysis must be representative of the actions completed by the DOT overseeing it. This is typically done using a maintenance tree, which is a decision-making matrix that determines the maintenance treatments to apply based on several variables, including pavement condition and age. For this analysis, maintenance trees were not available and historical maintenance records were used to deduce a de facto maintenance strategy that is representative of the practices CDOT uses on its roadways. Historical data of pavement maintenance were used to define the criteria triggering maintenance treatments. Our analysis found that pothole patching is a recurring maintenance strategy that occurs on an annual basis. In FDR pavements, a chip seal coat is applied in Year 5 and a crack seal in Year 8. For overlays, crack seal is applied in Year 3 and functional overlays are applied in Years 5 and 10. In all these cases, Year 0 represents the year when the initial rehabilitation (i.e., FDR or overlay) was performed. The effect of maintenance on condition was also estimated from recorded condition and historical maintenance records. The effect of maintenance activities on IRI is summarized in Table 4 as a percentage change to IRI values before maintenance. In most cases, maintenance results in a reduction of IRI (e.g., functional overlays reduce IRI by 15%, on average). In the case of chip seal coats, however, the effect on condition is the opposite. Chip seal coats, consisting of a layer of asphalt binder that is overlaid by a layer of embedded aggregate, are used to seal the fine cracks in a pavement’s surface and prevent water intrusion in the base and subgrade ( 36 ). Although the application of a chip seal coat can lead to slight reductions in cracking and rutting, it may increase pavement roughness—an effect noted in the literature ( 16 , 37 ) and also observed in this study.
Outputs of the Analysis
In addition to the life-cycle costs, additional metrics were considered for comparison in the analysis, namely the long-term IRI performance and cost-effectiveness. These metrics are meant to complement the economic evaluation and account for potential differences in the benefits derived from each alternative. Ideally, benefits should be quantified in monetary terms, so that they can be compared with costs by using ratios such as benefit–cost. A monetary quantification of benefits, however, is not always possible because the effectiveness of alternatives may involve non-monetary benefits ( 38 ). To overcome this situation, other metrics of benefits, such as the area over the performance curve (AOC) can be used as a proxy to measure benefits. The AOC and a threshold value of condition (e.g., maximum IRI) are used to measure the long-term effectiveness of treatment alternatives, thus embodying both concepts of average pavement condition and service life ( 38 ). This concept of AOC, illustrated in Figure 3, has been widely applied to quantify the long-term performance of maintenance alternatives in pavement management applications ( 38 – 42 ) and is the metric used in this study. When using this metric as a proxy for overall benefits, a ratio of cost-effectiveness (i.e., CE) can also be estimated to include differences in costs:

As described in this equation, calculation of CE requires calculation of the AOC and the pavement’s life-cycle cost (LCC) ( 40 ).
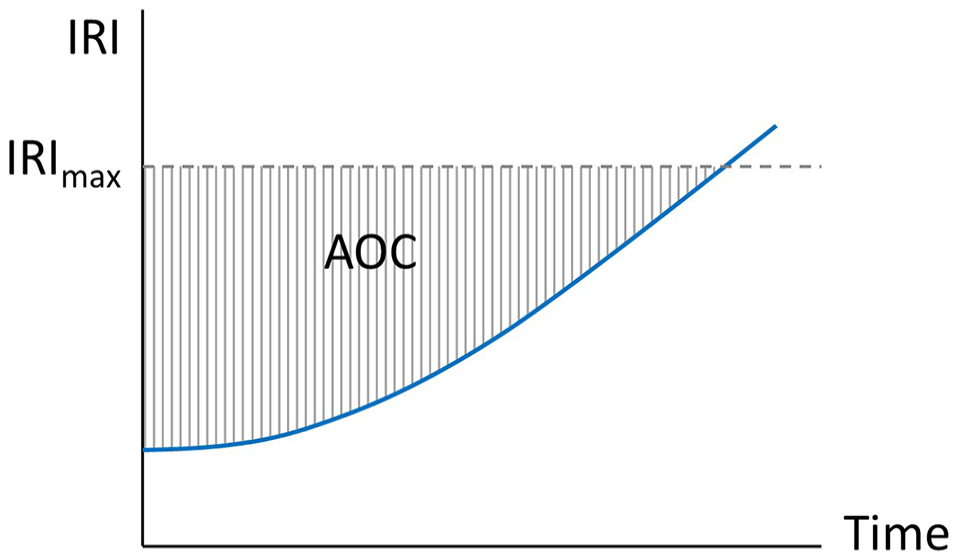
The area over the curve and a maximum value of condition are used to measure the long-term effectiveness of treatment alternatives.
For each rehabilitation alternative, 10,000 iterations were calculated to derive probability distributions of the analysis outputs: life-cycle costs, long-term IRI performance evaluated as AOC, and cost-effectiveness.
Results
Long-Term IRI Performance of FDR and Overlay Sites
Our analysis found that IRI was the most reliable metric to compare condition, because of its continuous nature and the higher accuracy of the measurement process. Other metrics of condition were explored (e.g., rutting and cracking) but they were discarded from the analysis because the measurements did not appropriately reflect deterioration. Indeed, measurements of fatigue and transverse cracking have many years with null values, making it hard to develop deterioration models from these metrics. In general, IRI appears to be the most reliable metric, followed by rutting, then fatigue or transverse cracking, with the final two being of similar quality. These conclusions are supported by analyzing the aggregated year-over-year changes for each type of distress (Figure 4). These results suggest that IRI shows a more reasonable distribution characteristic of deterioration than other metrics. Rutting depth showed a reasonable deterioration trend, but the distribution of year-to-year change (Figure 4b) shows unreasonable improvements that are also influenced by the limited sensitivity of rutting measurements (i.e., in 0.1-in. increments). It is also worth noting that the year-to-year changes in observed IRI (Figure 4a) satisfy our assumptions of normality, as supported by the Anderson–Darling test for goodness of fit (p < 0.001).
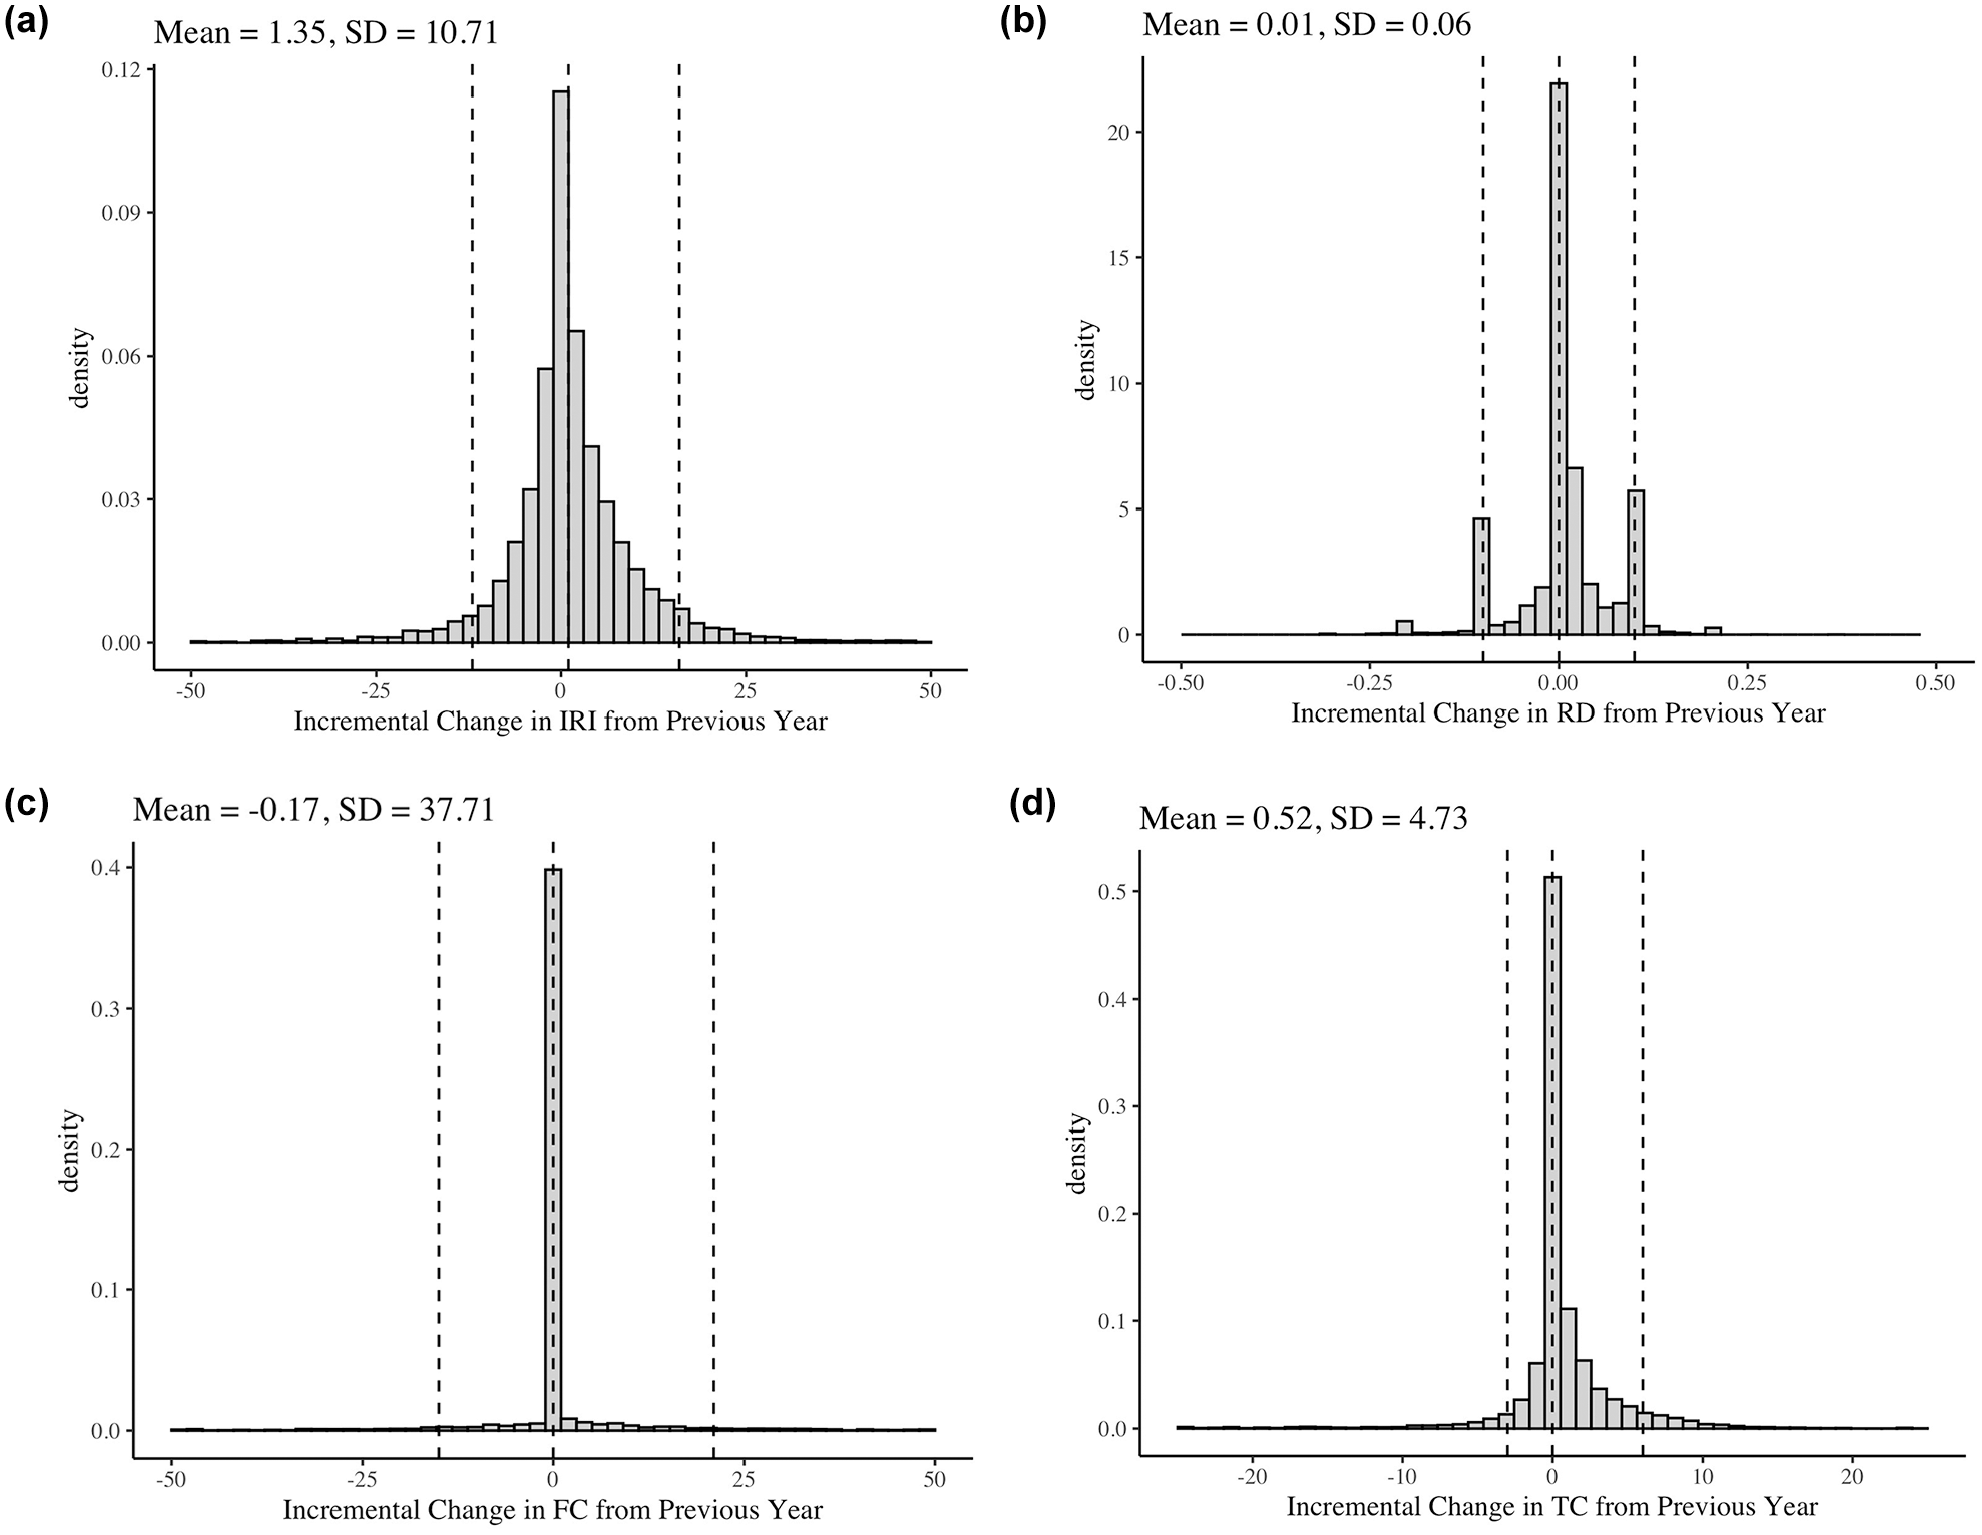
Distribution of year-to-year change in (a) International Roughness Index; (b) rutting depth; (c) fatigue cracking; (d) transverse cracking. Dashed lines are 5%, 50% (median), and 95% quantiles of the data.
Comparative Analysis of Deterioration
Figure 5 compares the performance of FDR and overlay sites within the five comparative cases summarized in Table 3. Each of these pairwise comparisons analyzes IRI values over time (Figure 5, a , c , e , g , i ) as well as incremental changes in IRI from the previous year (Figure 5, b , d , f , h , j ). For each case, the pavement condition is aggregated across the site to identify mean trends and variability in both yearly condition and year-to-year incremental deterioration. However, it should be noted that the calculated variability will be influenced by the size of the project site. Sites that are longer and span a wider range of climate, traffic, and subgrade conditions will naturally have higher variability within each year. In these figures, variability is depicted by the error bars, which indicate 2.5th and 97.5th quantiles (thus capturing 95% of the data).
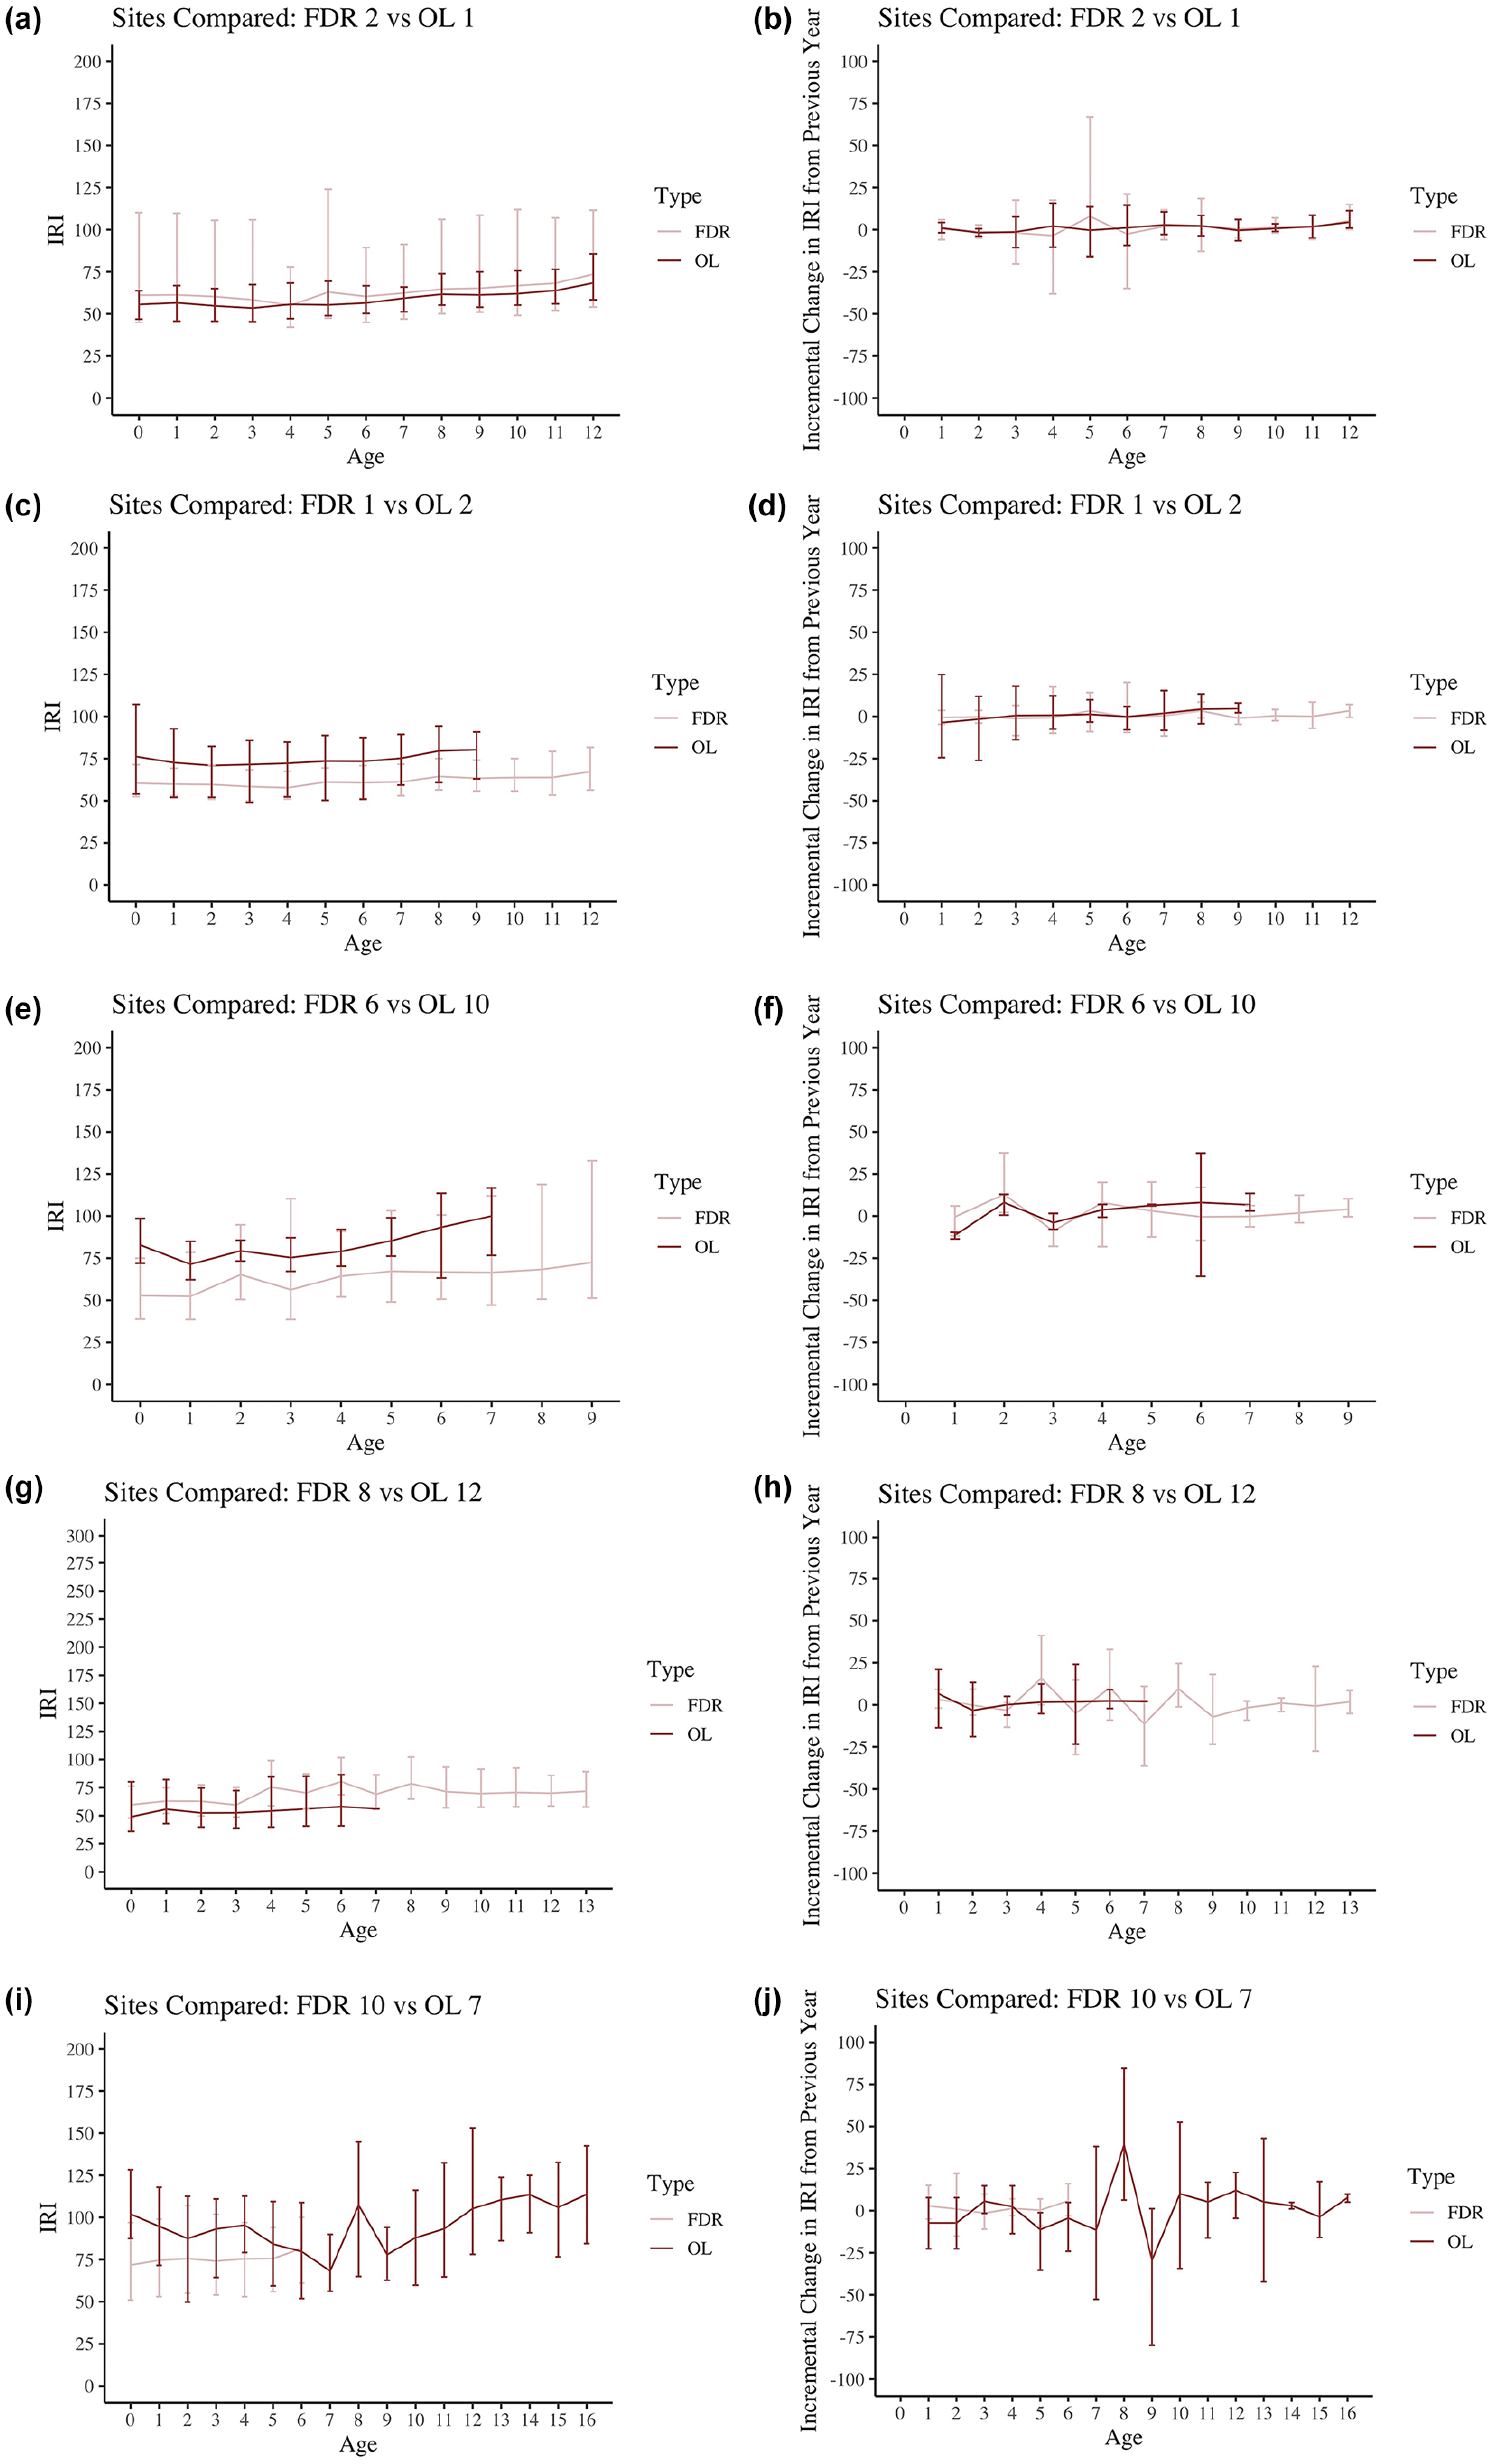
Pairwise comparisons of (a, c, e, g, i) IRI over time and (b, d, f, h, j) incremental changes in IRI from previous year for the five scenarios summarized in Table 3.
In general, three prominent trends are present in the pairwise aggregated comparisons. First, the spread of pavement condition values within a site for a given year can be quite large. The incremental change from the previous year shows a similar level of variability. As mentioned previously, some of this variability is potentially because of changing traffic, climate, subgrade conditions, or maintenance history within the site (for longer sites). Second, the FDR and overlay sites generally show similar deterioration trends. The primary difference between the curves is their initial value, not their deterioration rates. Finally, there does not appear to be a noticeable increase or decrease in deterioration rate over time.
Overall, these results indicate that the performances of FDR and overlay sites are similar enough to be handled by the same deterioration model, given the limitations of the current dataset.
Deterioration Model
The parameters of the proposed deterioration model (

Calibrated Parameters of Proposed Deterioration Model
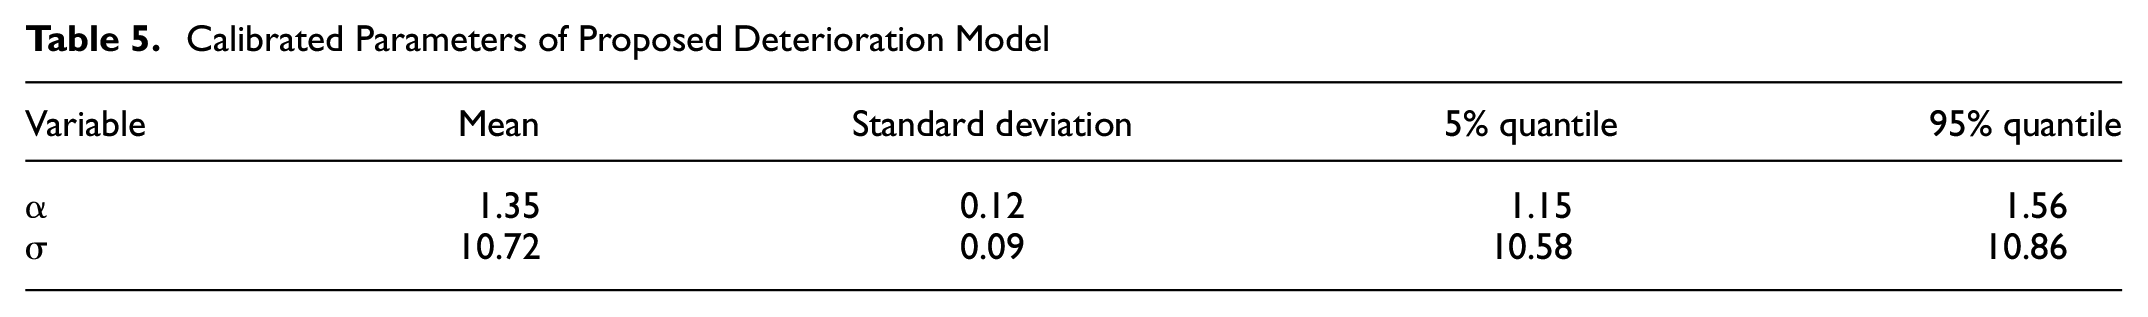
Notably, the estimated incremental deterioration is relatively small (about 1–2 in./(mil year), or the value given by the average
Next, we look at how well the model fits the observed data in 12 segments selected at random (Figure 6). In general, the model fits the data reasonably well—the observed data points fall within the estimated uncertainty ranges. Because only a single value of α is estimated, all the segments have the same slope of the mean trend and we can see some evidence that segment-to-segment variability is suppressed. However, the model fit is obstructed by several qualitative aspects of the data.
A clear deterioration trend is often not present. For some segments, particularly those with fewer data points, the condition is relatively uniform from year to year.
The data can be very noisy, sometimes showing apparent decreases in IRI, year to year.
Maintenance does not consistently appear to improve pavement condition.
These are probably the results of limitations in measurement or data management and further research is required to address these points.
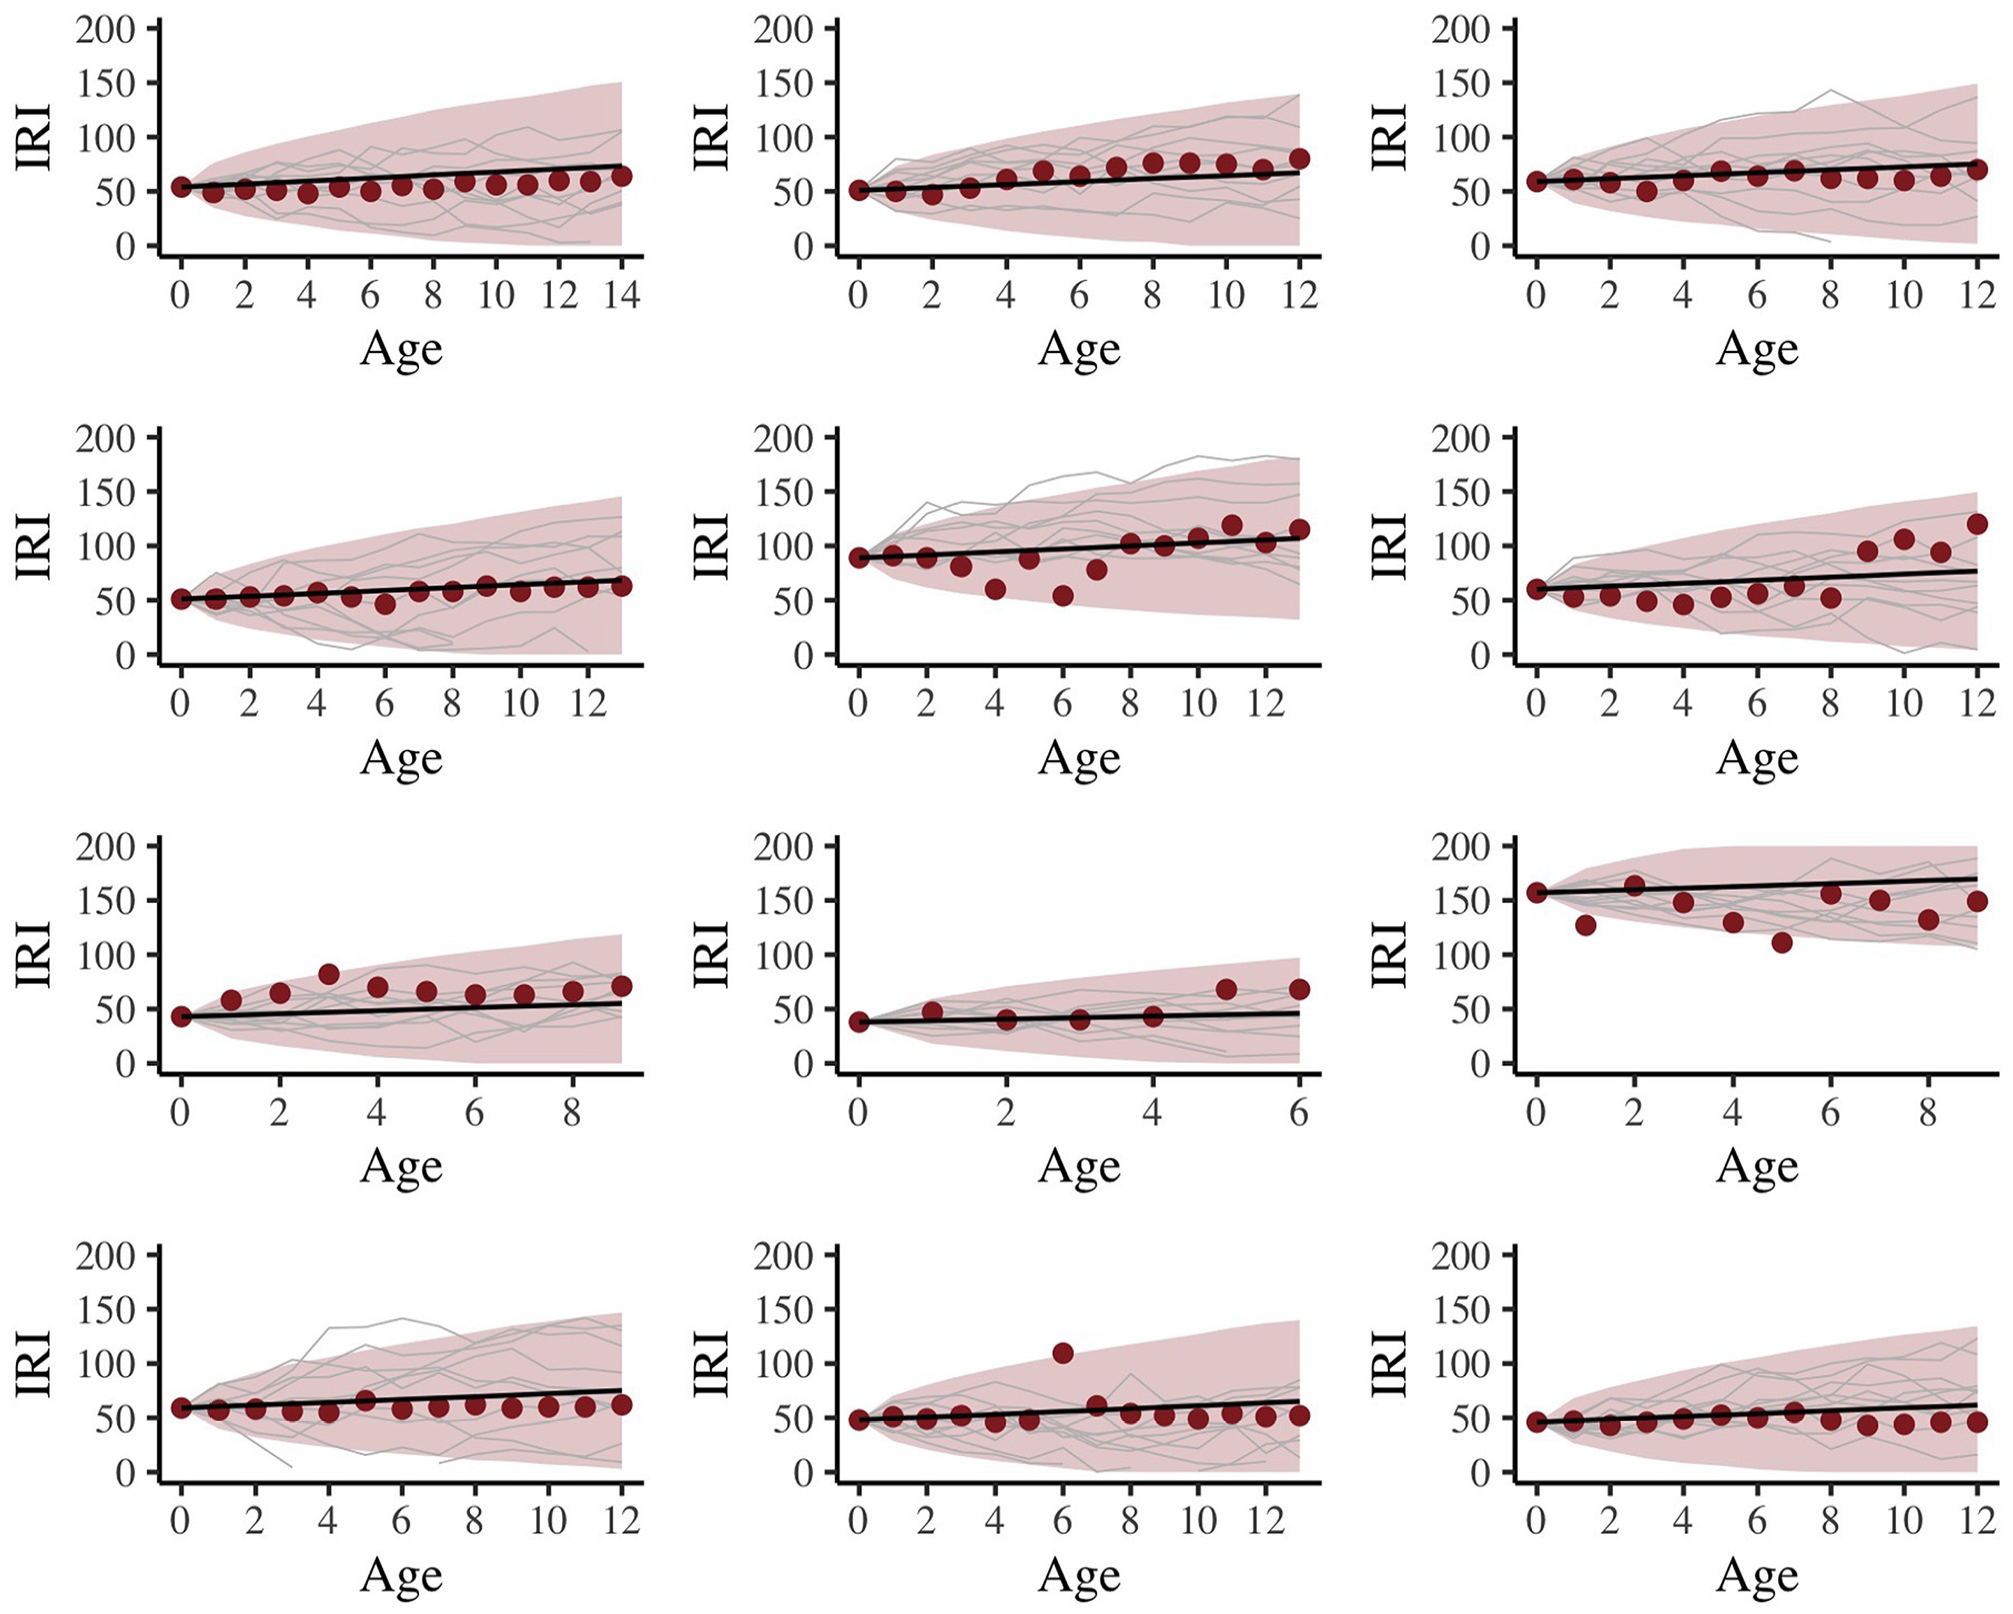
Fit of deterioration model to data. Dark red points are measured IRI values, gray lines are sampled trajectories within 95% uncertainty intervals, and the solid black line is the mean trend.
LCCA
FDR pavements were found to have lower life-cycle costs than overlay pavements (Figure 7). On average, the life-cycle cost of FDR pavements is $259,886 per lane mile less expensive than overlay pavements (i.e., the average life-cycle costs of FDR pavements is $424,250, compared with $684,136 for overlays). That is, FDR solutions result in 38% cost savings over the pavement life-cycle, compared with overlays. A non-parametric Wilcoxon–Mann–Whitney test ( 43 ) was performed to assess whether the difference in life-cycle cost for these rehabilitation strategies is statistically significant. This test revealed, with a 0.05 significance, that the life-cycle cost of FDR pavements is statistically significantly less than the life-cycle cost of overlays (p < 0.0001).
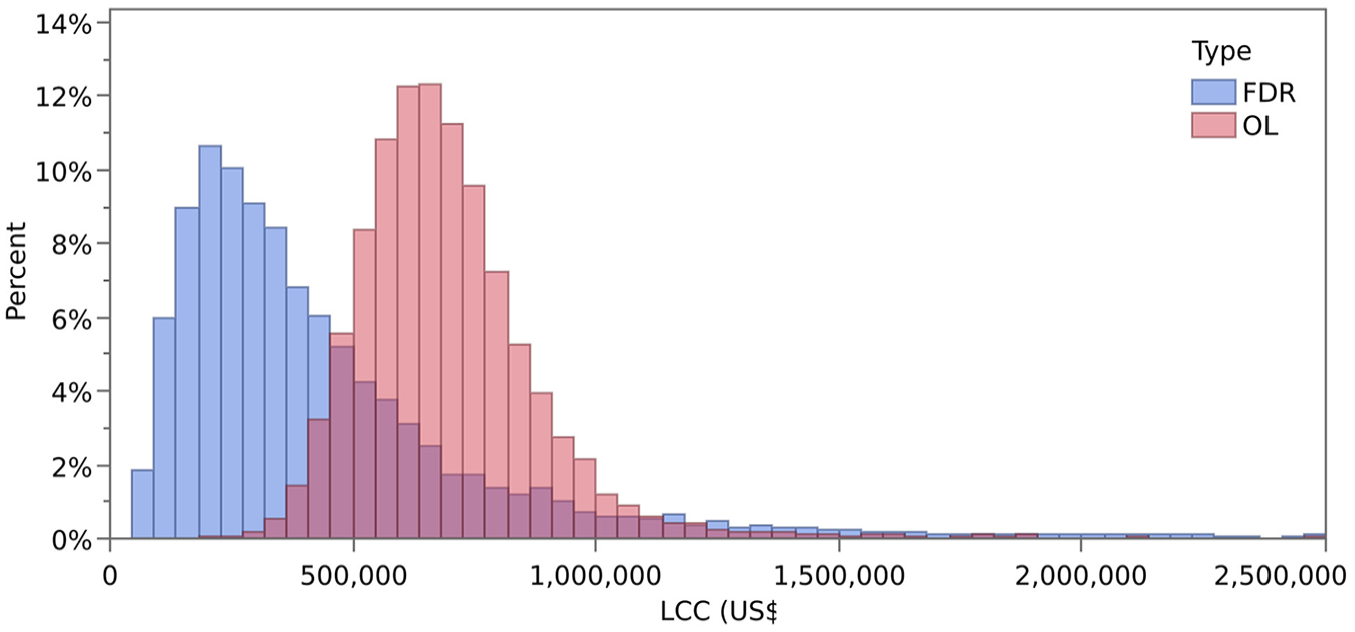
Life-cycle costs of full-depth reclamation and overlay pavements over an analysis period of 10 years.
The analysis of long-term effectiveness of FDR and overlay showed that, in general, FDR pavements have a better performance than overlays (Figure 8). This difference was found to be statistically significant, with a significance level of 0.05 (p < 0.0001, non-parametric Wilcoxon–Mann–Whitney test). On average, the long-term effectiveness of FDR pavements is 9.2% larger than that of overlay pavements (i.e., 997.5 IRI × years for FDR, compared with 913 IRI × years for overlays). FDR pavements have a better performance (i.e., lower IRI) over the analysis period, compared with overlay pavements. On average, FDR pavements have an IRI over the 10 years analysis period of 100 in./mi, compared with 107 in./mi for overlays.
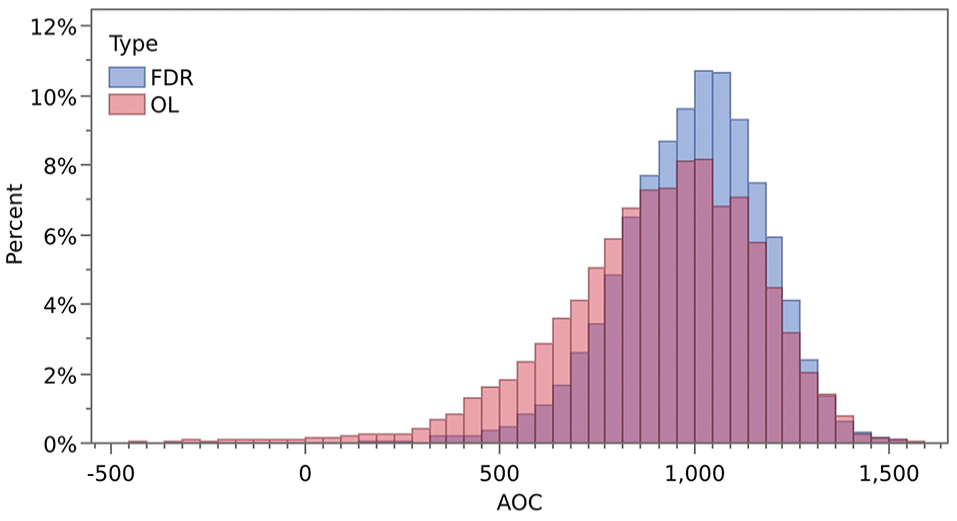
Long-term International Roughness Index performance of full-depth reclamation and overlay pavements over a 10-year period measured as the area over the performance curve.
To account for both the costs and the long-term IRI performance of these rehabilitation strategies, we computed the cost-effectiveness of each of these alternatives. These results show that, on average, the cost-effectiveness of FDR is 1.76 times larger than that of overlays (i.e., 2.35 × 10⁻³ for FDR compared with 1.33 × 10⁻³ for overlays). These results suggest that FDR is a more cost-effective rehabilitation alternative than overlay. This difference was found to be statistically significant (p < 0.0001, non-parametric Wilcoxon–Mann–Whitney test).
Conclusions
This project was an analysis of the long-term roughness performance and life-cycle costs of FDR pavements, to compare this rehabilitation solution with traditional overlay methods. For each of these alternatives, several reference sections (i.e., 10 FDR and 12 overlay sections) were analyzed. The analysis of historical data related to initial costs of rehabilitation, maintenance costs, and effect of maintenance on condition identified high variability in these variables. To account for this variability, a probabilistic approach in the LCCA was performed. The following conclusions can be derived from the reference sites analyzed in this study.
Although FDR has higher initial costs of construction, it is a more cost-effective solution than overlays, as it results in lower life-cycle costs and higher long-term roughness performance than overlays.
The comparison of FDR and overlay pavements with similar characteristics revealed three prominent trends. First, the spread of pavement condition values within a site for a given year can be quite large. Second, the FDR and overlay sites generally show similar deterioration trends, meaning that the primary difference between the curves lies in their initial value, not their deterioration rates. Finally, there does not appear to be a noticeable increase or decrease in deterioration over time.
Overall, the analysis indicates that the performance of FDR and overlay sites is similar enough to be handled by the same deterioration model, given the limitations of the current dataset. An incremental deterioration model based on Markov modeling and a Bayesian inference of parameters was developed. The model fits the data reasonably well—the observed data points fall within the estimated uncertainty ranges.
FDR pavements have significantly lower life-cycle costs than overlay pavements. On average, the life-cycle cost of FDR pavements is $259,886 per lane mile less expensive than overlay pavements, resulting in a potential cost saving of 38%. FDR pavements also have a better long-term roughness performance than overlays. FDR pavements have an average IRI over the 10-year analysis of 100 in./mi, compared with 107 in./mi for overlays. When both life-cycle costs and long-term roughness performance are combined in a cost-effectiveness ratio, our analysis showed that FDR is more cost-effective than overlay pavements.
In the analysis conducted in this research, the characterization of these alternatives is limited to direct costs and long-term condition terms. This approach neglects the environmental benefits derived from recycling existing pavements—one of the important advantages of FDR, compared with traditional overlays. Future research to analyze the environmental effects of these alternatives is recommended to fully capture the differences between FDR and traditional overlays. Further research with larger and more-diverse rehabilitation solutions is also needed to fully characterize the differences between FDR and overlays. Given that the performance of these solutions depends on the type of work performed (thickness of layers, construction quality, etc.), future research to analyze a wider variety of solutions is recommended.
Our analysis revealed some unexpected trends and inconsistencies in the historical pavement condition data that would be worth exploring further. In our study, we hypothesize some potential causes for these discrepancies (e.g., inconsistent maintenance records, high variability in measurements) but further investigation is needed to better understand the deterioration process of pavements and propose a more accurate process to measure and characterize pavement deterioration. Having more accurate information of pavement distress will also enable a more holistic analysis of deterioration, including other types of distress (in addition to IRI). Such an approach is also recommended for future work.
Footnotes
Author Contributions
The authors confirm contribution to the paper as follows: study conception and design: C. Torres-Machi; data collection: A. Crayton, J. Schmidt; analysis and interpretation of results: A. Crayton, J. Schmidt, C. Torres-Machi; draft manuscript preparation: A. Crayton, J. Schmidt, C. Torres-Machi. All authors reviewed the results and approved the final version of the manuscript.
Declaration of Conflicting Interests
The author(s) declared no potential conflicts of interest with respect to the research, authorship, and/or publication of this article.
Funding
The author(s) disclosed receipt of the following financial support for the research, authorship, and/or publication of this article: Colorado Department of Transportation (study number 421.01 “Pavement Rehabilitation Analysis: A Life-Cycle Cost and Long-Term Performance Comparison of Full Depth Reclamation and Overlays”).