
Abstract
Given the increased frequency of heavy rainfall, there is a high probability that pavement base aggregates in the field, particularly in coastal regions, will become saturated and remain so for extended periods. The increase in moisture content can reduce the resilient modulus (MR) of base materials. There are numerous constitutive models that help predict the resilient modulus of base aggregates based on moisture content and stress states, to assist pavement design. The performance of most of these models has been evaluated previously, but not at full saturation. This study is an evaluation of the two best performing prediction models, as determined in previous studies and current practices. The assessment was carried out using MR test data for seven laboratory-saturated base aggregates with different properties and moisture sensitivities (high and low). The models were first calibrated based on MR results at the optimum moisture content and then used to predict MR of each base material at saturation. The accuracy of the prediction and the applicability to base aggregates with different moisture sensitivities formed the basis of the evaluation. The models were found to be more accurate and even conservative when predicting MR of saturated base aggregates with low moisture susceptibility. However, the models were erroneous in their prediction and overestimated MR at saturation of highly moisture susceptible pavement base aggregates. An adaptation solution was proposed to improve the prediction accuracy of the existing models. This study joins efforts to design our climate-vulnerable roadways more accurately and improve pavement resilience.
Keywords
The resilient modulus (MR) is a measure of material stiffness obtained as the ratio of the deviator stress to the recoverable or resilient strain. In the current mechanistic-empirical pavement design guide (MEPDG) ( 1 ), the resilient modulus is the most crucial and fundamental material property for characterizing unbound pavement base materials. When designing a pavement, it is important to determine the resilient modulus at the anticipated stress state of the base material in the field. To this end, numerous prediction models have been developed and proposed over the years. The first model was the k–θ model, proposed by Seed et al. ( 2 ):

where MR is a function of bulk stress. Later, Witczak and Uzan (
3
) proposed another model, commonly known as the universal octahedral shear stress model, where MR is a function of bulk stress (θ) and octahedral shear stress (

where θ = bulk stress =
Many factors, excluding stress state, influence the resilient modulus of pavement base aggregates. These factors include gradation, density, plasticity, and, especially, the degree of saturation ( 6 ). It has been well documented by previous researchers that one of the most common causes of a decrease in resilient modulus, both in the field and in the laboratory, is increased saturation ( 7 , 8 ). Therefore, several researchers have evaluated the accuracy of different constitutive prediction models that incorporate variation in moisture content of the base materials ( 4 , 9 ). For instance, Hiltunen et al. ( 10 ) evaluated the prediction ability of the MEPDG model and found that it is conservative and underpredicts the significant increase in MR of Florida limerock base materials at moisture contents below the optimum moisture content. However, the major shortcoming of these studies is that the ability of the models to accurately predict the resilient modulus of base materials at full saturation has not yet been evaluated. Considering the potential for pavement aggregate base materials to become saturated and potentially stay saturated, whether from flooding or a rising ground water table, it would be beneficial to evaluate the accuracy of the existing design prediction models.
The objective of this study is to evaluate the ability of existing resilient modulus prediction models to accurately predict the resilient modulus of saturated pavement base aggregates. An accurate MR prediction model at full saturation is necessary to update design standards and ensure pavement resilience against climate water stressors. This study is an evaluation and comparison of the two most accurate design prediction models for granular base materials, based on previous research findings.
Materials and Data
For this study, seven aggregate base materials were collected from different quarries located in Alabama, Florida, and Mexico. The materials, which include four limestone and three limerock materials, are on the Alabama Department of Transportation (ALDOT) list of approved aggregates. The resilient modulus test, following the AASHTO T307 standard procedure ( 11 ), was conducted in the laboratory to determine the MR of these base materials. Since this study is focused on the evaluation of MR prediction models for saturated base aggregates, the materials were tested for MR at the optimum moisture content (OMC) and at full saturation. For MR at OMC, the materials were prepared and tested according to the procedure detailed in the AASHTO T307 specifications ( 11 ). For MR at saturation, the materials were prepared differently before testing by first compacting the samples at OMC and then saturating them using vacuum and backpressure saturation techniques in the laboratory. The test was then performed in undrained conditions following the AASHTO T307 standard procedure ( 11 ). To ensure repeatability, three replicates were tested for each material at OMC and full saturation.
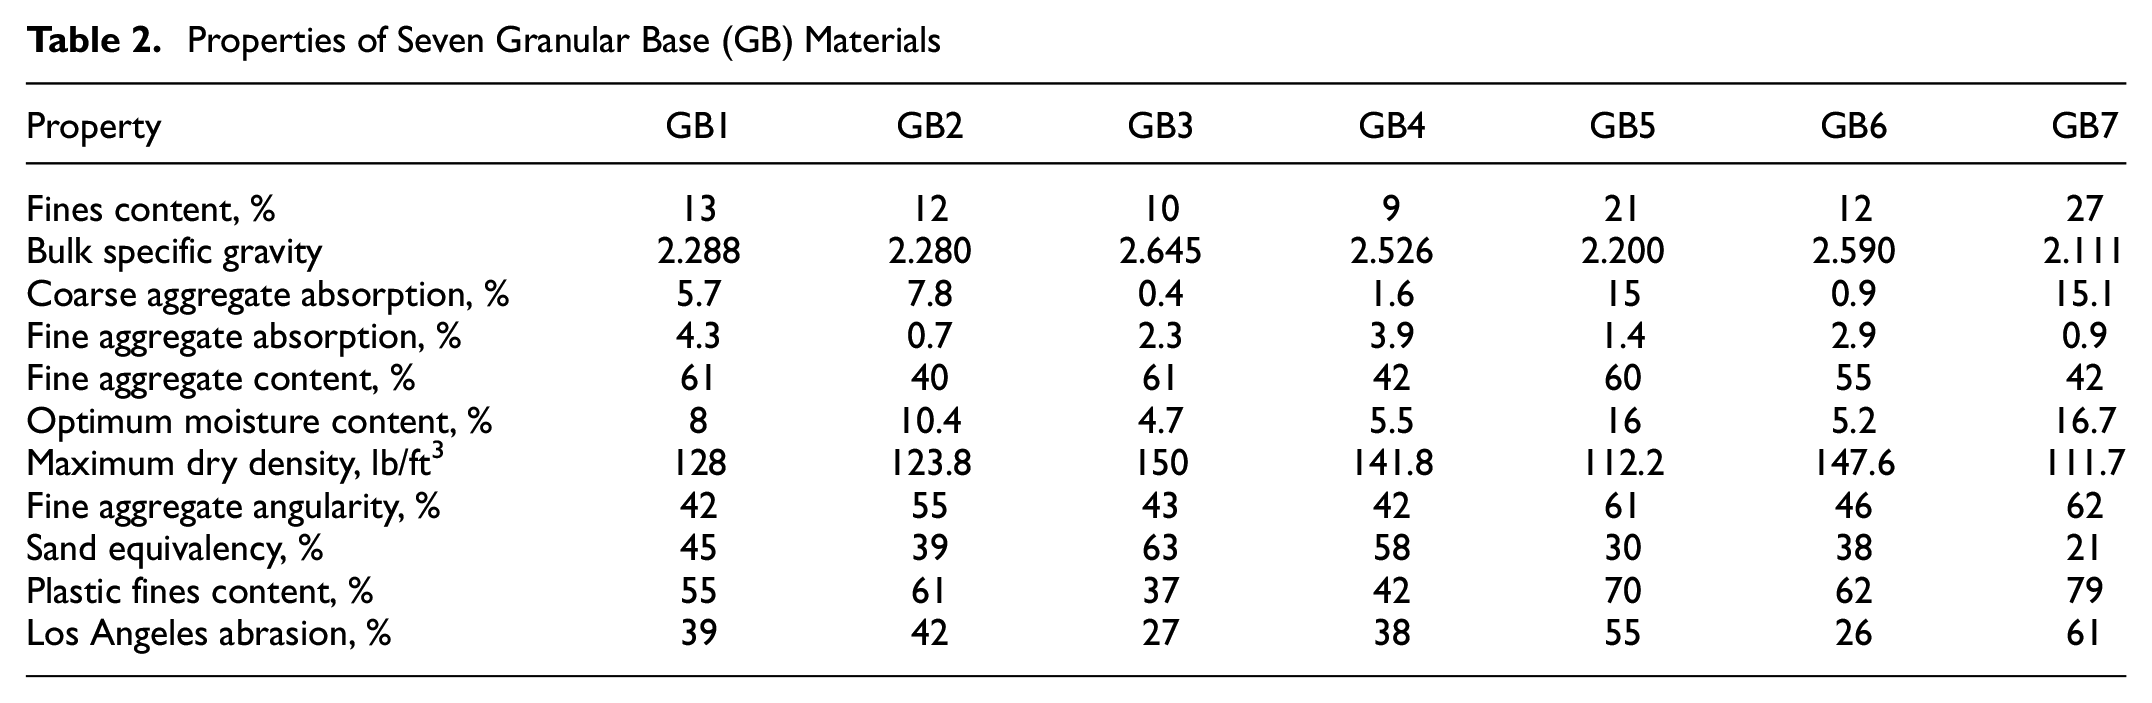
As expected, the resilient modulus decreased with increasing moisture from OMC to saturation. However, the decrease in MR was practically significant for some materials and practically insignificant for others. Practical significance is defined by ALDOT as the change in MR that can lead to at least a 0.5 in. change in the thickness of the asphalt concrete layer in a flexible pavement design. This threshold was found to be at least 4000 pounds per square inch (psi). Therefore, the base materials in this study that exhibited a decrease in MR greater than 4000 psi when saturated were considered to have high moisture susceptibility (MS). Those whose decrease in MR was less significant when saturated were considered to have low MS. The AASHTO and MS classifications of the seven granular base (GB) materials are given in Table 1. The obtained properties of the seven GB materials are presented in Table 2.
AASHTO and Moisture Susceptibility (MS) Classifications of Materials
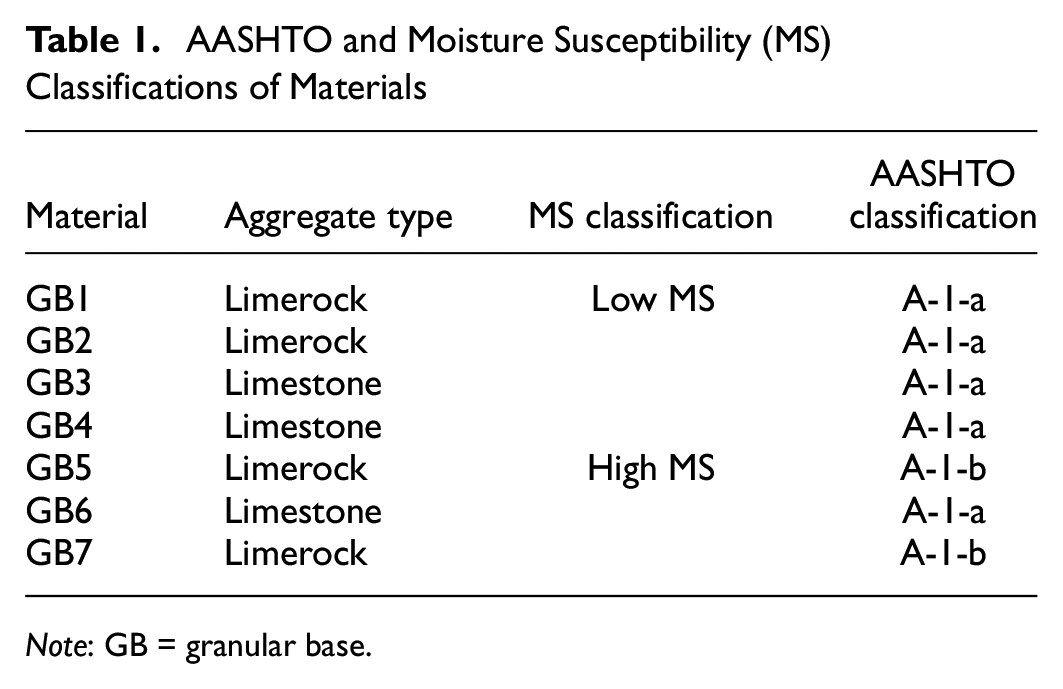
Note: GB = granular base.
Properties of Seven Granular Base (GB) Materials
Methods
Prediction Models
To predict the variation of MR with respect to the saturation level for the seven GB materials, two models were selected based on current practices and results from previous studies. The first model chosen for this evaluation is the model adopted by the MEPDG. In their study, Han and Vanapalli ( 4 ) evaluated three different prediction models and determined that the MEPDG model ( 12 ) was the most accurate. This model also represents current practice in predicting MR of saturated pavement base aggregates. The second model chosen for this evaluation is the model originally developed by Lytton ( 13 ). An extensive review of the literature was conducted and many researchers found this model to be the most accurate at predicting the variation in MR with respect to saturation. For example, Gu et al. ( 14 ) reported from their evaluations that the Lytton model predicted MR with better accuracy at different moisture contents than the MEPDG model. Additionally, Khosravifar et al. ( 9 ) evaluated nine MR prediction models for base and subgrade materials and concluded that the Lytton model was the most consistent model, ahead of the MEPDG model.
MEPDG Model
The MEPDG model ( 1 ) is a modified version of the universal model previously shown in Equation 2:

where θ = bulk stress; Pa = atmospheric pressure;
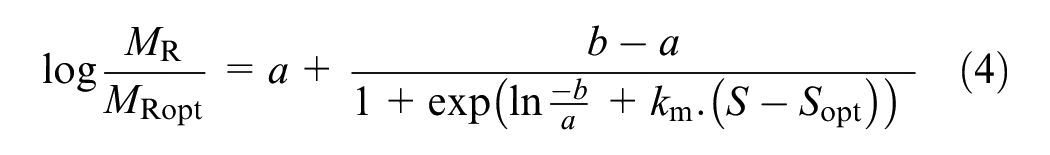
In the most recent version of the AASHTOWare Pavement mechanistic-empirical software, the values of the MR parameters k1, k2, and k3 can no longer be entered as inputs (Level 1) for pavement design. However, the model is still used externally to predict the design MR at a specific stress state expected in the field. Since the change in moisture content resulting from seasonal variations needs to be accounted for, the MEPDG software incorporates the Enhanced Integrated Climatic Model (EICM) to predict the change in MR at a given saturation level. The EICM adopts the following general empirical equation to predict the change in MR resulting from a change in the degree of saturation of GB materials ( 12 ):
where
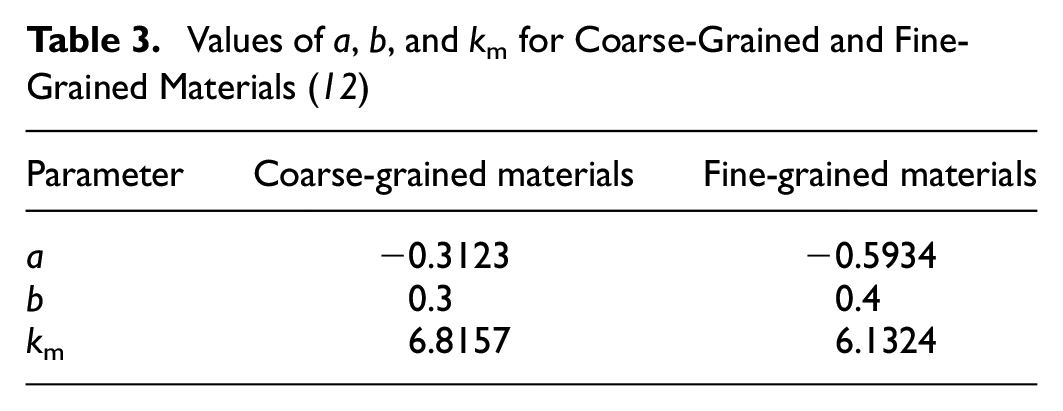
The values of
Values of a, b, and km for Coarse-Grained and Fine-Grained Materials ( 12 )
Lytton Model
This model was originally developed by Lytton ( 13 ) to incorporate not only the variation in stress state, but also the variation in moisture content of the base materials. The variation in the saturation level is accounted for in the model through the inclusion of matric suction, as

where
According to Fredlund et al. ( 16 ), the three stress variables that influence the resilient modulus are deviatoric stress, net confining pressure, and matric suction. Matric suction is the pressure, obtained as the difference between air pressure and water pressure, that attracts water through the capillary and surface adsorptive forces of unsaturated soils. Thus, matric suction is equal to zero when the material is saturated, and the Lytton model becomes the same as the original universal octahedral shear stress model of Equation 2. Fredlund et al. ( 16 ) determined that models that incorporate suction are more accurate than those without suction.
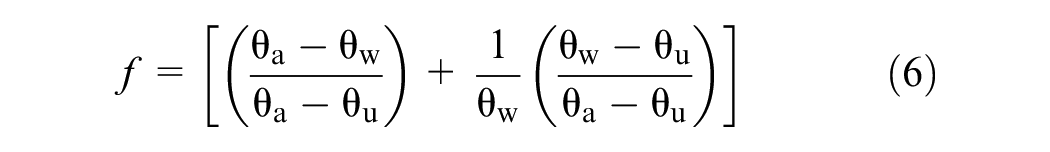
The matric suction (
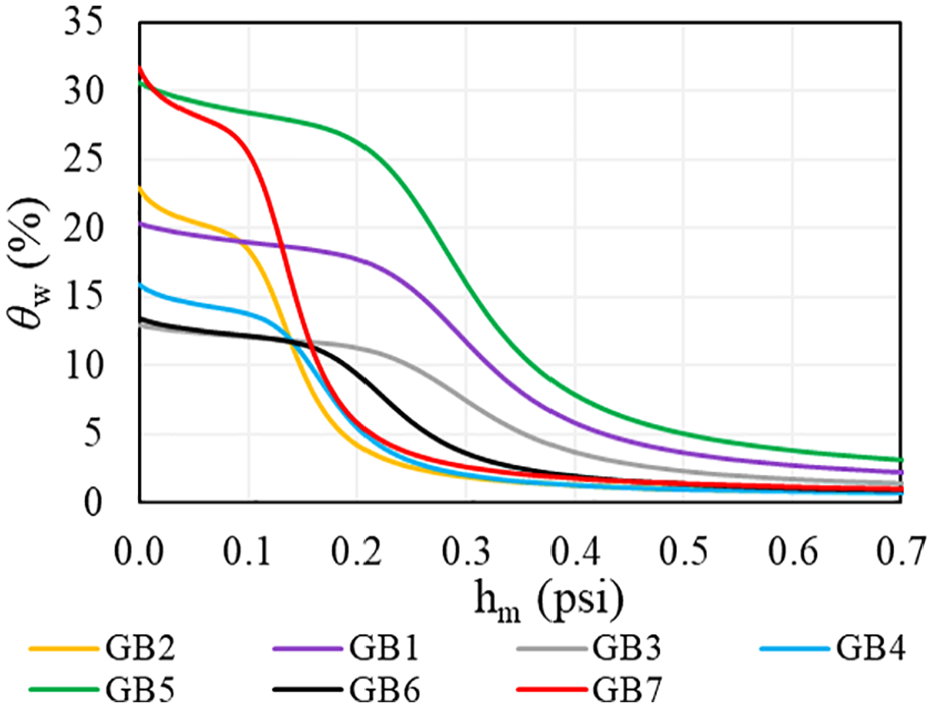
Soil water characteristic curves of the granular base materials.
Evaluation Process
To evaluate the prediction accuracy of the MEPDG model and the Lytton model, the laboratory-measured values of MR for each base material were compared with the values of MR predicted using the two models. To do this, the root mean squared error (RMSE) and the relative error (RE) of the models’ predictions were calculated for each base aggregate at both moisture conditions (OMC and saturation). The RMSE is a performance indicator for prediction models as it provides the average difference between the values predicted by a model and the actual measured values. It is an excellent estimator of model accuracy because it encompasses both systematic and nonsystematic errors. The RMSE was calculated as
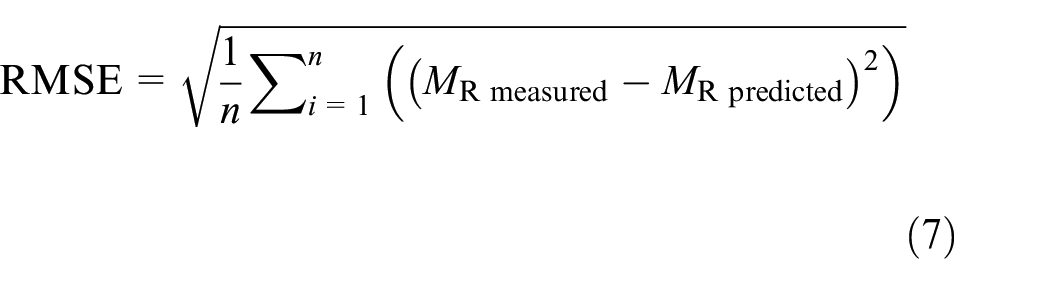
and was reported in pounds per square inch, the same unit as MR. The RE is a measure of bias of the prediction models. It was calculated as

and reported as a percentage.
As mentioned earlier, three replicates were tested for each base material at OMC and full saturation. For each replicate, the values of MR measured at the 15 bulk stresses during testing at OMC were used to calibrate the k coefficients of the two models. The two calibrated models were then used to predict MR at the same 15 bulk stresses at OMC and saturation. The RMSE and RE were calculated using predicted and measured values of MR for each replicate at OMC and saturation. At the end, each base material had three values each of RMSE and RE at each moisture condition. The average RMSE and RE obtained for each base material at each moisture condition are presented and discussed in the following section. A single t test was performed to assess the statistical difference between the RMSEs of the two models for each base material. The overall average RMSE or RE of every model is the mean RMSE or RE value of all base materials.
Results and Discussion
First, the OMC condition was evaluated. The overall average RMSE using the MEPDG model was 2909 psi and that using the Lytton model was 3023 psi. These RMSEs are low and may be considered practically insignificant because they are below the 4000-psi practical significance threshold. This demonstrates that both models can accurately predict MR of the base aggregates at OMC; this is expected since it is the condition under which the key parameters of each model were calibrated. The high accuracy was also confirmed by the overall low average RE of 4% for the MEPDG model and 4% for the Lytton model. Figure 2 shows the predicted MR from the two models compared with the measured MR at OMC. It can be seen that most of the points are on the line of equality.
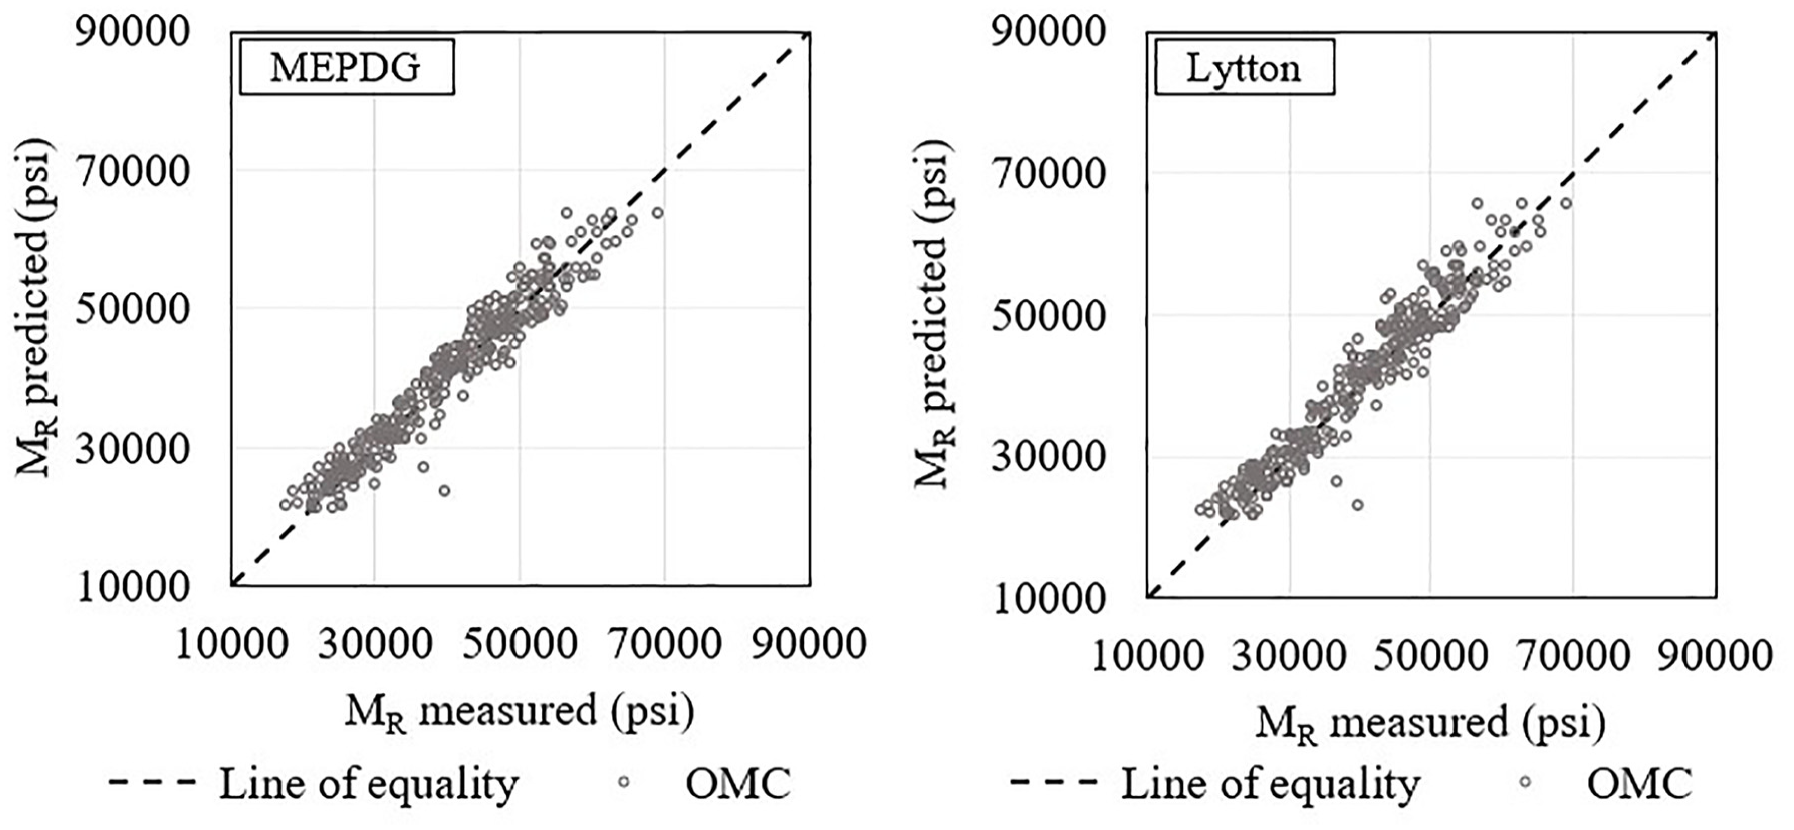
M R predicted by the two models in contrast to MR measured for all base aggregates at optimal moisture content.
At saturation, it is important to analyze the MR prediction accuracy of the models for pavement base aggregates with low MS and high MS separately. The following paragraphs present a summary of the average RMSE and RE of the two models for each GB material (low MS and high MS) at saturation.
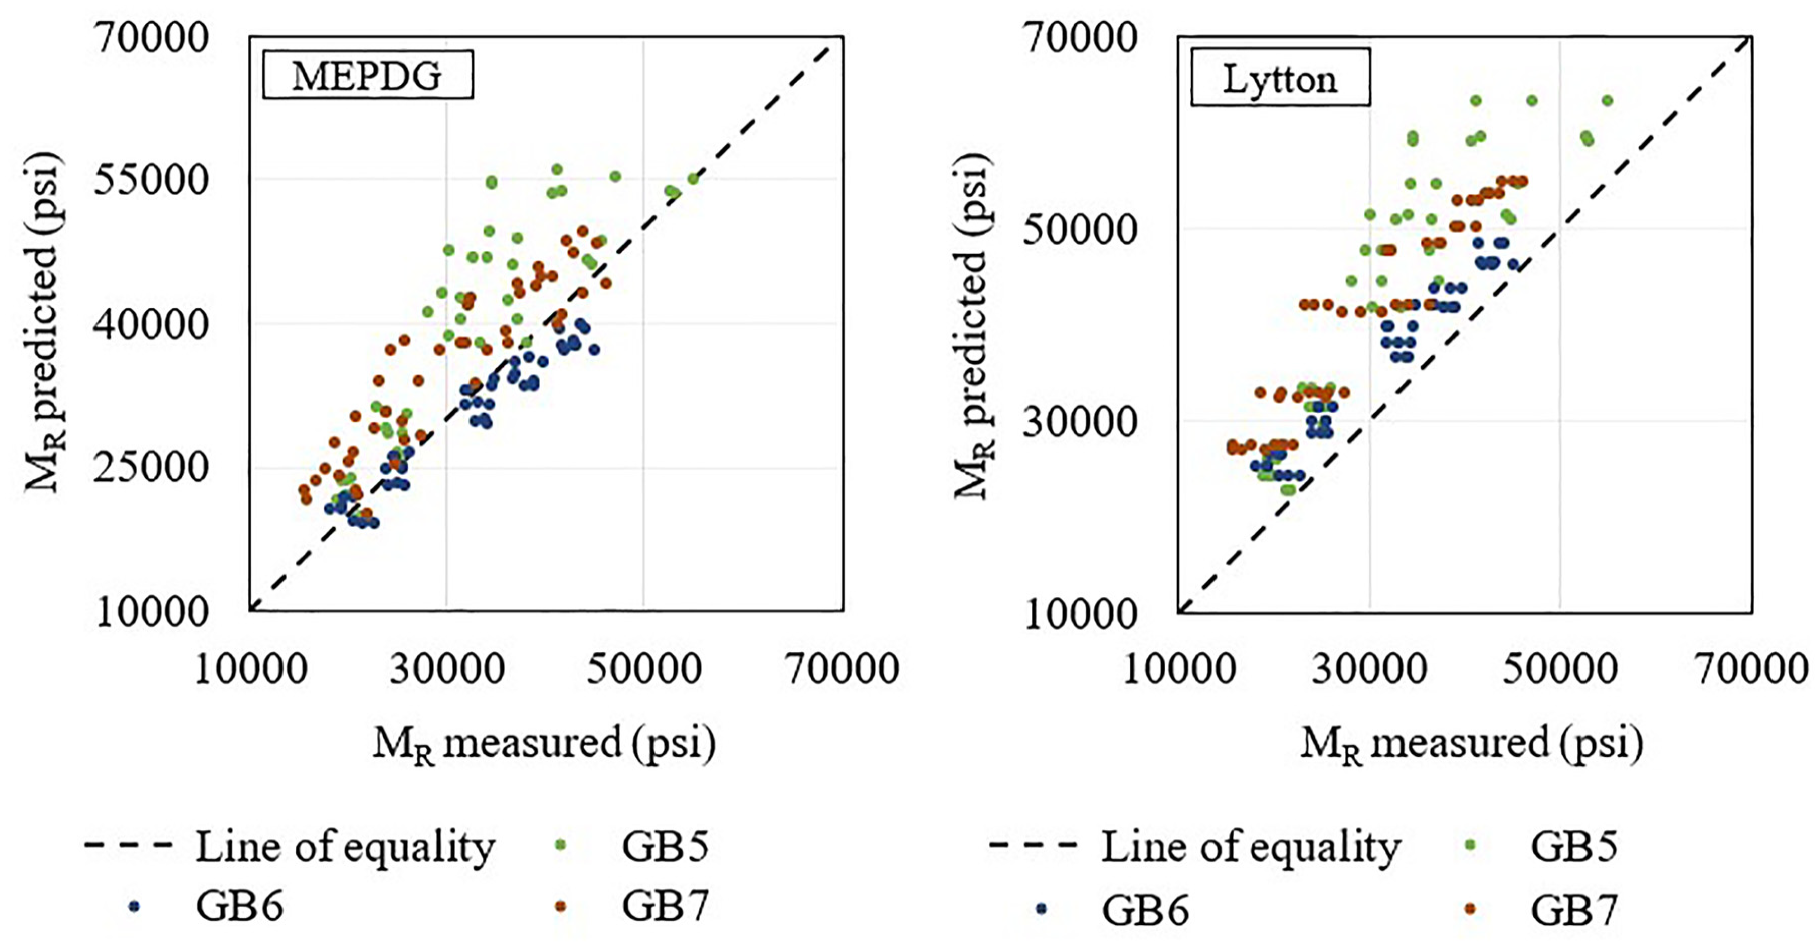
For the low MS base aggregates at saturation, the average RMSE of the MEPDG model varied between 7000 and 12,500 psi and that of the Lytton model varied between 3000 and 6500 psi, as shown in Table 4 and Figure 3a. The RMSEs between the two models were found to be statistically different for all materials. The overall average RMSE of the MEPDG model was 10,516 psi and that of the Lytton model was 4565 psi (Table 4). These RMSEs are high and can be considered practically significant as they are greater than 4000 psi. However, the RMSE of the MEPDG model was twice that of the Lytton model, showing that the Lytton model is more accurate at saturation for the tested low MS base aggregates. The same trend was also observed in the REs of both models. The average RE of the MEPDG model varied between 14% and 28%, with an average of 21%, while that of the Lytton model varied between 4% and 6%, with an average of 5%, as shown in Table 4 and Figure 3b. Figure 4 is a comparison of MR predicted by the two models against MR measured at saturation for the base aggregates with low MS. It can be seen in Figure 4 that most of the points for the Lytton model are on the line of equality. In contrast, almost all the points for the MEPDG model lie on the x-axis (measured MR) side of the line of equality. This means that the MR predicted by the MEPDG model for saturated low MS base aggregates is significantly lower than the actual measured MR. Thus, the MEPDG model is more conservative than the Lytton model when predicting MR of saturated base aggregates with low MS. This is because the EICM equation (Equation 4) in the MEPDG model contributes to significantly decrease MR at saturation, even though MR of low MS base materials does not change significantly at saturation. On the contrary, and as mentioned previously, the matric suction in the Lytton model is zero at saturation; thus, the model transforms into the original universal octahedral shear stress model (Equation 2), which does not significantly decrease MR at saturation.
Average Root Mean Square Error and Relative Error of the Two Models for Each Low Moisture Susceptibility Base Material at Saturation
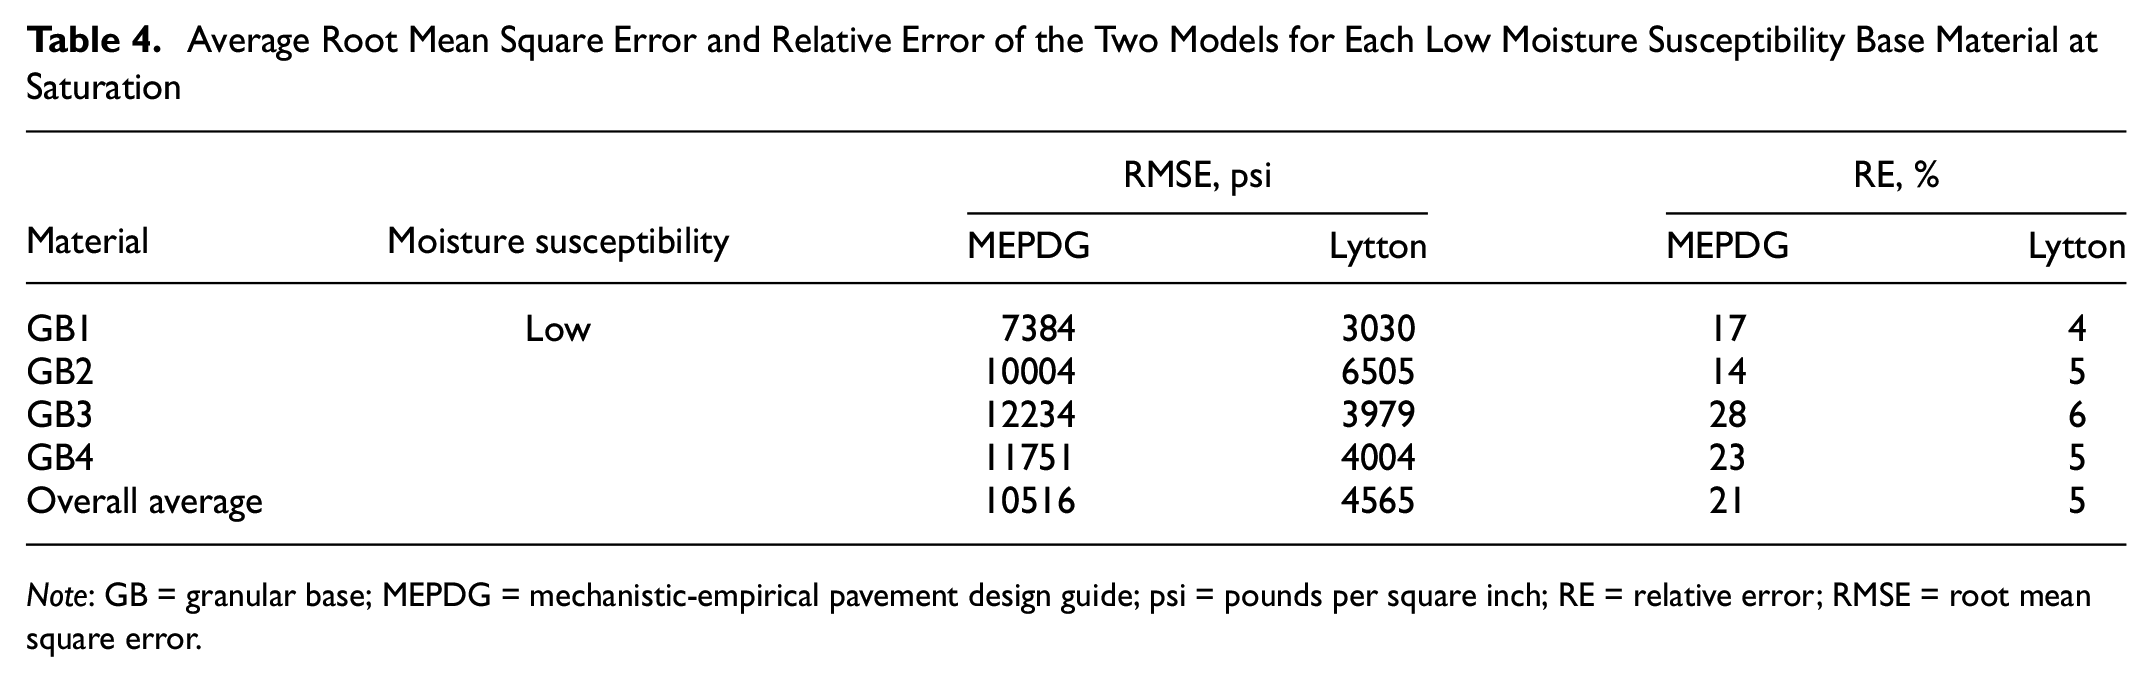
Note: GB = granular base; MEPDG = mechanistic-empirical pavement design guide; psi = pounds per square inch; RE = relative error; RMSE = root mean square error.
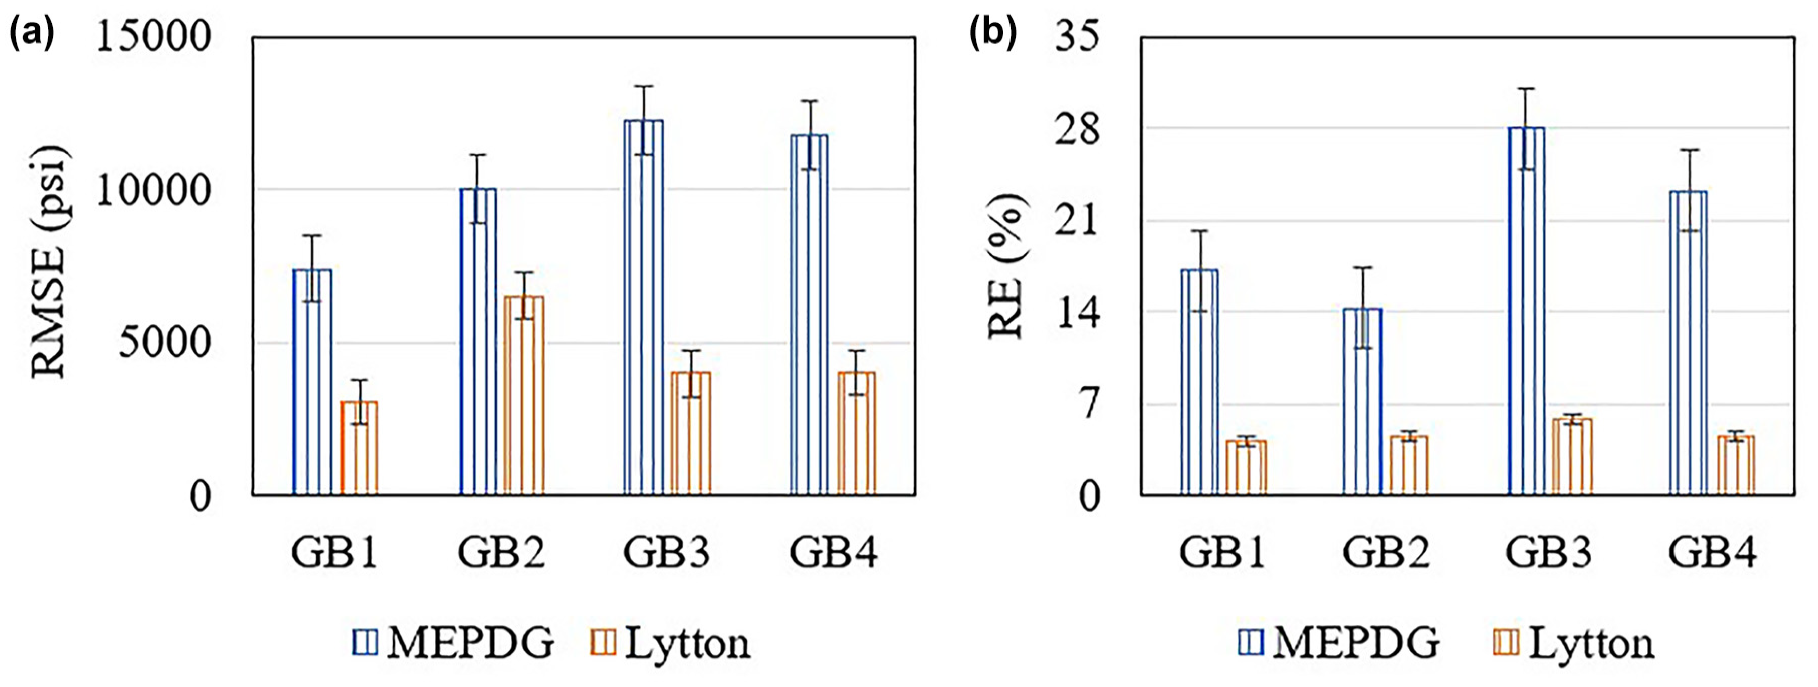
Average errors of the two models for low moisture susceptibility base materials at saturation (with standard errors): (a) root mean square error; (b) relative error.
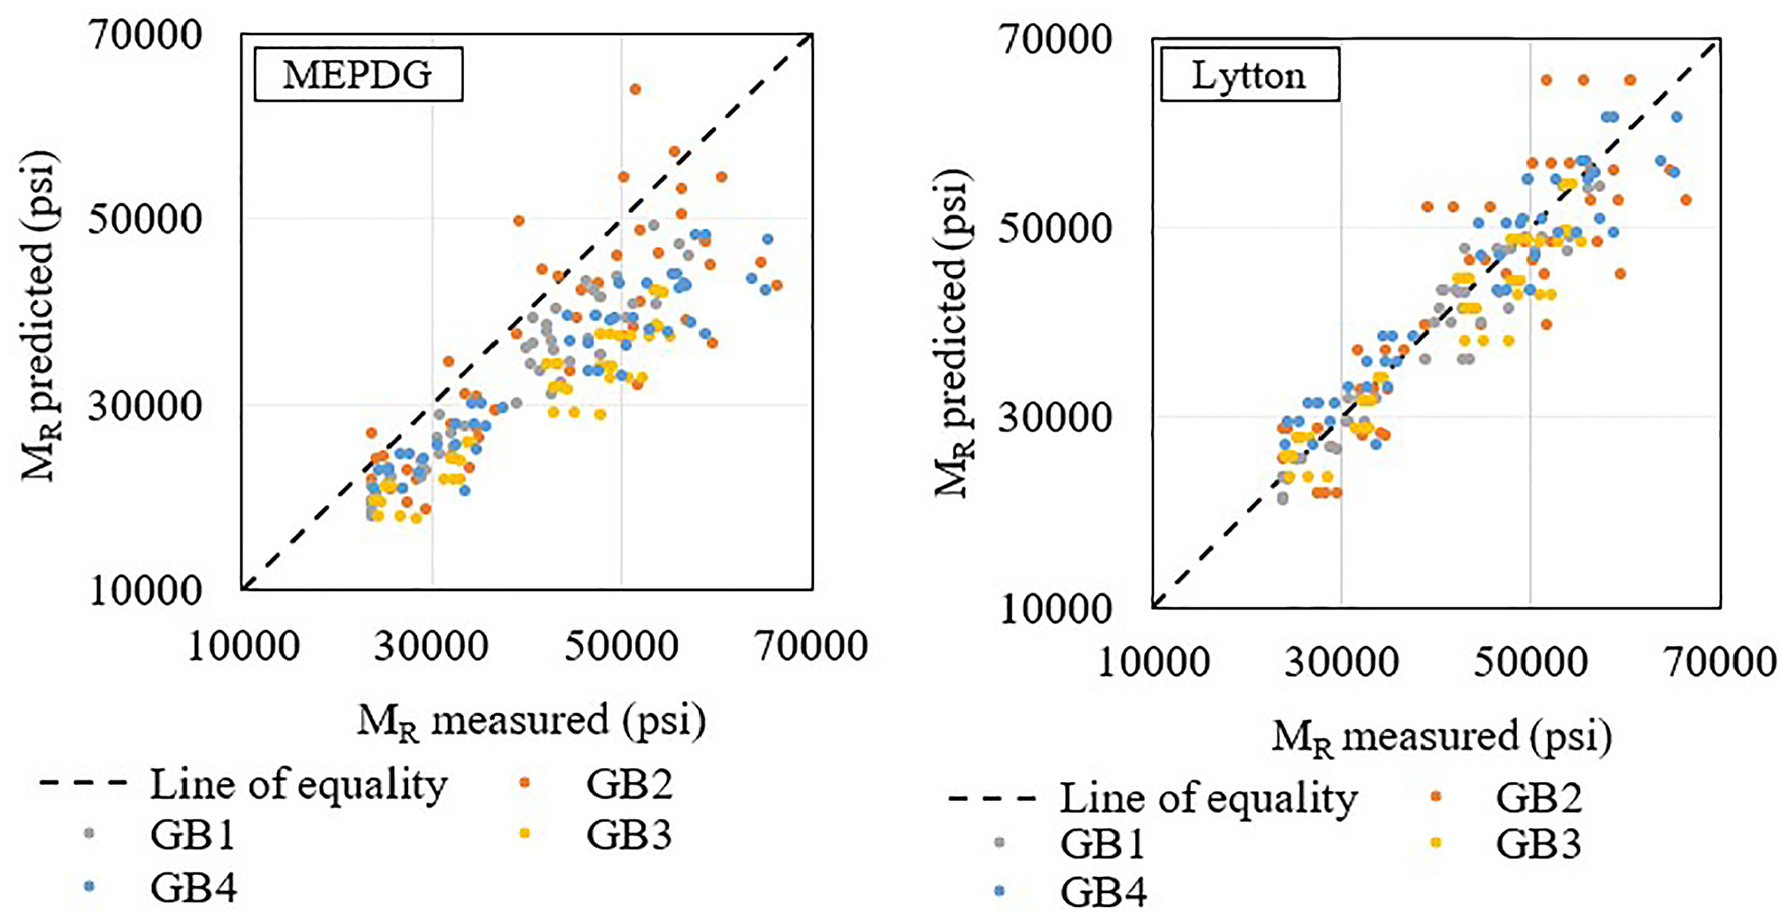
M R predicted by the two models in contrast to MR measured for low moisture susceptibility base aggregates at saturation.
For the high MS base aggregates at saturation, the average RMSE varied between 3000 and 9000 psi and 4500 and 12,500 psi for the MEPDG model and the Lytton model, respectively, as shown in Table 5 and Figure 5a. The RMSEs between the two models were also found to be statistically different for all materials, with the exception of the base aggregate GB6. The overall average RMSEs were 6313 psi and 9786 psi for the MEPDG model and the Lytton model, respectively (Table 5). These RMSEs are both greater than 4000 psi and are therefore considered significantly high from a practical perspective. Even though the RMSE of the MEPDG model was two-thirds of the RMSE of the Lytton model, it can be said that both models have a low accuracy when predicting MR of the saturated high MS base aggregates, except for GB6, which is an A-1-a material (unlike GB5 and GB7, which are A-1-b materials). Similar to the RMSE trend, the average RE of the MEPDG model varied between 7% and 20%, with an average of 14%, while that of the Lytton model varied between 14% and 34% with an average of 27%, as shown in Table 5 and Figure 5b. The comparison of MR predicted by the two models with the measured MR at saturation for high MS base aggregates is presented in Figure 6. It can be observed in Figure 6 that nearly all points for the MEPDG model and the Lytton model are on the y-axis (predicted MR) side of the line of equality. This means that the value of MR predicted by both models for the saturated high MS base aggregates is significantly higher than that of the actual measured MR. Therefore, it can be concluded that the two prediction models have a low accuracy and overpredict MR of the saturated base aggregates with high MS. This is because, in this case, the EICM equation (Equation 4) in the MEPDG model does not contribute sufficiently to significantly decrease MR at saturation for high MS base materials. The EICM equation contains the regression values a, b, and km, which are constant for all coarse or fine materials, and are not representative of high MS base materials. For the Lytton model, there is no matric suction at saturation; thus, the model with k coefficients calibrated at OMC becomes unable to predict the MR well at saturation of high MS base materials, as it is much lower than that of low MS base materials. It should be noted, however, that the suction values used in the Lytton model to calibrate the k coefficients were predicted rather than measured. Although these predictions were made using standard practices, such as Zapata ( 17 ) correlation equations, this may have increased the model’s variability. Using measured values could lead to different results.
Average Root Mean Square Error and Relative Error of the Two Models for Each High Moisture Susceptibility Base Material at Saturation
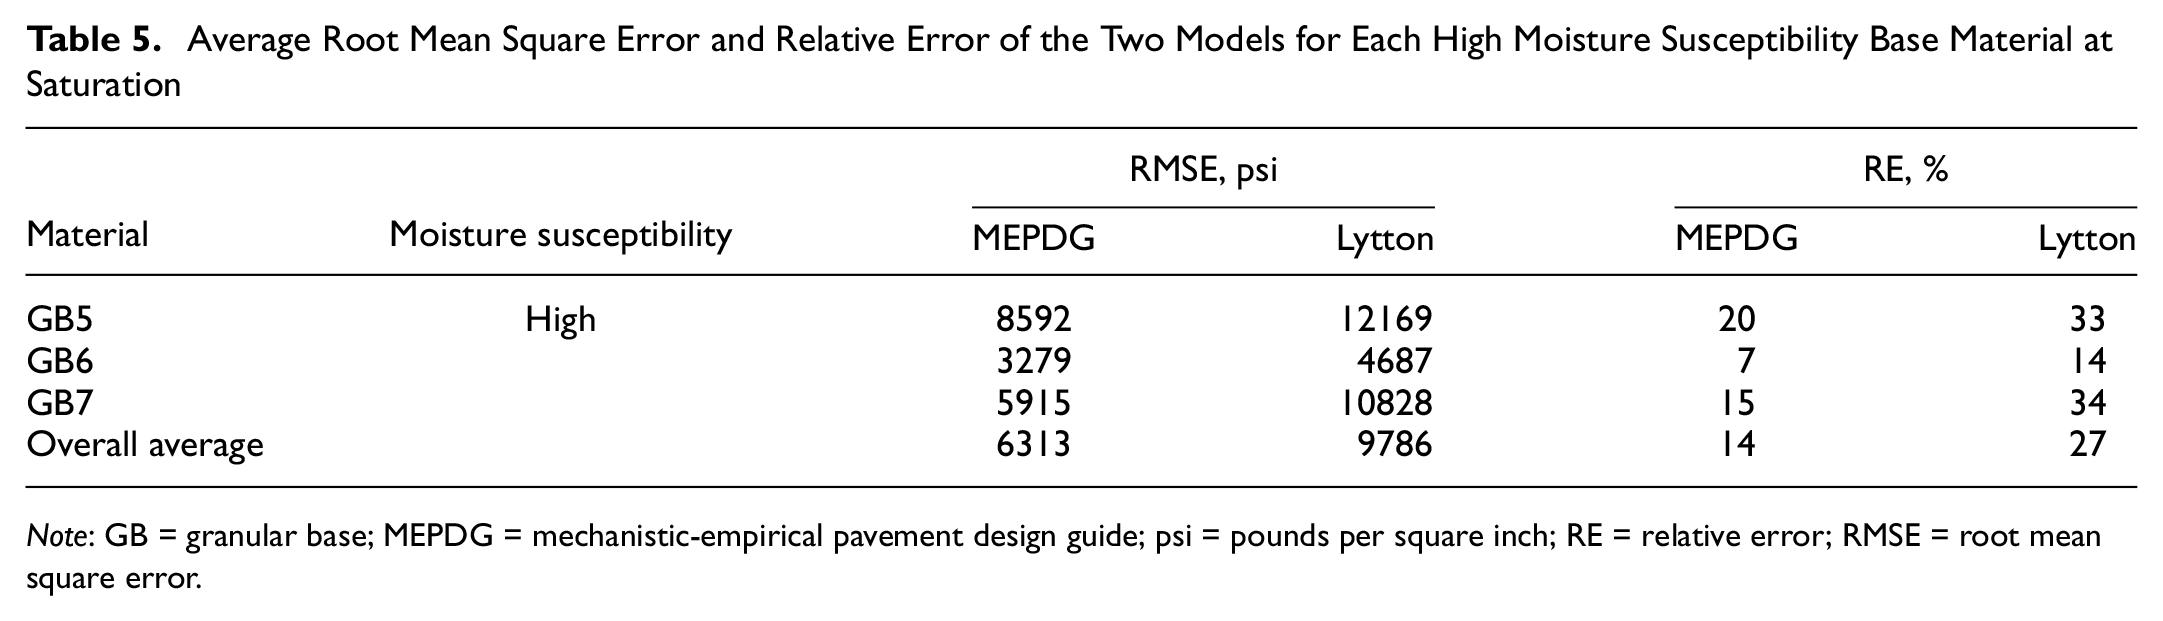
Note: GB = granular base; MEPDG = mechanistic-empirical pavement design guide; psi = pounds per square inch; RE = relative error; RMSE = root mean square error.
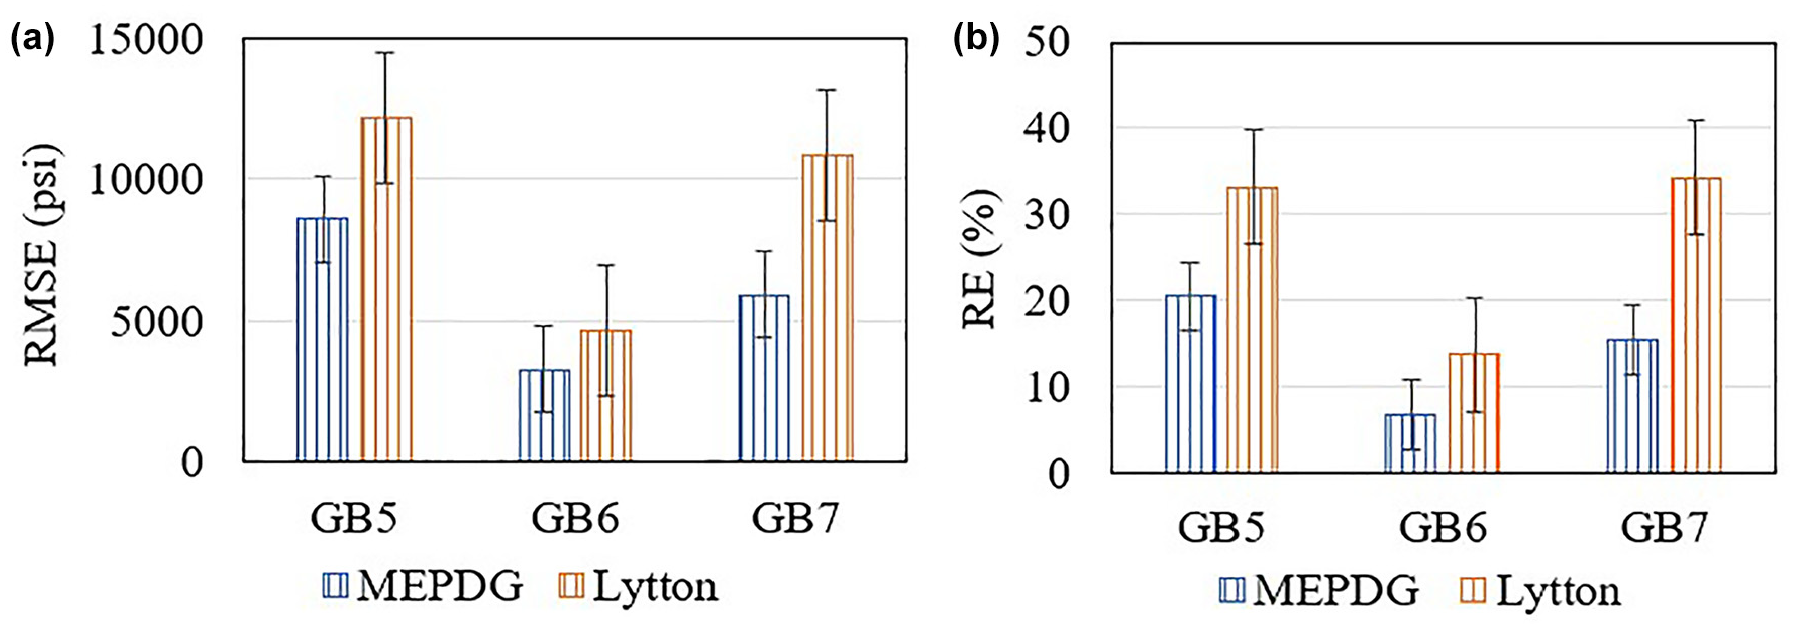
Average errors of the two models at saturation (with standard errors): (a) root mean square error; (b) relative error.
M R predicted by the two models in contrast to MR measured for high moisture susceptibility base aggregates at saturation.
In view of the results, the use of high MS base aggregates might lead to less accurate design results and pavements that are less resilient to climate water stressors, especially in coastal regions, where the likelihood of base aggregate saturation is high. Considering the inaccuracy of existing models using common practices, it is crucial to develop a new model or adaptation solutions to improve existing models to better predict MR at saturation of high MS base materials.
Prediction Equation Enhancement
As a solution to better predict MR of saturated high MS base materials, in this study, the development of prediction equations is proposed for the k coefficients in the existing models based on MR measured at saturation and using performance-related aggregate properties. To this end, a regression analysis was performed. This idea was inspired by the study of Gu et al. ( 14 ), who proposed a similar solution; however, that solution was based on MR measured at OMC, with the aim of predicting MR at OMC of all base materials.
For this study, a statistical regression analysis of the results for MR was previously conducted. The analysis demonstrated that the performance-related aggregate properties that influence the MS of base aggregates at saturation are: percentage of particles passing a #200 sieve, or fines content (FC); percentage of particles passing a #4 sieve, or fine aggregate content (FAC); fine aggregate angularity (FAA); and plastic fines content (PFC). FC and FAC are determined using, respectively, washed (AASHTO T11 ( 18 )) and dry (AASHTO T27 ( 19 )) sieve analysis. FAA is obtained following the AASHTO T304 standard procedure ( 20 ). PFC is equal to 100% minus the sand equivalency value of the material, which is obtained using the method given in AASHTO T176 ( 21 ). It was also found that FC, FAA, and PFC are highly correlated and that PFC and FAC are the best independent representatives of this set of aggregate properties in a multiple regression analysis. Therefore, to obtain prediction equations for the k coefficients in this study, a multiple regression analysis was conducted to evaluate the correlation between the measured k values at saturation and the aggregate properties (PFC and FAC) of the materials. The values of PFC and FAC of each material used in the development of the prediction equations are given in Table 2.
The results of the multiple regression analysis are presented in Table 6. An important factor in Table 6 is the significance, F, which indicates the relevance or significance of the regression equation. Values of p indicate whether the independent variables have a statistically significant effect on the dependent variables. The value of R2 reflects how effectively the resulting regression model represents the data. A significance, F, or p less than 0.05 indicates statistical significance at the 95% confidence level. As presented in Table 6, the significance, F, of all prediction equations except the k2 equation for the Lytton model was less than the significance level threshold of 0.05. The values of p for some variables were less than 0.05, while those for others were greater than 0.05. When p > 0.05, it cannot be concluded that there is a significant effect of the variable. This can be attributed to the small sample size of the MR test results measured at saturation. With more MR tests on saturated base materials, and a larger database, more reliable regression models can be obtained.
Results of Regression Analysis
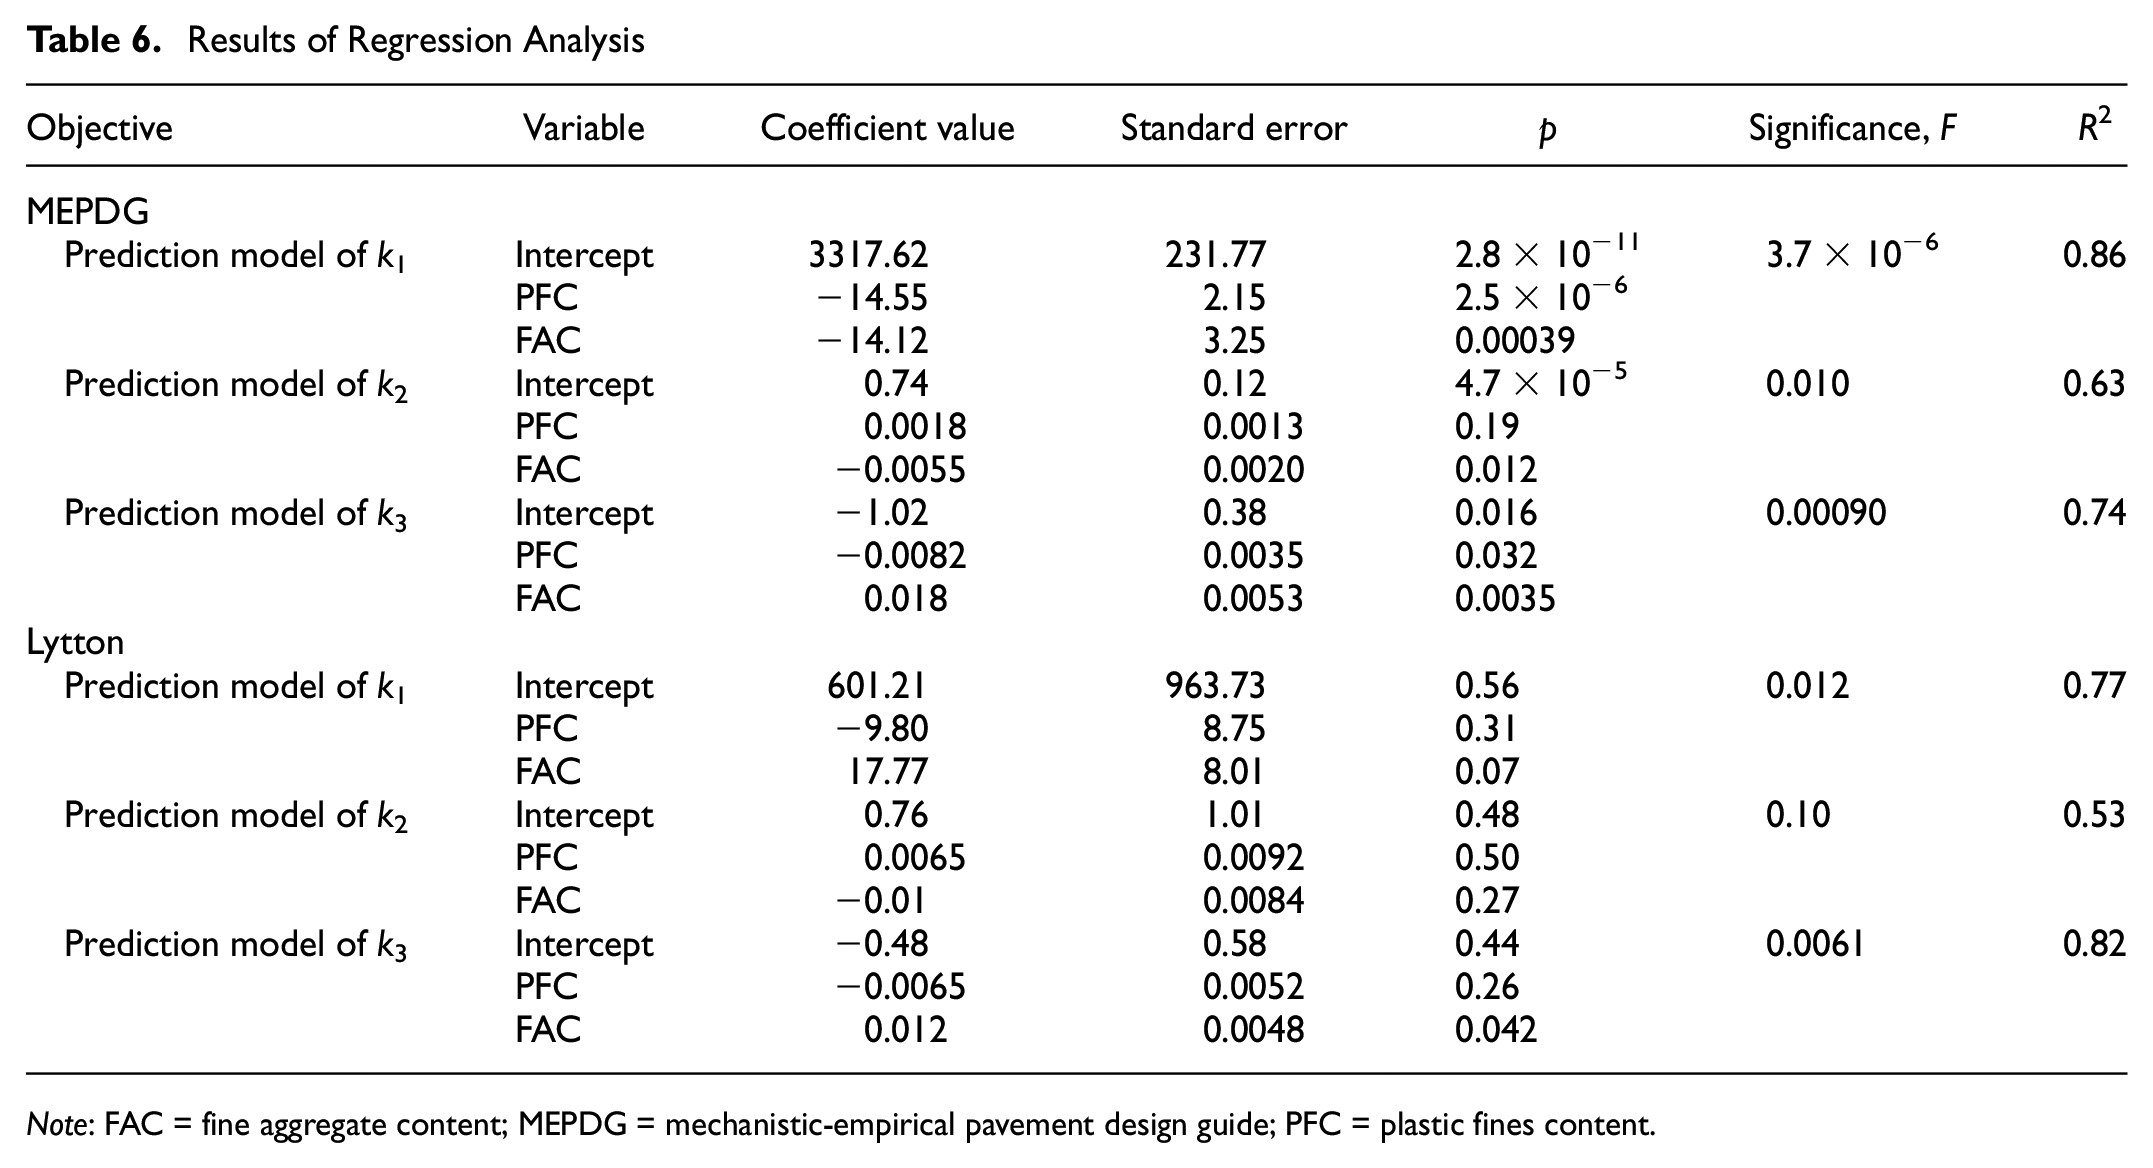
Note: FAC = fine aggregate content; MEPDG = mechanistic-empirical pavement design guide; PFC = plastic fines content.
For the MEPDG model, the prediction equations of the k coefficients at saturation resulting from this analysis are


Similarly, the prediction equations of the k coefficients at saturation resulting from this analysis for the Lytton model are


The k coefficients at saturation were predicted using the regression equations of each model. The two existing models were calibrated using the predicted k coefficients and then used to predict MR at saturation of the high MS base materials. Figure 7 is a comparison of MR predicted by the two models against MR measured at saturation for the base aggregates with high MS. It can be observed in Figure 7 that most of the points for the Lytton model are on the line of equality and most of the points of the MEPDG model are either on the line of equality or on the x-axis (measured MR) side of the line of equality. Figure 7 shows the improvements achieved in the prediction accuracy of both existing models. This was confirmed by the calculated overall average RMSE and RE, which were lower for the MEPDG model and much lower for the Lytton model than the previously obtained values, as shown in Figure 8.
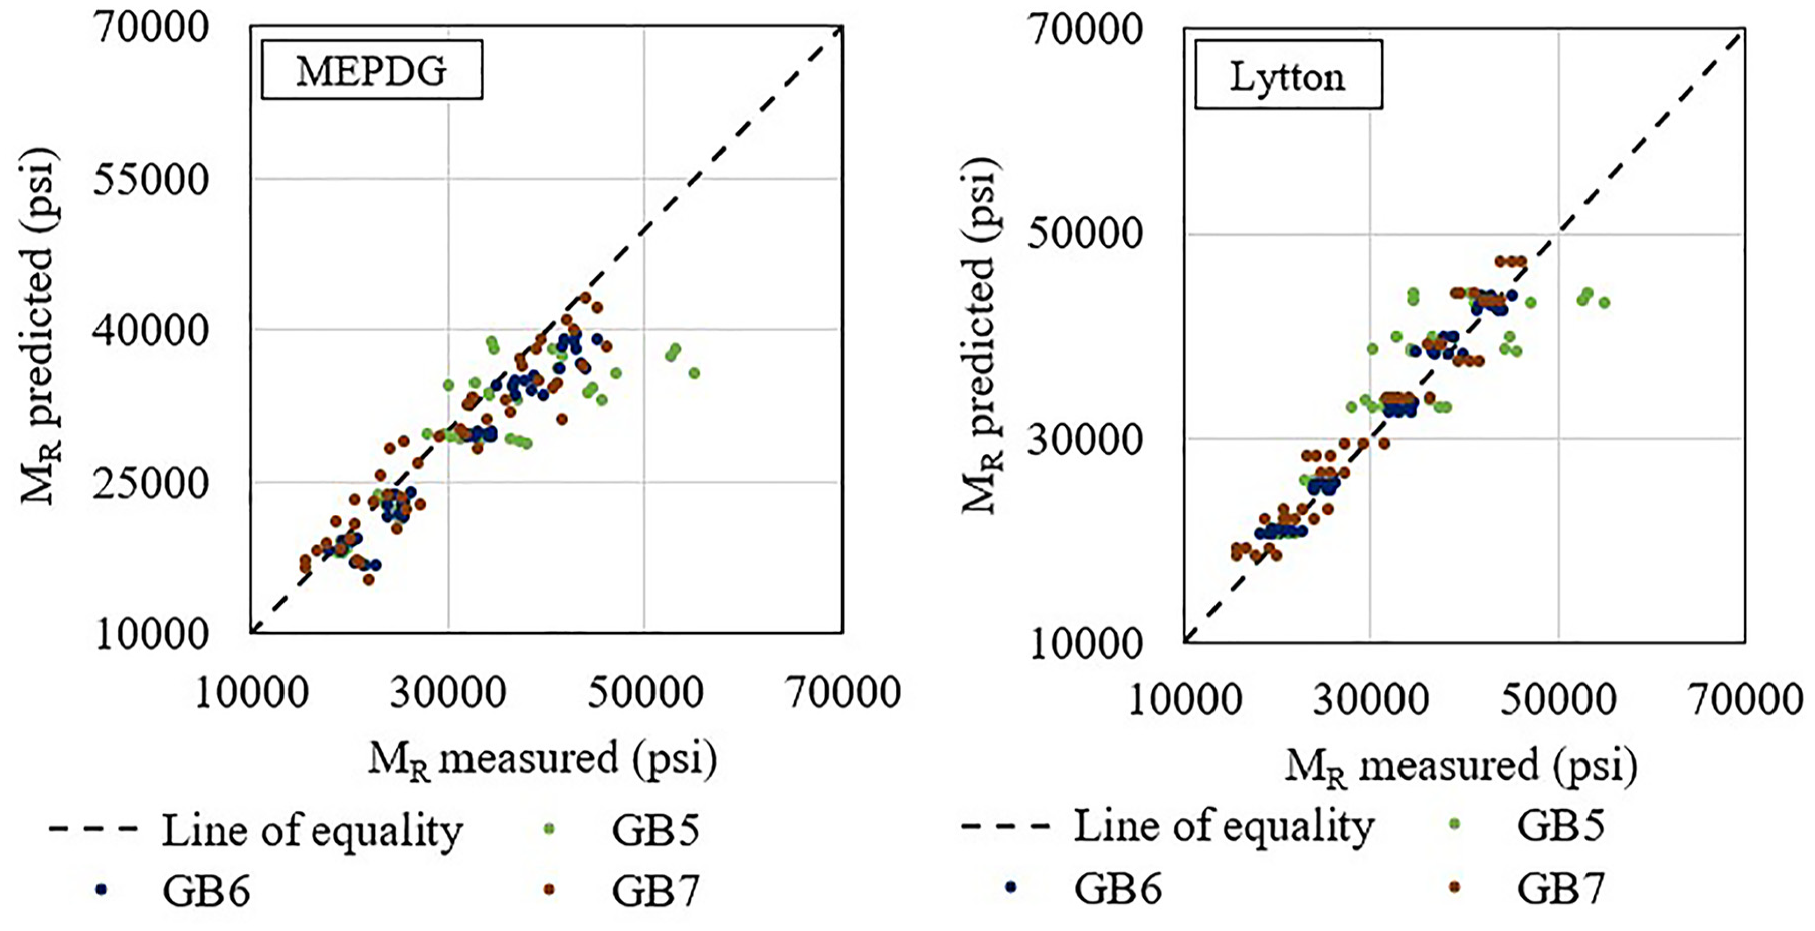
M R predicted by the two models using the proposed method in contrast to MR measured for high moisture susceptibility base aggregates at saturation.
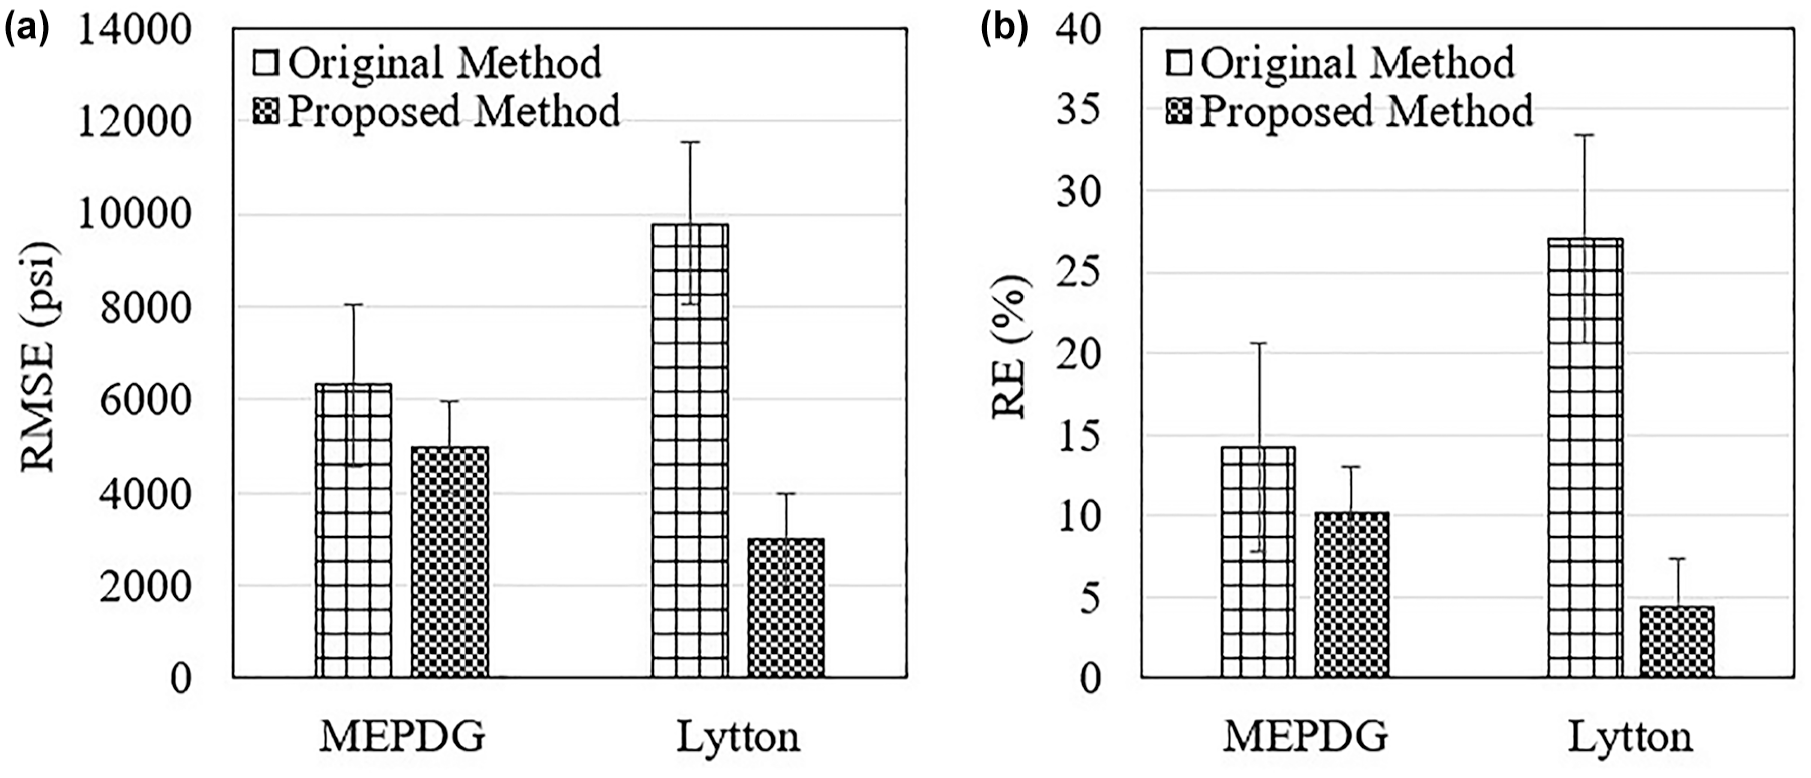
Comparison of overall average errors of the two models (with standard errors): (a) root mean square error; (b) relative error.
The overall average RMSE and RE of the MEPDG model were 4991 psi and 10%, compared with 6313 psi and 14% obtained using the original method (Figure 8). Although these values are not statistically different, the prediction of the MEPDG model changed from overprediction to more conservative; this may lead to increased pavement resilience in design. The overall average RMSE and RE of the Lytton model were 2994 psi and 4%, compared with 9786 psi and 27% obtained using the original method (Figure 8). These values are statistically and practically different. It can be concluded that, despite the low reliability of some k coefficient prediction equations, the prediction accuracy of the two existing models for saturated high MS base materials has been improved. The use of a larger dataset of k coefficients obtained from MR testing at saturation of base materials is recommended to improve pavement performance prediction, ultimately allowing for the assessment of various adaptation solutions.
Findings and Conclusions
The goal of this research study was to evaluate the performance of existing prediction models in predicting the resilient modulus of pavement base aggregates at full saturation. Seven GB materials with different properties were tested in the laboratory according to the AASHTO T307 standard procedure ( 11 ) to determine their resilient modulus under two moisture conditions (OMC and saturation). The laboratory results revealed that four of the base materials have low MS while three of them have high MS. Two prediction models, namely the MEPDG model and the Lytton model, were selected for evaluation in this study because they are the two most favored and recommended models by previous researchers. Moreover, the MEPDG model also represents the current practice. The main findings and conclusions of this study are as follows.
Findings
For all seven pavement base aggregates at OMC, both the MEPDG and Lytton models produced accurate predictions of MR.
For the low MS base aggregates at saturation, the Lytton model was more accurate than the MEPDG model, even though the difference between values of MR predicted by the two models and the actual measured values of MR was significant.
For the high MS base aggregates at saturation, both the MEPDG model and the Lytton model (calibrated using predicted SWCCs) produced inaccurate MR predictions because the difference between the values of MR predicted by both models and the actual measured values of MR was greatly significant.
To improve the prediction accuracy of both models for saturated high MS base materials, multiple regression analysis was used to develop k coefficient prediction equations at saturation for the two models using performance-related aggregate properties:
The obtained k coefficient prediction equations had low reliability, owing to the small sample size of MR test results of saturated base materials.
Despite their low statistical reliability, the obtained prediction equations were successful in improving the prediction accuracy of the models for high MS base materials.
Conclusions
Overall, the Lytton model had performed slightly better in predicting the MR of saturated pavement base aggregates than the MEPDG model.
Both the Lytton and MEPDG models overestimated the MR of saturated base aggregates that are highly susceptible to moisture, representing a higher risk of underdesign and less climate-resilient pavements. It is essential to point out that the results of the Lytton model could vary if measured suction values are used to calibrate the model parameters, even though common practices involve using prediction algorithms for SWCCs, as applied in this study.
The proposed enhancement to the MR models, consisting of developing prediction equations of k coefficients at saturation, is effective in improving the accuracy of the existing models used to predict MR for saturated high MS base materials.
The results of this study can help practitioners better appreciate the performance of existing MR prediction models at saturation and take it into account during pavement design. More MR testing of saturated base materials and the creation of a database of the k parameters obtained from those tests are recommended to improve the adaptation solution proposed in this study, for better prediction accuracy of the existing models. For future studies, the models can be evaluated using other types of GB material, apart from limestone and limerock. In view of the inaccuracy of existing models for saturated high MS base materials, it is also crucial to develop a rapid test to evaluate the moisture susceptibility of base aggregates before selecting them for pavement design and construction.
Footnotes
Author Contributions
The authors confirm contribution to the paper as follows: study conception and design: D. G. V. V. Biessan, B. F. Bowers, and J. B. Anderson; testing: D. G. V. V. Biessan, B. F. Bowers, and J. B. Anderson; data collection: D. G. V. V. Biessan, B. F. Bowers, and J. B. Anderson; analysis and interpretation of results: D. G. V. V. Biessan, B. F. Bowers, and J. B. Anderson; draft manuscript preparation: D. G. V. V. Biessan, B. F. Bowers, and J. B. Anderson. All authors reviewed the results and approved the final version of the manuscript.
Declaration of Conflicting Interests
The author(s) declared no potential conflicts of interest with respect to the research, authorship, and/or publication of this article.
Funding
The author(s) disclosed receipt of the following financial support for the research, authorship, and/or publication of this article: the Alabama Department of Transportation (ALDOT) and Federal Highway Administration through Project ALDOT (grant number 931-052).
Data Accesibility Statement
The data obtained during the study are available from the corresponding author on reasonable request.
The data and findings represented in this paper are the opinions and findings of the authors and do not necessarily reflect the opinions and findings of the Alabama Department of Transportation and its engineers or representatives.