
Abstract
This study investigates ancillary asset management practices by state departments of transportation (DOTs) in the U.S. focusing on asset prioritization, data collection, and management strategies. Specifically, this research identifies how agencies prioritize different ancillary assets and manage associated data. The study uses cluster analysis based on a survey examining 38 ancillary assets against different features. The survey was sent to 50 states and the District of Columbia, and the analyzing dataset is created based on the 39 respondents. Accordingly, it indicates that clear patterns of prioritization are followed by state DOTs for ancillary assets in which more comprehensive management is accorded to the critical ones such as drainage structures, signage, and traffic signals. It underlines the challenges DOTs face in allocating limited resources across diverse asset classes, often resulting in lower prioritizing of assets such as utilities and landscaping. This analysis also points out the trends of data management practices within the study area, including an emerging preference for geographic information system (GIS)-based systems and geospatial visualization methods. Furthermore, it statistically investigates the reasons that important asset data is not being collected, quality measures describing the status of the ancillary assets, and the tools that are being used for data collection. While acknowledging the limitations, especially the static nature of the survey data, this research provides critical insights into improving ancillary asset management strategies. The study concludes with suggestions for future research involving longitudinal studies and exploratory investigations into emerging technologies that will make it possible to manage ancillary assets more efficiently.
Keywords
Ancillary assets management is an integral part of infrastructure maintenance and is usually overlooked in transportation and related studies ( 1 ). Ancillary assets include a wide variety of elements such as guardrails, traffic signs, lighting systems, and drainage structures, necessary for the overall safety, efficiency, and durability of roadway networks ( 2 ). As concerns continue to improve the utilization of available resources and delivery of infrastructure performance, the need for an effective ancillary asset management process continues to grow for state departments of transportation (DOTs). This study focuses on how state DOTs manage 38 permanent ancillary asset classes, identified through a comprehensive process that includes reviewing Federal Highway Administration (FHWA) publications and state DOT reports, followed by feedback from an expert panel, to give the overall picture of the existing approaches, challenges, and innovations. The research is founded on detailed surveying by questioning varied dimensions in the practice of ancillary asset management concerning the data collection method, inspection and rating condition practices, quality control measures, software usage, and technology adoption. In other words, it seeks to answer to various “What?” questions about ancillary assets, particularly meaning:
What is the status of the state DOTs’ collection, inspection, and condition-rating of ancillary asset classes?
What are the reasons that state DOTs do not collect data on ancillary asset classes that are important?
What is the data content, format, and display of the ancillary asset classes that are important/not important and being collected?
What are the quality measures that describe the status of the state DOTs’ ancillary asset classes?
What are the technologies used to collect ancillary asset data?
The importance of this research lies in its potential to point toward best practices, highlight common challenges, and enhance areas that need improvement in ancillary asset management. By examining the responses of state DOTs through cluster analysis and interconnected analysis, this study aims to find out the patterns and associations that can help in more effective and efficient management strategies. Furthermore, this research comes at the right time, as so many DOTs face older infrastructure, tight budgets, and increased demand for data-based decision-making. It will help policymakers, transportation officials, and scholars to grasp how different states approach ancillary asset management, which has far-reaching implications for more standard and effective practices across the nation. Thus, it is a step toward advancing the body of knowledge by providing an in-depth review of current practices, aiming to function as a gateway for further improvements in ancillary asset management in hopes of creating more safe, efficient, and sustainable transportation systems.
Literature Review
Transportation Asset Management (TAM)
Transportation ssset management (TAM) represents a strategic and systematic process for managing transportation infrastructure assets such as pavements, bridges, and ancillary assets that optimizes resource allocation for their construction, maintenance, rehabilitation, and replacement during their life, along with considering performance goals, the management of risks, and available funding ( 3 ). TAM emerged mainly in the late 1990s, at a time when transportation agencies were faced with relentless demands for infrastructure improvement and maintenance coupled with limited financial resources ( 4 ). Traditional approaches to managing infrastructure were substantially based on reactive maintenance and short-term planning, proving ineffective in meeting long-term infrastructure needs and ensuring transportation network sustainability ( 5 , 6 ). TAM propounds an active, data-driven, performance-based approach to management which is accomplished through several components ( 3 , 7 , 8 ):
1) Inventory of Assets and Condition Assessment: There needs to be a comprehensive inventory of transportation assets stored, along with periodic assessment of their conditions, which forms an integral part of TAM. This information could provide the underlying database on which agencies can base asset management maintenance and rehabilitation prioritization.
2) Performance Modeling and Forecasting: TAM is underpinned by models for predicting future performance under various maintenance scenarios. These models aid agencies in understanding the long-term implications of alternative investment strategies and making informed decisions aimed at asset preservation.
3) Risk Management: TAM is integrated with risk management principles, which helps to recognize and mitigate possible risks emerging from failures of assets such as safety concerns and environmental impacts. This approach enables agencies to make appropriate priority investments and develop contingency plans.
4) Life Cycle Cost Analysis: TAM considers the entire life cycle costs of assets from initial construction to later maintenance, rehabilitation, and ultimate replacement. This approach provides agencies with the ability to optimize resource allocation and reduce long-term costs.
5) Cross-Asset Resource Allocation: TAM takes account of the interdependencies among different asset classes and seeks to optimize investments across pavements, bridges, and ancillary assets, based on agency goals and priorities.
6) Monitoring Performance and Continual Improvement: TAM requires that there should be constant monitoring of performance in transportation assets as a basis for modification of management practices. It is iterative, thus allowing agencies to practice the fine-tuning of management acts within changing contexts.
Improvements in data collection, management, and analytics technologies, such as geographic information system (GIS), remote sensing, and automated condition assessment tools, now facilitate the application of TAM ( 9 , 10 ). Also, because of advances in the development of asset management software and decision support systems, increasingly sophisticated analyses and optimization of asset management strategies are possible ( 11 ). Whereas, in the past, TAM has focused on high-value assets such as pavements and bridges, there has been a growing recognition lately for the role that ancillary assets could play in the overall performance and sustainability of transportation systems. Thus, state DOTs are now increasingly embracing ancillary assets into their TAM practices and recognizing the need for effective data stewardship and data modeling approaches ( 12 ).
Ancillary Asset Data Management
Ancillary assets are the secondary infrastructural components of the transportation network that have a critical role in ensuring the safe and efficient operation of the system ( 2 ). Such assets encompass a wide array of components including lighting structures, signage, guardrails, drainage systems, traffic management equipment, and utilities. Proper ancillary asset management can help to ensure that transportation networks are safe, preservation is consistent, and their resilience to be maximized. However, compared with high-value assets such as pavements and bridges, ancillary assets have usually been subject to less attention in data management and asset management practices which could be the result of several factors. One of the most important factors is that the ancillary assets are diverse, ranging from a broad asset type base with very different characteristics, thus creating maintenance needs and data requirements that make it quite a problem to find homogeneous ways of handling data ( 1 ). In addition, data is fragmented, in the sense that there are several instances whereby the ancillary asset-related information is located in various departments or agencies of a transportation organization, often resulting in inconsistent management practices which can be made worse by the specialization of the custodians ( 13 ). More importantly, the financial and human resources that could be put toward ancillary asset management have always been constrained, preventing the development of proper data collection and management systems ( 14 ). Also, while electronic documents and spreadsheets are in widespread use, which tends to reflect a movement toward digital asset management, in many agencies, paper-based records are still predominate. The parallel use of older and newer methods would support the proposition that this transition is incomplete. Advanced tools incorporating databases, GIS, and dedicated asset management systems are increasingly common, though not yet universal. This diversity of asset management systems exists within the context of evolving federal requirements such as the FHWA requirements for bridge management systems such as using a building management system for culverts. Moreover, the growing implementations of enterprise asset management (EAM) systems are basically forcing further modernization. ( 15 ). It has also been determined through various studies that the failure to manage ancillary transportation assets can significantly affect costs for state DOTs. The cost of asset failures is not only monetary, but also includes safety risks, high maintenance costs, and disruptions of mobility. For example, an unmaintained culvert may cause road washouts, resulting in very costly repairs and road closures ( 16 ). Furthermore, it has been recorded that the failure of overhead sign structures or guardrails could increase fatalities—a factor that will continue to increase litigation costs, public loss of trust, and the need for emergency response ( 17 , 18 ). Agencies with these ancillary assets as priorities in their asset management programs perform better in cost reductions, enhancing safety, and extending the life cycles of assets ( 18 , 19 ). Embedding risk-based decision-making frameworks, as adopted by the Oregon and New York DOTs, helps with effective asset management through quantifying risks and benefits in decision-making with limited available resources ( 16 ). Although these challenges are weighing up, there is a growing recognition of the importance of effective ancillary asset data management. This comes from several factors:
Accurate, up-to-date data on the condition and performance of some ancillary assets such as guardrails and lighting are essential for identification and mitigation of safety risks.
Comprehensive data on ancillary assets allows transportation agencies to implement resource optimization and provide practical strategies for maintenance and rehabilitation, leading to cost savings and improved asset performance.
Proper data management is essential for those ancillary assets subject to environmental regulations, such as drainage systems and stormwater management facilities, to ensure regulatory compliance and to facilitate reporting requirements.
Effective data management of ancillary assets plays an essential role in preserving the condition and extending the service life of high-valued assets as it supports proactive maintenance and rehabilitation strategies contributing to the sustainability of transportation infrastructure.
To reduce the challenges and tap into the many benefits associated with ancillary asset data management, a variety of techniques and technologies have been tried by transportation agencies. Key among these is standardization efforts, where consistent models for different asset types and organizations, dictionaries, and collection protocols are developed ( 1 ). Ancillary assets data management systems are also being set up in a central location to collect, integrate, and process data from disparate sources, making data easily accessible and manageable for analysis. Advanced data collection technologies such as mobile mapping systems, light detection and ranging (LiDAR), and unmanned aerial vehicles can be adopted to bring in efficiency and accuracy ( 14 ). Furthermore, mechanisms for data integration, sharing, and interoperability can also be established to ensure seamless interaction between ancillary asset data management systems and other enterprise systems such as GIS and computer-aided design ( 20 , 21 ). Developing data governance frameworks and clear data stewardship roles is one of the most important approaches that will ensure data quality, security, and optimal use of ancillary asset data ( 1 ). As ancillary asset data management gains full recognition as a critical part of transportation agency operations, there is a growing need for initial research and knowledge-sharing opportunities concerning best practices, challenges, and emerging technologies in this area. The current practices of state DOTs can be documented to add valuable insight and lay down the base for developing more effective and standardized approaches toward ancillary asset data management.
Previous Research on Ancillary Asset Data Management
While a tremendous amount of research is available on the management of high-value transportation assets such as pavements and bridges, studies that focus specifically on ancillary asset data management are relatively few. However, different research efforts previously have explored some aspects of this topic, from which many valuable lessons have been learned to help form the basis for further investigations. One of the earliest studies to focus on ancillary asset data management was done by FHWA in 2004; it recognized that ancillary assets have a very crucial role to play in supporting both the performance and life of transportation systems as a whole ( 22 ). It also brought out some of the challenges transport agencies face when managing their ancillary assets, including fragmented data, lack of uniformity in data models, and insufficient resources for collecting and managing data. Building on this foundational work, researchers at the Transportation Research Board (TRB) in 2014 published a report by the American Association of State Highway and Transportation Officials (AASHTO) on the potential of TAM in the integration of ancillary assets into EAM systems ( 23 ). Its approach was to create a comprehensive data model that captures various sorts of ancillary assets. In this respect, the proposed data model was intended to facilitate data interoperability and enable effective decision-making for asset maintenance and rehabilitation.
Another research in 2014, titled “Managing Ancillary Transportation Assets: The State of the Practice” examined the current state of practice for managing ancillary assets among state DOTs across the U.S. It documented typical challenges that include limited resources and a lack of standardized methods and tools to collect data, along with prioritizing investments across dissimilar asset classes. It also highlighted best practices and provided recommendations for improving ancillary asset management, recognizing the potential of emerging technologies, investigated mobile IoT-RoadBot and sensors for automated detection and condition assessment of ancillary assets ( 19 , 24 , 25 ). The work showed how advanced data collection methods help in supporting ancillary asset data management more accurately and efficiently. More recently, AASHTO published a guide on transportation asset data management ( 26 ). While that guide was not focused on ancillary assets, it was beneficial with regard to data governance, data modeling, and data quality practices relevant to managing all types of transportation assets and, therefore, ancillary assets. Supplementary to these dedicated studies, ancillary asset data management was mainly covered as a component of more general research efforts related to TAM. For example, some research has indicated that the results of risk-based asset management and analysis of life cycle costs support the need for considering ancillary assets within decision-making processes and resource allocation strategies ( 22 – 24 ). Throughout these research efforts, there is a recognized need to have more comprehensive and fully up-to-date documentation of the existing practices related to ancillary asset data management among state DOTs. More than ever, with transportation agencies increasingly focusing on ancillary asset management and adopting emerging technologies and strategies for data management, it becomes crucial to capture and disseminate best practices, challenges, and lessons learned (27).
Methodology
This study adopts cluster analysis and statistical analysis to thoroughly document and interpret the existing practices among state DOTs on ancillary assets data stewardship and data models. A detailed survey, based on information derived from the literature review, was prepared and sent to different state DOTs across the U.S., touching on the following key features:
Identification of other asset classes managed by state DOTs and associated data collection and inspection practices and condition rating.
The data contents, formats, and display methods utilized for ancillary asset data.
Existence and development status of data dictionaries and quality assurance/quality control policies for ancillary assets.
The survey was forwarded to the voting membership of the AASHTO committee on maintenance, representing all 50 U.S. state DOTs and the District of Columbia. A total response of 39 was obtained (a response rate of 76%). The dataset contains responses to 11 questions for each of the 38 asset classes, as represented in Table 1.
Summary of Survey Questions
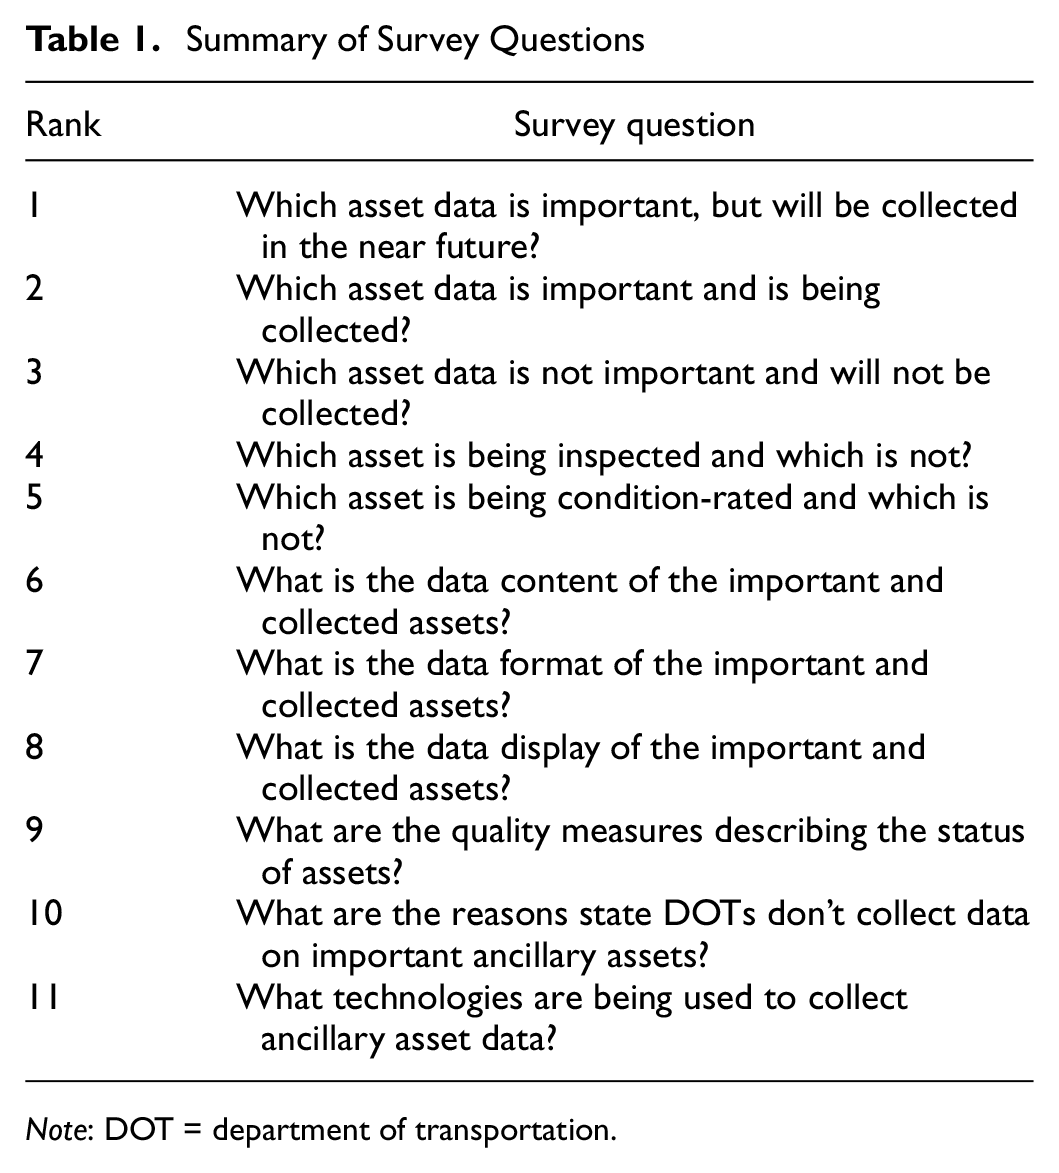
Note: DOT = department of transportation.
Three questions are descriptively analyzed: “What are the reasons state DOTs don’t collect data on important ancillary assets?”“What are the quality measures describing the status of assets?” and “What technologies are being used to collect ancillary asset data?” The other eight questions are analyzed through hierarchical clustering methods to determine the possible patterns in state DOTs asset management practices across 38 different asset classes. This methodology consists of several steps: data preparation, distance calculation, hierarchical clustering, and optimal cluster determination. The first three questions investigate ancillary asset classes condition status through asking about the importance and the collection condition of the asst data, including: “Which asset data is important, but will be collected in the near future?”“Which asset data is important and is being collected?” and “Which asset data is not important and will not be collected?” The next two questions ask if the asset classes are being inspected and if they are being condition-rated. Finally, the last three questions delve into data content, format, and display of the important and collected ancillary asset classes. Also, to further simplify the analysis, responses such as “unknown/unsure” and “others” are ignored, as they do not provide insights to the study. For the questions that have more than one feature to do the cluster analysis, the data is normalized to account for differences in response rates between features and asset types. The normalized value

where
This ensures that, for each question, the sum of all responses is 1.0, therefore making them comparable to one another across asset types, which may differ in total response count. The K-means clustering algorithm is employed for the cluster analysis after determining the optimal number of clusters using the elbow method and silhouette score. The resulting clusters are independent and assigned numerical labels based on the analysis outcome, without any specific order or ranking. Furthermore, results of the clustering are validated through using the cophenetic correlation coefficient which calculates how faithfully hierarchical clustering preserves the pairwise distances between the original data points and silhouette analysis; it is used to assess the overall quality of the clustering.
Results and Discussion
The cluster analysis of the importance of asset data, data collection status, and perceived unimportance, which are the first three questions of the survey, gives a holistic view of how ancillary assets are prioritized and managed by state DOTs. Figure 1 represents the summary of the results of the first question’s cluster analysis asking about “Asset data is important and is being collected.”
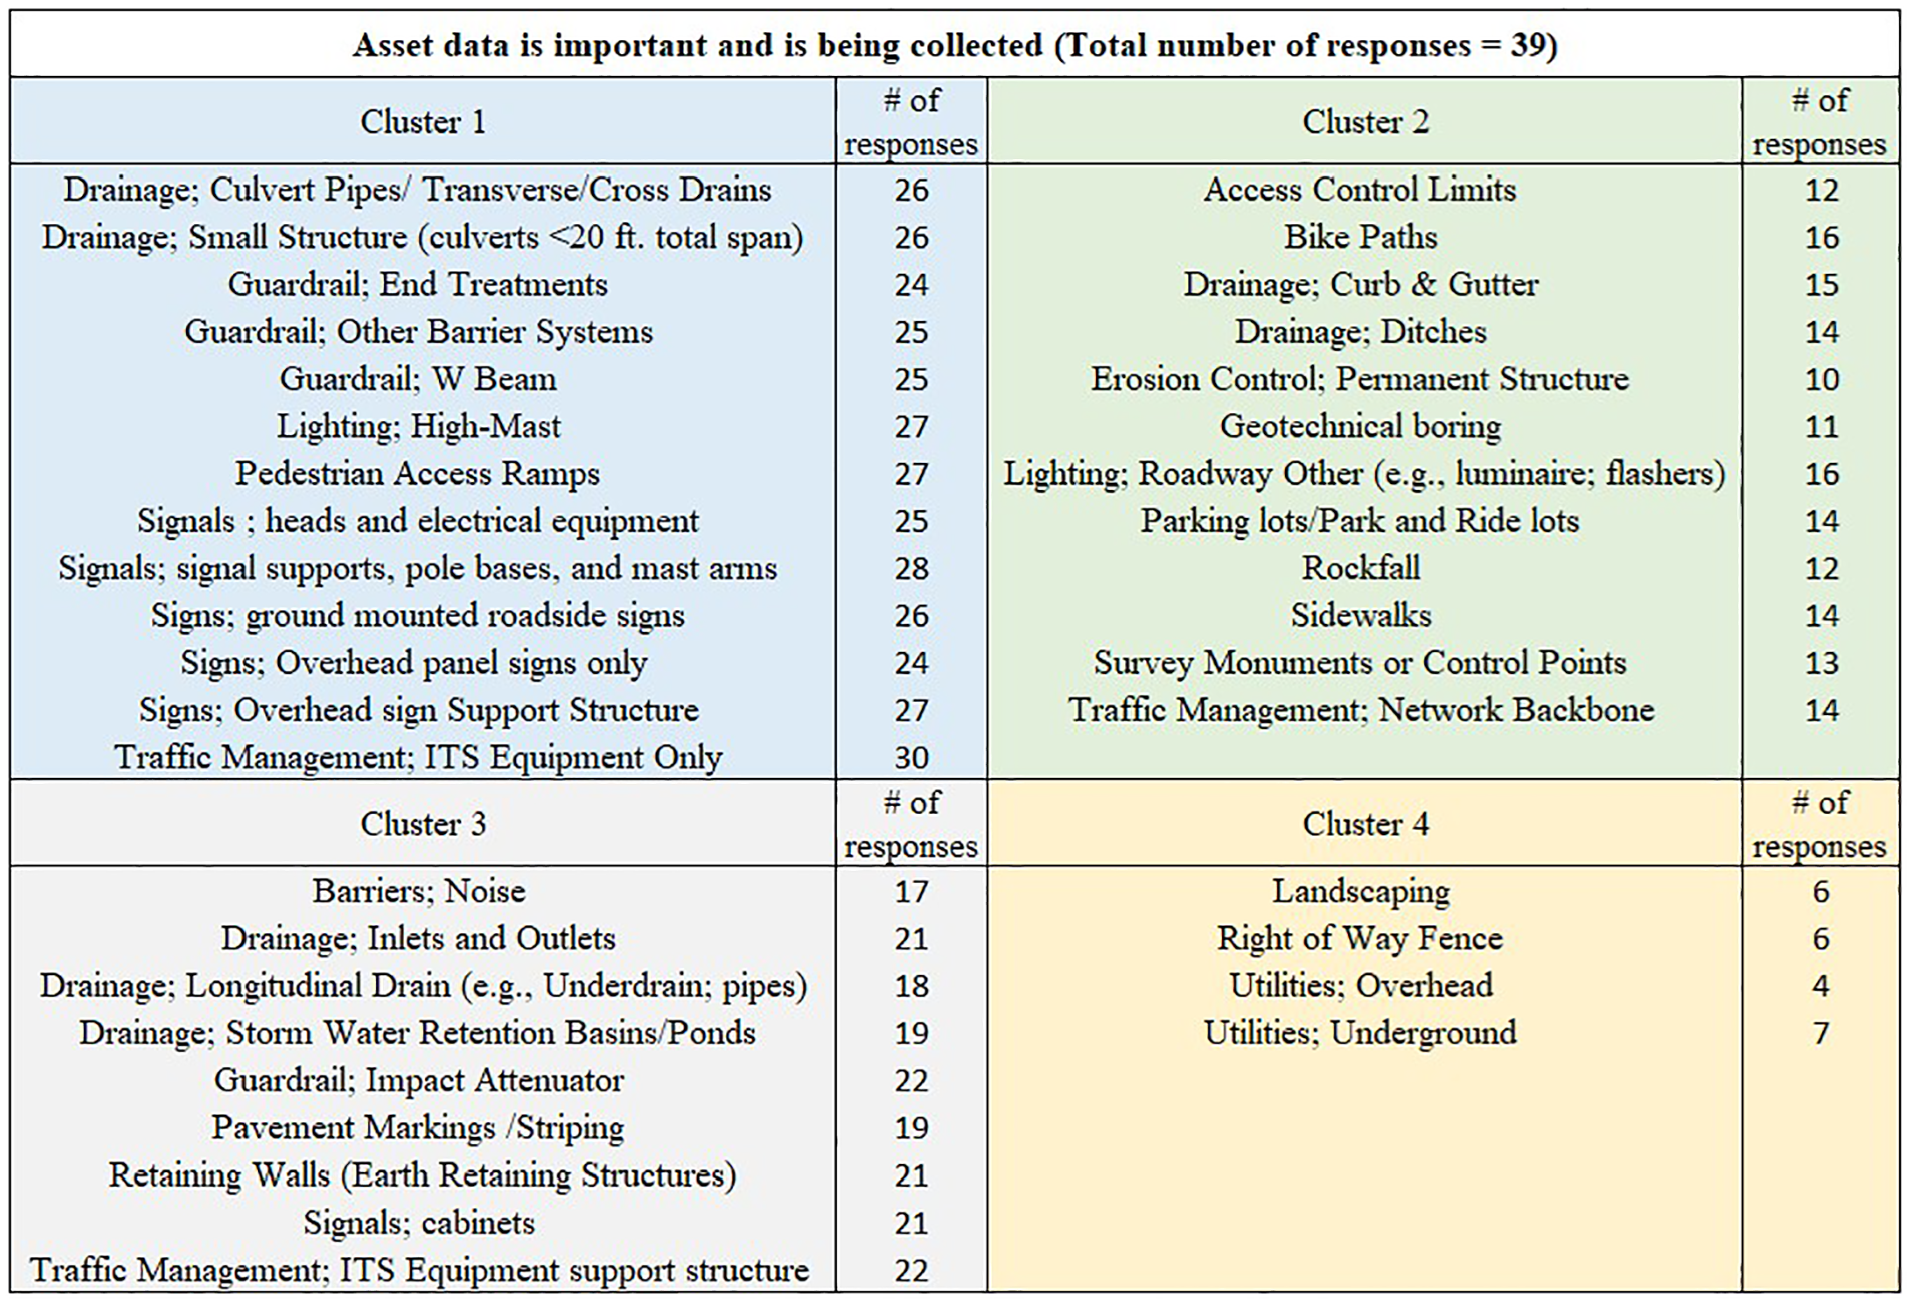
Summary of clusters for “Asset data is important and is being collected.”
The results of the analysis show that there are four clusters that state DOTs are now focused on for collecting data. The first one consists of 13 asset classes, including critical infrastructure such as drainage structures and traffic signals, which represent consistently high data collection rates across state DOTs. Two other clusters indicate moderate to above-average collection rates, while the fourth cluster, which includes landscaping and utilities, shows extremely low collection rates. Moreover, after analyzing “Asset data is important and is not being collected?” four clusters emerged, ranging from highest to least rates in data collection, as shown in Figure 2, representing where the state DOTs’ focus needs to be. The first cluster consists of 11 asset classes, including bike paths and drainage inlets, representing a moderate rate in data collection. On the other side is the second cluster consisting of nine asset classes, including guardrails and traffic management equipment, of which data rarely remains uncollected. The third cluster, comprising six asset classes, including drainage ditches and utilities, faces the greatest rates in data collection, while the fourth cluster of 12 asset classes shows moderate rates.
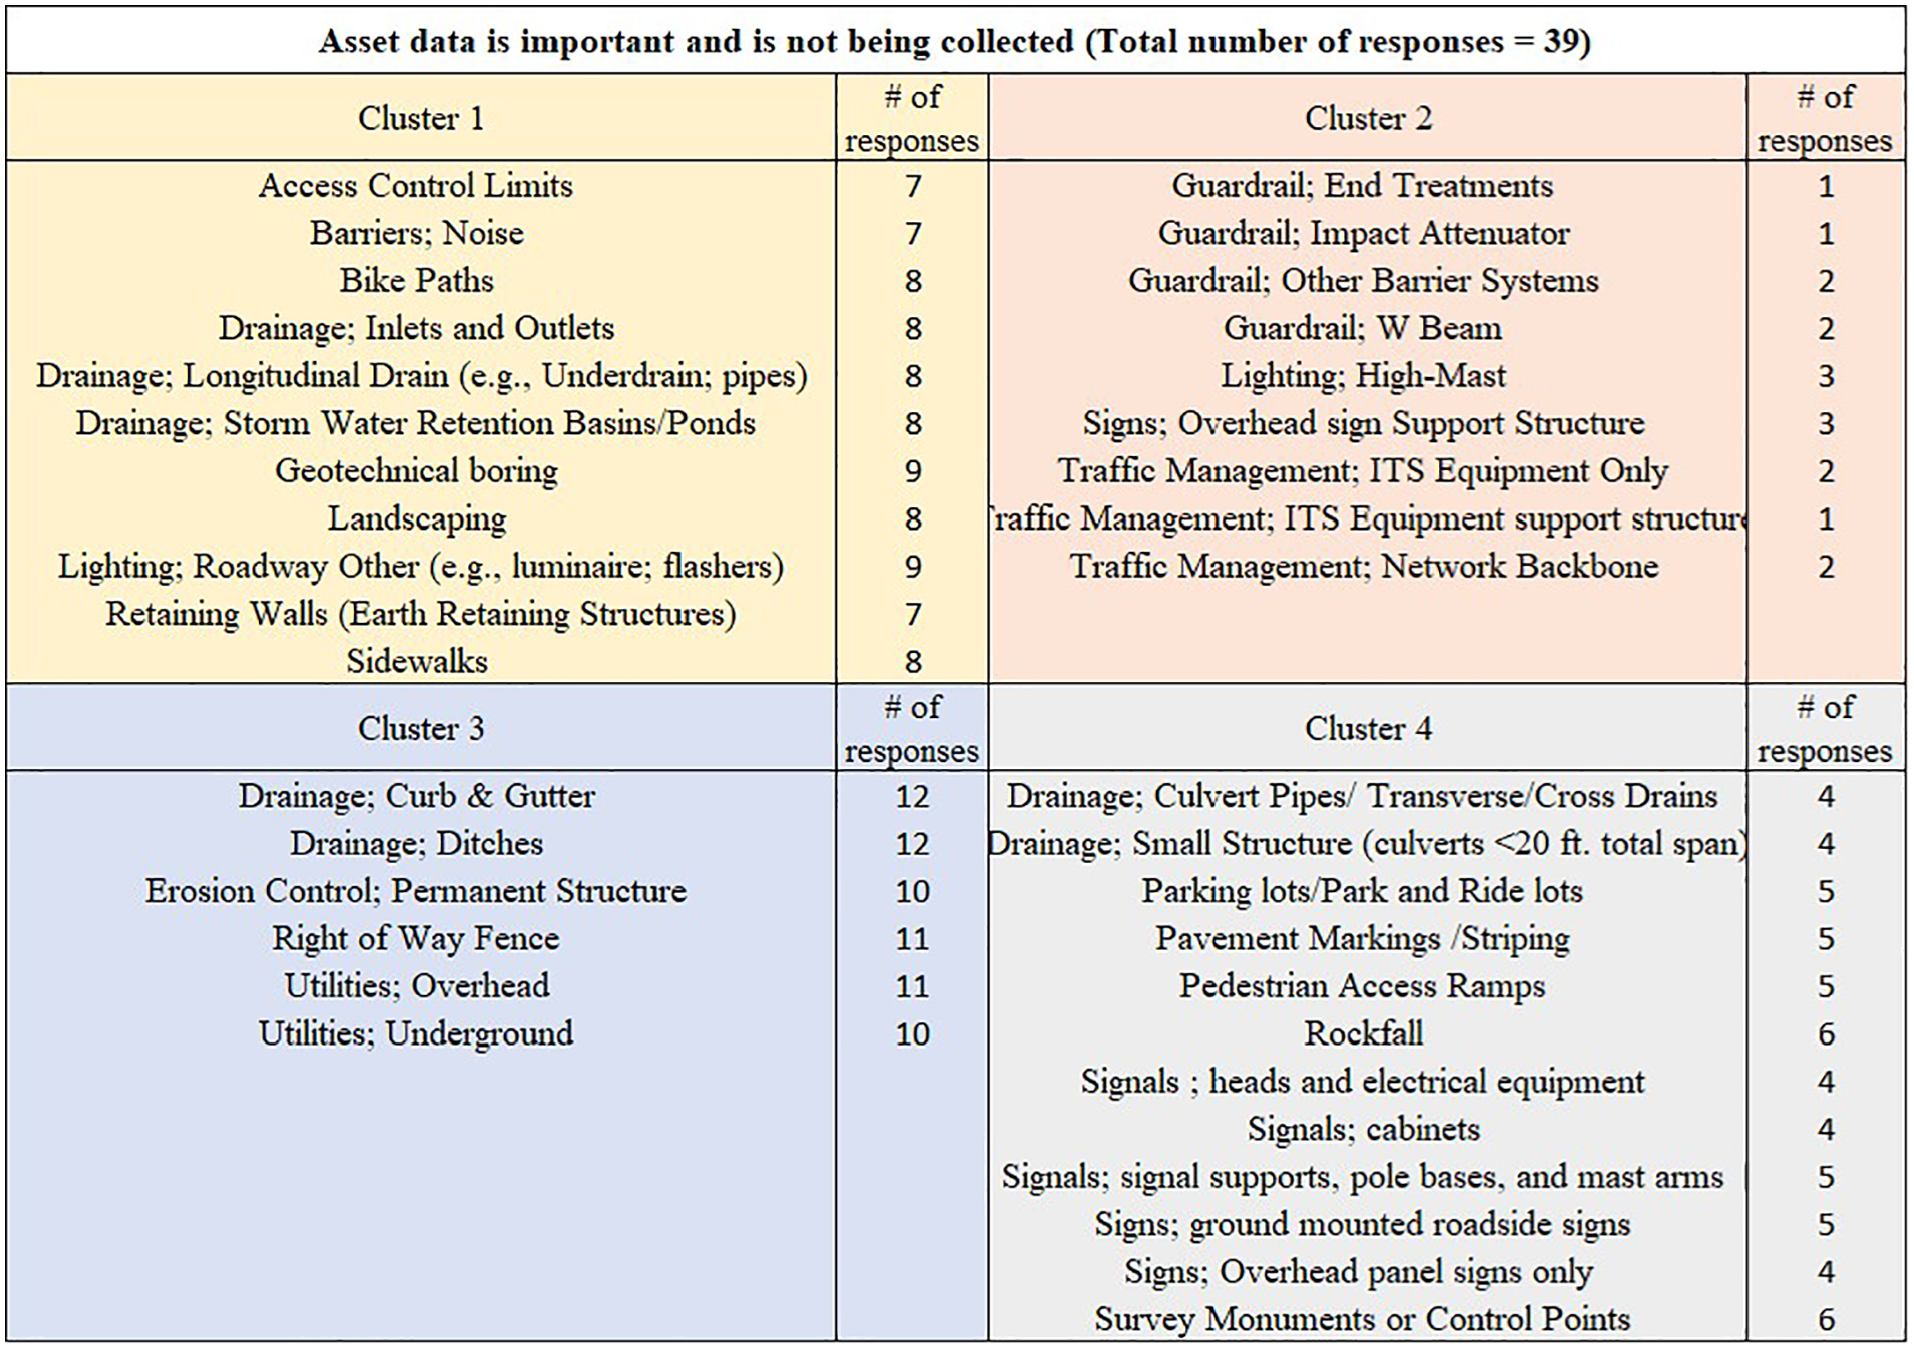
Summary of clusters for “Asset data is important and is not being collected.”
Furthermore, getting insights from another question of the survey investigating “What are the reasons state DOTs don’t collect data on important ancillary assets?” sheds light on the importance of challenges they face and prioritizes them. According to responses gathered, as shown in Figure 3, major barriers to data collection are resource constraints and technical problems. The three primary challenges that emerged were inadequate infrastructure and staff resources to collect and manage asset data, followed by insufficient guidance and lack of technical models.
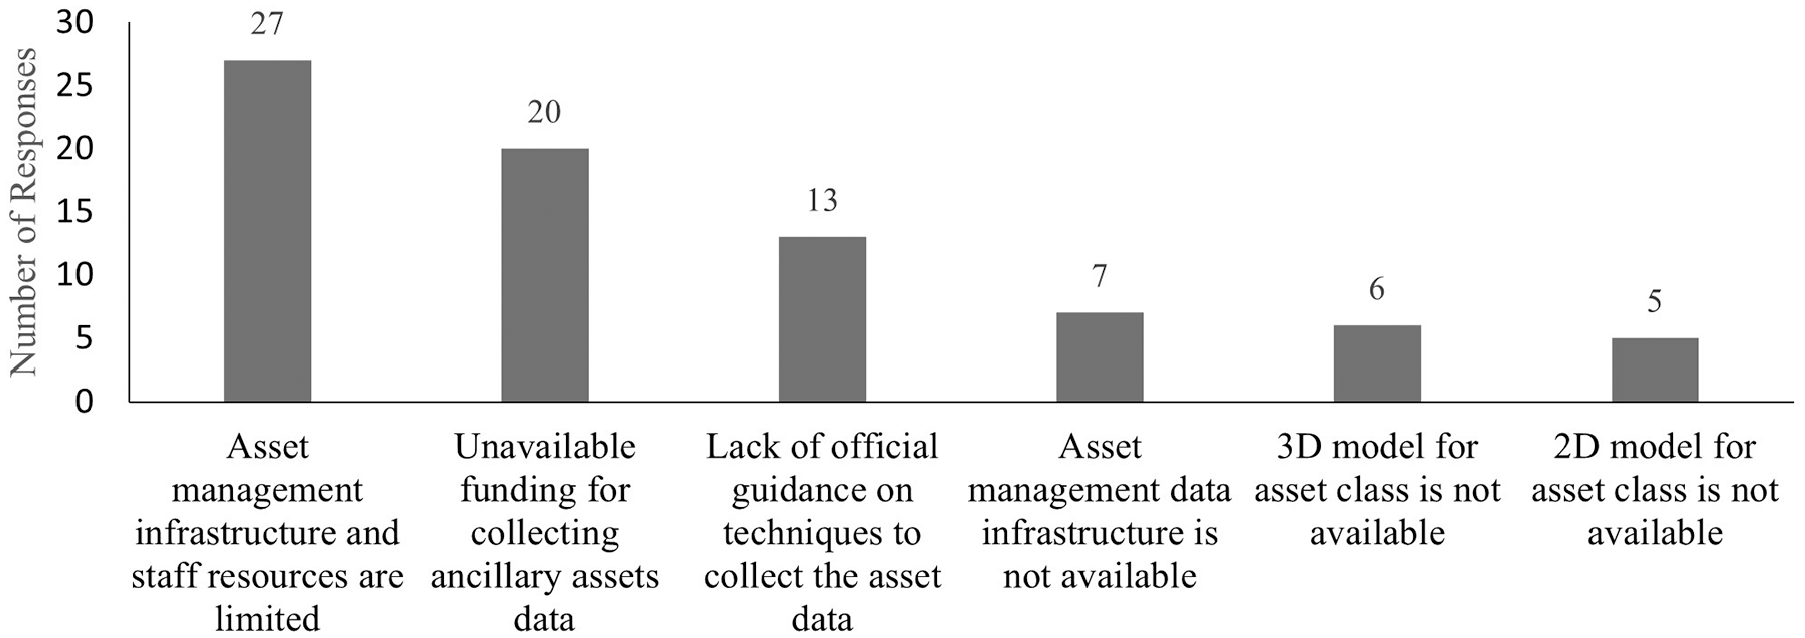
Reasons state departments of transportation do not collect data on important ancillary assets (out of 39 responses).
This understanding can be further fine-tuned by an examination of “Which asset data is important and will be collected in future?” representing the direction that state DOTs’ focus will be, where three distinct clusters are identified, as shown in Figure 4. The largest cluster, cluster 2, comprising 17 asset classes with extremely low rates of being collected in the future, includes assets such as bike paths, landscaping, and pedestrian access ramps. There is also a smaller cluster of 16 assets, cluster 1, with data that are more likely to be collected, which includes items such as rockfall, sidewalks, and signs. Moreover, cluster 3 represents the asset classes that are the most probable assets that state DOTs try to collect data about in future, including guardrails and pavement markings which are considered as highly important safety-related assets.
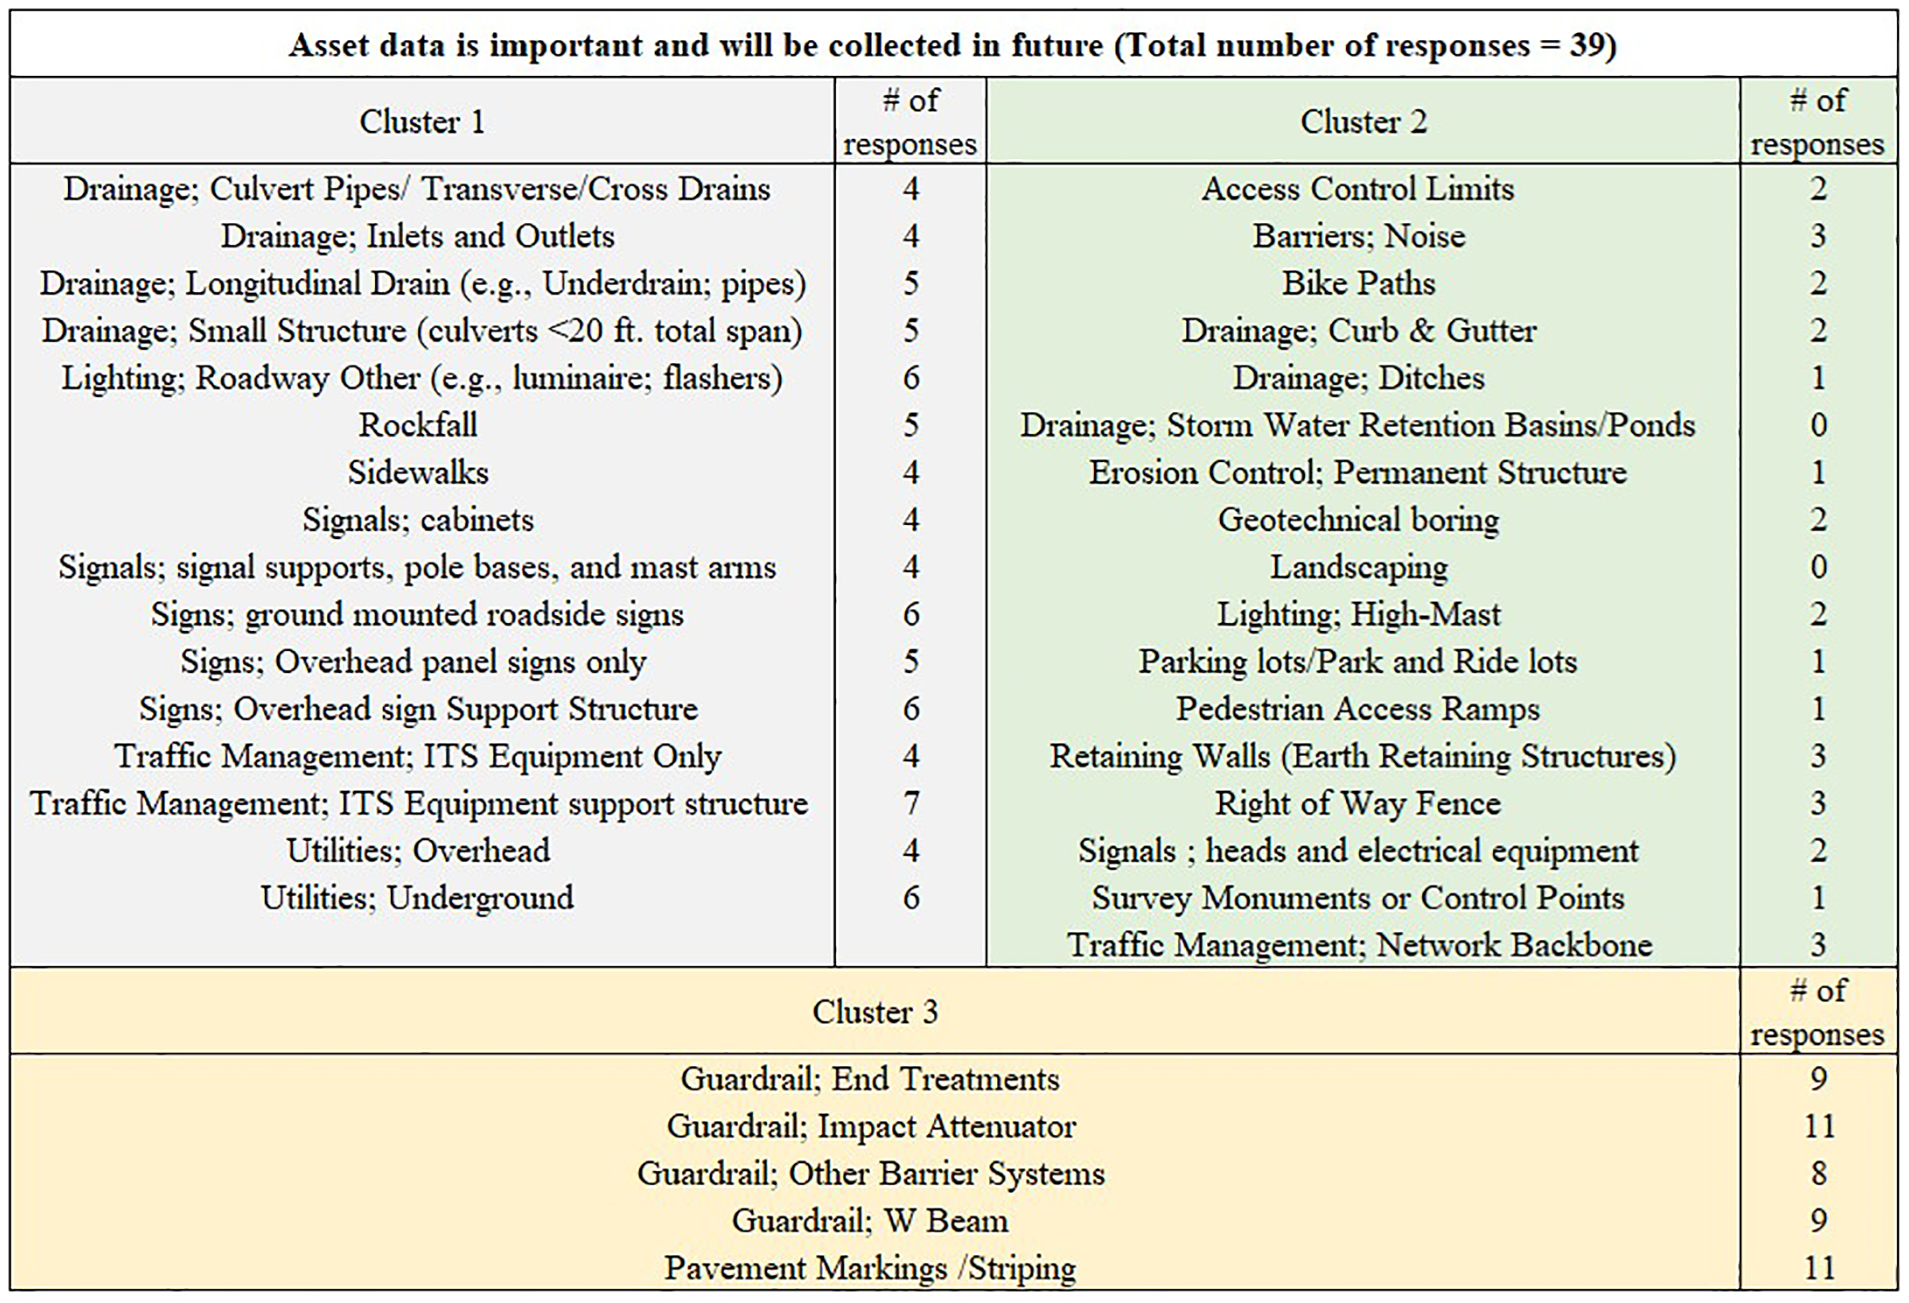
Summary of clusters for “Asset data is important and will be collected in future.”
The results of this integrated analysis show that there is a clear pattern in the state DOTs’ prioritization. While critical infrastructure elements have generally and consistently been recognized as important asset classes and their data have been collected, there are some different approaches for other types of asset classes, such as landscaping and utilities, either in data collection or perceived importance. Reasons given for not collecting important asset data reflect the context for these patterns and suggest DOTs may be forced into making difficult decisions, prioritizing their limited resources among various important asset classes. This often results in a situation focusing more attention on the most critical or high-risk asset classes, while other important asset classes receive less attention or effort with regard to data collection.
Moving on to the next set of questions, the analysis of inspection and condition rating practices of assets by state DOTs seems to reveal interesting patterns of how different ancillary assets are prioritized and managed. With regard to asset inspection, a clear hierarchy of which assets get the most attention is evident. The topmost frequently inspected and condition-rated clusters are shown in Figure 5.
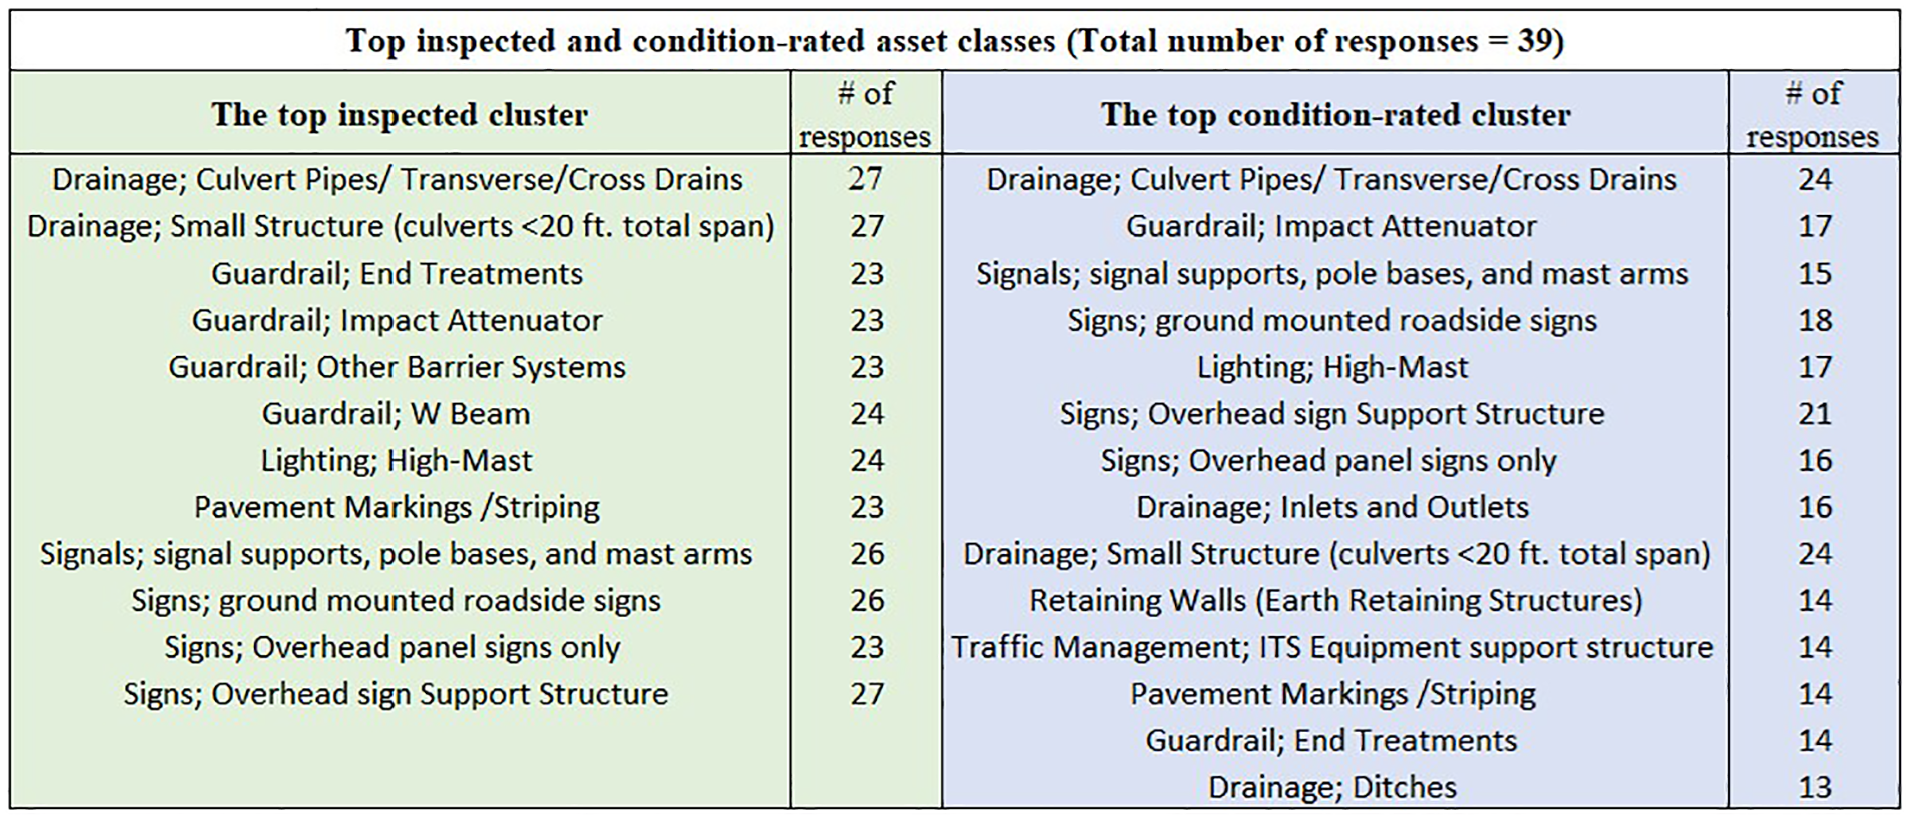
Topmost clusters for inspected and condition-rated asset classes.
As illustrated, the top inspected asset classes are basically those types of assets critical for the safety of the roads and the management of traffic which can explain high rates of inspection, meaning that state DOTs prioritize maintaining the functionality of signage, drainage systems, guardrails, and traffic signals. On the condition rating side, a similar pattern emerges, but with some differences suggesting a strong correlation between the practices of inspection frequency and condition rating, particularly for those assets that play an integral role in maintaining road safety and visibility.
As the last step of the cluster analysis, “data content, format, and display of the important and collected ancillary asset classes” manifests complex patterns in asset information management by state DOTs. Analyzing data collection methods of the asset’s content, five different clusters were identified, as shown in Figure 6. One remarkable cluster of eight assets, cluster 3, including drainage structures, lighting, and signage, manifested the maximum rates of design model generation, as-built model creation, and field inventory data collection. This infers that the most extensive data collection efforts are made on these assets, which is probably because of the critical nature and complexity of these kinds of assets. Another cluster, cluster 4, includes four assets related to guardrails, showing high rates of remote inventory data collection and geospatial referencing. This may indicate a preference for effective and large-scale data gathering for these pervasive assets. Cluster 5, including 11 assets, such as barriers and pedestrian access ramps, indicated a moderate rate across all data collection methods, highlighting a balanced approach to managing these diverse asset classes.
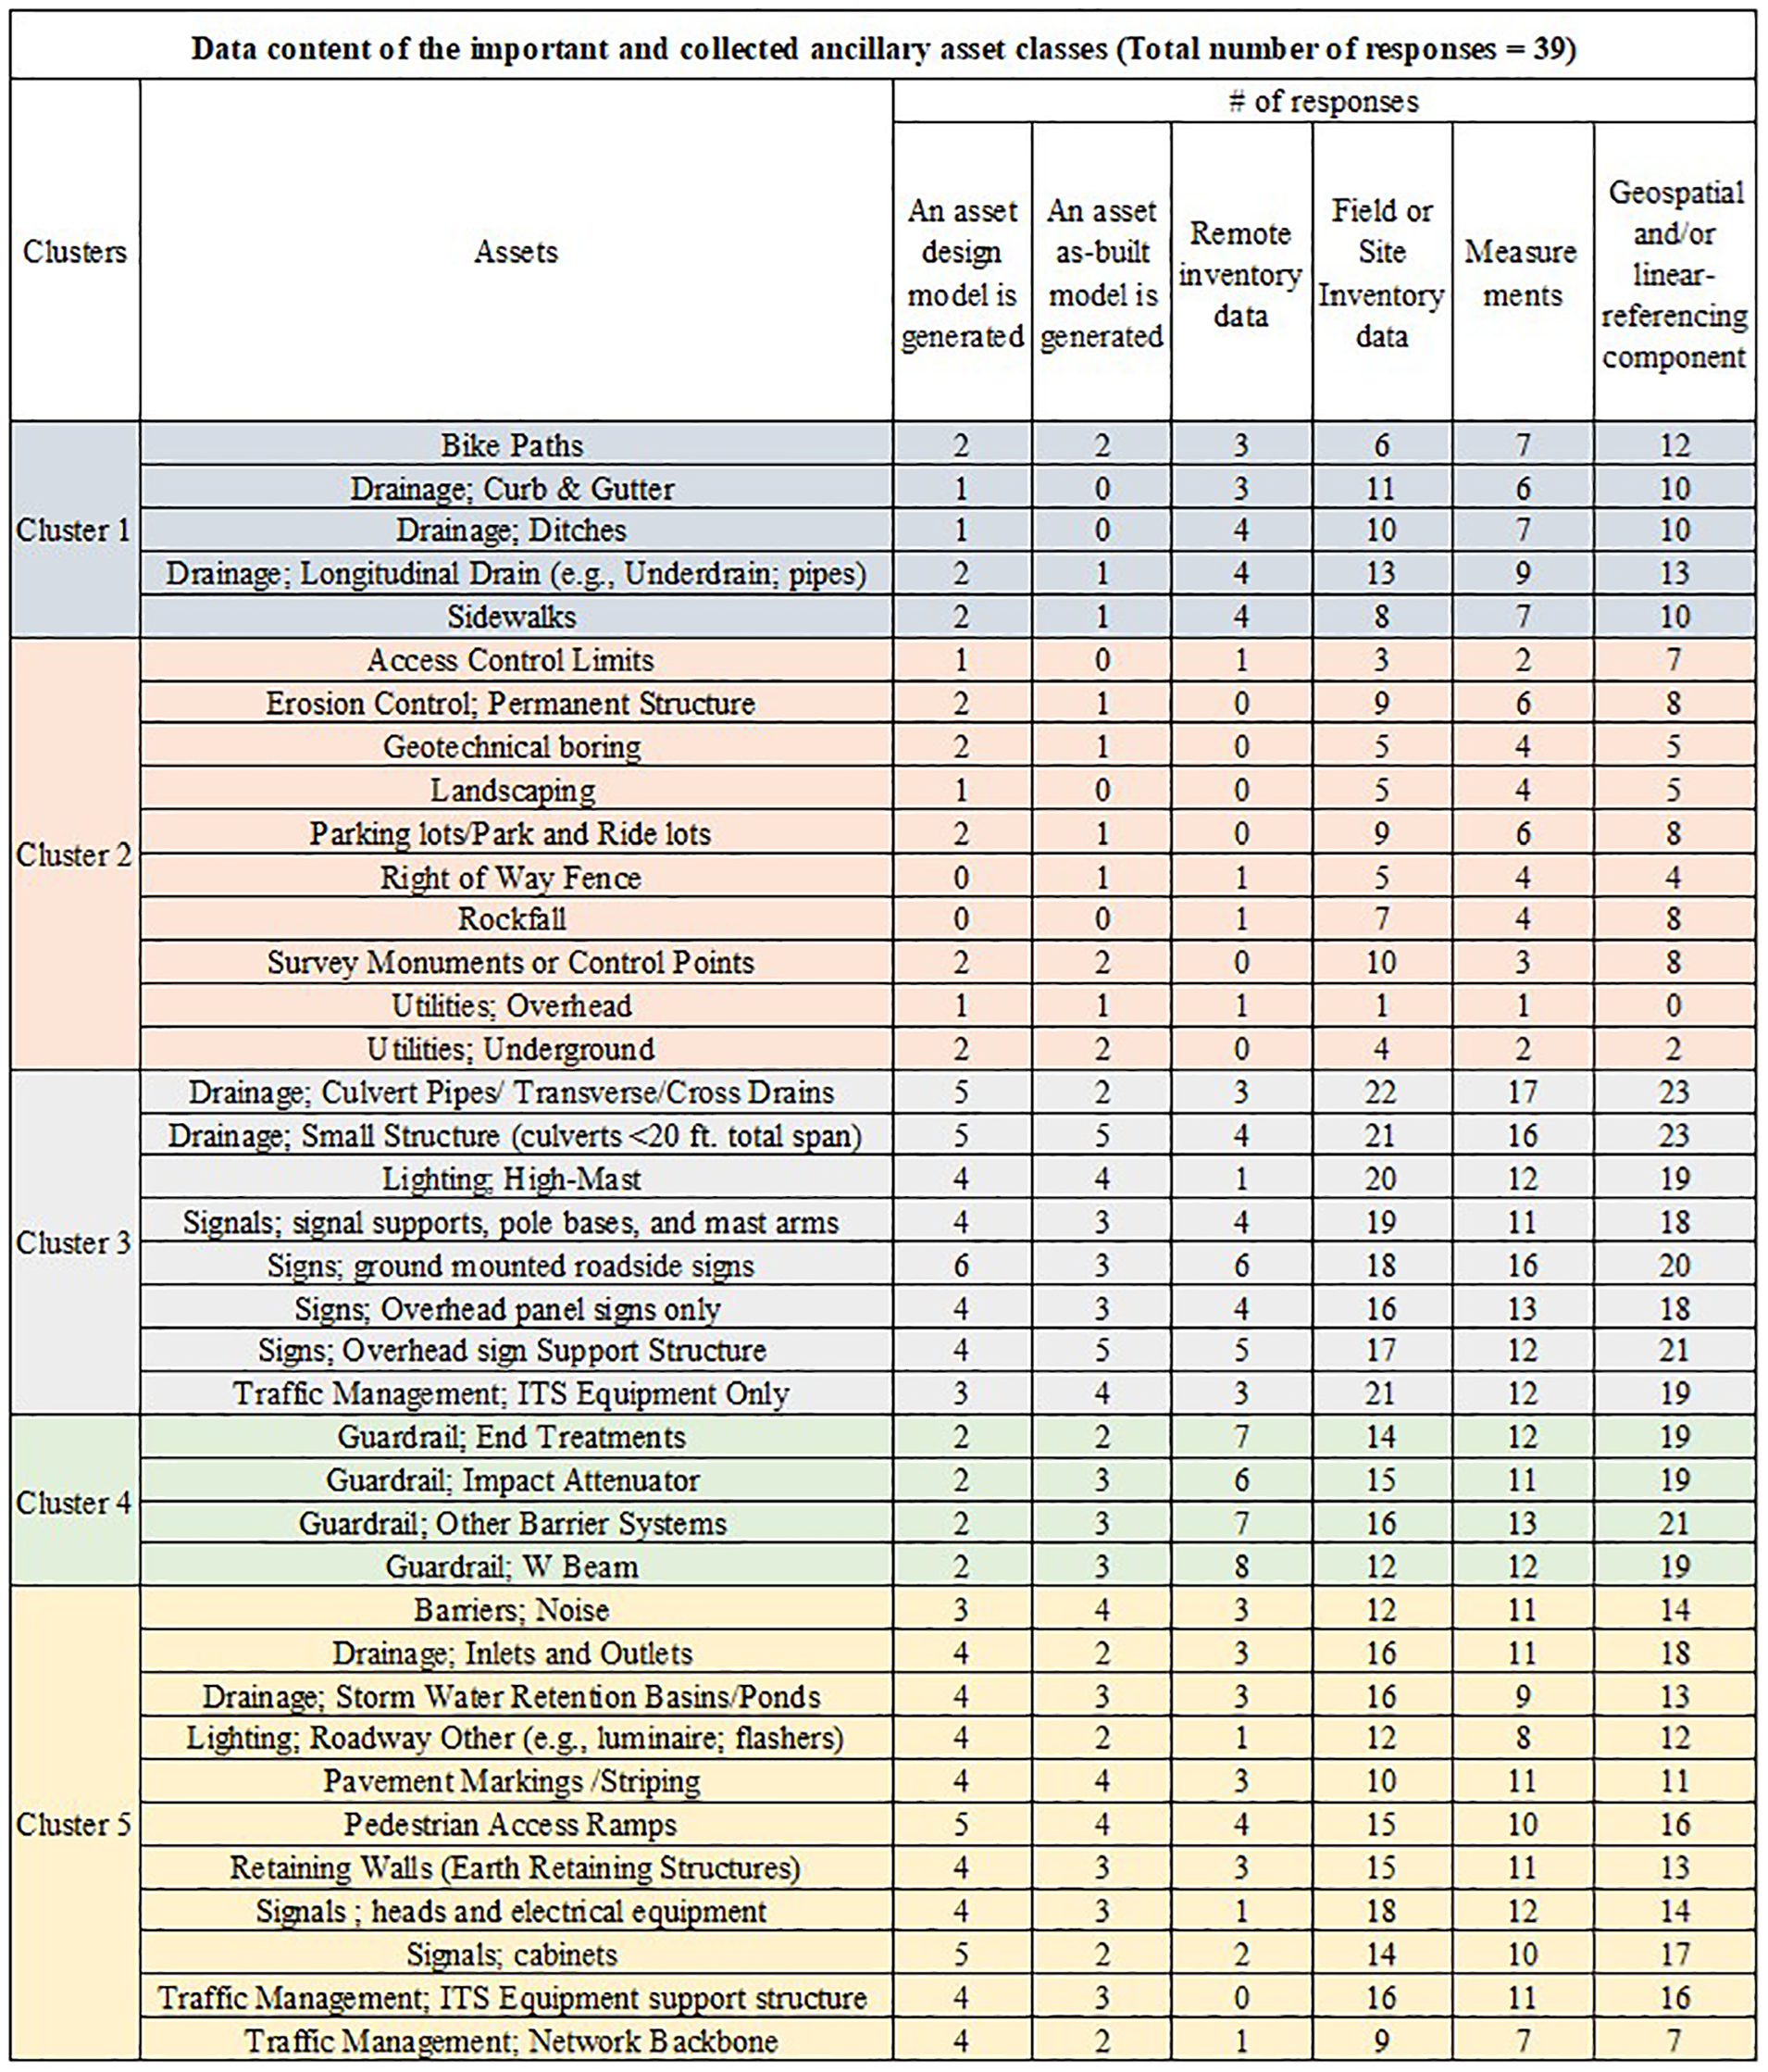
Summary of clusters for data content of the important and collected ancillary asset classes.
Furthermore, analysis of the format of the collected data returned four clusters representing different preferences in data management, as represented in Figure 7. One cluster, including nine assets mainly related to lighting, signals, and signs, indicated the highest presence of paper-based records, electronic documents, and specialized databases. Its extensive approach to data collection and management might indicate that these sets of assets are considered a high priority by DOTs. In general, increased application of more sophisticated data management techniques, such as unique software or geodatabases for these asset types, would tend to indicate significant investment in tracking and maintaining these assets. This emphasis likely results from their critical role in traffic safety and operation, as well as their high maintenance frequency and specific technical requirements. The resource allocation by DOTs toward advanced data collection methods on these assets considers the balance in operational importance, safety considerations, and maintenance needs, providing insights into how they determine asset priorities. Another group of 11 assets, including drainage and guardrail systems, showed a strong inclination toward GIS geodatabases and specialized software, indicating a move toward higher spatial-based modes of data management, such as specialized software and database development, for these geographically dispersed assets. Another small cluster of six assets, including items such as geotechnical borings and pedestrian access ramps, showed a medium use in all formats, suggesting transitional state from traditional to more technological methods in data management practices for these kinds of assets. Thus, while the use of multiple systems does bring some inconsistencies to the data, it also represents a kind of phase during which agencies can learn from both traditional and modern approaches and, therefore, could develop better and effective decision-making processes driven by data. This can be called a “transitional period” because it reflects the complicated reality in which transportation agencies start to balance in their relations between legacy systems and the growing requirement for more complex data management in the evolving regulatory environment.
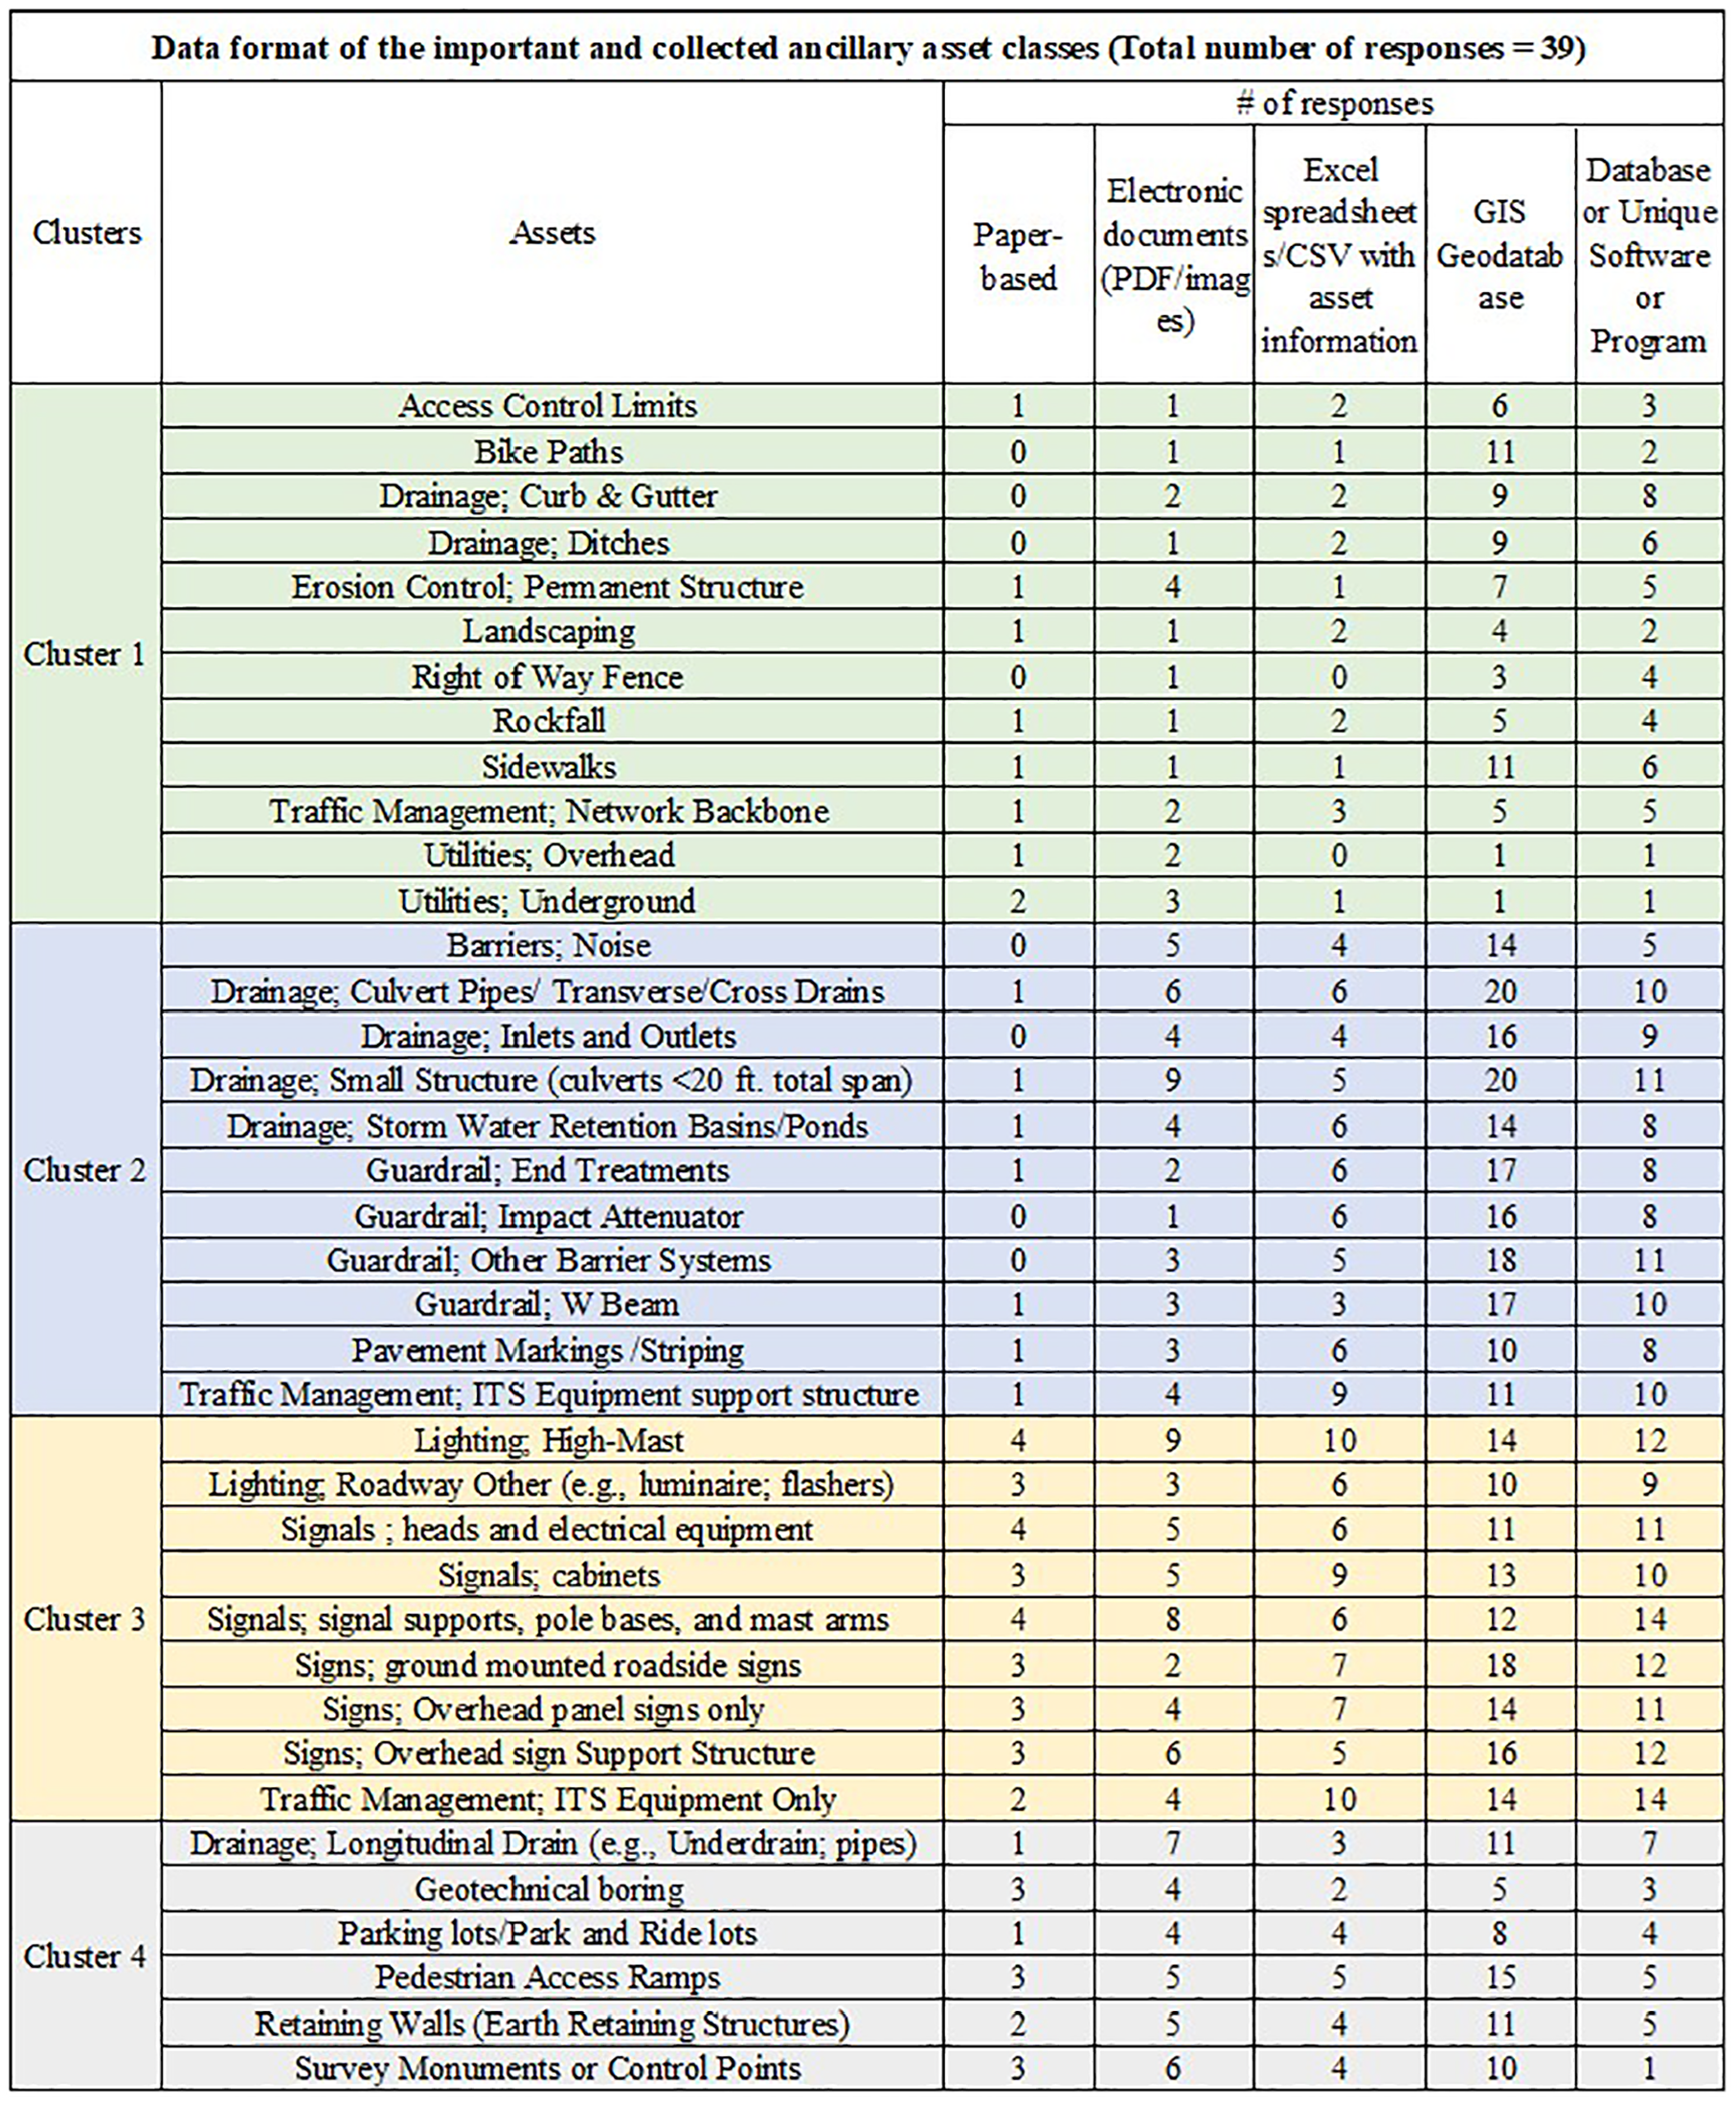
Summary of clusters for data format of the important and collected ancillary asset classes.
Also, different preferences in the display of data can be seen in four clusters, as shown in Figure 8. Cluster 1 with nine assets, including guardrails, pedestrian access ramps and signs, represent the highest use of 2D geospatial maps and some use of 3D maps. This indicates the maximum spatial representation of those assets, possibly because of their linear nature or wide distribution. Another cluster of 10 assets, cluster 4, mainly drainage, lighting, and signals, shows strong support for both 2D maps and tabular formats that require access to both spatial and detailed attribute information. Cluster 3 also with a group of nine assets indicated only moderate use for all display methods, which could indicate a flexible approach to data visualization for those asset classes.
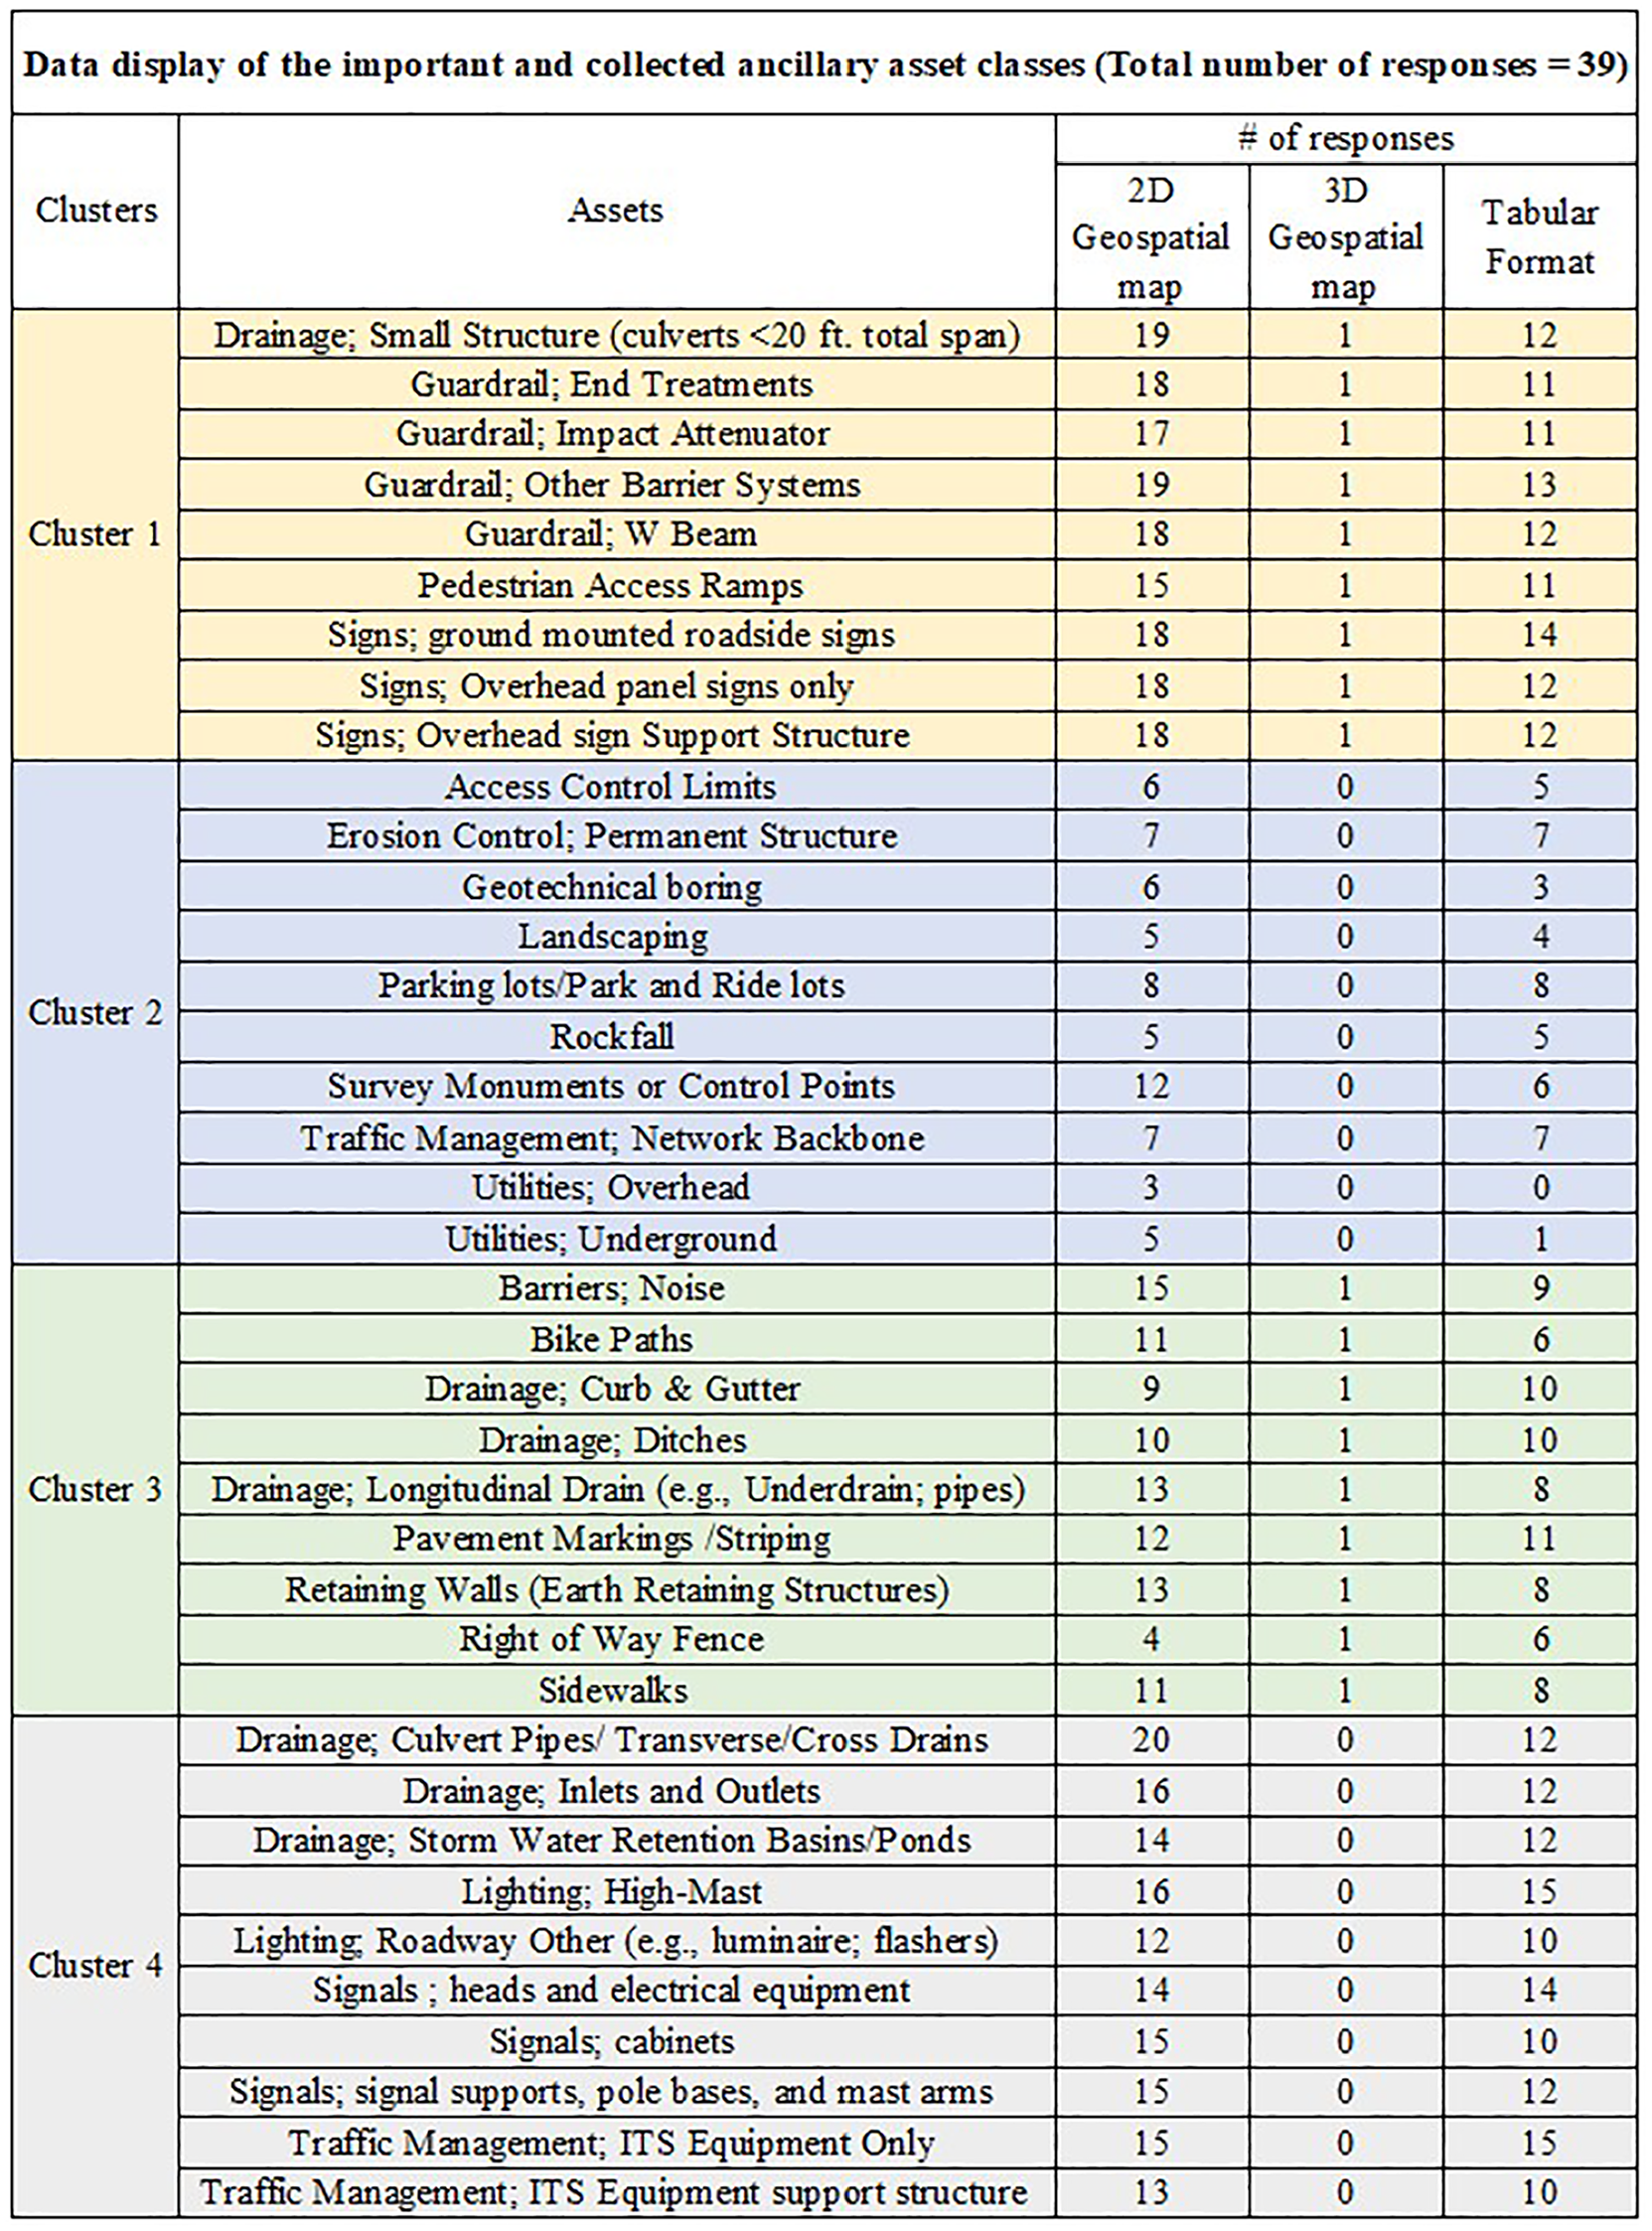
Summary of clusters for data display of the important and collected ancillary asset classes.
These findings truly intertwine when considering the assets across all three analyses. For instance, drainage structures and signage tend to be included in clusters with higher rates for comprehensive data collection methods and display methods, along with several advanced data formats, which might be because of their highly detailed design and attribute data necessitating their correlation with the field location, condition, and inventory data. It explains that state DOTs realize the critical nature of these assets and maintain sophisticated data management practices throughout their life cycle. On the other hand, landscaping and utilities are typically lower-priority assets that tend to come in clusters with lower collection rates and less complex data formats and display methods. These trends reflect that lower criticality appears correlated with lesser sophistication in data management, highlighting that state DOTs allocate more resources for data collection, format, and display for those assets they consider most critical to transportation system performance and safety. These differences in practices across all asset classes identify the need for flexible and adaptable management systems to accommodate a diversity of data types and user needs. In addition, the high usage of GIS geodatabases and 2D geospatial maps, which cut across most asset classes, shows the emerging recognition of spatial data values in asset management. This tends to open up the potential for more holistic, system-wide analysis and decision-making.
One of the most important results of the descriptive analysis of survey data is ranking the technologies used to collect ancillary asset data based on the frequency of the respondents which are: 1) handheld computers/tablets/cell phones, 2) GIS, 3) truck/vehicle-mounted equipment, 4) photo or video logs, 5) Global Positioning System/Global Navigation Satellite System, 6) LiDAR, 7) pen-and-paper records, 8) satellite images, 9) drones (unmanned aerial vehicle/unmanned aircraft system), 10) PDF fillable forms, 11) radio-frequency identification tags or barcodes, and 12) in-house developed technology. Furthermore, the statistical analysis of another question, represented in Figure 9, shows that 54% of respondents indicated that 75%–100% of their important ancillary assets have a data dictionary, highlighting that many state DOTs have a foundation for solid data management. In contrast, the numbers with written quality assurance/quality control policies drop dramatically, in which only 15% of respondents reported 75%–100% coverage. This discrepancy aligns with the observed differences between high-priority assets and others in the previous analysis, indicating that while basic data structures are in place for many assets, more advanced management practices are less widespread.
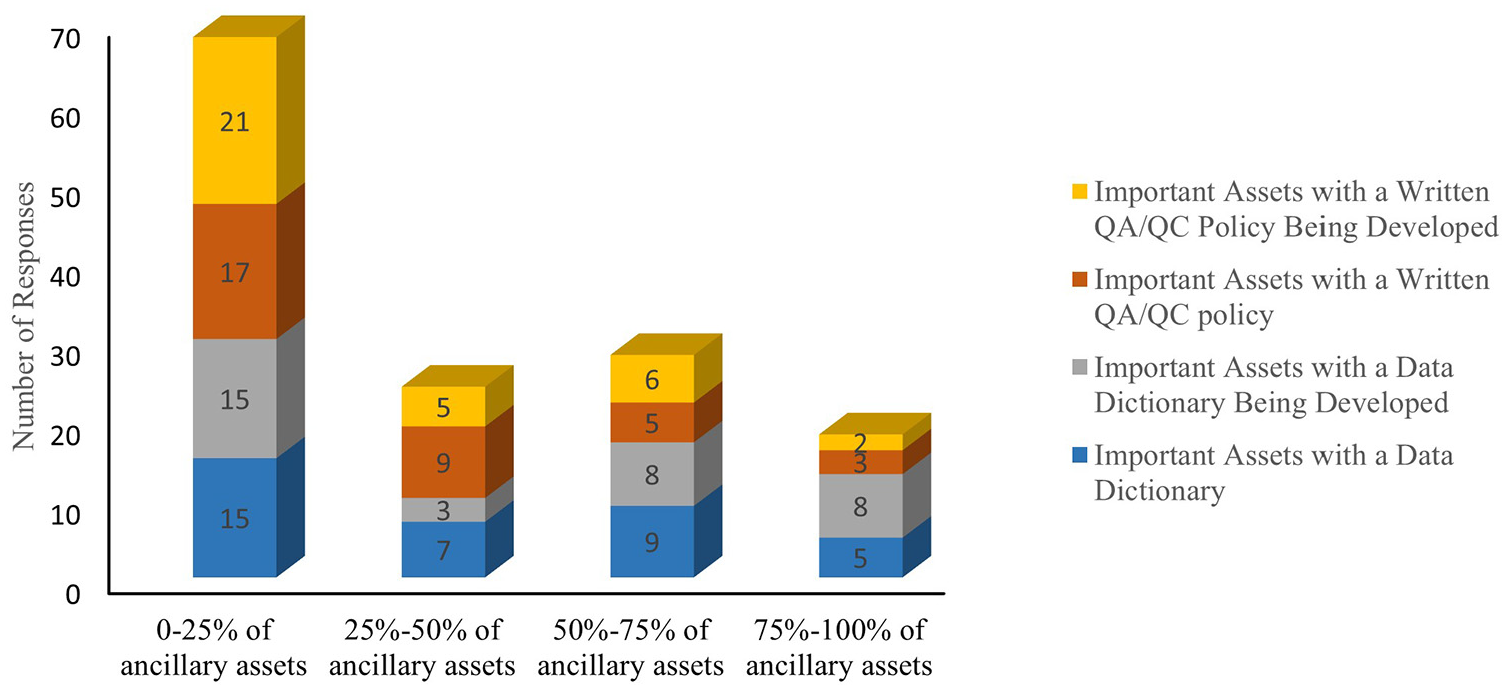
Quality measures describing the status of state departments of transportation ancillary assets (out of 39 responses).
Conclusion
The comprehensive analysis of ancillary asset management practices for state DOTs establishes a sophisticated landscape of prioritization, resource allocation, and data management strategies. The results from the cluster analyses on the importance of the assets, data collection status, and data management practices offer useful insights into how DOTs respond to issues relating to the management of infrastructural and varied elements within limited resources. Critical assets, such as drainage structures, road signage, guardrails, and traffic signals, rank highly in all areas of asset management, from data collection to inspection and condition rating. This reflects the general observation that DOTs are usually faced with making difficult decisions about where their limited resources should be placed among various critical assets. The results of cluster analysis of the data content, format, and display further highlight this prioritization and the sophisticated and comprehensive data management practices for critical assets. Moreover, widespread GIS geodatabase and geospatial visualization use among many asset classes indicates increased recognition of the value of spatial data in asset management. It is, however, interesting that some particular assets, such as utilities and landscaping, ranked relatively lower in both data collection and inspection practices, which highlights the continues challenges state DOTs face in balancing immediate safety issues with the long-term infrastructure monitoring and health. Reasons cited for not collecting important asset data, such as limited resources and lack of guidance, offer important context for these patterns. The comprehensive view underpins the requirement for more resources, better guidance, and more efficient data collection methods to ensure that all important ancillary asset classes can be effectively managed. Such insights can help develop more integrated and adaptive strategies for the practice of asset management within state DOTs in the future, leading to improved transportation infrastructure management and enhanced system performance and safety.
Despite these insights, several limitations of the study are worth mentioning. The analysis is based on survey responses from state DOTs and potentially is subject to variations in interpretation and handling practices across agencies. Furthermore, this study characterizes current practice and therefore does not reflect the dynamic nature of asset management strategies over time. Future studies could get around such limitations by adding longitudinal data to capture changes in asset management practice and including qualitative interviews with DOT officials to provide more insight into decision processes. This research also opens further opportunities for future work. Valuable insight could be gained into long-term implications of current prioritization strategies on system-wide infrastructure health and life cycle costs. This can also turn out to be useful when studying new technologies and methodologies that could offer ways to enable more holistic asset management with limited resources. In addition, studies investigating integration of ancillary asset management with broader transportation system performance measures can significantly improve the understanding of strategies for effective infrastructure management.
Footnotes
Author Contributions
The authors confirm contribution to the paper as follows: study conception and design: H. Nassereddine, A. Khoshkenar; data collection: H. Nassereddine, G. Dadi, R. Catchings; analysis and interpretation of results: A. Khoshkenar, H. Nassereddine, R. Catchings; draft manuscript preparation: A. Khoshkenar, H. Nassereddine, B., Ramadan, R. Catchings, G. Dadi. All authors reviewed the results and approved the final version of the manuscript.
Declaration of Conflicting Interests
The author(s) declared no potential conflicts of interest with respect to the research, authorship, and/or publication of this article.
Funding
The author(s) disclosed receipt of the following financial support for the research, authorship, and/or publication of this article: This research is part of the NCHRP Synthesis 20-05/Topic 54-06, (NCHRP Synthesis Report 628), which is part of the National Cooperative Highway Research Program (NCHRP). NCHRP is administered by the Transportation Research Board (TRB) and funded by participating member states of the American Association of State Highway and Transportation Officials (AASHTO). NCHRP also receives critical technical support from the Federal Highway Administration (FHWA), United States Department of Transportation.