
Abstract
Under right-hand traffic conditions, Pedestrians significantly affect vehicle right-turn capacity, as right-turn vehicle movements typically interact with opposing pedestrian flows. Despite substantial efforts over several decades to account for this effect in right-turn capacity models, current models may lack scalability when addressing multiple possible scenarios. In this study, a general model of the effect of pedestrians on right-turn capacity is developed by theoretically deriving the unblocked time for vehicles during the green phase. The proposed model considers variables such as pedestrian volumes and signal timings, as in several existing models, but also incorporates additional factors, including: 1) the length of the conflict zone, 2) the length and width of the crosswalk, 3) pedestrian types and their respective speeds, and 4) the types of right-turning vehicle. The model is validated under realistic conditions that take into account, for instance: 1) changes in right-turn policies, 2) unbalanced pedestrian volumes by direction, 3) mixed pedestrian traffic, and 4) mixed traffic conditions, along with signal timing and geometric variables as addressed in previous research, through comparisons with a microsimulation. Additionally, comprehensive evaluations are performed by comparing field measurements. Given its ability to account for a wider range of variables, the proposed model is more adaptable to diverse contexts than existing models. Furthermore, these characteristics make the model applicable in future autonomous vehicle environments.
Keywords
Under right-hand traffic conditions, right-turn movements are generally served during the same signal phase as through movements at signalized intersections. For the same signal phase, pedestrians and bicycles are allowed to cross the road to avoid conflicts with through movements. Although this signal plan facilitates the movements of through traffic during the green signal, right-turn movements are impeded by the crossing pedestrians and bicycles, ultimately reducing the right-turn capacity ( 1 , 2 ). Therefore, a right-turn capacity model that accounts for the influence of pedestrians and bicycles is necessary for accurately analyzing traffic flows and evaluating signalized intersections.
Many traffic engineers agree that pedestrians should be considered when modeling the turning movement capacity, and their efforts have been ongoing for several decades. As a result, most current models consider the reduction in right-turn capacity that can be caused by pedestrian crossings. The Highway Capacity Manual (HCM) describes an analytical procedure to adjust the saturation flow rate for right-turn movements during the green phase, considering the blockage caused by pedestrians ( 3 ). This procedure relies on a piecewise linear pedestrian volume-conflict zone occupancy model, derived from empirical cycle-by-cycle data collected at multiple intersections across several cities in the U.S. ( 4 ). Additionally, the effect of bicycles traveling in bicycle lanes was incorporated into the pedestrian adjustment factor for the right-turn saturation flow rate, as detailed in earlier work ( 5 ). Furthermore, several studies have attempted to model the relationship between the right-turn saturation flow rate and the pedestrian volume using empirical data, and a multiple linear regression model, considering traffic and geometric conditions, was also proposed ( 6 – 8 ). This type of model has been widely used because of its computational convenience. However, it may not be suitable for conditions that are not observed in the dataset.
To address the limitations of such linear models, several researchers have theoretically derived right-turn capacity models using the unblocked time by pedestrians, considering the probability of a right-turn vehicle blockage ( 9 – 13 ). These analytical models allow for the incorporation of various factors, such as right-turning vehicle behaviors, signal settings, traffic conditions, and pedestrian volumes. Despite these previous efforts to incorporate a wide range of influential factors into right-turn capacity models, a lack of scalability remains for multiple potential situations.
One situation involves changes in pedestrian crossing policies. The right-of-way for crosswalks can vary across regions or change depending on pedestrian policy: right turns are strictly prohibited when pedestrians occupy any portion of the crosswalk during the green phase (Case 1), and right turns are allowed only when right-turning vehicles do not obstruct pedestrian crossings (Case 2). Case 1 can reduce collisions between right-turning vehicles and pedestrians, but it increases delays for right turns because of a reduction in the usable green time and capacity. Case 2 can have opposing effects, potentially reducing delays for right turns but increasing the risks for pedestrians. However, most existing models assume the pre-revision right-turn instruction and therefore cannot account for the impact of such policy changes on right-turn capacity estimations.
Another factor affecting the right-turn capacity is the pedestrian volume by direction. Although most existing models assume equal pedestrian volumes in both directions, the dominant direction of the pedestrian flow can vary depending on the location of the crosswalk and the time of day. For example, if a crosswalk is located at the entrance of a subway station, the majority of pedestrians will likely to cross toward the station during the morning commute, while the opposite can be expected during the evening commute. In such cases, where pedestrian volumes vary significantly by direction, the assumptions of existing models may become invalid, reducing the accuracy of right-turn capacity estimations.
The interaction between pedestrians and right-turn movements can also vary depending on the type of pedestrians and their different walking speeds. Pedestrians may cross the street at different speeds, affecting the blockage time for right-turning vehicles. Pedestrians who can walk faster can clear the conflict area more quickly, diminishing the blocked time and, thus, increasing the right-turn capacity. Vehicle types also play a role. As heavy and long vehicles need more space for a safe right turn, they need more time without pedestrian obstruction than passenger cars.
In view of these factors, this study develops a general right-turn capacity model and evaluates its effects on the right-turn capacity. The model is designed to account for 1) policy changes, 2) unbalanced pedestrian volumes by direction, 3) mixed pedestrian conditions, and 4) mixed traffic conditions, as well as signal timing and geometric variables as addressed in previous research. The model is based on a theoretically driven unblocked green time, and the aforementioned scenarios are validated through a microsimulation with VISSIM and with field observations.
Empirical Evaluation of the Right-Turn Capacity
Study Site and Data Collection
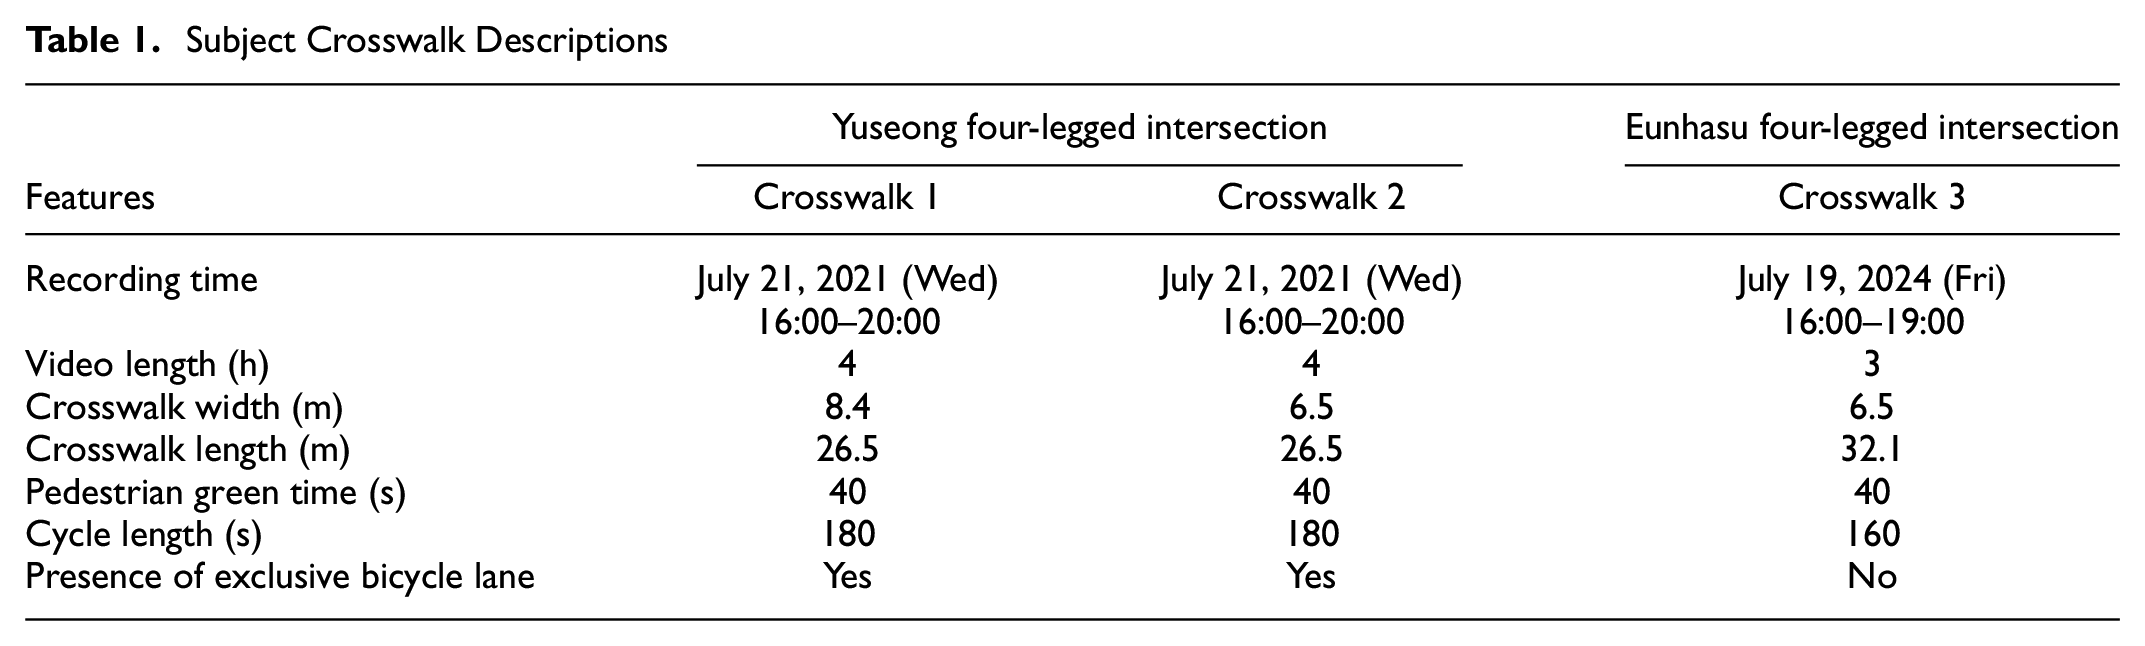
To investigate real-world pedestrian behavior at crosswalks and pedestrian crossing patterns, three crosswalks were selected at two intersections in Daejeon, South Korea. The first two crosswalks are located at the Yuseong four-legged intersection, specifically the east and west crosswalks, denoted as Crosswalk 1 and Crosswalk 2 in Figure 1a. The third crosswalk is situated at the north crosswalk of the Eunhasu four-legged intersection, denoted as Crosswalk 3 in Figure 1b. For analysis, video recordings captured during the PM peak period were utilized, with 4 h video footage analyzed for Crosswalks 1 and 2 and 3 h footage for Crosswalk 3. While Crosswalks 1 and 2 had relatively fewer pedestrians, Crosswalk 3 experienced significantly higher pedestrian volumes, likely because of the presence of a department store located west of the crosswalk. Additional signal timing and geometric data for each crosswalk are described in Table 1.
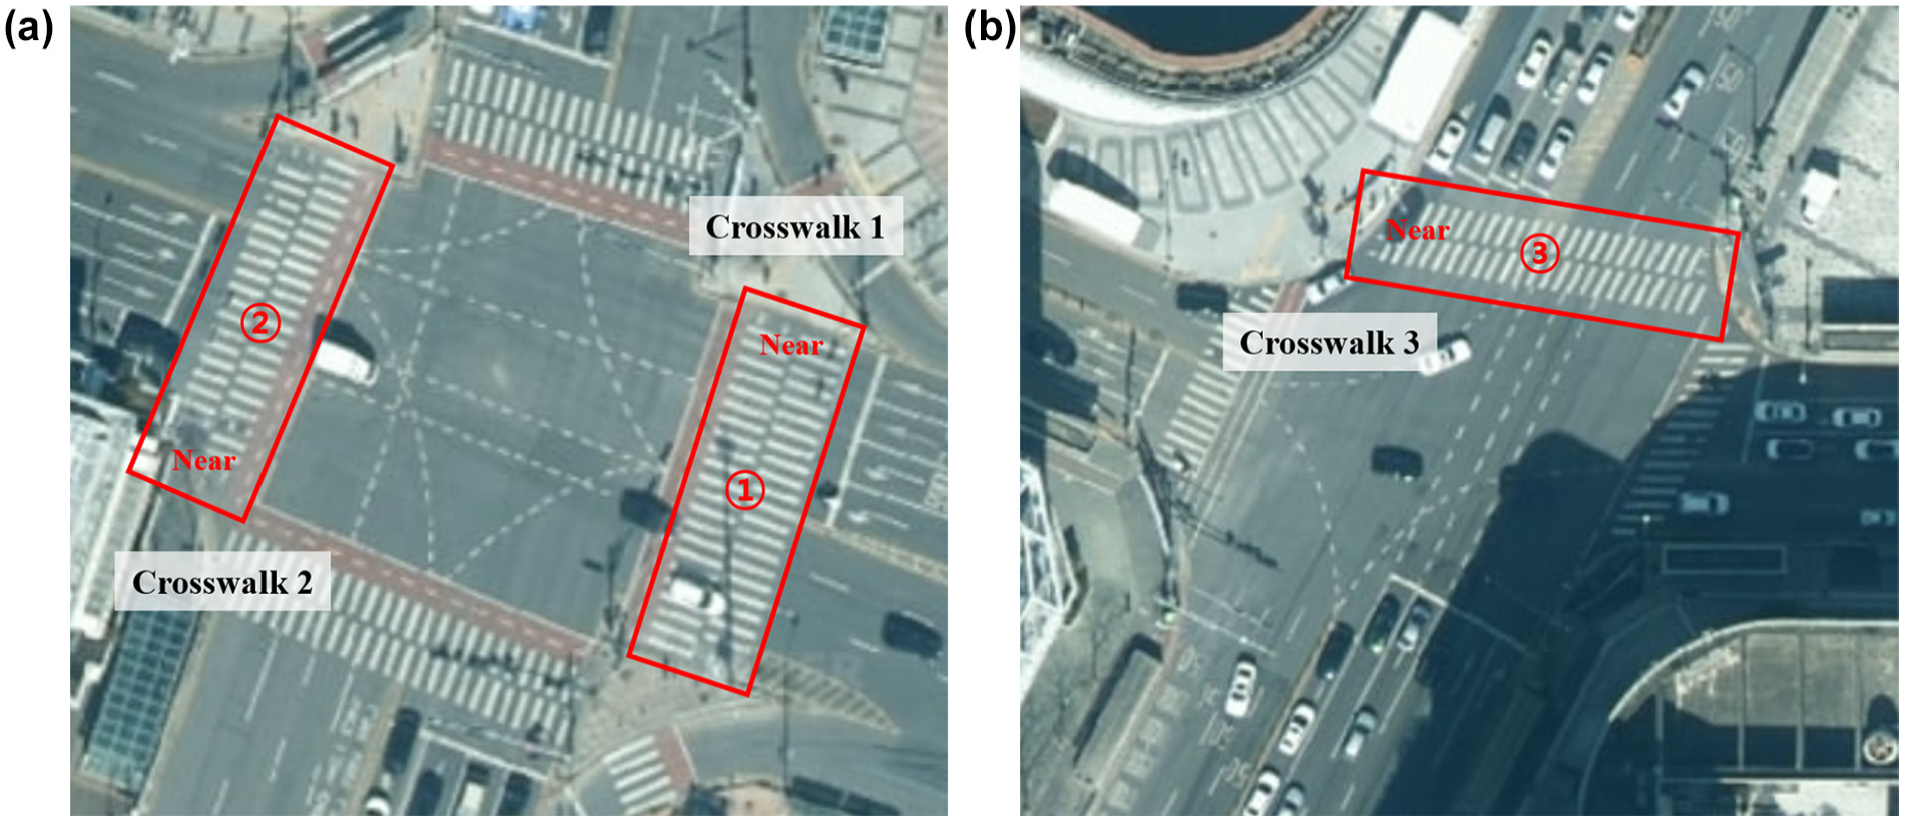
Study site and subject crosswalks: (a) Yuseong and (b) Eunhasu four-legged intersections.
Subject Crosswalk Descriptions
Pedestrian occupancy was measured instead of vehicle capacity, as measuring vehicle capacity in the field requires saturated conditions, and the pedestrian occupancy, which is a variable closely related to capacity, is a measure directly comparable with the HCM model ( 11 ). From this point forward, all references to “occupancy” in this study refer to pedestrian occupancy. Occupancy refers to the proportion of time during the green phase in which the conflict zone is occupied by pedestrians. However, drivers are unlikely to maneuver through a pedestrian platoon, even if the conflict zone becomes momentarily unoccupied, as such time gaps are generally very short and there is significant uncertainty about the behavior of approaching pedestrians. Thus, occupancy was measured only during periods outside the time when the pedestrian platoon was passing through the conflict zone.
Figure 2 shows screenshots of the videos, where the conflict zone is marked in red. As shown, the videos did not capture the entire crosswalk, and the pedestrians in the conflict zone did not impede right-turning vehicles. However, if pedestrians have the right-of-way, their occupancy would depend solely on pedestrian arrival patterns and behaviors. In other words, if the same arrival patterns and behaviors were observed in any conflict zone between right-turning vehicles and pedestrians, the pedestrians would block right-turning vehicles for as long as the measured occupancy. It was also confirmed that in the channelized right-turn lane at Crosswalk 1, as illustrated in Figure 2a, vehicles yielded to pedestrians, ensuring their right-of-way. Therefore, pedestrian occupancy was measured independently of right turns, and the conflict zone was defined as one lane width for Crosswalk 1, while the turning radius of right-turning vehicles was considered for Crosswalk 2 and 3.
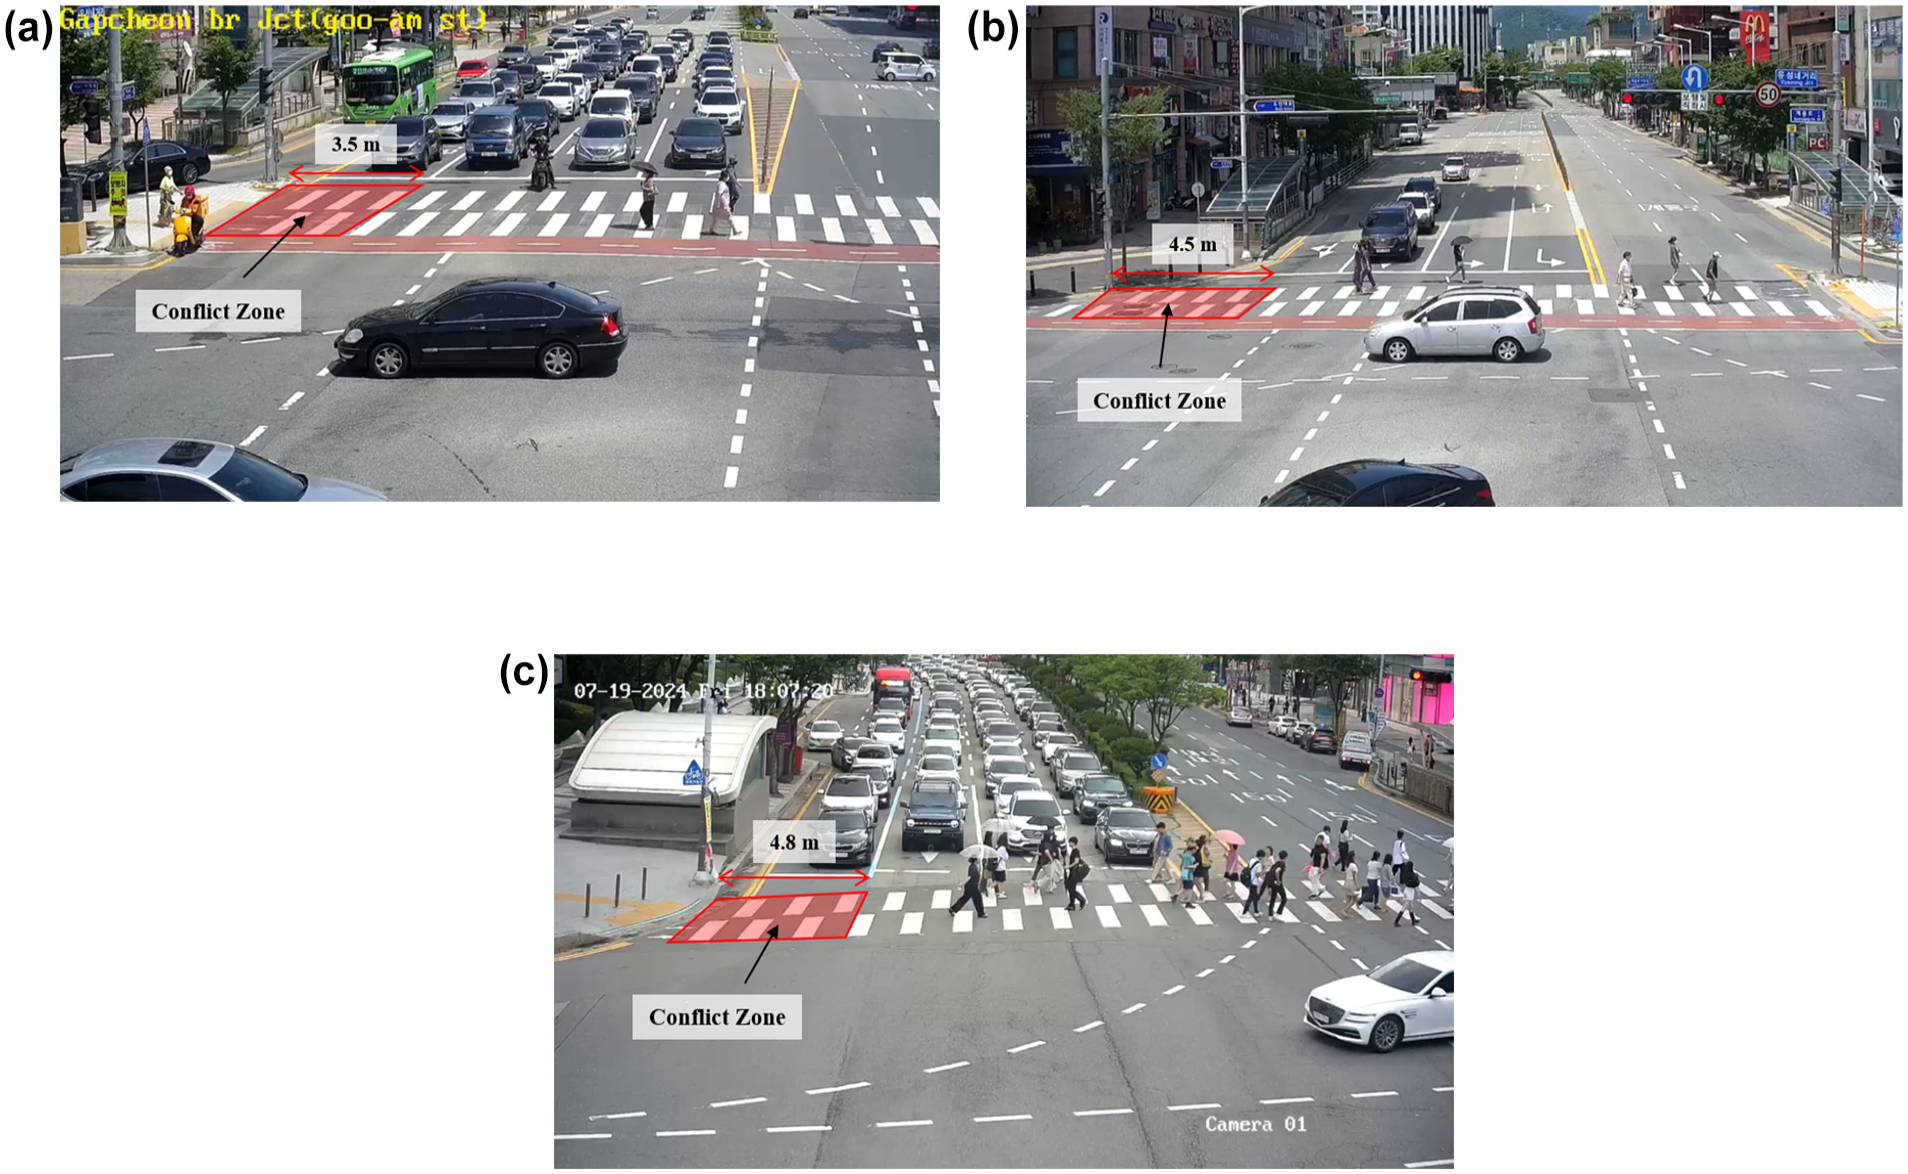
Screenshots of videos: (a) Crosswalk 1, (b) Crosswalk 2, and (c) Crosswalk 3.
The videos were processed using a combination of image processing algorithms to detect and track pedestrians on the subject crosswalk. Specifically, You Only Look Once (YOLO) version 8, which has been implemented for detecting pedestrians in several studies, and DeepSORT were used to extract pedestrian trajectories at a 1/14 s resolution on the crosswalk (see Figure 3a) ( 14 , 15 ). Additionally, pedestrians were classified into pedestrians and bicycles. Based on these trajectories, the entry and exit times of each pedestrian in the conflict zone were measured, allowing for the construction of a pedestrian conflict zone profile, as shown in Figure 3b. However, several pedestrian trajectories were interrupted because of occlusion by vehicles or other pedestrians moving alongside the subject. To correct these incomplete trajectories, pedestrian crossings for each cycle were also manually counted. During this process, elderly pedestrians were further sub-classified from the general pedestrian group. The manually counted data were then used to check 1) if the numbers of pedestrians entering and exiting the conflict zone within a cycle were equal, and 2) if the automatically counted number of pedestrians matched the manually counted number. If either condition was not met, the cycle was revisited and adjusted manually.
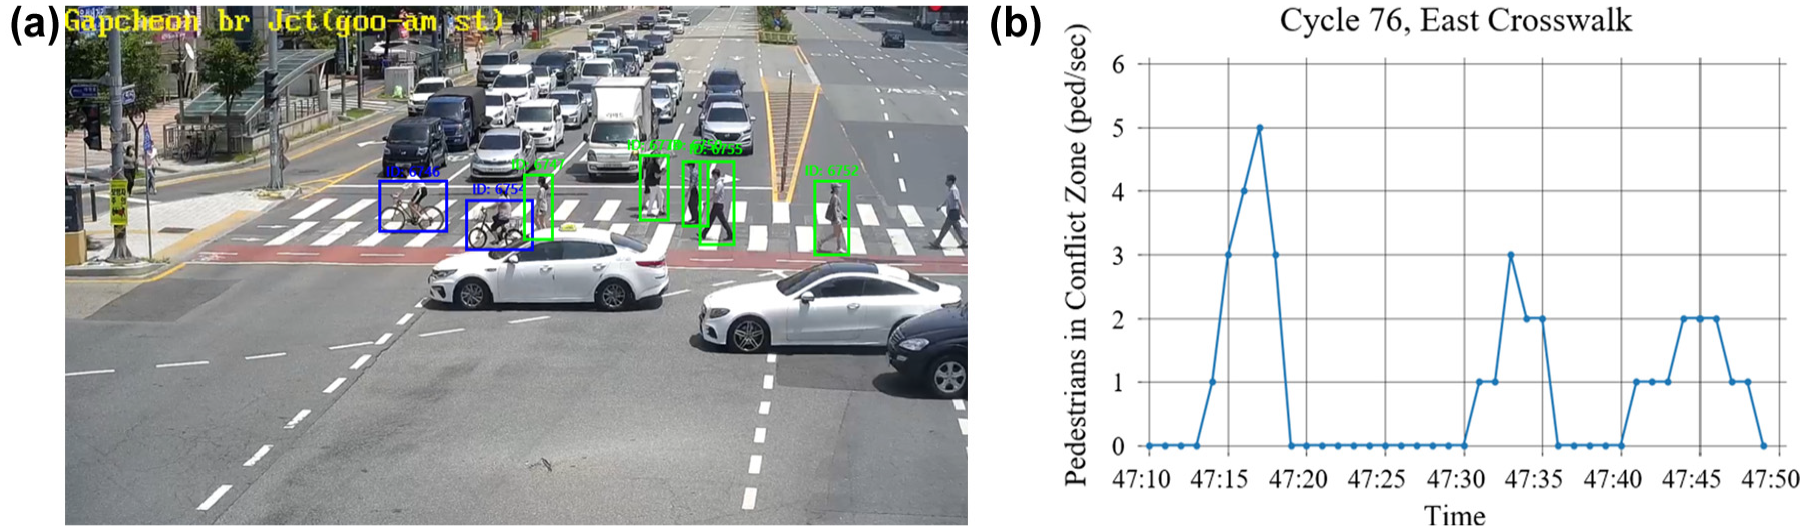
Output from processed videos: (a) sample of processed video and (b) pedestrian in the conflict zone profile.
In addition to the cycle-by-cycle number of pedestrians and their composition, the speed of each pedestrian class, the cycle-by-cycle number of pedestrians in a platoon, and the corresponding blocked time by the platoon were measured for future model calibration. For model validation, pedestrian occupancy was also collected.
Data Analysis
Over the 4 h period, 377 and 669 pedestrians were observed at Crosswalks 1 and 2, respectively, at Yuseong four-legged intersection, while 2,283 pedestrians crossed at Crosswalk 3 during the 3 h observation period. Bicycles and elderly pedestrians accounted for 7.27% and 7.93%, respectively, of the total number of pedestrians at the three crosswalks. While pedestrians had an average walking speed of 1.35 m/s, elderly pedestrians and bicycles displayed different average speeds of 0.88 m/s and 2.33 m/s, respectively. Despite the presence of a bicycle lane at Crosswalks 1 and 2, none of the bicycles used it, instead crossing the crosswalk while riding. Therefore, bicycles behaved similarly to fast pedestrians on the crosswalk, causing a shorter blockage time in the conflict zone than regular pedestrians. In contrast, elderly pedestrians were observed to walk notably slower than younger pedestrians. As a result, even when elderly pedestrians started crossing as part of a pedestrian platoon, they contributed to increasing the platoon length as they continued to cross.
The pedestrian profile in the conflict zone, constructed for each cycle, exhibits a common pattern. Although the number of peaks in the profile varied by cycle, two distinct peaks were observed in most cycles during the early and middle portions of the green phase, corresponding to the first and second peaks in Figure 3b. Further video analysis revealed that these peaks were caused by pedestrian platoons from the near side and far side, with the intervals between the peaks and the period after the second peak until the end of the green phase being occupied by individual pedestrians arriving after the green phase had begun, as shown by the third peak in Figure 3b.
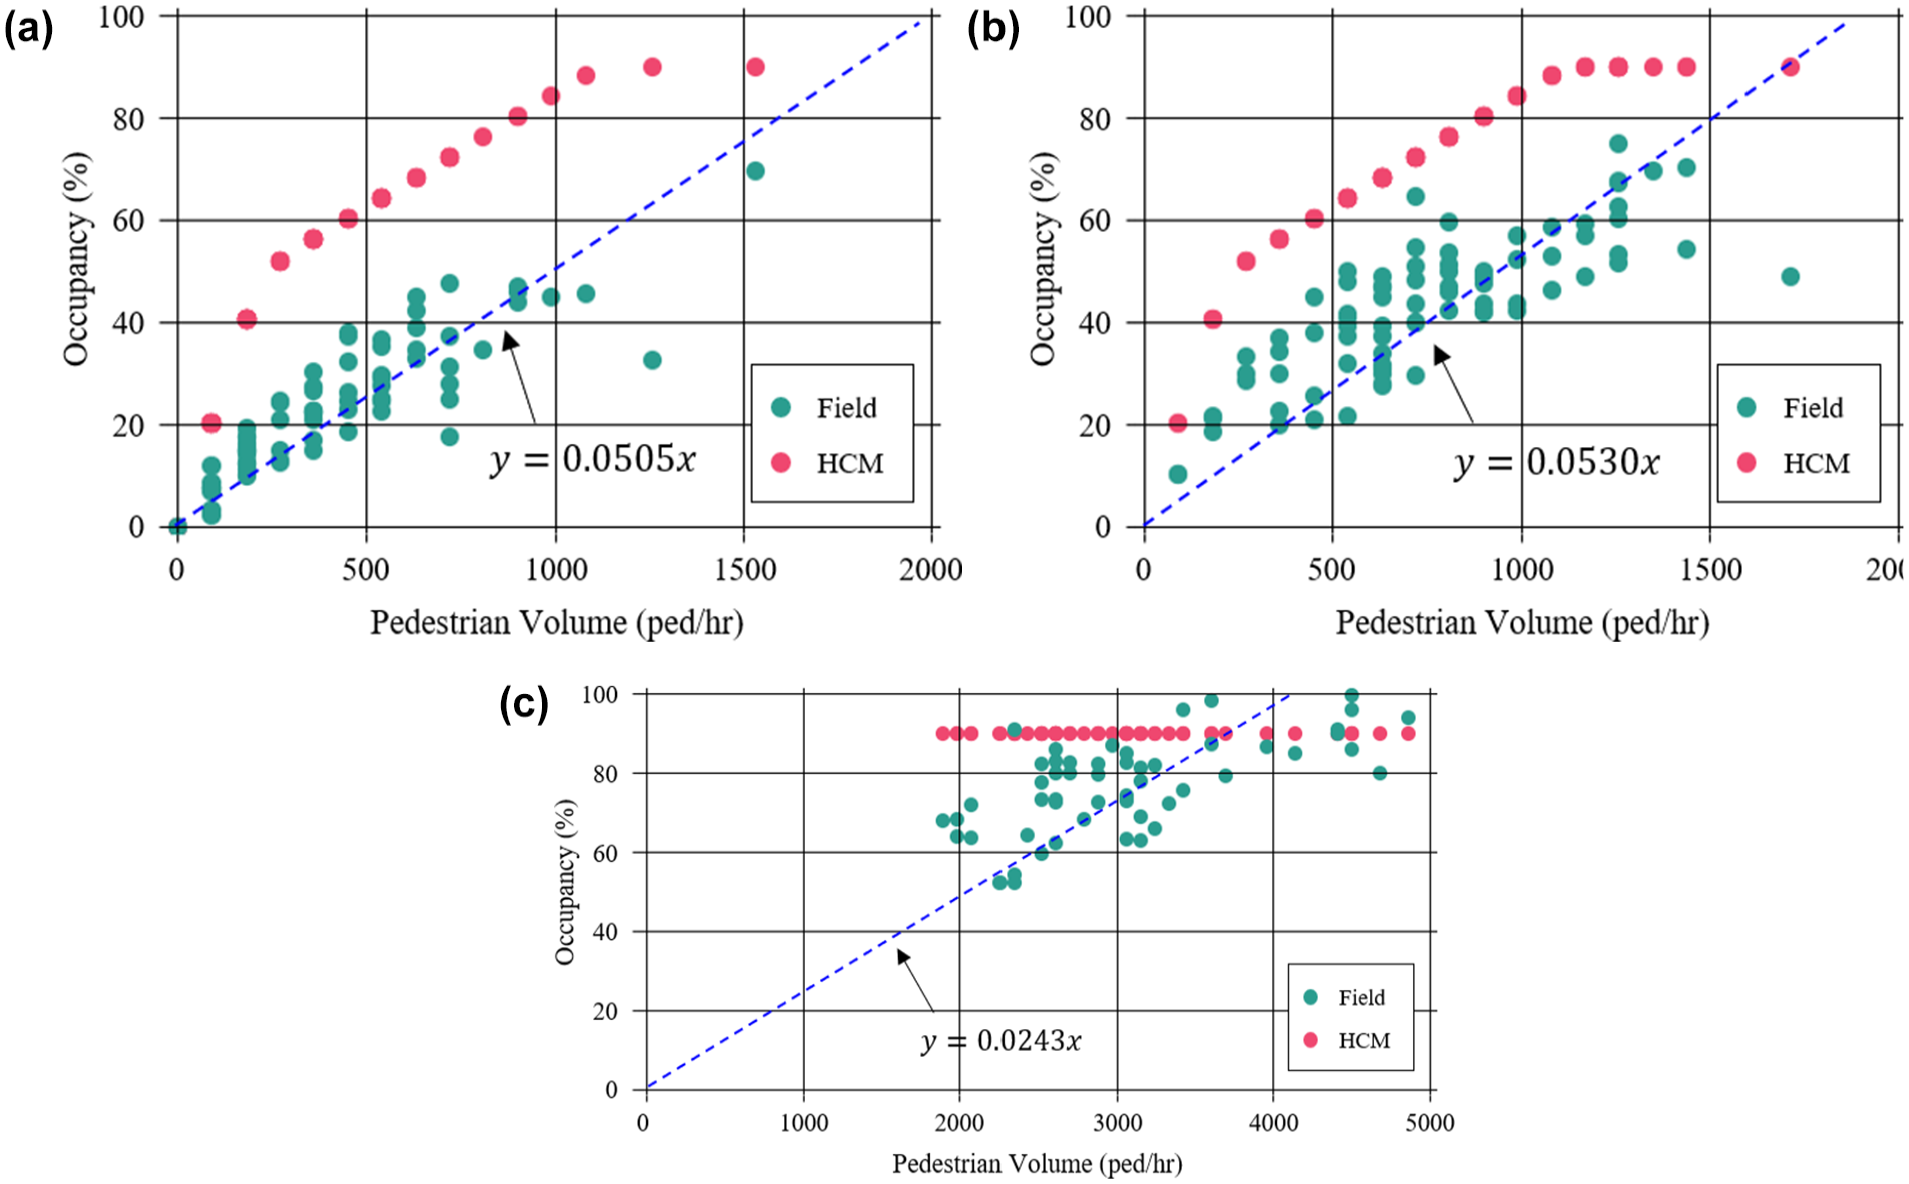
Figure 4 presents the cycle-by-cycle occupancy findings for varying pedestrian volumes, along with estimates from the HCM model. Field observations showed a trend where pedestrian occupancy increased as the number of pedestrians increased. However, 1) the random arrival of pedestrians, 2) differences in the pedestrian flow by direction, and 3) the composition of pedestrians caused some variance in the cycle-by-cycle occupancy. Figure 5, which presents the distribution of occupancy collected at Crosswalk 1 for cycles consisting solely of “normal” pedestrians and those including a mixed class of pedestrians, supports the argument that pedestrian composition contributes to variability in occupancy. Additionally, when comparing the occupancy trends between crosswalks, the impact of pedestrian volume on occupancy was found to be greater as the conflict zone widened. When comparing the HCM model with field observations, the HCM model consistently overestimated occupancy across all crosswalks. In particular, the HCM model produced a constant occupancy estimate for Crosswalk 3 because of its upper bound limitation. This suggests that the HCM model may exhibit significant deviations when its assumptions about the conflict zone differ from real-world conditions, and that other factors may also influence occupancy and capacity.
Cycle-by-cycle blocked times measured at: (a) Crosswalk 1, (b) Crosswalk 2, and (c) Crosswalk 3.
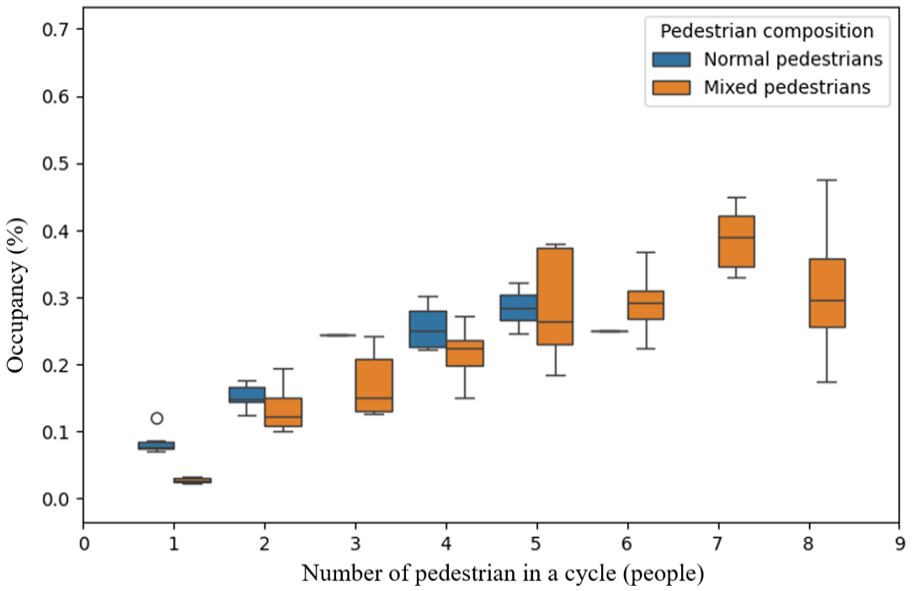
Distribution of cycle-by-cycle occupancy at Crosswalk 1 for different pedestrian compositions.
Model Development
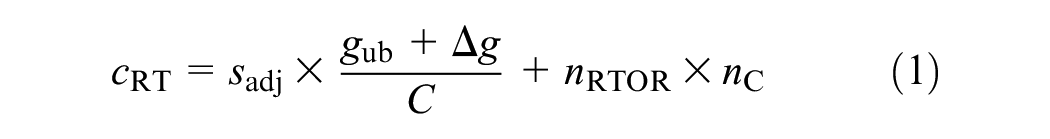
For the scalability and generalization of the model, this study theoretically derives the unblocked green time for right-turn movements. The model assumes random pedestrian arrival and right-of-way. As such, the time during which pedestrians do not occupy the conflict zone is defined as the “unblocked” time. The right-turn capacity formula, shown in Equation 1, consists of two terms. The first term represents the capacity during the right-turn green phase, and the second term represents the capacity during the red phase. In the first term,
This study focuses on the first term, which is affected by pedestrians, and does not address the increase in capacity because of right-turn-on-red (RTOR) behaviors. Therefore, the study assumes conditions in which RTOR is not permitted. This assumption ensures that the right-turn capacity relies solely on the unblocked green time.
Where

C = cycle length (s),
* If the right-turn movement shares a lane group with other movements, a weighted average saturation flow rate for each movement demand is recommended. Other adjustment factors should be applied, if necessary.
Simulation Calibration
Traffic microsimulation is a useful tool for replicating real-world pedestrian and vehicle behaviors and their interactions. Additionally, it allows for the control of variables that cannot be fully regulated in the field and can simulate changes in vehicle behavior resulting from the implementation of new policies, making it a valuable tool for evaluating a new model. Because of these advantages, microsimulation has been widely used in previous studies investigating the effect of pedestrians on right-turn capacity ( 11 – 13 , 16 ). Among various microsimulation tools, VISSIM has been extensively adopted in these studies because of its versatility in realistically simulating crowd dynamics across different environments, including crosswalks. However, calibration is essential to ensure the reliability of microsimulation results. Therefore, in this study, the social force model in VISSIM was calibrated to realistically simulate pedestrian behavior.
The objective variable for calibration was set as blocked time by the pedestrian platoon, as this metric reflects not only pedestrian speed but also interactions among surrounding pedestrians. Additionally, this variable represents the outcome of the platoon blockage time model, which will be introduced later in this study. Since the data used to develop this model rely on simulation, blocked time by the pedestrian platoon was selected as the calibration target variable.
Crosswalk 3 was selected for calibration because of its relatively high pedestrian volume and the formation of a pedestrian platoon in every cycle. Data from the other crosswalks were not used in the calibration process, as they were reserved for validating the pedestrian blockage time model, which will be introduced later.
Calibration was performed by adjusting the social force model parameters in VISSIM. The objective was to minimize the root mean squared percentage error (RMSPE) between observed and simulated pedestrian platoon blockage times at Crosswalk 3. A genetic algorithm was employed to optimize the parameters. In addition, the desired pedestrian speed distribution in VISSIM was also calibrated based on the observed speed of pedestrians who were unaffected by interactions with others, collected at Crosswalk 3. As a result, the calibrated VISSIM model produced platoon blockage times that were statistically consistent with field measurements at the distribution level, as shown in Figure 6.
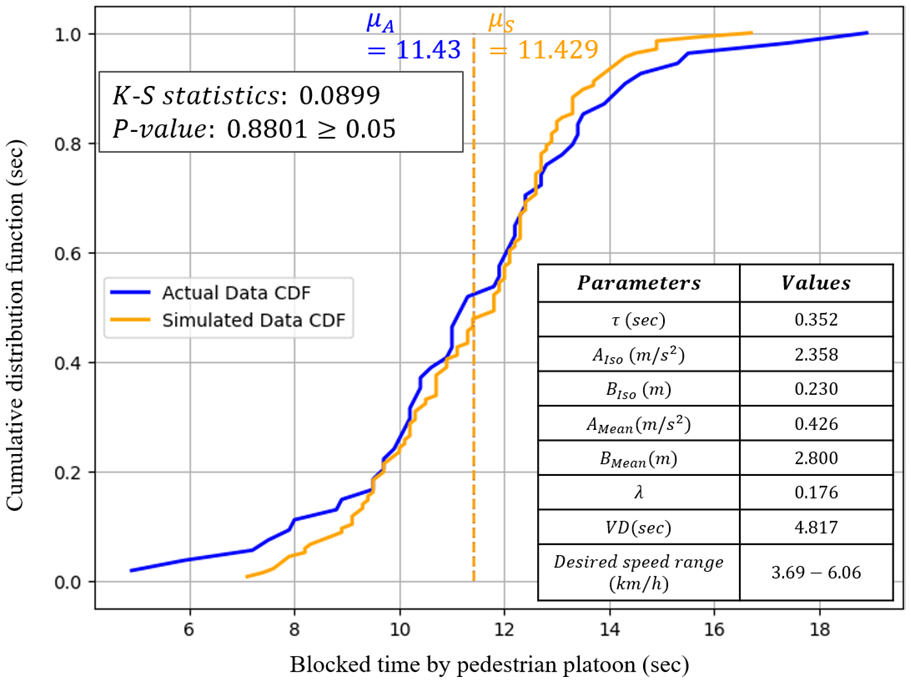
Cumulative distribution functions of observed and simulated pedestrian platoon blockage times.
Pedestrian Platoon Blockage Time
Field investigations revealed that the pedestrian platoon blockage time varies because of differences in walking speeds. For instance, when a platoon includes both young and elderly pedestrians, they enter the conflict zone together, but the elderly exit later. In such cases, the blockage time is measured from the moment the platoon enters the conflict zone until the elderly pedestrians leave. Equation 2 calculates the average blockage time based on the composition of mixed pedestrian types within the platoon.
Where
r = pedestrian red time
Equation 2 assumes two pedestrian types with different walking speeds. If even one slower pedestrian is present in the platoon, the blocked time is determined according to the time it takes for the slower pedestrian to exit the conflict zone, as the blockage ends only when the slower pedestrian clears the zone. In such cases, the blocked time corresponds to that of the slower pedestrian type, which is reflected in the model’s derivation. The indicator function in the equation is added to ensure convergence to a blocked time value for a pedestrian type when the proportion of that pedestrian type is 100%.
In addition to pedestrian types within the platoon, the average number of pedestrians in the platoon and the width of the crosswalk also affect the blockage time because, even among the same type of pedestrian, individual pedestrians cross at different speeds. Furthermore, when the crosswalk width is narrow, the limited space between pedestrians increases the likelihood of their speeds affecting one another while crossing the conflict zone, which in turn affects the dispersion of the pedestrian platoon.
Figure 7 illustrates the cycle-by-cycle blocked time by pedestrian platoons as collected from the calibrated VISSIM model in the previous section. The simulation runs multiple scenarios with varying pedestrian green times and crosswalk widths. In all scenarios, the pedestrian volume on the near side was fixed at 500 pedestrians per hour (ped/h). Additionally, the conflict zone was defined as the area where the rightmost lane overlaps with the crosswalk, set to a length of 4.0 m. Each scenario included a 15 min warm-up period and a 6 h simulation evaluation period, providing 270 observations per scenario (with a cycle length of 80 s). The cycle-by-cycle blocked time was measured by subtracting the time when the conflict zone was first occupied from the time the last pedestrian in the platoon exited the conflict zone.
Blocked time by pedestrian platoons measured in VISSIM: crosswalk width = (a) 3.5 m, (b) 7.0 m, (c) 10.5 m, and (d) 14.0 m.
Figure 7, a to d, shows the changes as the width of the crosswalk increases from 3.5 m by increments of 3.5 m in each scenario. Each figure presents the distribution of blocked times in pastel colors, based on changes in the green time, with the average blocked time for each scenario represented by solid colors. According to the figures, as the green time decreases, the blocked time increases regardless of the crosswalk width. This occurs because shorter green times and longer red times result in more pedestrians arriving during the red phase, leading to an increase in the pedestrian platoon size. Consequently, when the four average points in each figure were fitted to the model shown in Equation 3, the parameter alpha was estimated using maximum likelihood estimation, as indicated in the figure. The R-square values of the regression lines ranged from 0.939 to 0.988.
As shown in Figure 7, alpha estimates the decrease as the crosswalk width increases. However, as illustrated in Figure 8, the effect of this decrease diminishes as the crosswalk width increases further. Therefore, a linear logarithmic function, as shown in Equation 4, was developed for alpha in Equation 3. The R-square value for this function was 0.993.
Relationship between the pedestrian platoon dispersion parameter and the crosswalk width.
The proposed model assumes that all pedestrians within a platoon cross during the pedestrian green phase. Consequently, if the platoon fails to clear the crossing during the green time, the model’s applicability is limited, and the maximum value of

Where
To validate the pedestrian platoon model, its outputs were compared with platoon blockage times measured at Crosswalks 1 and 2, as shown in Figure 1a. Figure 9 presents both the field-measured platoon blockage times at Crosswalks 1 and 2 and the model-estimated blockage times. Although the coefficient of the trend line was 0.896, indicating that the model slightly overestimated blockage times, the variation in platoon blockage time can be influenced by several factors, including the formation of waiting groups, the width of the waiting area, and other geometric and behavioral characteristics. Given these complexities, the results suggest that this simple platoon-based model produces reliable estimates even without incorporating multiple additional variables.
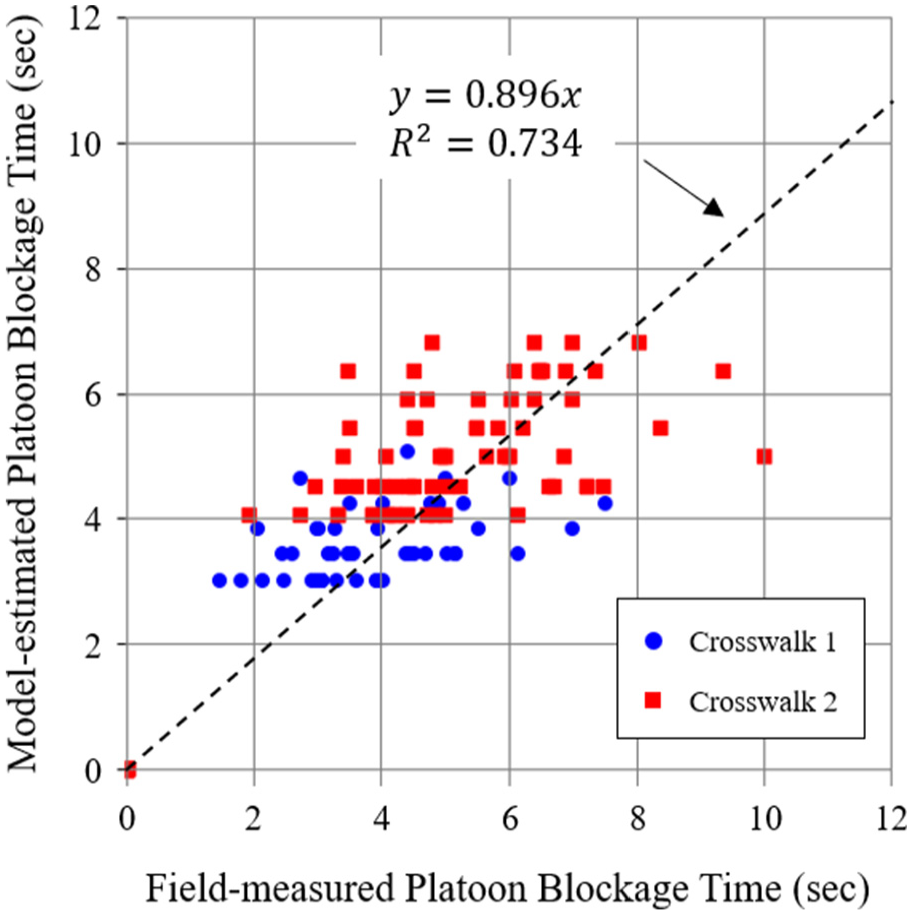
Comparison between field-measured and model-estimated platoon blockage times.
Blocking Process in the Conflict Zone
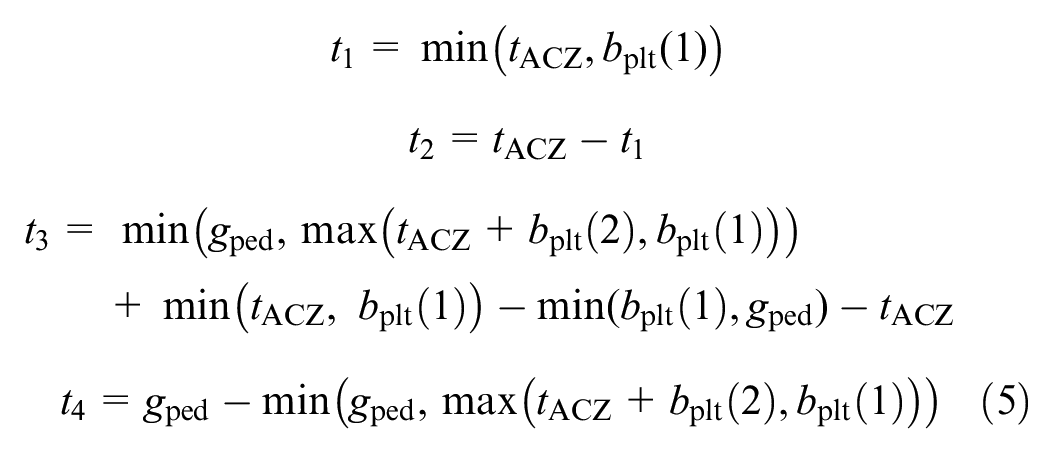
Based on the field investigation, the pedestrian green can be divided into four intervals according to the blocking process, as shown in Figure 10. This figure illustrates a general condition in which the conflict zone has a length of
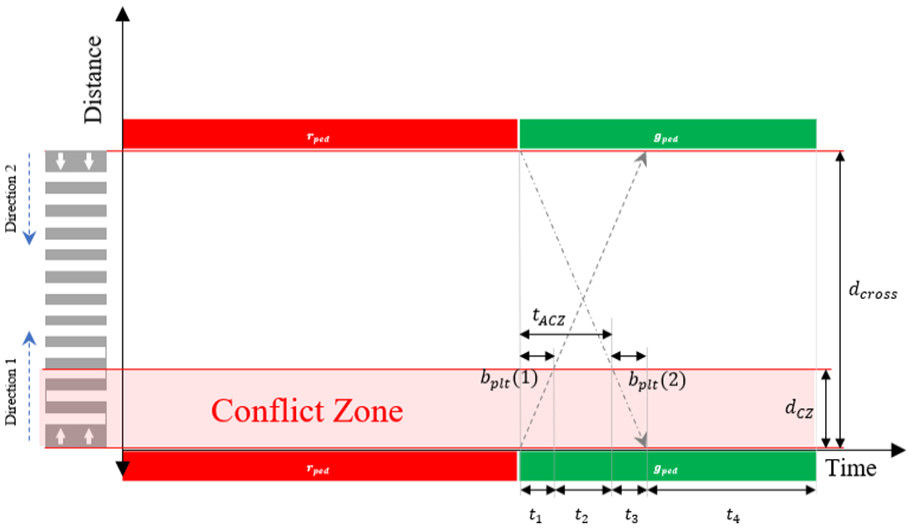
Blocking process in the conflict zone and pedestrian green intervals.Note:bplt(1) and (2) = Average blocked time by near and farside pedestrian platoons, respectively; dCZ and dCZ = Length of conflict zone and crosswalk, respectively; tACZ = Time for the farside pedestrian platoon to arrive at the conflict zone.
Generally, since the pedestrian green phase and the right-turn green phase begin almost simultaneously, at the start of the pedestrian green, nearside pedestrians begin to block right-turn vehicles until the platoon exits the conflict zone, during
If a nearside pedestrian platoon is present, the occupancy of the conflict zone between the time the nearside platoon exits and the farside platoon arrives depends on the arrival of nearside pedestrians after the green signal begins. Therefore, during this interval, defined as
The third interval (
Finally, during the fourth interval (
Where
(refer to Equations 2–4),
(refer to Equations 2–4),
Model Derivation
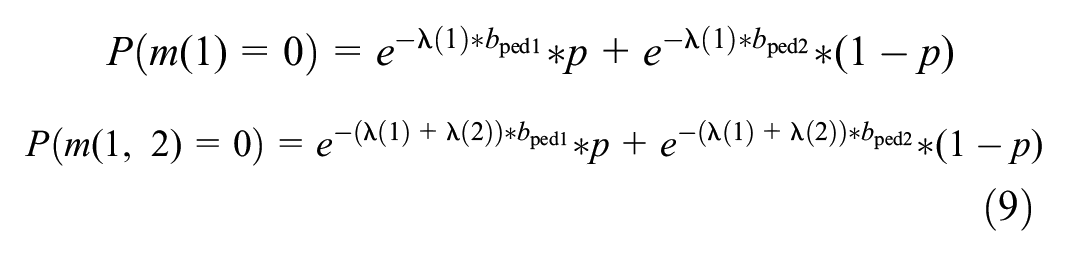
In the previous section, the first and third intervals were defined as the times during which the conflict zone is potentially occupied by nearside and farside pedestrian platoons, respectively. Thus, the presence or absence of these platoons determines the availability of these intervals. For each side, the presence of a pedestrian platoon at the end of the red phase can be estimated using a Poisson distribution, with

The second and fourth intervals are the times during which the conflict zone is potentially blocked by individual pedestrians arriving after the start of the green phase from the near side and both sides, respectively. Therefore, during these two intervals, the time usable by right-turn vehicles to make a turn is the portion of time that the conflict zone remains unoccupied by pedestrians. To estimate this unoccupied time, this study adopts the M/M/∞ queuing model, as shown in Equation 7. This model assumes random arrivals and service times with averages of


Where
However, while the second interval is potentially occupied by individual pedestrians from only the near side, the fourth interval is occupied by pedestrians from both sides. Thus,
Where
The blocking process in a cycle varies depending on the presence of pedestrian platoons at the end of the red phase. For example, if pedestrian platoons are formed on both sides, the first and third intervals would not be available for right-turn vehicles regardless of individual pedestrians arriving after the green phase begins. On the other hand, if no pedestrian platoons are formed on either side, the first and third intervals must be checked for occupancy by individual pedestrians arriving after the start of the green phase. In addition to these two situations, if a platoon is formed on one side but not the other, four distinct cases arise, each with a different blocking process. Thus, the average unblocked time during the pedestrian green time is calculated by aggregating the unblocked times estimated for the four cases. This is done using Equation 10.
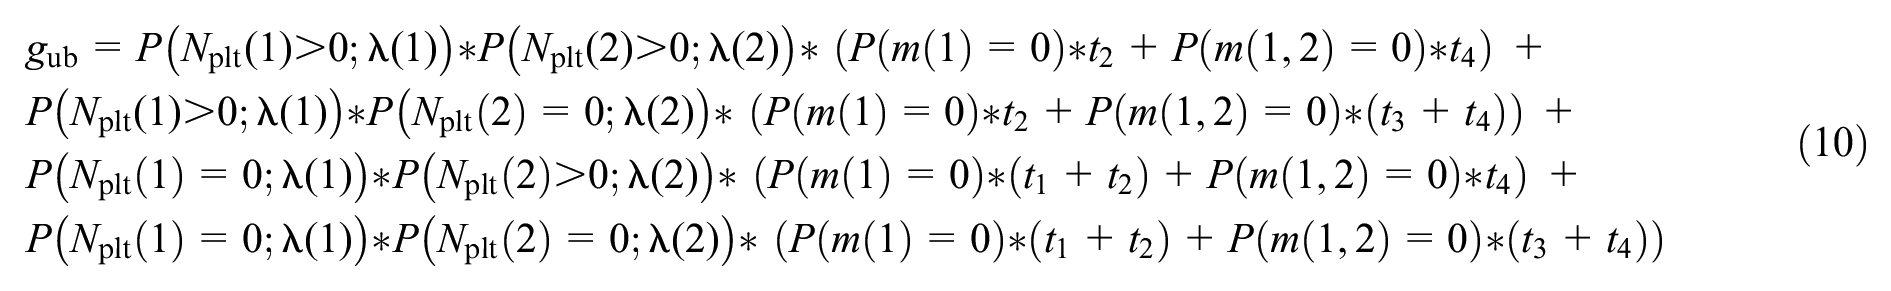
Where
(refer to Equation 8),
(refer to Equation 8),
(refer to Equation 8), and
(refer to Equation 8).
Note that
Model Validation
The proposed model is validated by comparing its results with those from the calibrated VISSIM model. In addition, the HCM model was evaluated against the proposed model to assess the extent of improvement offered by the new model. In this study, pedestrian occupancy, as expressed in Equation 11, was selected as the measurement for validation because of its consistency with the HCM model. To ensure consistency with the assumptions of the proposed model, the unblocked time during pedestrian platoon crossing was not measured in VISSIM.
Scenarios were constructed to evaluate the proposed model under the following conditions: 1) varying pedestrian green times and crosswalk lengths, 2) different right-turn policies, 3) unbalanced pedestrian volumes by direction, 4) mixed pedestrian traffic, and 5) mixed traffic conditions. For each scenario, a single run was conducted with a 15 min warm-up period and a 4 h evaluation period. Cycle-by-cycle pedestrian occupancy within a predefined conflict zone was calculated by measuring unblocked green times during the 4 h period, and the average occupancy rate was compared with the corresponding result from the proposed model.

Pedestrian Green Time and Crosswalk Length
Although the influence of the pedestrian green time on pedestrian occupancy is considered in existing models as well as in the HCM, this factor is also evaluated in the proposed model to confirm the model’s reliability ( 9 – 11 ). In this validation, the green time was varied from 20 to 50 s in 5 s increments, while the cycle length was fixed at 80 s. Additionally, the effect of the pedestrian volume was evaluated in the range of 0 to 2,000 ped/h. Apart from these two variables, all other variables were held constant. The conflict zone was set from the start of the crosswalk with a length of 3.5 m, and the crosswalk’s total length and width were set to 14.0 and 7.0 m, respectively. The pedestrian volume was considered to be equal in both directions, and all pedestrians were assumed to be of the normal type, walking at an average speed of 1.35 m/s based on field observations. Figure 11 shows the relationship between the occupancy rate and pedestrian volume, as estimated by three different models, while varying the pedestrian green time.
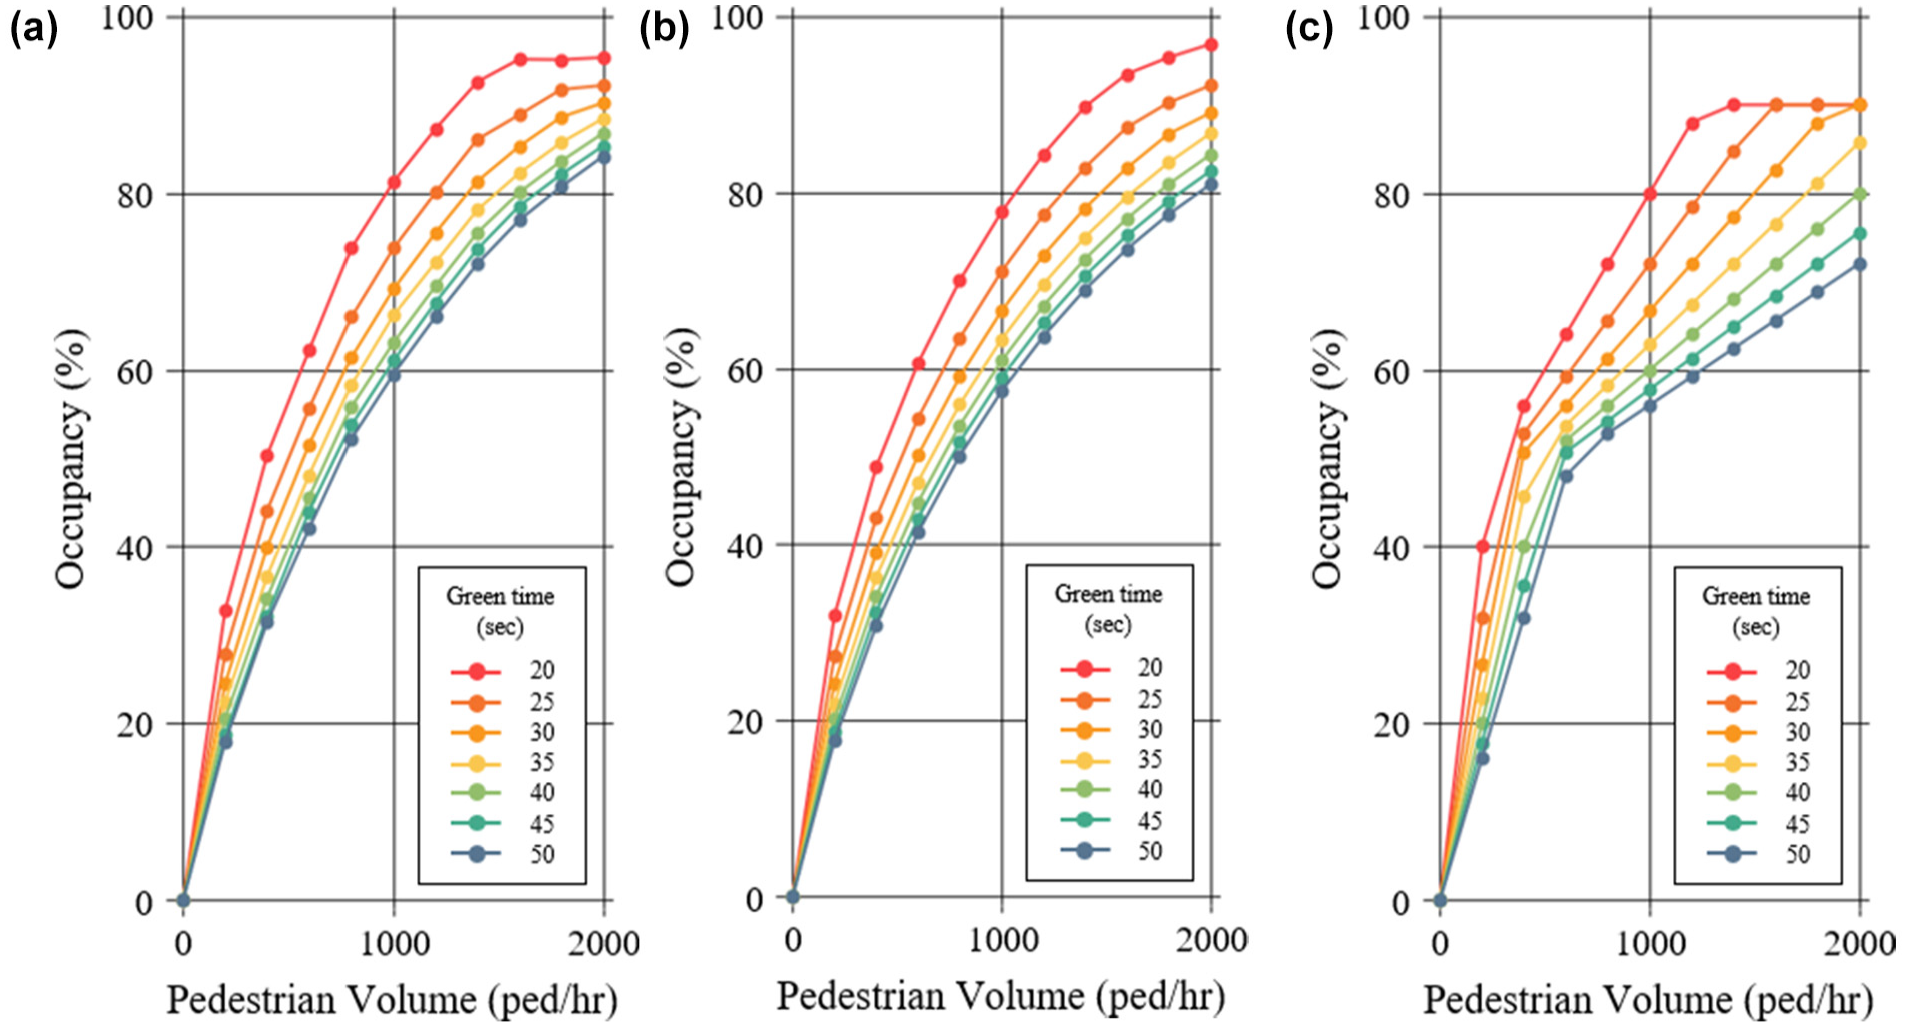
Relationship between occupancy values and pedestrian volumes for varying pedestrian green. Results from: (a) VISSIM, (b) the proposed model, and (c) Highway Capacity Manual.
Both the proposed model and the HCM model effectively captured the trend of the VISSIM results across all green times. However, the HCM model generally exhibited larger discrepancies from VISSIM than the proposed model. Specifically, the proposed model showed a maximum difference of 4% in occupancy compared with VISSIM, whereas the HCM model exhibited a difference of up to 12%.
The effect of the crosswalk length was evaluated for three different lengths: 7.0, 14.0, and 21.0 m. In this test, the green time and cycle length were fixed at 30 s and 80 s, respectively. All other variables were identical to those in the previous test. According to the results, the effect of the crosswalk length was not significant, and both the VISSIM and proposed models produced nearly identical occupancy trends for different crosswalk lengths. The HCM model, however, does not account for the crosswalk length and thus yielded the same estimates for all three lengths. As a representative example, Figure 12 presents the occupancy outcomes estimated by the three models for pedestrian volumes ranging from 0 to 2,000 ped/h when the crosswalk length is 14.0 m.
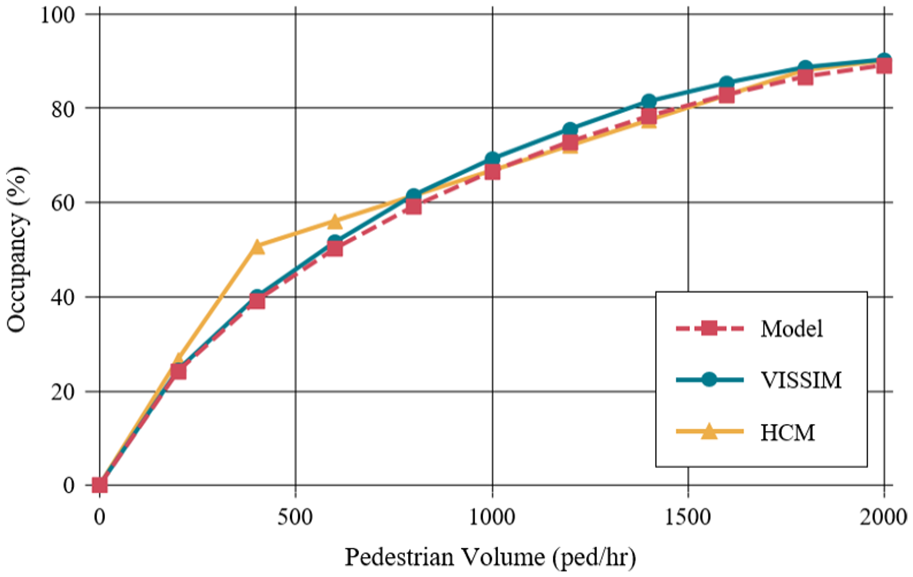
Three-model comparison of occupancy estimates for a 14 m crosswalk.
As shown in Figure 12, the proposed model and HCM results are close to the VISSIM results for the most of scenarios. However, the HCM model overestimated occupancy by approximately 10% compared with VISSIM at 400 ped/h, which corresponds to approximately 1,000 ped/h during the green phase, and this is where the two regression lines of the HCM model intersect. When this difference is converted to capacity, assuming a right-turn saturation flow rate of 1,610 passenger cars per hour per lane (pc/h/ln), it implies an underestimation of capacity by approximately 60 pc/h/ln, which in turn leads to an overestimation of delay.
Different Right-Turn Policies: Effect of Conflict Zone Adjustments
As mentioned earlier, changes in right-turn policy affect both pedestrian occupancy and right-turn capacity outcomes. For instance, if the right-turn policy shifts from a rule that permits all right-turns as long as pedestrian crossings are not obstructed (Case 1) to a more conservative rule that only allows right-turns once all pedestrians have cleared the crosswalk (Case 2), the latter would result in a lower capacity than the former. Since these policy changes essentially modify the right-turn yielding rule, they can be modeled by adjusting the conflict zone. In other words, in Case 1 the conflict zone length is set to the width required for a single vehicle to execute a right turn, while in Case 2 the entire crosswalk is designated as the conflict zone, thereby accounting for the impact of policy changes on right-turn capacity.
In this evaluation, three right-turn policies were tested, including Case 1, Case 2, and a compromise between the two. Specifically, the evaluation was conducted by increasing the conflict zone length to one lane width (3.5 m), half the length of the crosswalk (7 m), and the entire crosswalk (14 m). In this test, the green time and cycle length were fixed at 30 s and 80 s, respectively, for all scenarios. Equal pedestrian volumes by direction and a single normal pedestrian type were assumed in all scenarios. Additionally, the crosswalk length and width were fixed to eliminate the influence of other variables on the occupancy value. Figure 13, a and b, shows the occupancy estimated by VISSIM and the proposed model for different conflict zone lengths. The HCM model results are also included in each figure to assess the deviation from the other models.
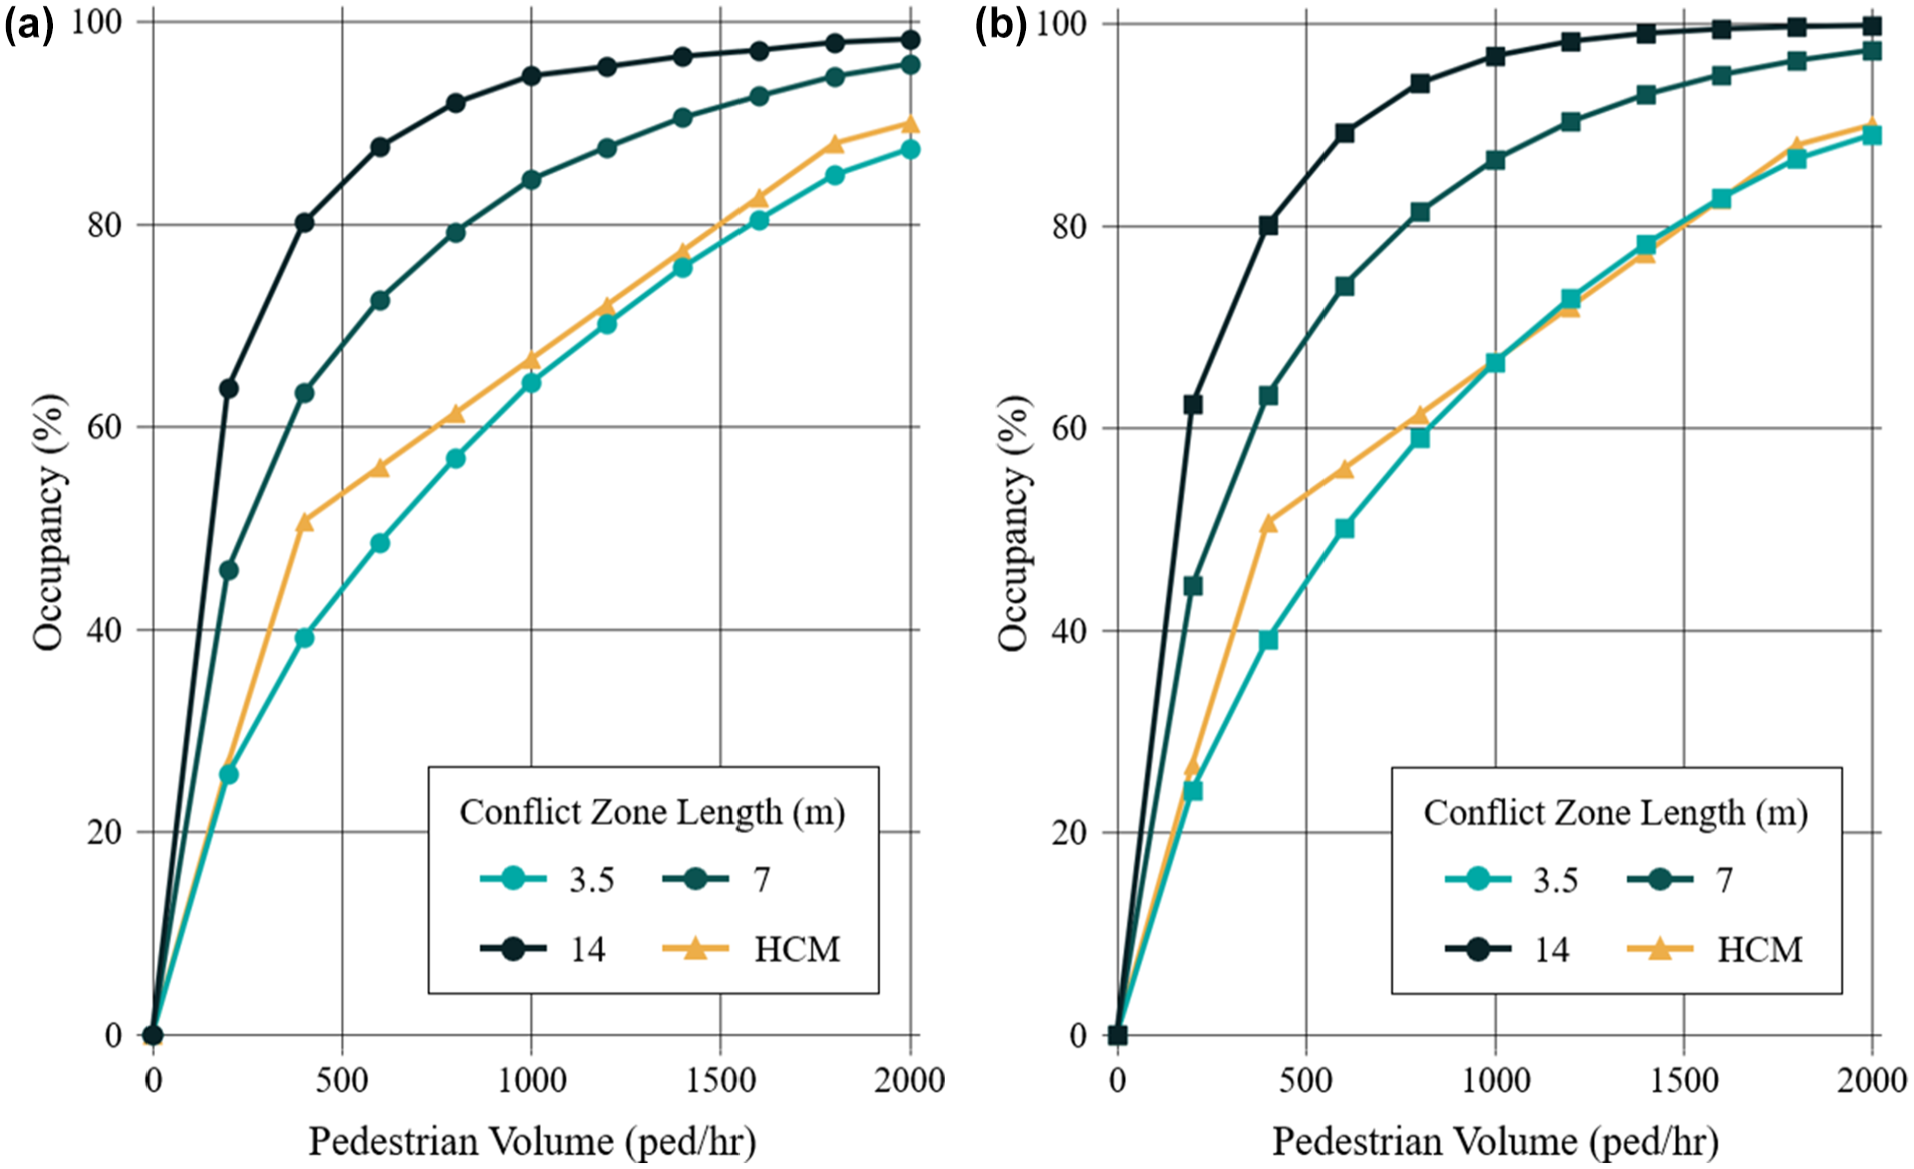
Relationship between occupancy and pedestrian volumes for different conflict zone lengths. Results from: (a) VISSIM + Highway Capacity Manual (HCM) and (b) the proposed model + HCM.
In both VISSIM and the proposed model, occupancy responded sensitively to increases in the pedestrian volume as the conflict zone length was increased. This occurred because the probability of the conflict zone being occupied by pedestrians increases as the conflict zone expands. Both models captured this trend well, and their results were nearly identical. The HCM model’s results, however, remained consistent regardless of changes in the conflict zone, producing similar values when the conflict zone was set to one lane width. This suggests that during data collection for the HCM model, a conflict zone of one lane width may have been assumed.
Unbalanced Pedestrian Volumes by Direction
The effect of unbalanced pedestrian volumes by direction on occupancy within the conflict zone was tested under the same signal timing and geometric conditions used in the previous evaluation of different right-turn policies. However, in this case the conflict zone length was fixed at 3.5 m. The total pedestrian volume from both directions was fixed at 1,000 ped/h, and the nearside pedestrian volume was adjusted in 10% increments from 0% to 100% of the total volume. Figure 14 presents the changes in occupancy based on the percentage of nearside pedestrians, as estimated by the three models.
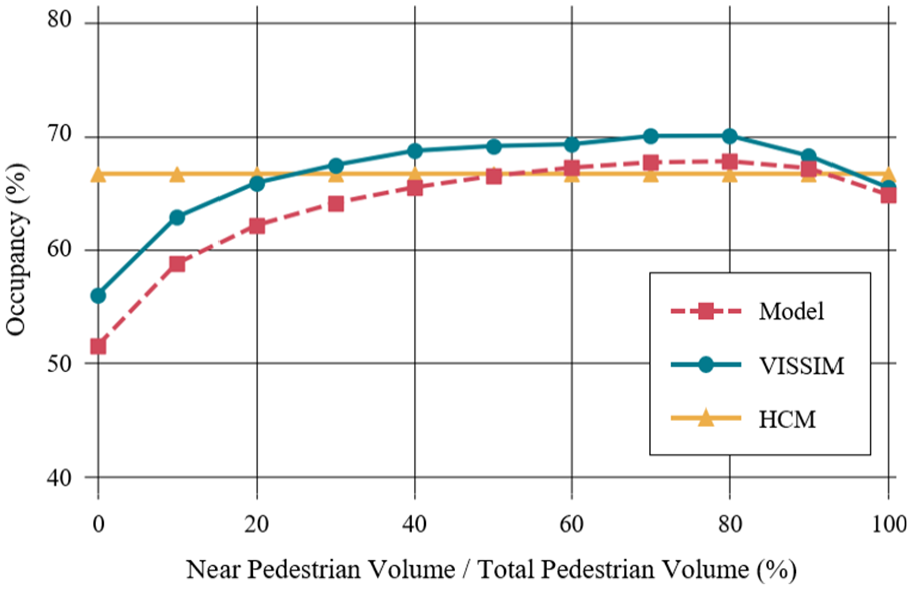
Relationship between occupancy and the nearside pedestrian percentage at a pedestrian volume of 1,000 ped/h.
While HCM yielded a constant occupancy rate for varying percentages of nearside pedestrians, the VISSIM model and the proposed model exhibited similar patterns, with a maximum difference of 4.4%. Both models showed no significant differences in their results when the pedestrian volumes by direction were not substantially different, and occupancy decreased as the volume imbalance became more extreme. However, when comparing the VISSIM results for the 0% and 100% scenarios, the occupancy outcome at a 0% nearside pedestrian volume was lower. Notably, the proposed model successfully captured the difference between the 0% and 100% scenarios.
Mixed Pedestrian Conditions
In this validation test, the same signal timing and geometric settings used in the evaluation of the unbalanced pedestrian volume by direction were used here as well. The conflict zone was set to 3.5 m from the start of the crosswalk, with the crosswalk length and width set to 14.0 m and 7.0 m, respectively. The pedestrian volumes by direction were assumed to be equal. In this test, elderly pedestrians were added as a pedestrian type. The crossing speed for elderly pedestrians was set based on field observations, defined as a uniform distribution ranging from 0.82 to 0.94 m/s in VISSIM, while an average speed of 0.88 m/s was used in the proposed model. Figure 15 shows the occupancy outcomes estimated by the three models for varying percentages of elderly pedestrians. Each figure also includes the changes in occupancy based on the total pedestrian volume.
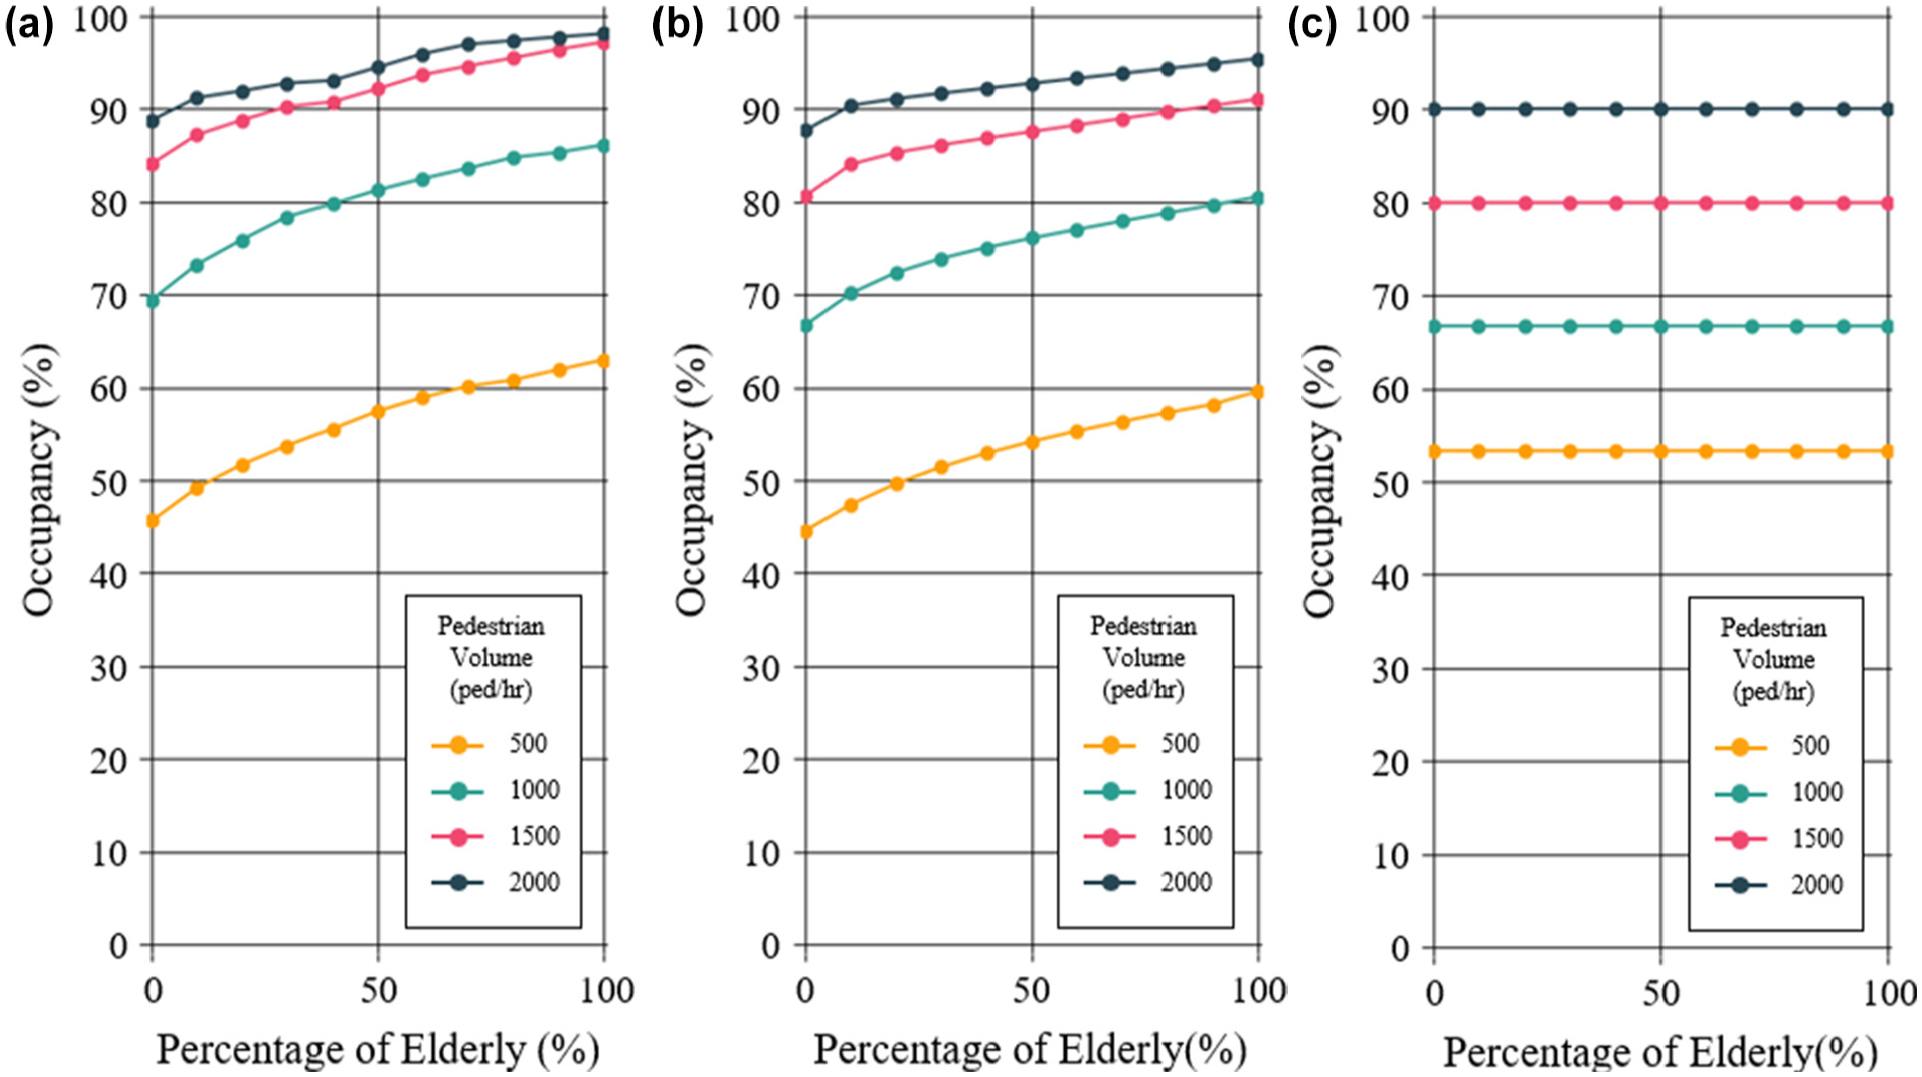
Relationship between occupancy and percentage of elderly at various total pedestrian volumes. Results from: (a) VISSIM, (b) the proposed model, and (c) Highway Capacity Manual.
Because the HCM model does not account for pedestrian types, constant values were produced for varying percentages of elderly pedestrians. On the other hand, both the VISSIM and proposed models showed that, as the proportion of elderly pedestrians increases, occupancy also increases. This arose because the lower speed of elderly pedestrians increases the time during which they occupy the conflict zone, thereby raising the probability of occupancy. Conversely, in some cases, normal pedestrians may cross the road alongside faster pedestrian types. As mentioned in the field investigation, bicycles tend to share the crosswalk with pedestrians instead of using the bicycle lane. In such cases, bicycles act as faster pedestrian types on the crosswalk. Figure 16 presents the occupancy results from the models for varying percentages of bicycles and total pedestrian volumes. The HCM results were omitted from this figure as they produced results identical to those in Figure 15c. The speed for bicycles was set to a range of 2.27 to 2.39 m/s in VISSIM, while an average speed of 2.33 m/s was used in the proposed model, based on field speed measurements.
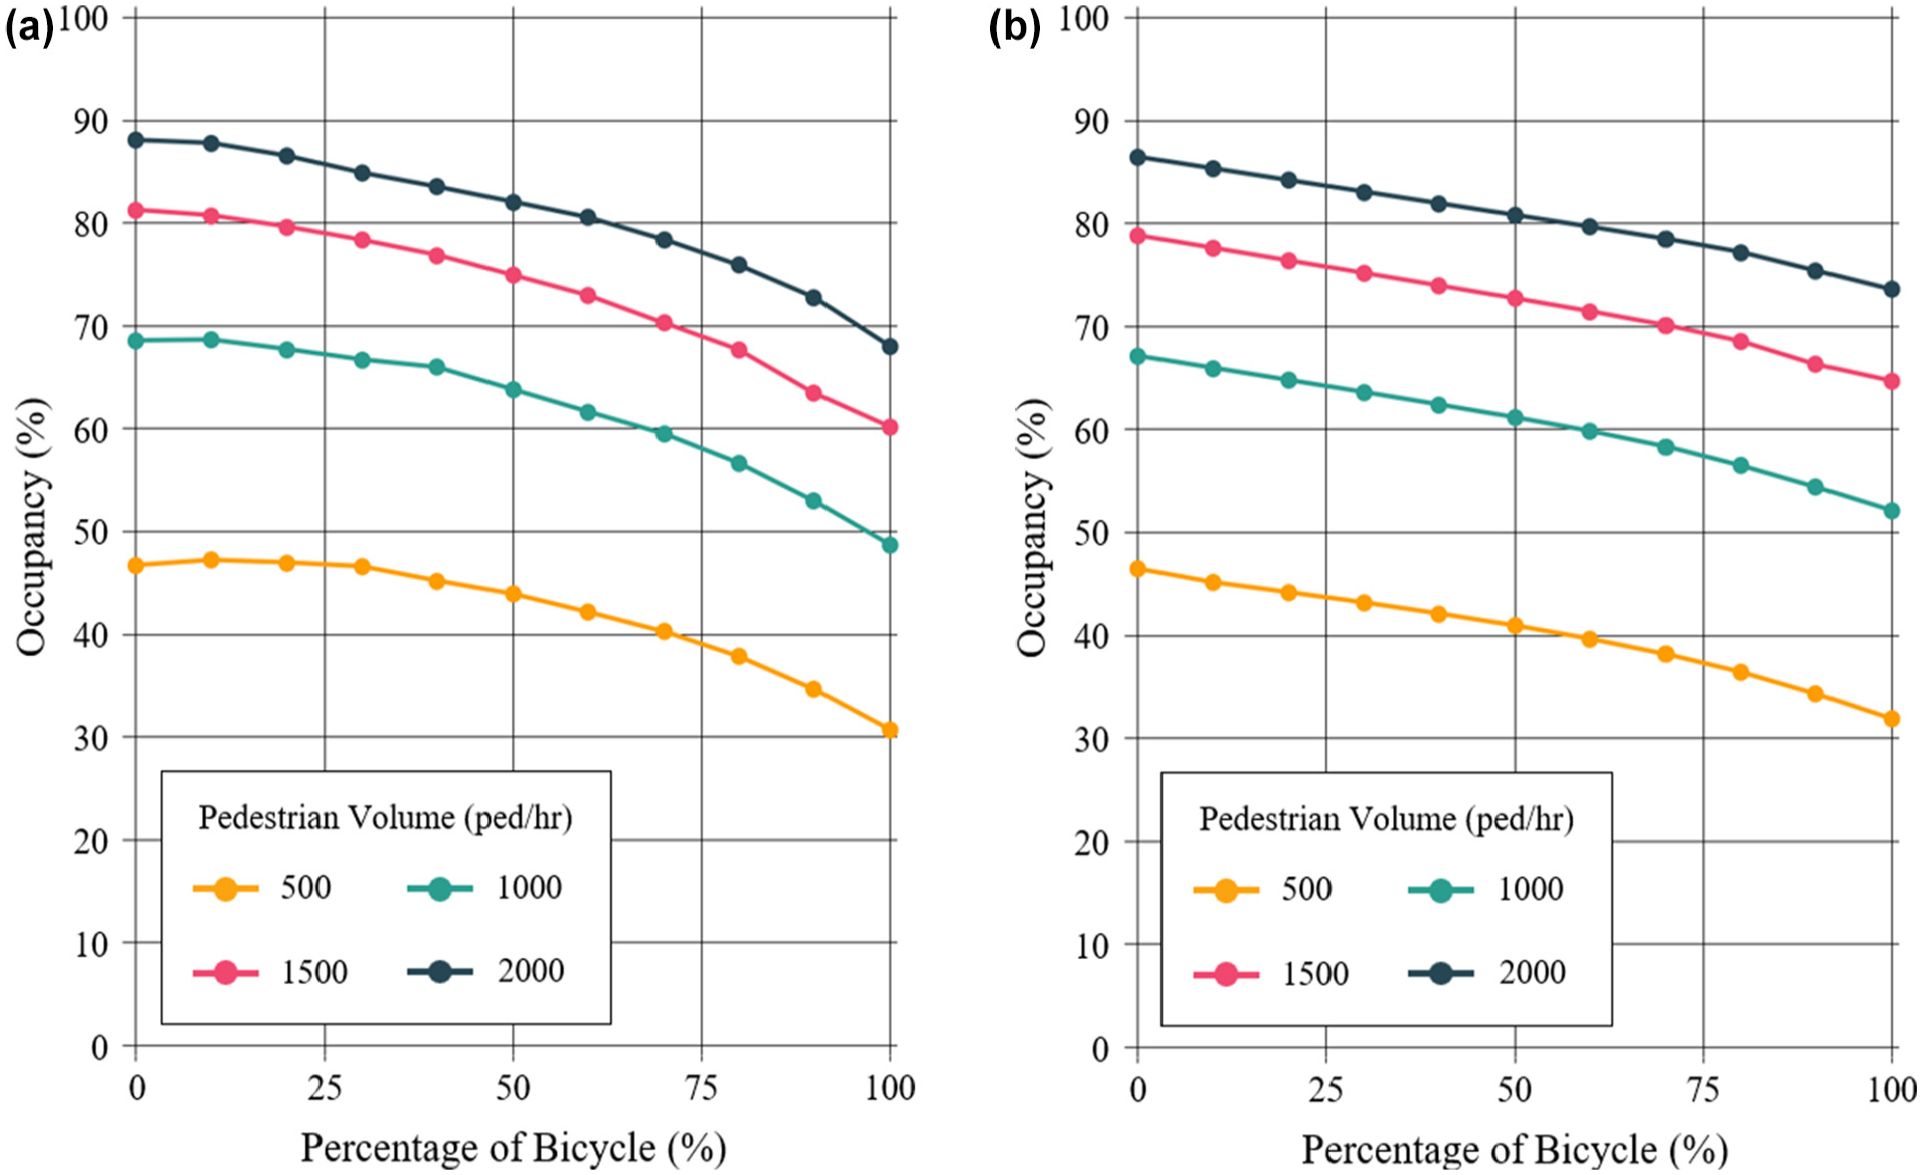
Relationship between occupancy and percentage of bicycle at various total pedestrian volumes. Results from: (a) VISSIM and (b) the proposed model.
In contrast to the case of elderly pedestrians, the models estimated lower occupancy as the percentage of bicycles increased. The proposed model showed a difference of less than 5% compared with VISSIM across all scenarios and successfully captured the trend of occupancy changes with increasing bicycle percentages observed in VISSIM.
Mixed Traffic Conditions
Given that right-turn behavior varies depending on the vehicle type, mixed traffic conditions affect the usable right-turn green time. In this validation test, a scenario with both passenger cars and heavy vehicles was assumed. While passenger cars were affected by a conflict zone of 3.5 m, it was assumed that heavy vehicles, because of their larger turning radius than passenger cars, would be influenced by a conflict zone twice as large.
In the simulation model, applying different conflict zones based on different vehicle types and measuring cycle-by-cycle occupancy is highly complicated. Therefore, the research team placed two signals with permanent green lights slightly upstream of the conflict zone in VISSIM. Each signal was set to control only passenger cars or heavy vehicles. If the conflict zone for a specific vehicle type was occupied by pedestrians, the corresponding signal would turn red by means of the VISSIM COM interface. This simulation setup allows for the measurement of the saturation flow rate when the number of pedestrians is zero and of the capacity when the number of pedestrians exceeds zero. Using the average saturation flow rate and capacity from 20 simulation runs, the unblocked green time was estimated using Equation 2. The unblocked green time was then converted into occupancy using Equation 11.
To account for the different conflict zones by vehicle type in the proposed model, the unblocked time estimated for each conflict zone using Equation 10 should be weighted according to the proportion of heavy vehicles, as formulated in Equation 12. The weighted average unblocked time was then converted into occupancy for comparison with the other models.

Where,
(refer to Equation 11), and
The validation test assumed equal pedestrian volumes by direction, with all pedestrians classified as normal. Additionally, the pedestrian green time and cycle length were set to 30 and 80 s, respectively, as in the previous tests. The crosswalk length and width were set to 14.0 m and 7.0 m, respectively. Figure 17 shows the changes in occupancy estimated by the models for varying proportions of heavy vehicles, with the pedestrian volume fixed at 1,000 ped/h.
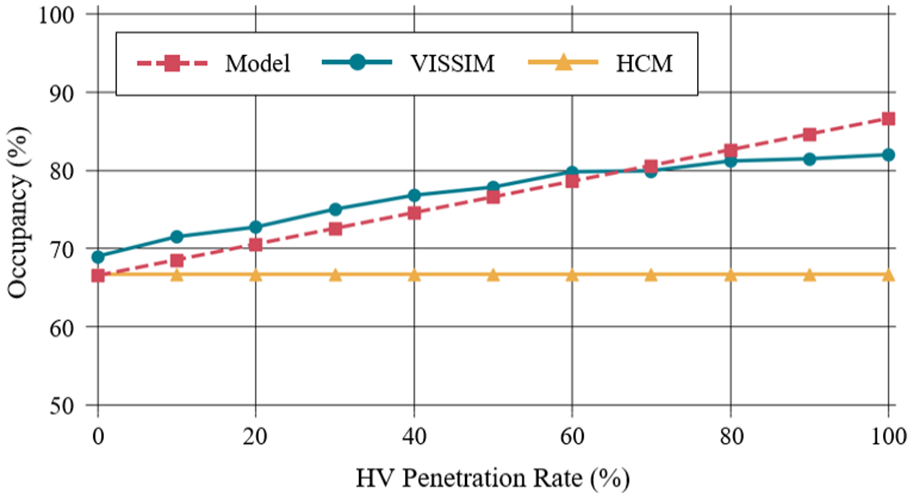
Occupancy and heavy vehicle penetration rates for pedestrian volume: 1,000 ped/h.
The proposed model successfully captured the increase in occupancy as the percentage of heavy vehicles increased, similar to VISSIM. Although the HCM model produced values very close to those of VISSIM when the percentage of heavy vehicles was 0%, the difference between the two increased as the proportion of heavy vehicles grew, since the HCM model does not account for the composition of right-turn vehicle types. In contrast, the proposed model maintained a difference of less than 3% from VISSIM across all scenarios.
Discussion
The theoretically derived proposed model was validated under various conditions. In the validation tests, the effects of 1) the pedestrian green time and the crosswalk length, 2) different right-turn policies, 3) an unbalanced pedestrian volume by direction, 4) mixed pedestrian types, and 5) mixed right-turn vehicle types on occupancy in the conflict zone were evaluated using VISSIM, the proposed model, and the HCM model.
In the validation test, all three models showed a pattern where occupancy decreases as the pedestrian green time increases. This occurs because, when the cycle length is fixed, an increase in the green time reduces the red time, thereby decreasing both the probability of pedestrian platoon formation and the size of the platoon. The HCM model accounts for this by using the pedestrian volume during the green time as a variable, rather than the total pedestrian volume. This approach produces the same result when the green-to-cycle length ratio (
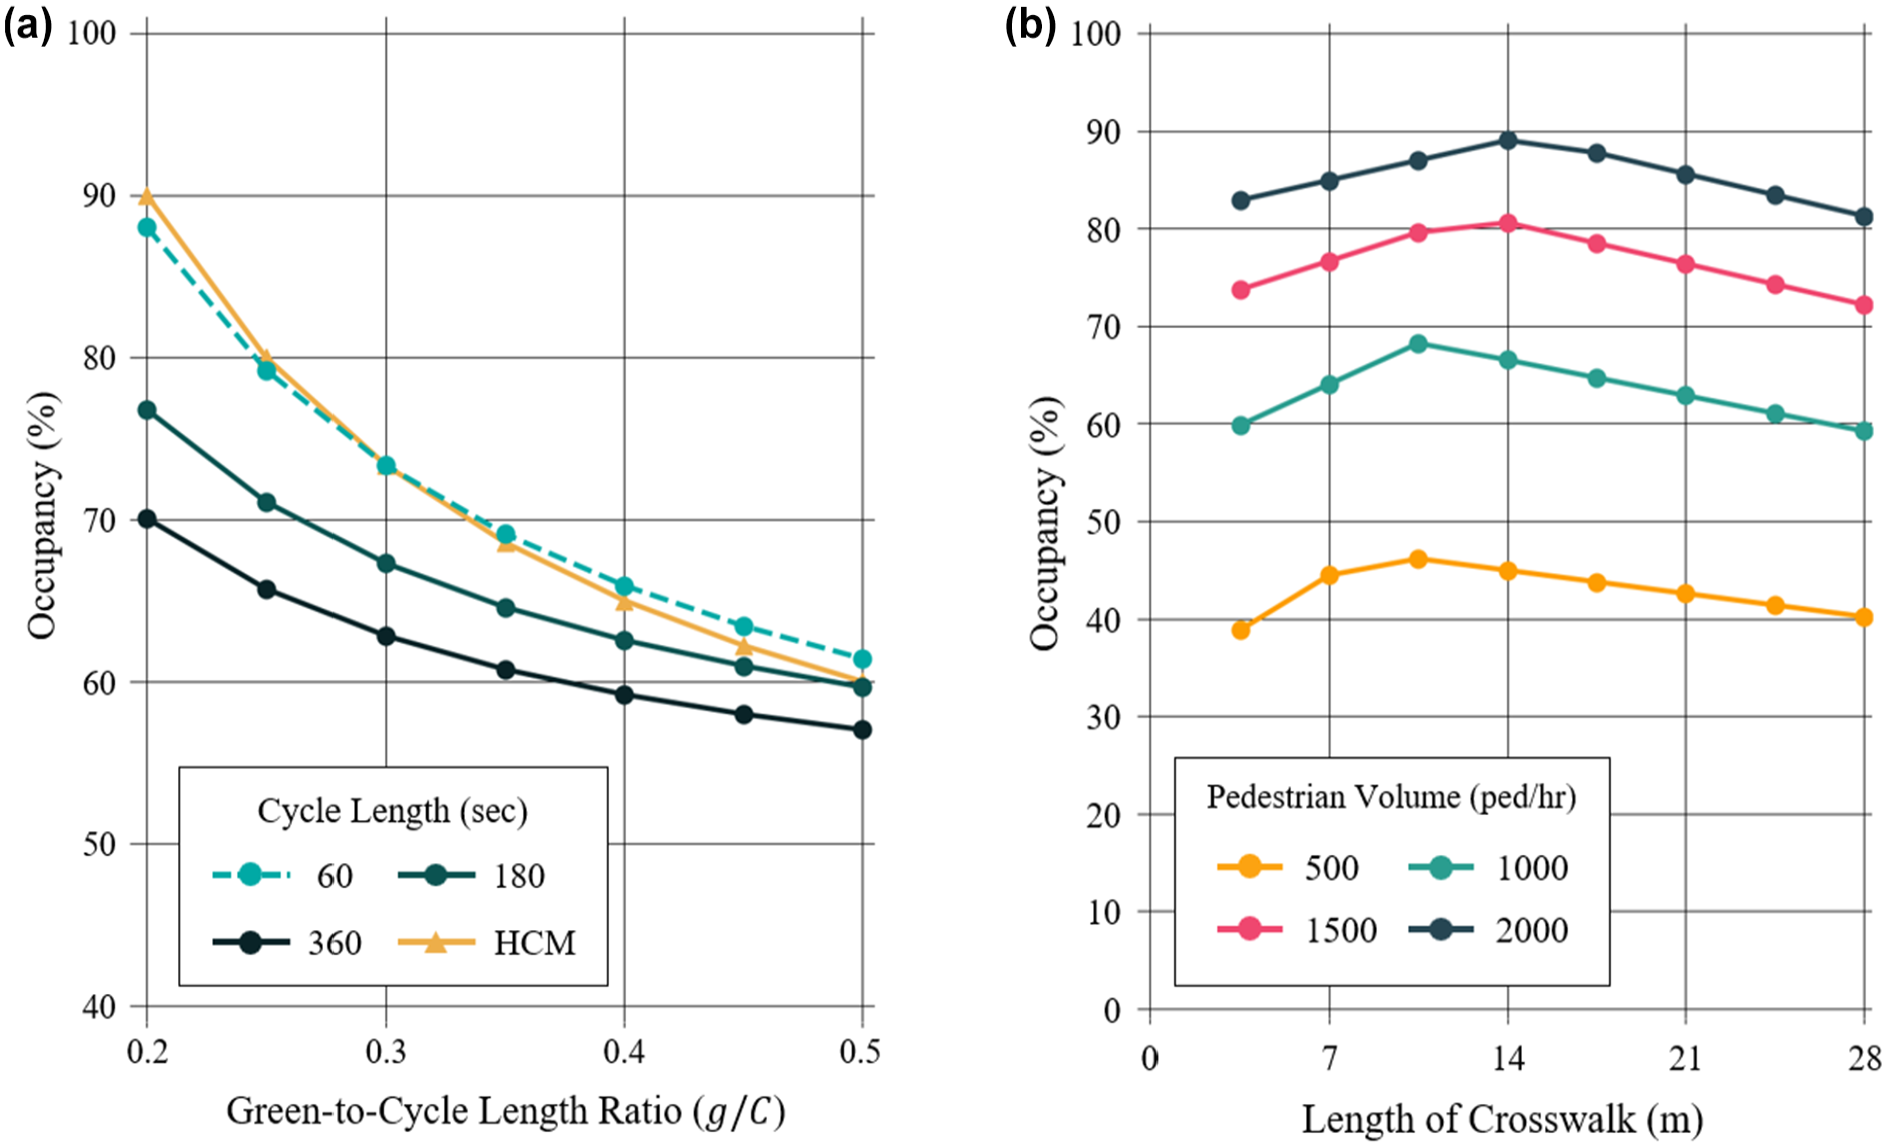
Comparison between the proposed and Highway Capacity Manual (HCM) models: (a) occupancy and green-to-cycle length ratio for various cycle lengths and (b) occupancy and crosswalk length for various pedestrian volumes.
According to the results from VISSIM and the proposed model in the validation test, the effect of crosswalk length on occupancy was not significant. However, Figure 18b shows a pattern in which the occupancy outcome initially increases as the crosswalk length increases but then gradually decreases. This occurs because, when the crosswalk length is short, the blocked times caused by pedestrian platoons from both sides overlap, reducing the total time blocked by platoons during the green phase. Once the crosswalk is long enough such that the blockage times of the two platoons no longer overlap, an increase in crosswalk length causes the second interval to lengthen and the fourth interval to shorten. Because the probability of the second interval being occupied by pedestrians is less than or equal to that of the fourth interval, an increase in the crosswalk length slightly reduces the occupancy value.
The effect of different right-turn policies on occupancy was evaluated by changing the length of the conflict zone. It was found that increasing the length of the conflict zone extended the time pedestrians occupied the zone, leading to an increase in occupancy. Therefore, when comparing the occupancy rate between a conflict zone of one lane width and the entire crosswalk, a difference of up to 41% was observed at a total pedestrian volume of 400 ped/h. In South Korea, starting in 2022, right turns have been prohibited if even a single pedestrian is occupying the crosswalk, in an effort to reduce collisions between right-turning vehicles and pedestrians. Consequently, a trade-off between traffic safety and efficiency is likely to occur.
The imbalance in pedestrian volume by direction was found to reduce occupancy slightly. Therefore, when the pedestrian volume was concentrated in one direction, the occupancy rate was lower than when the pedestrian volume was equal in both directions. Additionally, the proposed model estimated higher occupancy when all pedestrian volumes were concentrated on the near side than when they were concentrated on the far side, which aligned with the results from VISSIM.
When normal pedestrians and elderly pedestrians crossed the road together, occupancy increased, and the pattern showed that occupancy increased as the proportion of elderly pedestrians in the pedestrian composition rose. Conversely, when normal pedestrians and bicycles shared the crosswalk, the proportion of bicycles was inversely proportional to occupancy. This is because of the different crossing speeds of each pedestrian type, which results in varying blockage times.
When the right-turn vehicle composition included both passenger cars and heavy vehicles, occupancy increased as the proportion of heavy vehicles grew, because heavy vehicles require more space to make a right turn. Similar to VISSIM, the proposed model captured this trend during the validation test. In contrast, since bicycles require less space to make a right turn than vehicles, they create a smaller conflict zone with pedestrians crossing the crosswalk. Consequently, if the right-turn lane is shared between bicycles and vehicles, the overall right-turn capacity—including both bicycles and vehicles—will be higher than in cases where the lane is exclusively designated for vehicles. Consideration of the right-turn vehicle type is a variable that can be applicable in the future autonomous vehicle (AV) environment, as AVs are likely to exhibit different right-turn behaviors and levels of risk tolerance compared with human-driven vehicles.
Given that an increase in bicycle proportion reduces occupancy, as shown in Figure 16, while an increase in heavy vehicle proportion leads to higher occupancy, as presented in Figure 17, the effects of both factors may offset each other under the same conditions of pedestrian and right-turn vehicle volumes. Specifically, if both faster-walking pedestrians and heavy vehicles increase simultaneously, the change in occupancy will be neutralized, leading to a balance in the gains and losses of right-turn capacity.
All factors in the validation tests were comprehensively evaluated using cycle-by-cycle occupancies collected in the field, as shown in Figure 4. Figure 19 simultaneously presents the occupancy outcomes measured in the field and those estimated by the analytical models. For both crosswalks, the points for the proposed model are distributed around the 45-degree line (green line), with the free regression line for these points having a coefficient close to 1. In addition, the root mean square errors (RMSEs) for the proposed model for Crosswalks 1, 2, and 3 were 8.4%, 14.2%, and 17.0%, respectively. In contrast, the points for the HCM model tended to overestimate occupancy rates at both Crosswalks 1 and 2, possibly because the conflict zone assumed in the HCM model differs from the conflict zone defined in the field investigation, and pedestrian speeds can also vary between countries. Furthermore, the HCM model produced a constant result for Crosswalk 3 because of its upper bound limitation. The RMSEs for the HCM model for Crosswalks 1, 2, and 3 were 31.9%, 29.6%, and 17.2%, respectively, demonstrating that the proposed model provides a more accurate estimation of pedestrian occupancy.
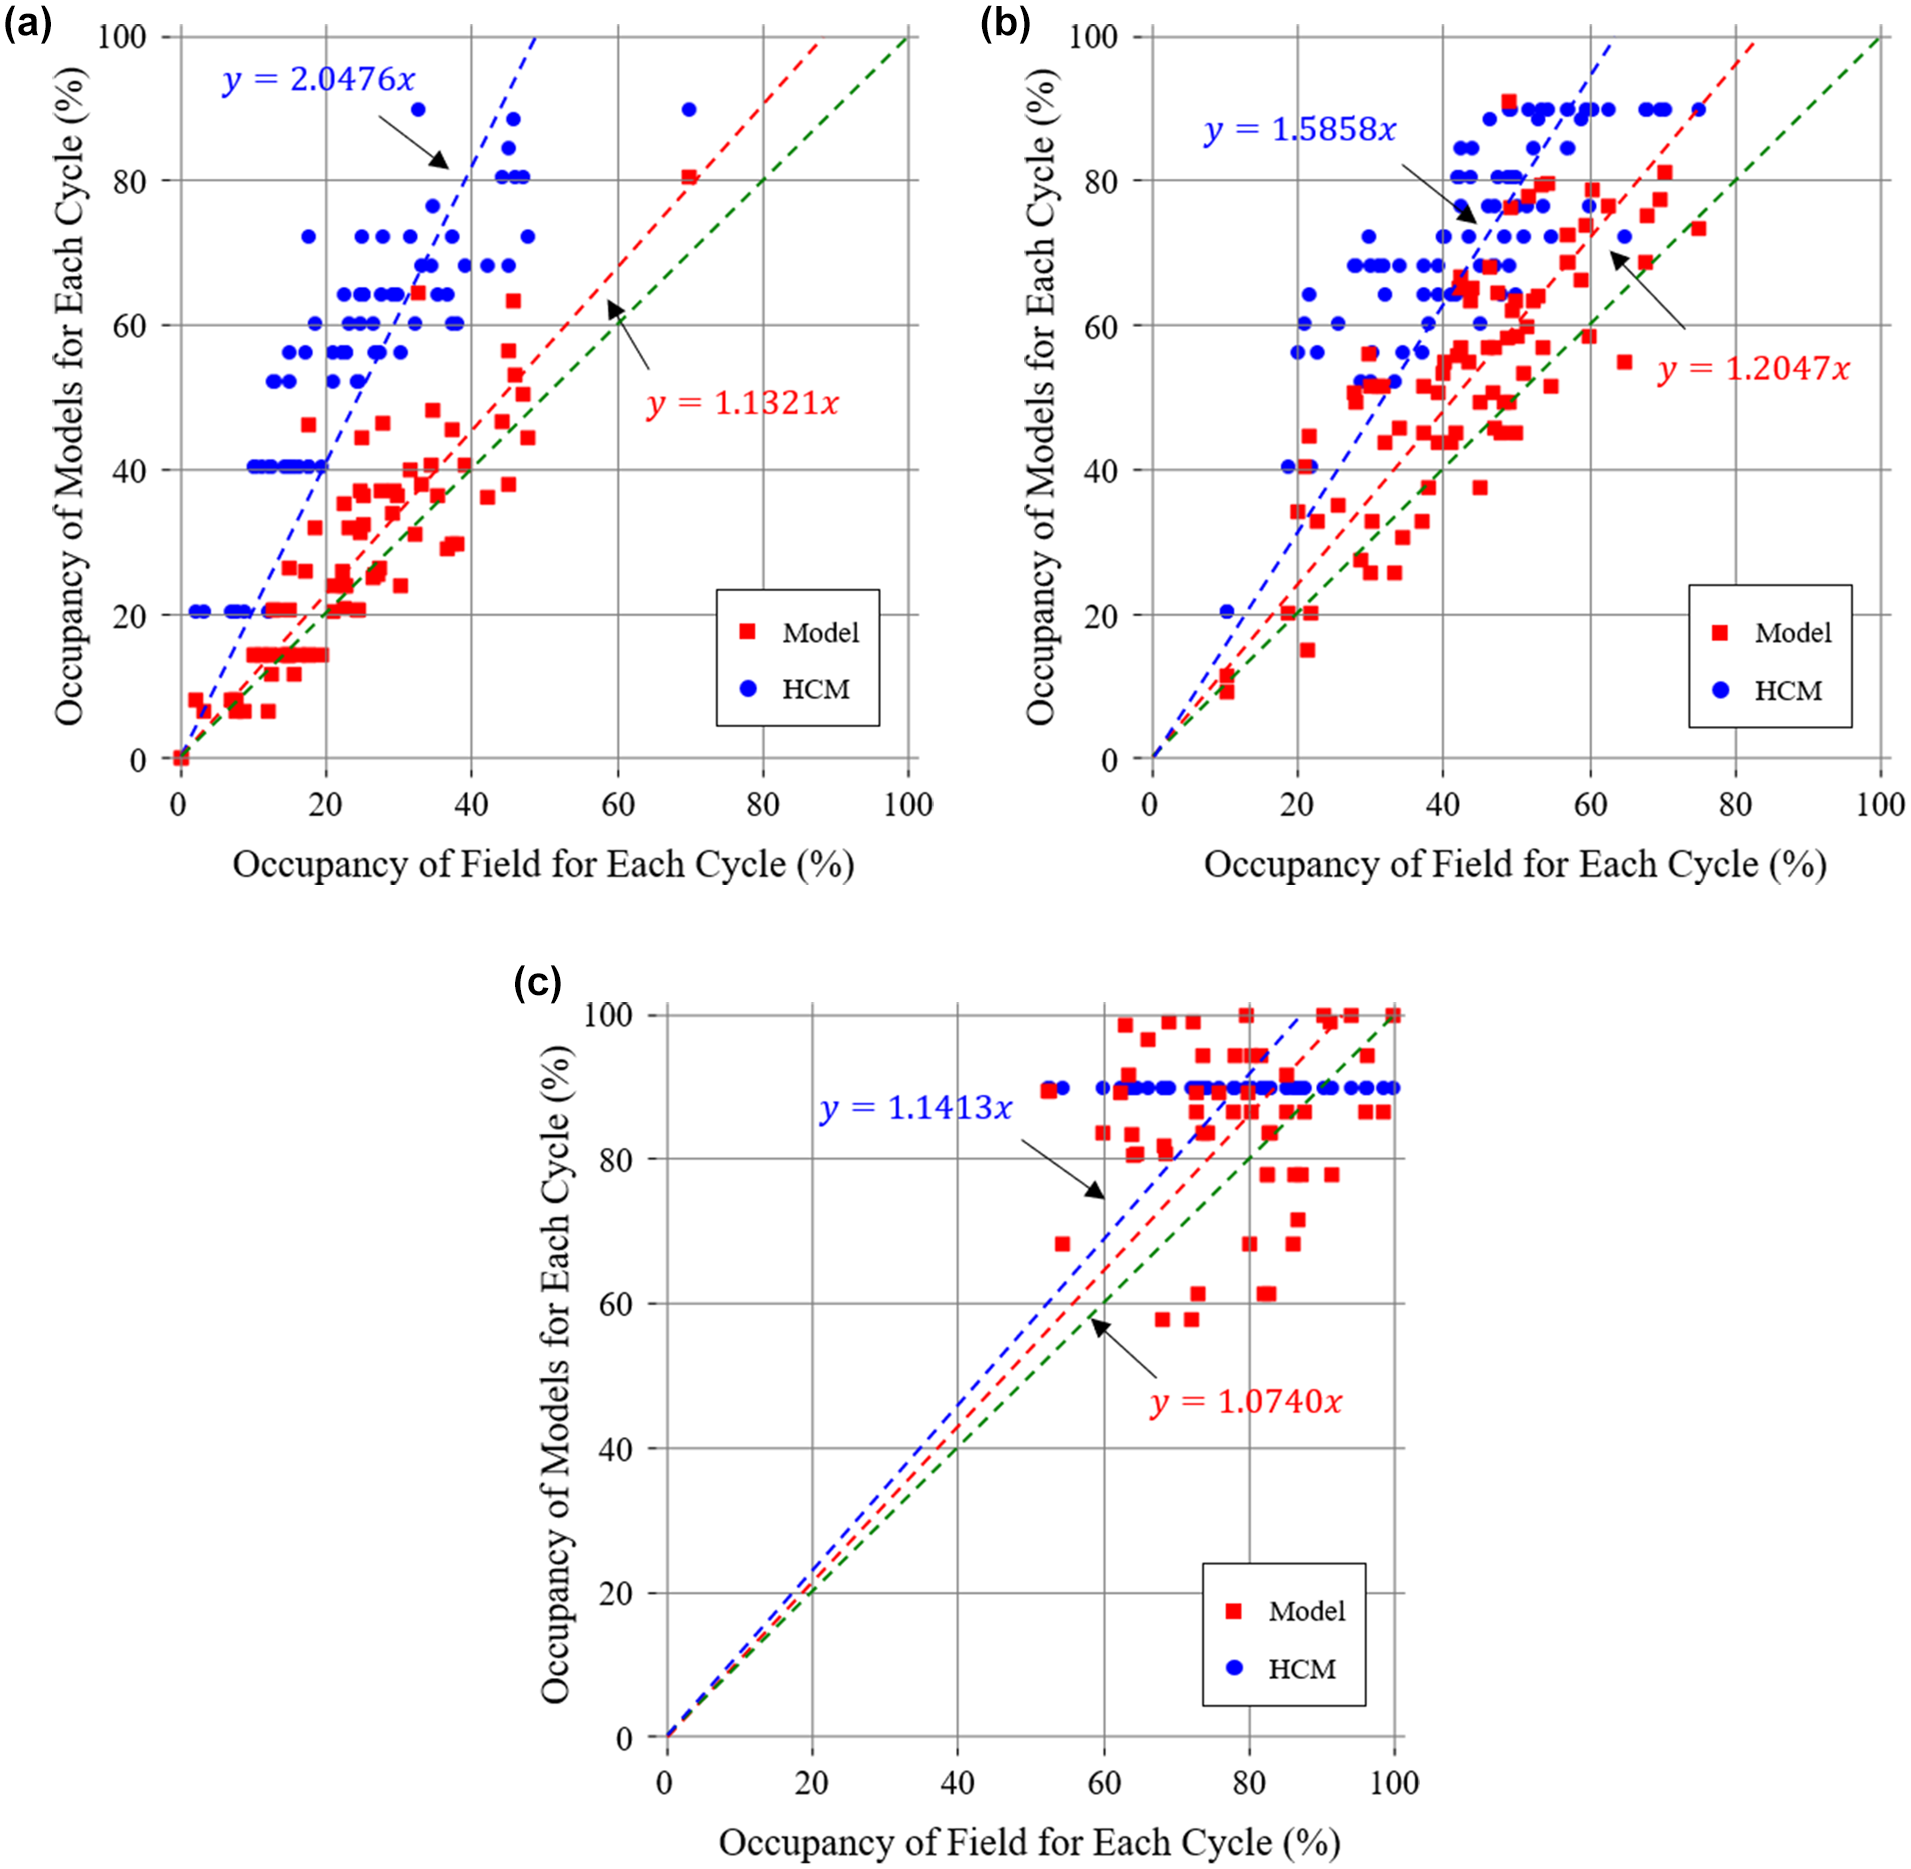
Comparison between unblocked green time measured in the field and estimated by the models: (a) Crosswalk 1, (b) Crosswalk 2, and (c) Crosswalk 3.
Conclusion
This study developed a general model for pedestrian occupancy to estimate the right-turn capacity while accounting for the impact of pedestrians. The proposed model not only considers variables such as the pedestrian volume and signal timing, as in the HCM, but also incorporates additional factors, such as 1) the length of the conflict zone, 2) the length and width of the crosswalk, 3) pedestrian types and their respective speeds, and 4) right-turn vehicle types. Moreover, the effects of these variables were validated through comparisons with VISSIM simulations and field observations across various scenarios.
Given its ability to account for a wider range of variables, the proposed model is more applicable to diverse contexts than existing models, including HCM. In addition, improvements in occupancy and capacity estimation accuracy over the HCM model have implications for delay estimation, signal optimization, and intersection geometric improvements. However, since the proposed model considers the influence of various traffic and geometric variables more comprehensively than the HCM model, it requires a greater amount of data. The additional required data includes pedestrian count by direction, pedestrian composition, and pedestrian speed, which, as demonstrated in this study, can be automatically obtained through video processing and post-processing techniques. However, in cases where video data is unavailable, reliance on manual counting becomes necessary, which is a highly time- and labor-intensive task, potentially limiting the practical application of the proposed model. Therefore, establishing regional default values for pedestrian balance, pedestrian composition, and pedestrian speed would be beneficial in reducing computational complexity and facilitating broader model adoption.
Additionally, since the model is theoretically driven, it does not account for pedestrians crossing during the red phase and assumes that pedestrians have the right-of-way, thereby excluding cases where vehicles forcefully maneuver through gaps between pedestrians. As a result, the model is not applicable to locations where pedestrian crossings frequently occur after the green phase ends or where the priority rule between right-turning vehicles and pedestrians is unclear. Therefore, investigating priority reversal and effective pedestrian green time and incorporating their impacts into the model could contribute to its further expansion and applicability.
Finally, while vehicles in a platoon are expected to follow their leading vehicles, pedestrians in a platoon can overtake one another, and their platoon length varies based on several factors, including the formation of waiting groups before the green phase, the width of the waiting area, the effective width of the crosswalk used by pedestrians, and the desired speed distribution within the platoon. Therefore, for a more accurate platoon-based model, empirical data should be incorporated, considering various traffic and geometric variables.
Footnotes
Author Contributions
The authors confirm the following contributions to the paper: study conception and design: G. Chun, K. Jang; data collection: G. Chun, S. Oh; analysis and interpretation of results: G. Chun, S. Oh; draft manuscript preparation: G. Chun, K. Jang. All authors reviewed the results and approved the final version of the manuscript.
Declaration of Conflicting Interests
The author(s) declared no potential conflicts of interest with respect to the research, authorship, and/or publication of this article.
Funding
The author(s) disclosed receipt of the following financial support for the research, authorship, and/or publication of this article: This work was supported by the Korea Institute of Police Technology (KIPoT) grant funded by the Korea government (KNPA) (Grant No. 092021C 26S01000: Development of Transportation Safety Infrastructure Standard and Evaluation Technology for Level 4 Connected Autonomous Driving)