
Abstract
The microstructure analysis of cores from a decommissioned 63-year-old bridge in Alaska provided an opportunity to study alkali–silica reaction (ASR) products found in the field under low rates of reaction. As part of the microstructural analysis, aspects of the ASR gel, such as the morphology and chemical composition, were correlated with the location and mineralogy of the aggregate particle in which the gel formed. The resulting information was compared with previously published data on ASR products in field samples. The results showed that mineral phases adjacent to the crack, other than alkali–silica reactive ones, often influenced the chemical composition of infilling gels. The ASR gels formed inside quartzite particles had higher Ca/Si and lower (Na+K)/Si values than their counterparts found in rhyolite particles. Lastly, the reactivities and alkali thresholds of the aggregates were evaluated using the American Association of State Highway and Transportation Officials (AASHTO) TP 144-23 (Turner–Fairbank Alkali–Silica Reactivity Susceptibility Test) and the AASHTO T 416-24 (Alkali Threshold Test), respectively. The long-term ASR performance of a similar concrete mixture to the one used in the construction of the bridge was predicted by inputting this information in a newly proposed ASR risk-assessment chart and found to be consistent with field observations.
Keywords
The alkali–silica reaction (ASR) is widely recognized as one of the most important degradation mechanisms threatening the durability of concrete ( 1 ). The reaction of certain silica-rich minerals in the aggregates with alkalis at the high pH of the concrete pore solution results in the formation and precipitation of different ASR products. Some of the ASR products can absorb water and swell, cracking the concrete. Even though the reaction was first discovered more than 80 years ago, its slow rate, the complex structure of the ASR products, and the small amounts of products generated in field samples have hindered complete understanding of the mechanism.
Considering the challenges mentioned in the previous paragraph, recent research efforts to probe ASR gels have resorted to using sizeable quantities of ASR gels synthesized in the laboratory ( 2 – 10 ). However, this approach is limited by how closely these laboratory products resemble ASR products found in aged and deteriorated concrete structures in the field. The chemical and structural information gathered from ASR products inside concrete structures not only allows for a better understanding of the overall reaction mechanism but also validates the suitability of the mortar or concrete-based accelerated tests as predictors of the reaction in the field ( 11 , 12 ). Several studies have been published over the past 30 years describing the chemical, morphological, and structural characteristics of the ASR products found in field samples (7, 13–32). Unfortunately, only a few of these studies have reported the specific mineralogy of the aggregate associated with the ASR reaction from which the chemical information of ASR products was gathered. Without this type of information, it is not possible to understand if certain common minerals in aggregates, besides the alkali–silica reactive ones, influence the chemical composition of the ASR products. As an example, the leaching of aluminum, sodium, potassium, or calcium from feldspars under concrete pore solution conditions could have the potential to influence the chemical composition of the ASR products growing in their vicinity.
The decommissioning of a 63-year-old bridge in Alaska provided a good opportunity to expand current knowledge on ASR products found in the field and, in this case, products formed at low reaction rates. The continental climate of the Fairbanks, AK, area, where the bridge was located, has average temperatures ranging from 72°F (22°C) to −19°F (−28°C), resulting in the sparse formation of ASR products at low temperatures over an extended period. The low temperatures explain the absence of concrete structures suffering from reported ASR in Alaska, despite the reactive character of most of the aggregates used in concrete production ( 33 , 34 ). In addition, the study of the concrete samples retrieved from the bridge provides an opportunity to link the chemical composition of the ASR products with the mineralogy of the reactive aggregate.
This manuscript describes the results of a detailed analysis of the microstructure of cores from the 63-year-old bridge using scanning electron microscopy (SEM). The SEM analysis helped to detect the presence and distribution of ASR products, discern differences in their morphology, and document their elemental composition. The chemical composition of the two classic morphologies of the ASR product, crystalline and amorphous, found in the cores was correlated with the specific location and mineralogy of the aggregate in which they formed. For the purpose of discussion, the aggregate particle in which the ASR gel originally formed has been referred to as the hosting aggregate. These results were compared with other published information on ASR products from the field. In addition to the SEM analysis of the field samples, the aggregates’ reactivity was evaluated using the Turner–Fairbank Alkali–Silica Reactivity Susceptibility Test (T-FAST) and alkali threshold test (ATT), and a new ASR risk-assessment chart accurately predicted the ASR long-term performance of a concrete mix similar to that used in the bridge’s construction.
Materials and Methods
Aggregates
Representative samples of the coarse (CA-22-010) and fine aggregate (FA-22-009) were collected from the same quarry as the aggregates originally used in the construction of the bridge. The quarry is located in the Fairbanks, AK, area. The coarse and fine aggregates are both alluvial gravels. The presence of alkali–silica reactive phases and the alkali threshold of the aggregates alone (ATAg) were determined using the T-FAST and ATT.
Three pieces of concrete from the 63-year-old bridge were received for analysis. These field samples were part of an urban collector bridge located in the Fairbanks North Star Borough in Alaska. The structure had two spans with an overall length of 103 ft and a width of 36 ft. The bridge reached the end of its service life with the deck in poor condition. The American Road and Transportation Builder Association classified the bridge as structurally deficient and recommended it be decommissioned ( 35 ).
Methods
T-FAST Classification and Alkali Threshold of the Aggregates
The presence of alkali–silica reactive phases in the aggregates was determined by the chemical test developed by the Federal Highway Administration (FHWA) Turner–Fairbank Highway Research Center (TFHRC). The coarse and fine aggregates were analyzed using the American Association of State Highway and Transportation Officials (AASHTO) TP 144-23 standard ( 36 ). The alkali thresholds of the aggregates alone (ATAg) and combined as under the concrete mixture design proportions (ATMx) were measured using the ATT. The specifics of the procedure and equations used to calculate the alkali loadings (ALs) that the aggregates were exposed to can be found in AASHTO T 416-24 ( 37 ). A study has recently demonstrated that ATMx provides a better understanding of the long-term risk posed by any concrete to develop ASR than ATAg ( 38 ). This result occurs because the former captures the potential influence of the fine aggregates on the ASR reactivity of the coarse aggregates.
ASR Risk-Assessment Chart
The ASR risk-assessment chart was used to evaluate the propensity of aggregates to develop an ASR under similar concrete mix designs as that used in the bridge. Figure 1 illustrates the configuration of the chart, where ATMx is compared against the AL of the concrete to determine the likelihood of an aggregate combination to develop an ASR ( 38 ). The chart is divided into three regions. The region where the AL of the concrete is lower than ATMx is defined as R0, and the aggregate combination falling in this region does not have a risk of developing an ASR. By contrast, the R2 is an area where the AL of the concrete is higher than ATMx, and therefore those aggregates will develop an ASR. Finally, R1 is defined as an intermediate region where, as in R0, the AL of the concrete is lower than ATMx of the aggregates but close to the line of equity. The influx of external alkalis into the system, such as regular exposure to deicers or underground water, can cause the AL of the concrete to cross over the R2 area. The calculation of the AL of the bridge’s mixture design is explained in detail in the Results and Discussion section of this manuscript.
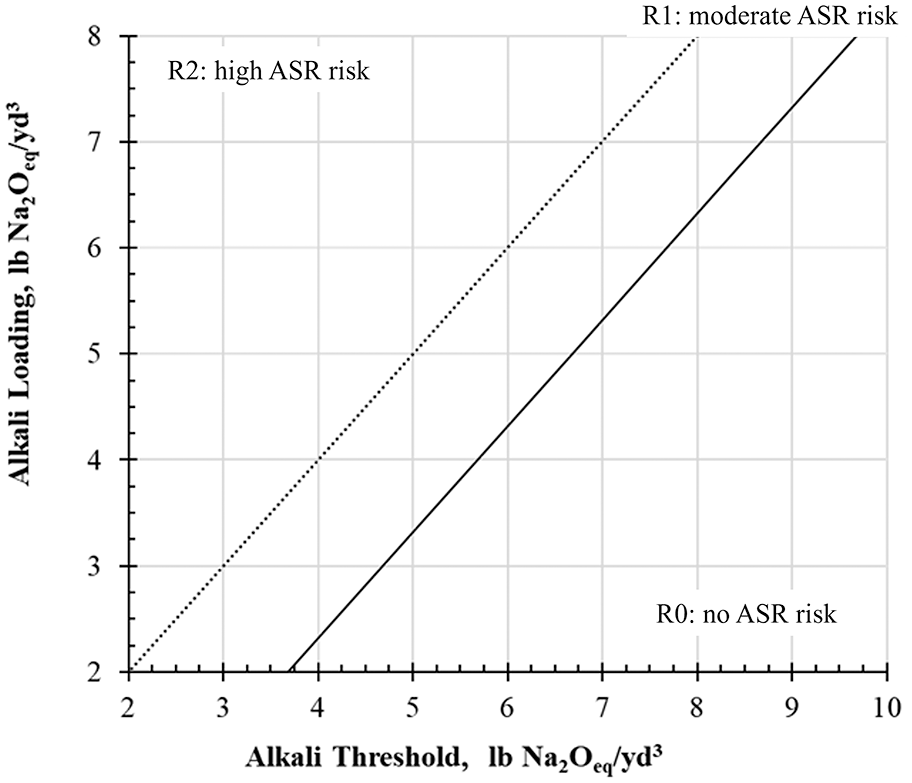
Alkali–silica reaction (ASR) risk-assessment chart.
Microstructural Analysis
The SEM analysis of the ASR gel inside the concrete samples from the field was performed on representative specimens extracted from the bulk at different sections of the bridge deck. A total of six 2 in. × 3 in. (5.1 cm × 7.2 cm) billets were cut out of the three concrete samples with a low-speed precision saw using oil as a lubricant. All the billets were cleaned thoroughly by immersing them in isopropanol for 24 h followed by 48-h drying in a vacuum oven at 122°F (50°C). The cleaned billets were vacuum-impregnated with a low-viscosity epoxy as well as lapped and polished using progressively finer diamond-based polishing paste.
The morphological and chemical analysis of the ASR products found in the microstructure of the billets was accomplished using an FEI Quanta™ 650 environmental scanning electron microscope equipped with a concentric backscatter detector and coupled with an X-Max energy dispersive spectrometer (EDS) manufactured by Oxford Instruments. SEM was operated at 15 kV, 10 mm working distance, approximately 2 nA probe, a scan rate of 5 min/frame, and an accumulation of approximately six frames for a single field ( 39 ). An average of six large backscatter electron (BSE) maps were collected in each billet to cover its most representative ASR features. The magnification and size of the large BSE maps varied depending on the size of the ASR feature. On average the maps had a 1000× magnification and an area of 1 mm2. The morphological information gathered through the large BSE maps was supplemented with chemical composition obtained through energy dispersive X-ray (EDX) analysis. An average of 100 measurements were taken on each billet to obtain representative composition results. A series of criteria were followed during the EDX acquisition to minimize the contribution of the surroundings, such as maintaining a minimum acquisition area of 2 × 2 µm2 and keeping it at least 1 µm away from the edges of the ASR product ( 39 – 41 ). In those cases where the width of the crack containing the ASR products of interest was smaller than 4 µm, an EDS point analysis was performed at the center of the crack to minimize the signal from the aggregate as much as possible. Based on the configuration of the scanning electron microscope and the density of the material, a 1 µm3 excitation volume was assumed in the EDS point analysis. All the EDS results in this manuscript are reported as sodium and potassium to silica (Na+K/Si), and calcium to silica (Ca/Si) molar ratios.
Results and Discussion
T-FAST and ATT Results of Coarse Aggregates
Table 1 summarizes the T-FAST reactivity index (RI) and ATAg values of the aggregates used in this study. Typical ranges of values for the RI and ATAg measured in coarse and fine aggregates of similar minerology sourced from across the country have been provided in Table 1 for comparative purposes. The T-FAST classified the coarse aggregate CA-22-010 and fine aggregate FA-22-009 used in this study as highly reactive (HR) and borderline between moderately reactive (MR) and HR, respectively. The presence of alkali–silica reactive phases in both samples resulted in the leaching of silicon during the T-FAST protocol as it was echoed by the moderate values of the RI in Table 1. This classification aligned with previous petrographic studies of aggregates in the northwest region of North America ( 33 , 34 , 42 , 43 ). The low ATAg value of the CA-22-010 sample was another indication of its HR nature. The FA-22-009 sample displayed a slightly more moderate reactivity in comparison to the CA-22-010 sample, as reflected by the borderline T-FAST classification and an ATAg of 4.6 lb Na2Oeq/yd3 (2.7 kg Na2Oeq/m3). This difference in alkali–silica reactivity among coarse and fine aggregates from the same quarry deposit is not unusual. The presence of clay-size fractions of alkali reactive minerals in the fines of the fine aggregates can contribute to a mitigating ASR ( 44 – 48 ). The RI and ATAg of the CA-22-010 and FA-22-009 fell within the typical range values measured for other aggregates with similar mineralogy in the U.S.A. Based on the T-FAST reactivity and ATAg, CA-22-010 and FA 22-009 can be cataloged as typical HR and MR/HR aggregates.
Reactivity Index (RI) and ATAg Values of the Coarse and Fine Aggregates Used in This Study and Typical Ranges Found in Aggregates of Similar Mineralogy
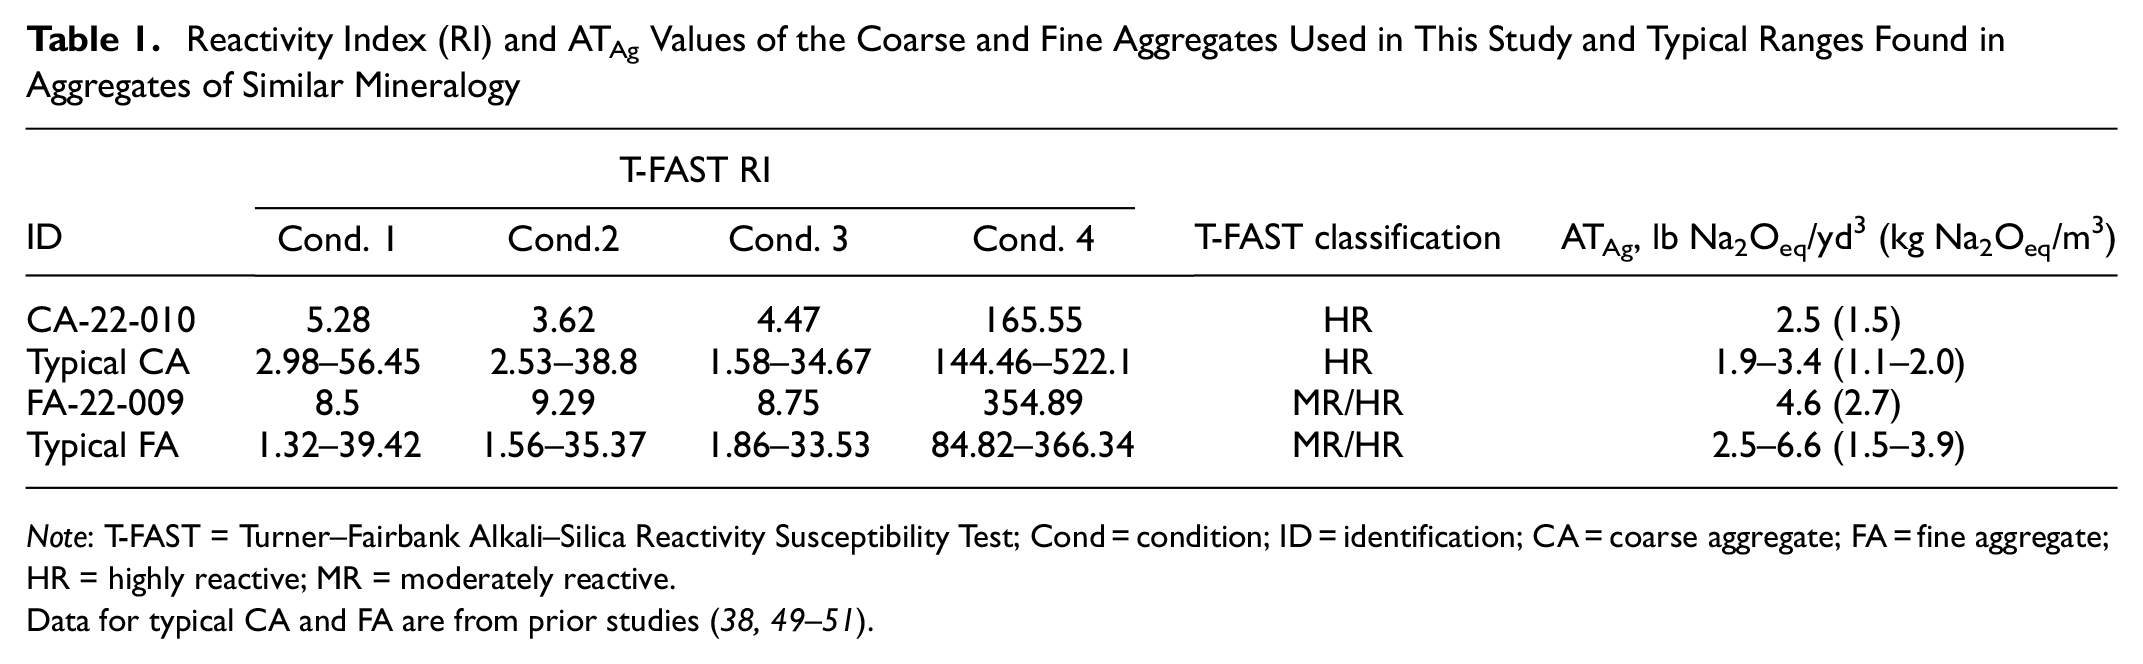
Note: T-FAST = Turner–Fairbank Alkali–Silica Reactivity Susceptibility Test; Cond = condition; ID = identification; CA = coarse aggregate; FA = fine aggregate; HR = highly reactive; MR = moderately reactive.
Figure 2 shows a comparison of ATAg of the two samples of aggregates with ATAg of aggregates of more diverse mineralogy than in Table 1, such as different types of metamorphic and igneous rocks (38, 49–51). This comparison provided a wider perspective of the reactivity of CA-22-010 and FA-22-009 with respect to other common types of aggregate mineralogy used in concrete production. Based on the T-FAST reactivity and ATAg, CA-22-010 and FA-22-009 can be cataloged as typical HR and MR/HR aggregates. In both cases, the information provided by the T-FAST and ATT indicates that limiting the AL of concrete to 5.06 lb Na2Oeq/yd3 (3.0 kg Na2Oeq/m3), a threshold considered safe, is not sufficient to avoid the formation of an ASR in concrete containing these aggregates ( 52 ).
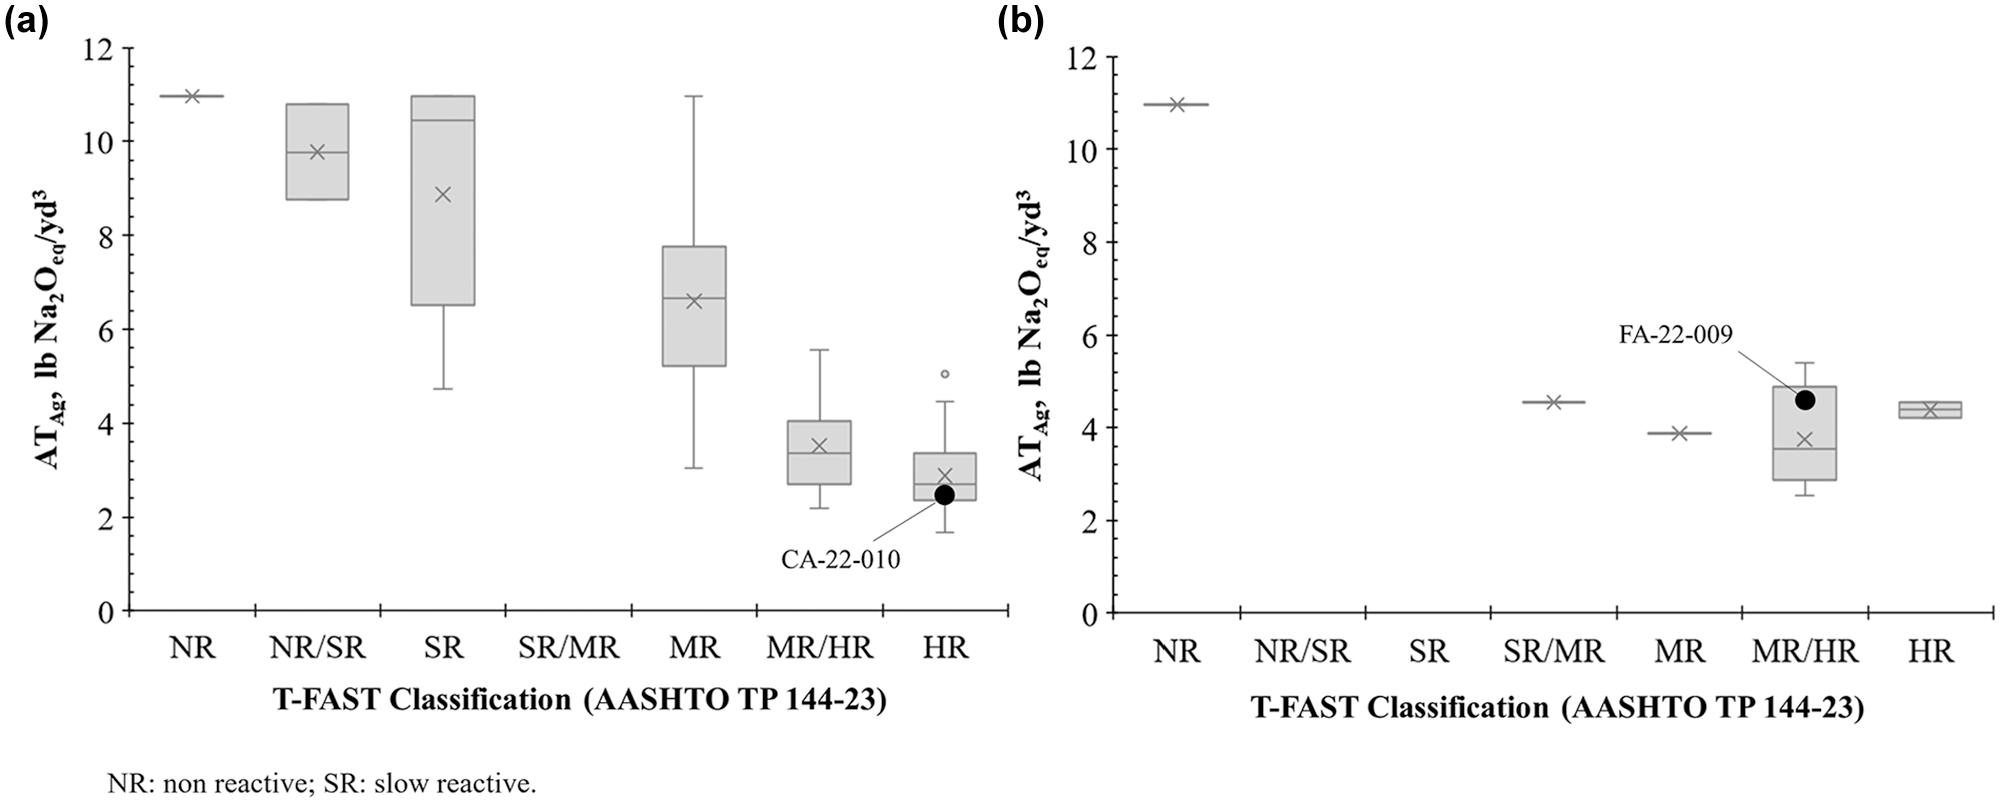
Comparison of ATAg values of the samples CA-22-010 (a) and FA-22-009 (b) with the ATAg value of U.S. aggregates with noncarbonate mineralogy.
Evaluation of Bridge Mixture Design with the ASR Risk-Assessment Chart
The risk of the concrete mixture used in the construction of the bridge to develop the ASR was analyzed using the newly proposed ASR risk-assessment chart ( 38 ). This prescriptive approach compares the ATMx of an aggregate combination with the AL of the concrete to gauge the potential for an ASR to develop. Unfortunately, the exact composition of the concrete mixture design used in the construction of the bridge is unknown since the structure was built in 1958, before Alaska had statehood and the Alaska Department of Transportation and Public Facilities (AKDOT & PF) existed. However, notes in the original specifications of the bridge indicated that a class A concrete mixture design was used. Therefore, in this case, a modern class A concrete mixture design for general used specified by AKDOT & PF was used to illustrate the potential of the aggregate combination of CA-22-010 and FA-22-009 to develop an ASR ( 53 ). The ATMx of the aggregate combination and the AL of the concrete were determined based on the mixture proportions in Table 2 and assuming a typical mixture of 100% type I/II ordinary portland cement (OPC) of low alkali content (0.57% Na2Oeq). The assumption of 0.57% Na2Oeq as the alkali content of the cement was based on the typical alkalinity of cement used in Alaska currently.
General Used Concrete (f’c = 4.0 kips per square inch [ksi]), Alaska Department of Transportation and Public Facilities Class A Mix Design, ATMx of the CA-22-010 and FA-22-009 Aggregate Combination, and Alkali Loading (AL) of Concrete Made with Low-Alkali I/II Cement
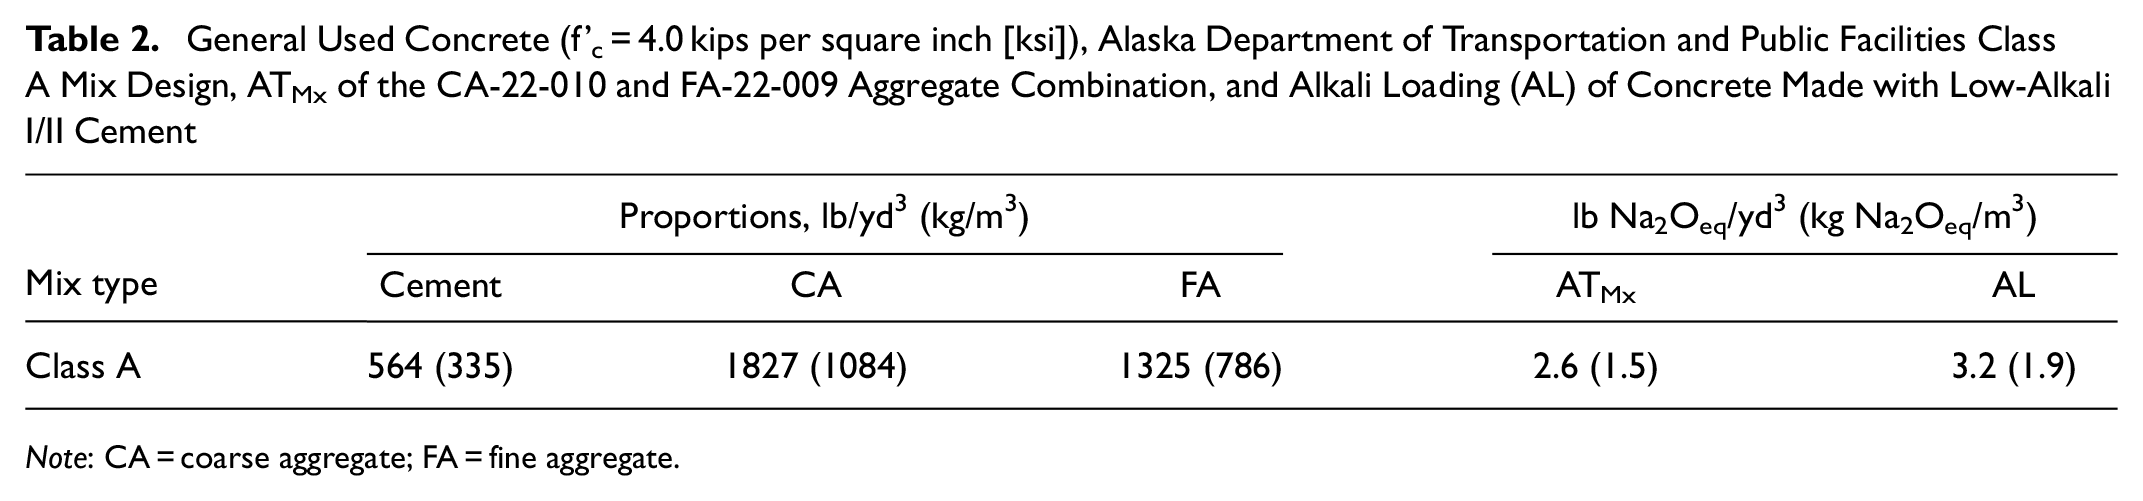
Note: CA = coarse aggregate; FA = fine aggregate.
The comparison of the ATMx and AL of the class A concrete using the ASR risk-assessment chart in Table 2 provides a fast and visual assessment of the propensity for ASR gel formation. As shown in Figure 3, the mix fell in the high ASR risk region (R2) of the chart predicting the development of the ASR in the concrete. This prediction aligned with the results of the microstructural analysis in which signs of an ASR were found. The chart also indicated that for this aggregate combination with such a low ATMx, limiting the AL of the concrete below 5.06 lb of Na2Oeq/yd3 (3.0 kg Na2Oeq/m3) by using low-alkali cement will not be sufficient to halt the formation of an ASR. However, the climate of the bridge’s location, with average temperatures ranging from 72°F (22°C) to −19°F (−28°C) and long winter seasons, explains the limited ASR gel formation, despite the high reactivity of the aggregate combination. This scarce amount of ASR gel formation was not sufficient to cause a premature failure of the bridge structure, allowing it to reach the end of its service life. However, the presence of ASR gel may have contributed to the poor structural condition of the bridge in its last years of service. The cold climate in Alaska plays a positive role in preventing ASR-induced expansion and allows most of the transportation structures made with this ASR reactive aggregate combination to reach the end of their service life without the need for other mitigation strategies, such as supplementary cementitious materials.
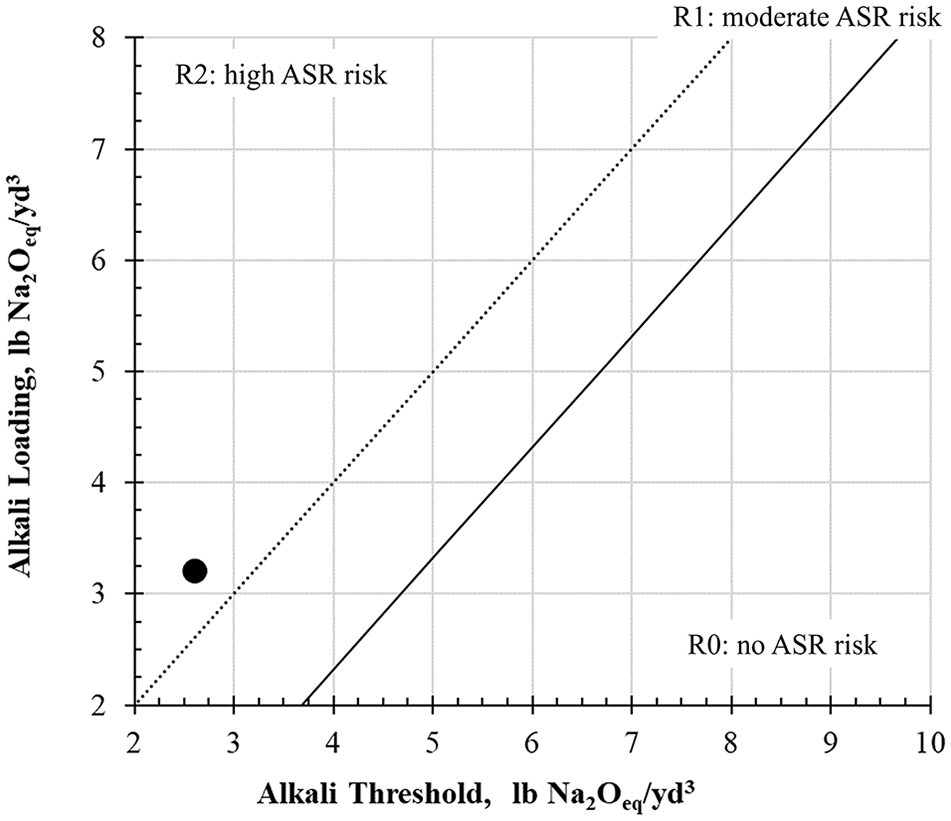
Alkali–silica reaction (ASR) risk assessment of the class A concrete mixture.
Microstructural Analysis
A general inspection of the field samples indicated that the concrete contained a natural coarse and fine aggregate and an air-entrained OPC binder matrix. The natural coarse aggregate had well-rounded particles homogenously distributed in the concrete. Typical ASR features, such as prominent cracking in aggregates, were not observed under this preliminary visual inspection.
The microstructural analysis of the SEM specimens provided additional information on the fine aggregates and the air entrainment in the concrete. The well-rounded particles of the natural fine aggregate were evenly distributed around the coarse aggregates. Important ASR features, such as cracks within aggregates partially infilled with gel products, were observed in the SEM samples. Two different types of cracks were identified based on their occurrence. The most common crack was found predominantly in aggregates of quartzite mineralogy. Figure 4 provides a representative BSE image of this type of crack. The main characteristics of cracks of this type were the small crack width (approximately 2–4 µm) and the presence of pockets of amorphous ASR gel filling partial sections of the cracks.
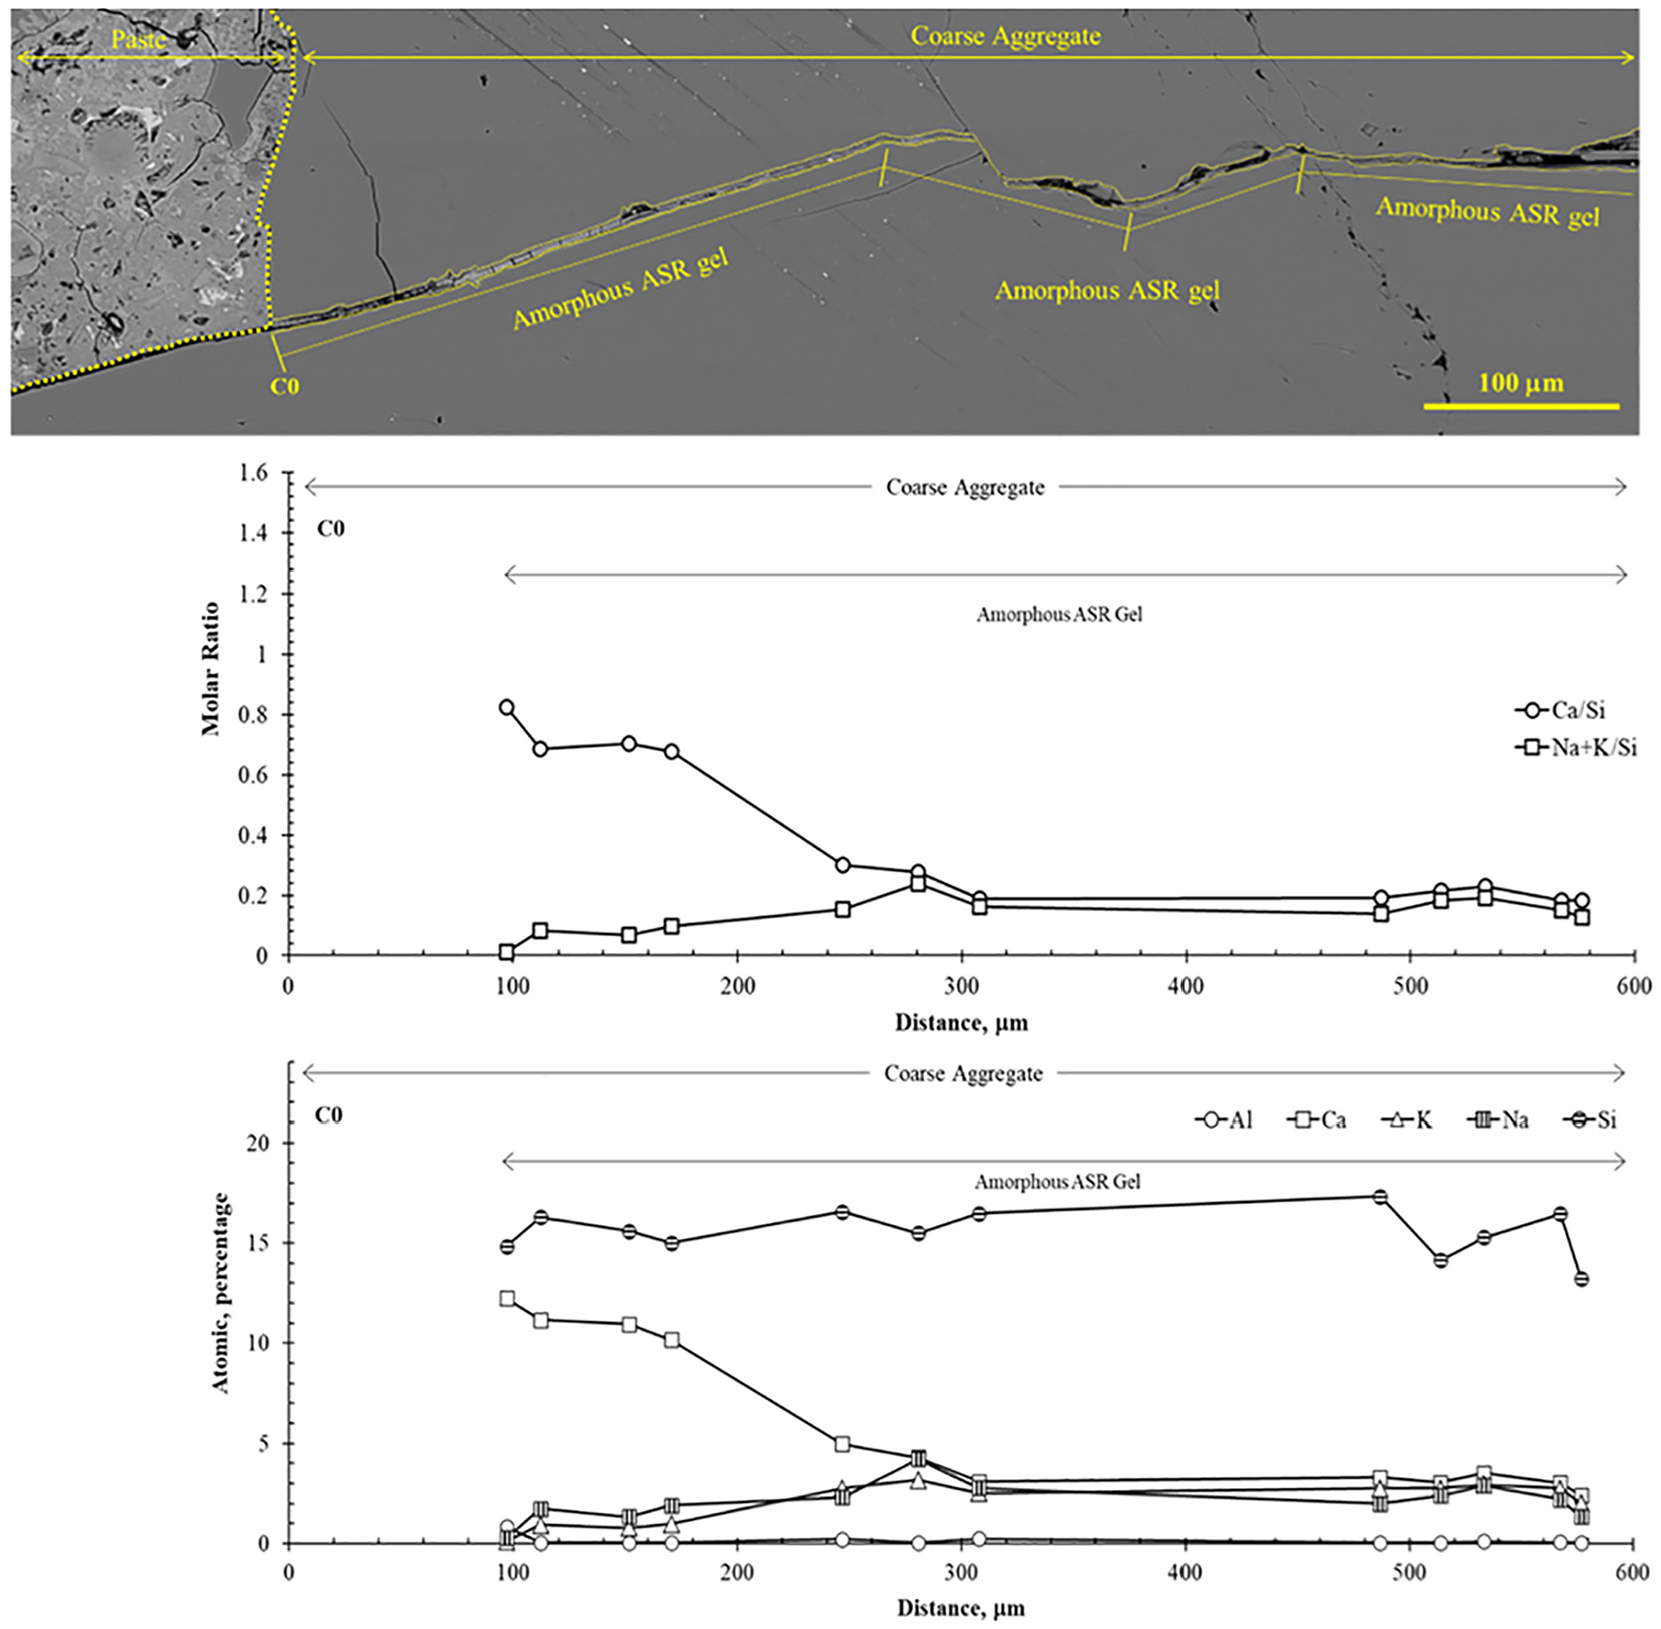
Large backscatter electron map with a crack in a quartzite aggregate partially filled with amorphous alkali–silica reaction (ASR) gel (top). Evolution of the chemical composition of the ASR products inside the crack with distance from the mouth of the crack expressed as a molar ratio (middle) and atomic percentage (bottom).
Figure 5 illustrates the second type of cracks identified in the SEM microstructural analysis. Although not as common as those described in Figure 4, these cracks, growing through aggregate particles of rhyolite mineralogy, had distinctive features compared with the cracks observed in quartzite. The width of the cracks within the rhyolite aggregate particles were wider, averaging between 15 and 40 µm. Two types of ASR gels were found inside these cracks, amorphous and crystalline. The latest one is a typical type of ASR gel observed in old concrete structures (13, 14, 16–18, 22, 25, 30). Another important feature observed in Figure 5 is the significant amount of ASR gel generated inside the crack. The BSE map shows part of the amorphous ASR gel flowing out of the crack in the aggregate and filling up an air void in the vicinity.
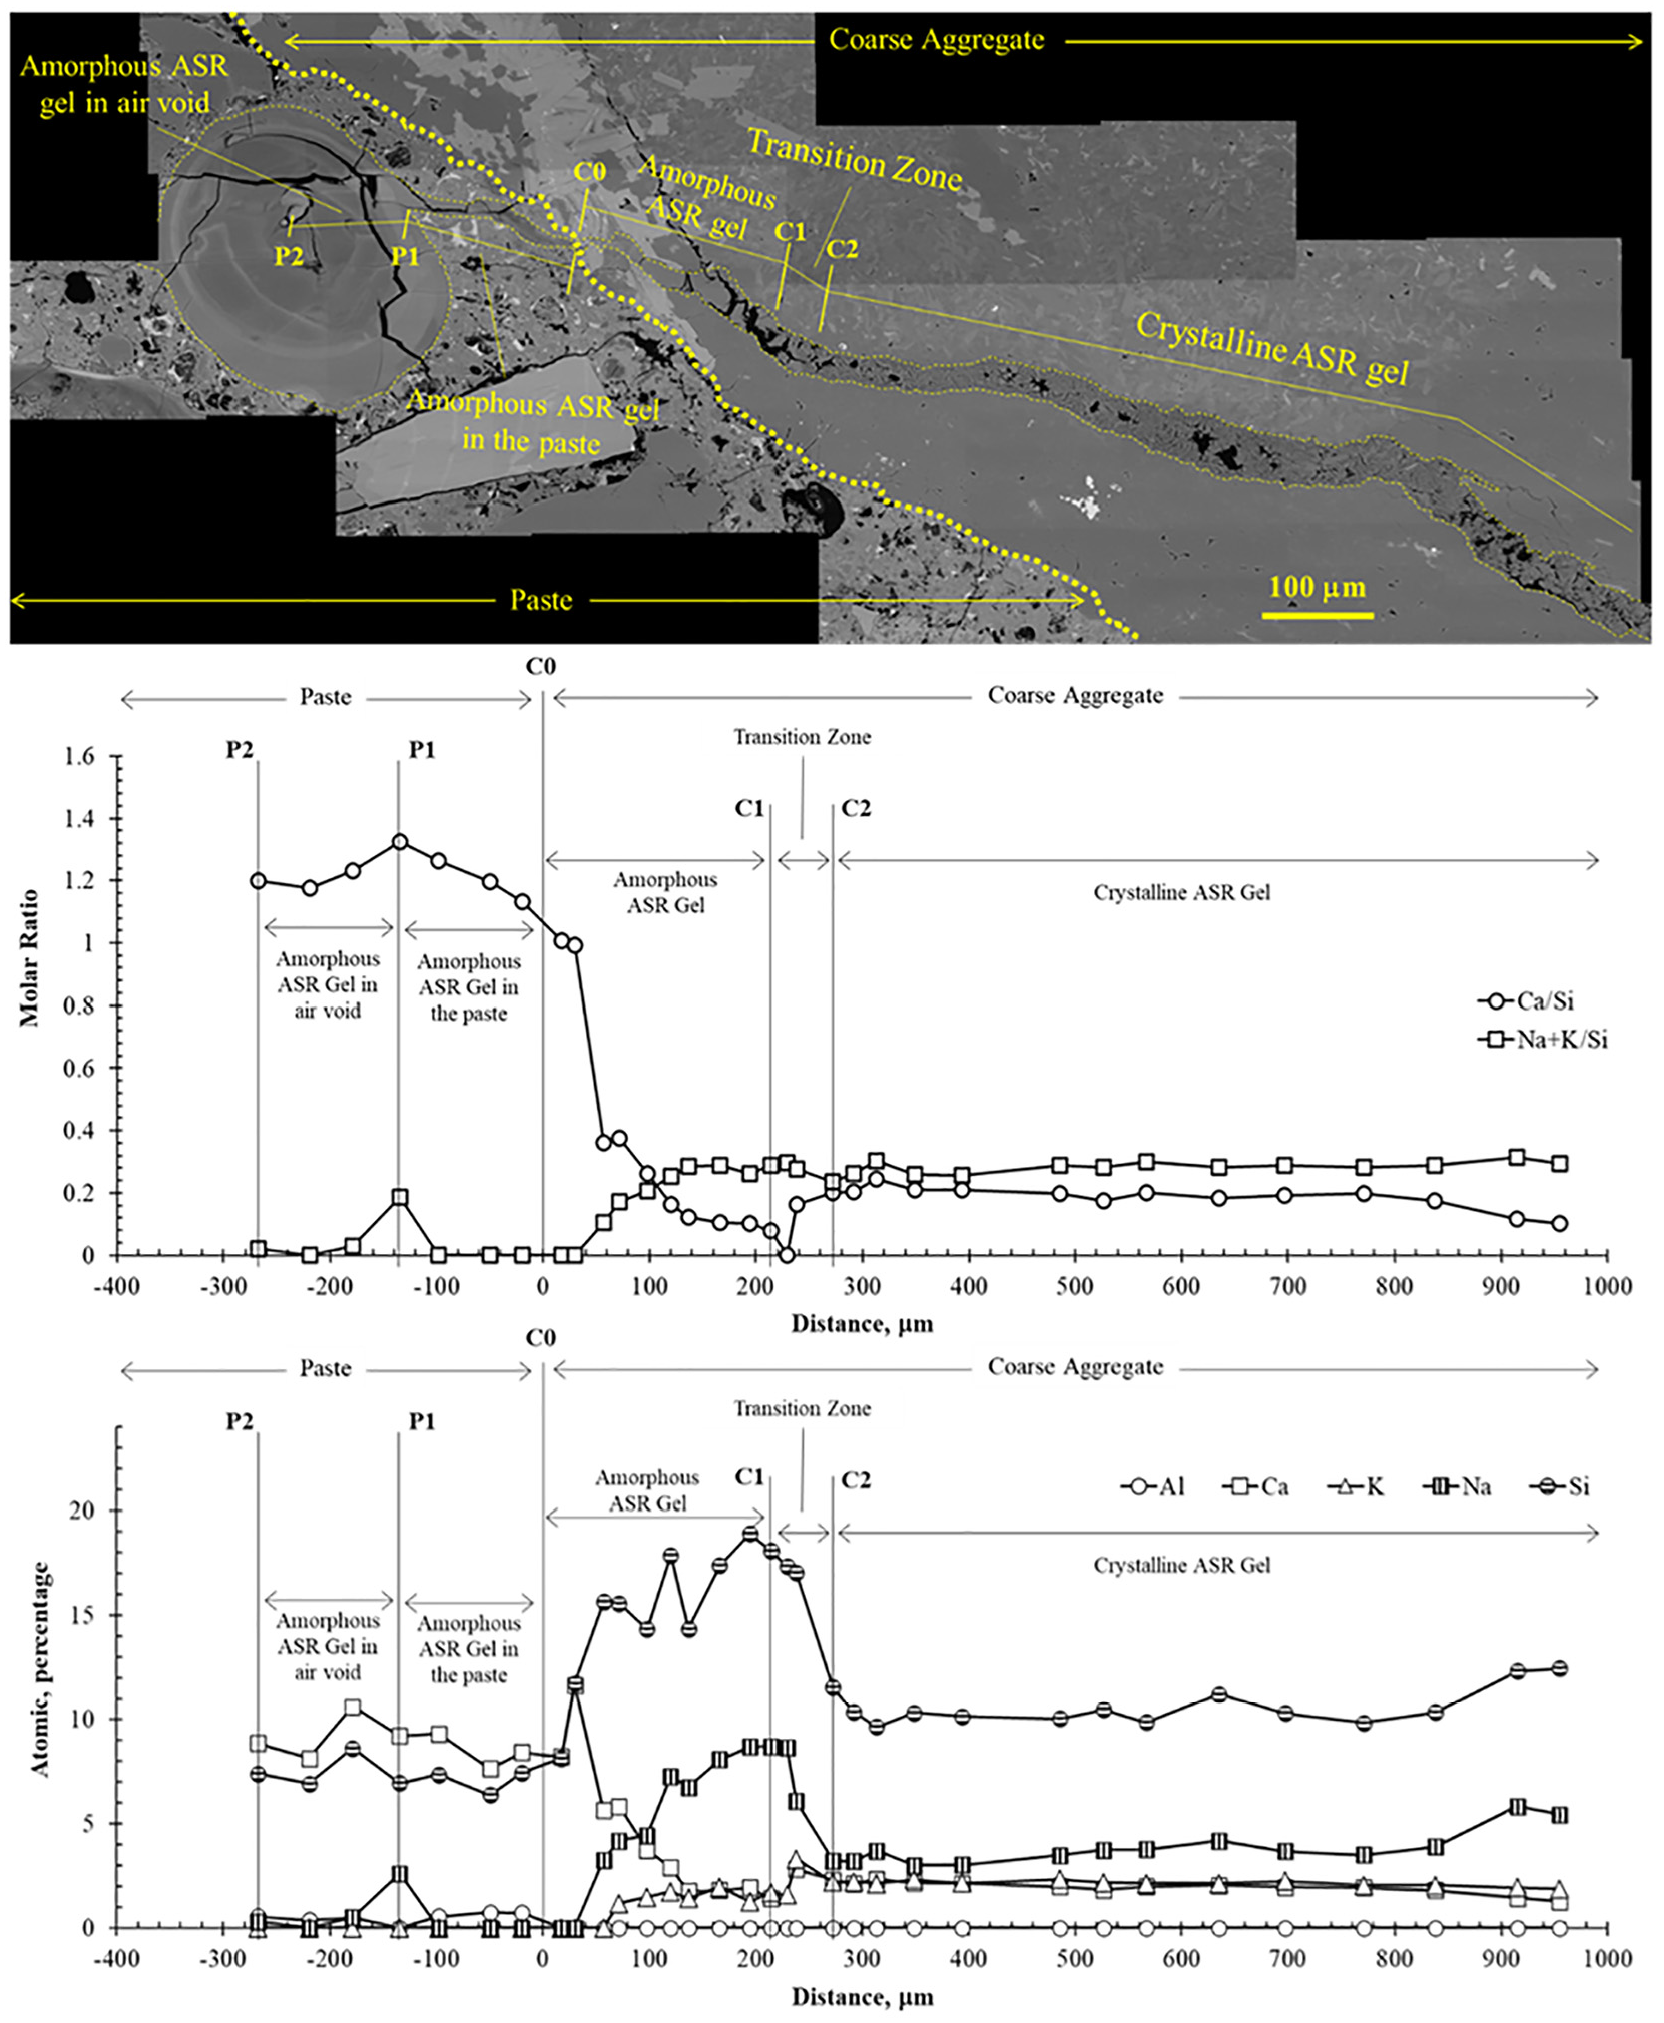
Large backscatter electron map with a crack in a rhyolite aggregate particle partially filled with amorphous and crystalline alkali–silica reaction (ASR) products and an adjacent air void in the paste filled with amorphous ASR products (top). Evolution of the chemical composition of the ASR products with respect to its position inside the air void or within the crack in the coarse aggregate expressed as a molar ratio (middle) and atomic percentage (bottom).
Chemical Composition of the ASR Gels
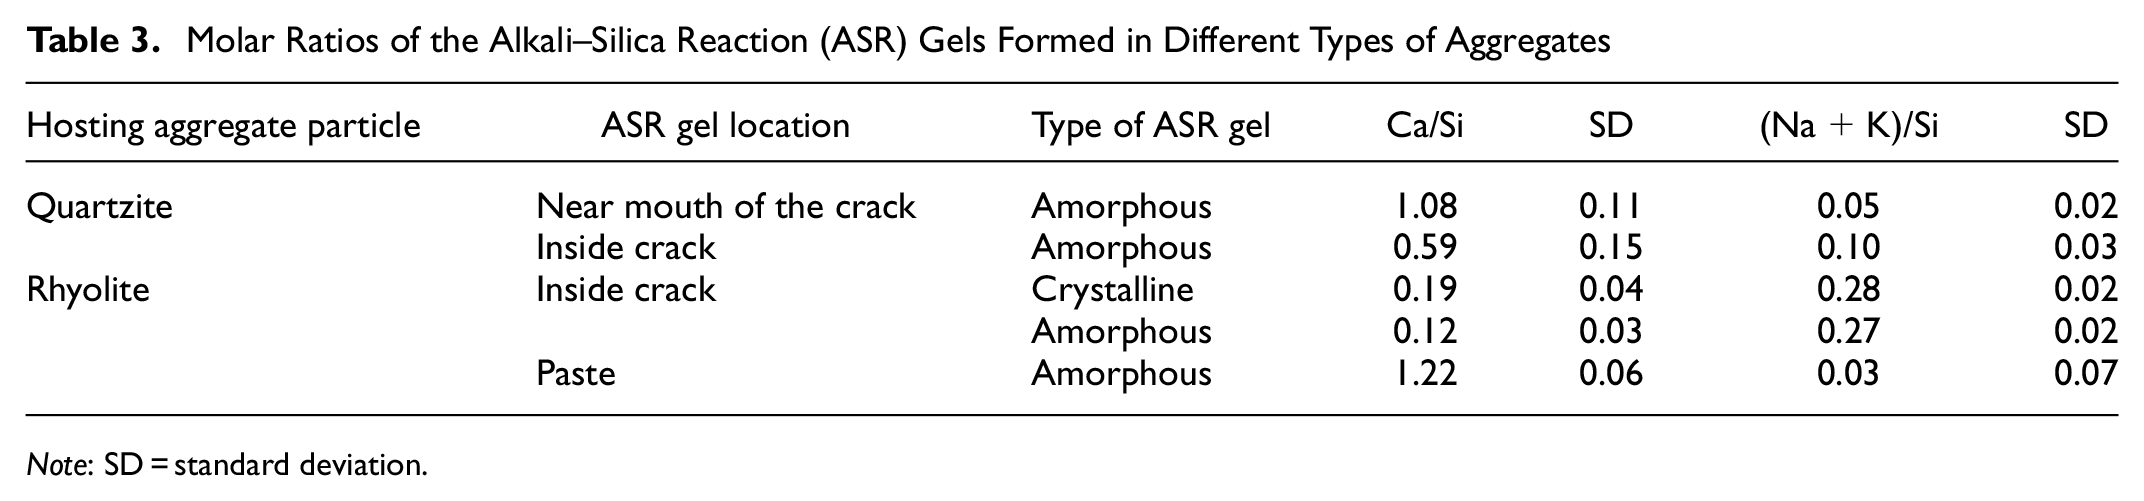
The EDS analysis of the different types of gels found in the field samples classified by type of aggregate and gel is summarized in Table 3. The ASR amorphous gels found in quartzite aggregate particles were different than their equivalent found in rhyolite aggregate particles. The former had a higher Ca/Si and lower (Na+K)/Si. This marked difference was not observed in crystalline versus amorphous gels growing in cracks of the same aggregate mineralogy. Only those ASR gels located near or in the paste had higher quantities of calcium and lower sodium and potassium contents, as reflected by their high Ca/Si and low (Na+K)/Si in comparison with their counterparts located inside the cracks. Other studies have also reported an increase in calcium content of ASR gels in areas of the microstructure that are more accessible to concrete pore solution (39, 54–56).
Molar Ratios of the Alkali–Silica Reaction (ASR) Gels Formed in Different Types of Aggregates
Note: SD = standard deviation.
Figure 4 shows the change in the chemical composition of the amorphous ASR gel as a function of its location inside the crack of the quartzite. The ASR located near the mouth of the crack (from C0 to the first 200 µm of the crack) has a high concentration of calcium, causing an increase in the Ca/Si molar ratio. The composition of the ASR gel stabilized at approximately 300 µm inside the crack.
Figure 5 shows the evolution in the chemical composition of the ASR gels as a function of their location in the rhyolite aggregate particle. The crystalline fraction of the ASR gel displayed a very homogenous composition along the crack. As the ASR gel transitioned from crystalline to amorphous (from the C2 to the C0 region in Figure 5), the sodium and silicon content increased. This change in silicon content was reflected in a decrease in the Ca/Si molar ratio. The increase in sodium content was attributed to the diffusion of this element from the pore solution, since the relatively smaller size of sodium ions in comparison to calcium ions allows the former to diffuse further through the ASR gel infilling the crack ( 57 ). The calcium content increased in the amorphous gel closer to the crack of the mouth (∼100 µm away from the cement paste). The diffusion of calcium into the ASR gel caused a release of sodium. The content of calcium remained high in those sections of the amorphous gel located in the paste and the air void (from the C0 to the P2 region in Figure 5).
Comparison of ASR Products from Other Field Structures
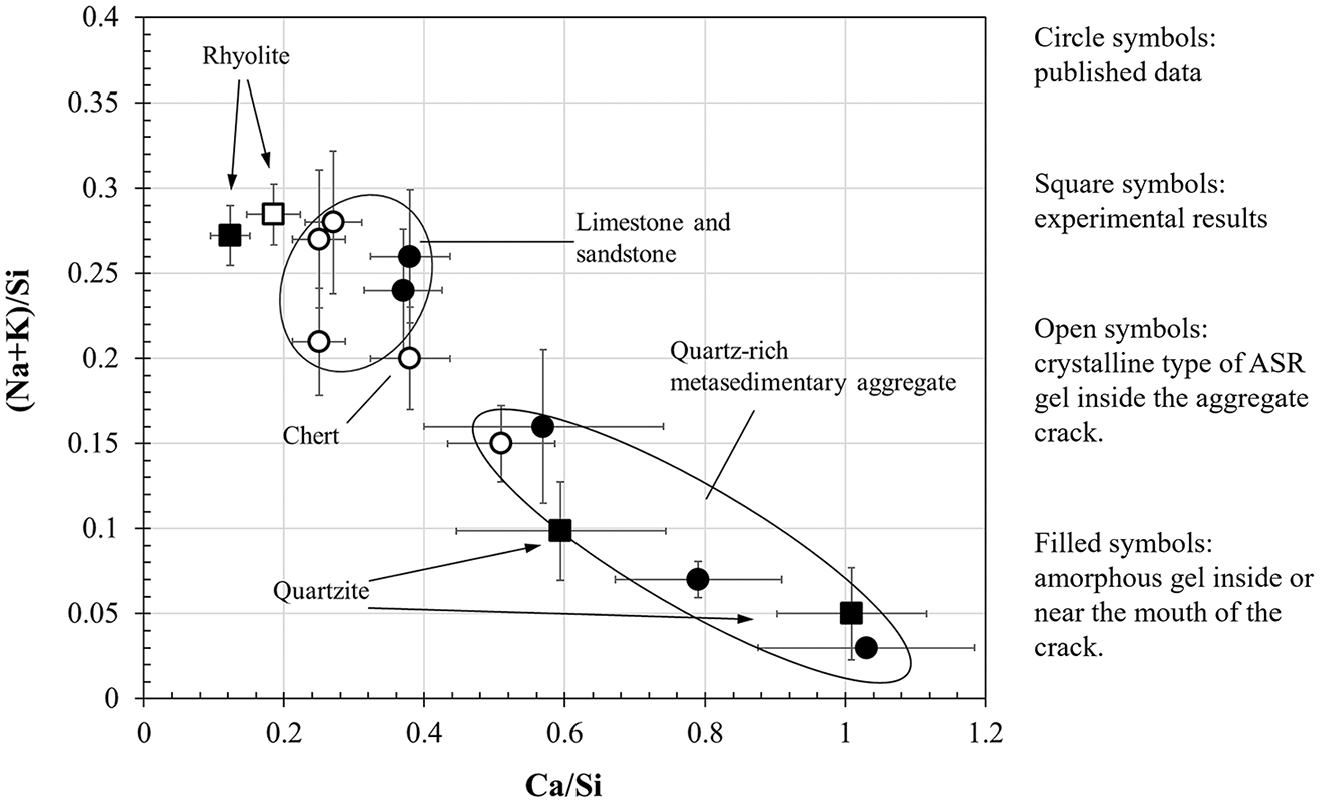
The chemical composition of the ASR products in Table 3 was compared with that of other ASR products measured in field samples. Even though several publications have reported the composition of ASR products in field samples, only data from studies reporting the mineralogy of the hosting aggregate and morphology of the ASR product were used in the comparison ( 13 , 16 , 22 , 31 ). It is important to acknowledge that, for the data reported from the published literature, information with respect to the location of the ASR gel within a crack was not available. As a result, it is possible that some of the data may include gel compositions that have higher calcium contents caused by proximity to the paste. The graph in Figure 6 reveals a difference in the molar ratios between ASR products formed inside carbonate aggregates (limestone and sandstones) and those formed inside quartz-rich aggregates. The ASR products found in the latter had lower (Na+K)/Si and higher Ca/Si molar ratios than the gels inside carbonate aggregates. In this study, the ASR products formed within the rhyolite aggregate particles aligned closely with ASR products found inside limestone and sandstone aggregate particles in other studies. On the other hand, the chemical composition of the ASR products found in quartzite aggregate particles aligned with those of ASR gels reported in quartz-rich aggregates in other studies. Lastly, when comparing gels formed within the same aggregate particle, the chemical composition did not appear have a profound effect on the morphology of the ASR gels since both the crystalline and amorphous gels had similar (Na+K)/Si and Ca/Si molar ratios.
Conclusions
Both T-FAST and ATT results highlighted the alkali–silica reactivity of the coarse and fine aggregates used in the construction of the 63-year-old bridge. These results aligned with petrographic information published on the aggregate resources in Alaska. The alkali–silica reactivity of these gravels of alluvial origin matched with reactivity reported on gravels from other U.S. regions.
The low ATMx of 2.6 lb Na2Oeq/yd3 (1.5 kg Na2Oeq/m3) measured in both aggregates combined in similar proportion as the concrete used in the construction of the bridge was largely on account of the high alkali–silica reactivity of the coarse aggregate, with an ATAg of 2.5 lb Na2Oeq/yd3 (1.5 kg Na2Oeq/m3). The risk-assessment chart predicted that long-term development of an ASR would occur in the bridge even if a low-alkali cement (0.57% Na2Oeq), as assumed in this study, was used in the original concrete mixture design. This prediction aligned with the results of the SEM analysis performed on the field samples.
The SEM analysis of the field samples revealed the presence of ASR signs, mainly cracks in coarse and fine aggregates partially filled with ASR products. Two types of cracks with ASR products were found in the SEM microstructural analysis: cracks in quartzite and rhyolite aggregate particles. The predominant type of crack was found in the quartzite particles, with an average crack width of 2–4 µm and partially infilled with pockets of amorphous ASR gel. The second type of crack found in the rhyolite particles was not as common and had an average 15-40 µm width. Two different types of gels, one amorphous and the other crystalline, were found infilling this type of crack. The chemical analysis of the ASR products found in these two types of cracks in the aggregates revealed that mineral phases adjacent to the crack, other than the alkali–silica reactive ones, often influenced the chemical composition of infilling gels. The ASR gels found inside quartzite particles had higher Ca/Si and lower (Na+K)/Si values than their counterparts formed in rhyolite particles. The elemental analysis of the ASR products in the cracks showed an increase in calcium in areas of the cracks close to the paste. No significant differences in the chemical composition were found between crystalline and amorphous ASR gels located in the same aggregate.
In summary, ASR products were found in the bridge concrete’s microstructure but in small amounts. The low average annual temperatures and long winter seasons of the bridge location’s climate slowed down the ASR and did not cause a premature failure of the structure.
Footnotes
Acknowledgements
The authors would like to thank Freweini Zerai and Tsegaye Mirach for their technical assistance, and Jeff Currey for his help procuring the field samples. This support is gratefully acknowledged.
Author Contributions
The authors confirm contribution to the paper as follows: study conception and design: J. F. Muñoz, C. Balachandran, R. S. Giessel; data collection: J. F. Muñoz, C. Balachandran; analysis and interpretation of results: J. F. Muñoz, C. Balachandran, A. Shastry; draft manuscript preparation: J. F. Muñoz, C. Balachandran, R. S. Giessel. All authors reviewed the results and approved the final version of the manuscript.
Declaration of Conflicting Interests
The author(s) declared no potential conflicts of interest with respect to the research, authorship, and/or publication of this article.
Funding
The author(s) disclosed receipt of the following financial support for the research, authorship, and/or publication of this article: The research that is the subject of this document was funded by the U.S. FHWA (Contract No. 693JJ323D000008).
Data Accessibility Statement
Some or all data generated or used during the study are available from the corresponding author on request.