
Abstract
In this study, an experimental scheme is developed to visualize asphalt binder absorption within aggregate pores using scanning electron microscopy. A suitable sample preparation approach, image magnification levels, and image processing techniques are utilized for the visualization of the aggregate pores (pore structure and binder occupancy) before and after adding asphalt binder. Three types of aggregate—gneiss, quartzite, and sandstone—are used in this study. The results indicate that sandstone exhibits maximum binder absorption, followed by gneiss, and then quartzite. Sandstone also shows the highest pore occupancy, indicating that a higher pore area enables more binder absorption. Further, the study highlights a progressive decrease in the absorption level as one moves from the aggregate boundary toward its interior.
Aggregates contain numerous pores through which asphalt binder enters at the time of preparation of an asphalt mix ( 1 – 4 ). The fraction of asphalt binder that goes inside the aggregates is called “absorbed binder.” Since the absorbed binder stays inside the aggregates, its participation in mechanical performance of the asphalt mix could be restricted ( 4 – 7 ). On the other hand, it is hypothesized that absorbed binder has a role in holding the binder around the aggregates, which is called an “effective binder” ( 2 ). The presence of effective binder influences the mechanical performance of the asphalt mix.
The pores present in aggregates are of irregular shape and size, distributed all over the aggregate, as shown schematically in Figure 1. Depending on the size of the pore openings, the pores are generally classified as macropores (>50 nm), mesopores (2–50 nm), and micropores (<2 nm) ( 8 ). The pores having openings at the aggregate surface can be called “open pores” which facilitate the asphalt binder absorption, while the isolated pores with no opening for asphalt binder to get absorbed can be called “closed pores” (see Figure 1). The pores which are connected to each other can be called “connected pores” (see Figure 1). The extent of asphalt binder absorption is expected to be higher for aggregates having more open and connected pores.
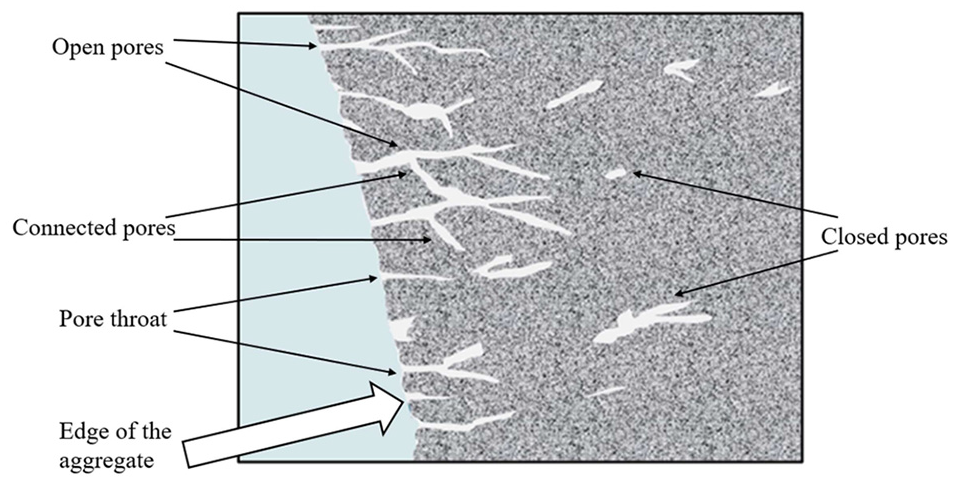
Visualization of pores within an aggregate.
The “pore structure” of aggregates is a general term used to characterize pore size distribution and pore morphology ( 9 ). Various techniques are used to characterize the pore structure of aggregates ( 10 ). Some of the quantitative techniques are mercury intrusion porosimeter and micro-computed tomography ( 4 , 11 – 14 ). Some of the qualitative techniques involve microscopic observations, for example, optical microscopy and scanning electron microscopy (SEM) ( 15 – 17 ).
In the area of asphalt mix design, estimation of asphalt binder absorption is generally performed using volumetric techniques. Although the volumetric method quantifies the amount of asphalt binder absorbed, it does not reveal how the asphalt binder is distributed, in a microscopic sense, within the aggregates. Researchers have hypothesized, using results from mercury intrusion porosimeter in conjunction with volumetric studies, that the minimum diameter that participates in asphalt absorption is about 0.05 μm ( 1 , 4 ). Limited literature is available that uses microscopic techniques to identify and quantify absorption of asphalt binder into aggregates. In one study, optical microscopy was used on diamond saw-cut samples ( 18 ). However, considerable literature is available in other areas of science, for example, absorption of petroleum into rocks, salt into cement paste, chloride into reinforcement in concrete, alkali-silica reaction gel into pores of concrete, and so on ( 19 – 24 ).
In this work, an effort has been made to develop an experimental scheme to be able to microscopically visualize and quantify binder absorption into aggregates. After a few trials, thin aggregate sections are adopted as sample, and the use of SEM with energy dispersive X-ray (EDX) spectroscopy are finalized to visualize the pore structure of the aggregates and asphalt binder absorption. The objective of this study is to develop a suitable image processing and analysis scheme:
1) To microscopically visualize the pore structure of the aggregates and estimate the porosity values before adding asphalt binder. This is done by using the SEM images.
2) To microscopically visualize the asphalt binder absorption in these aggregates after adding asphalt binder, and estimate the asphalt binder absorption with respect to total pores present. This is done by using the SEM images in conjunction with EDX spectroscopy.
3) To microscopically visualize the variation of binder absorption as one moves from the boundary of the aggregate toward its interior.
Materials and Sample Preparation
As mentioned in the last section, it is decided to perform imaging study using SEM on the cross-section of aggregates to observe 1) the pore structure of the aggregates, before adding asphalt binder and 2) the binder occupancy in the pores after adding asphalt binder. For the latter case, aggregates are mixed with asphalt binder at elevated temperature. For this, 4.5% asphalt binder (with respect to the total weight of the mix) is mixed with the aggregates at 165°C for 5 min. The details of material collection, aggregate classification, and sample preparation are presented in the following.
Material Collection
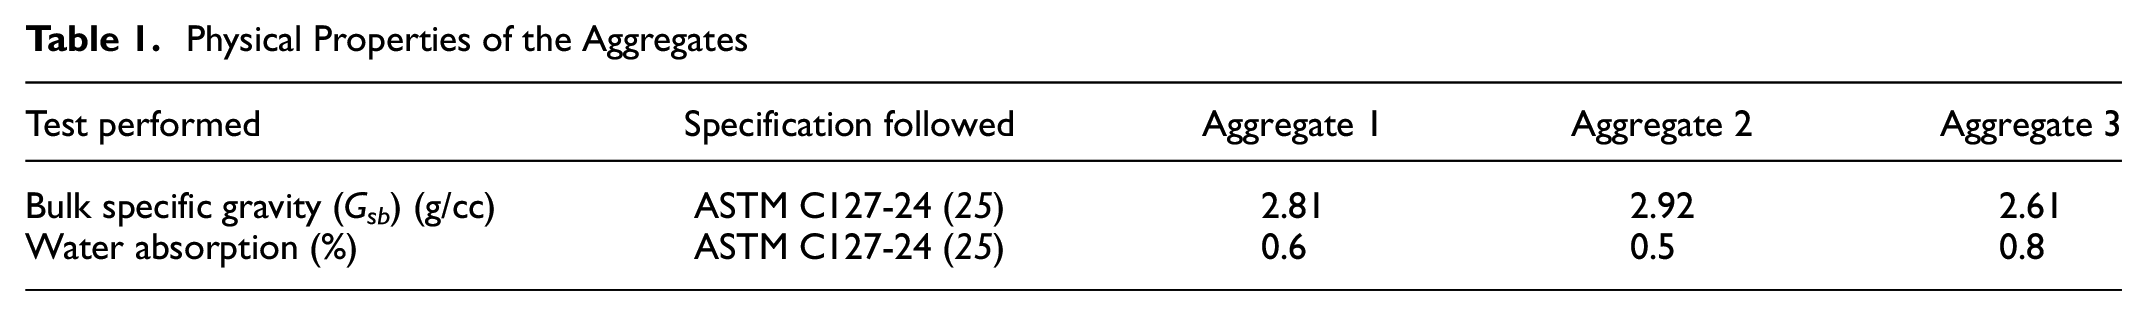
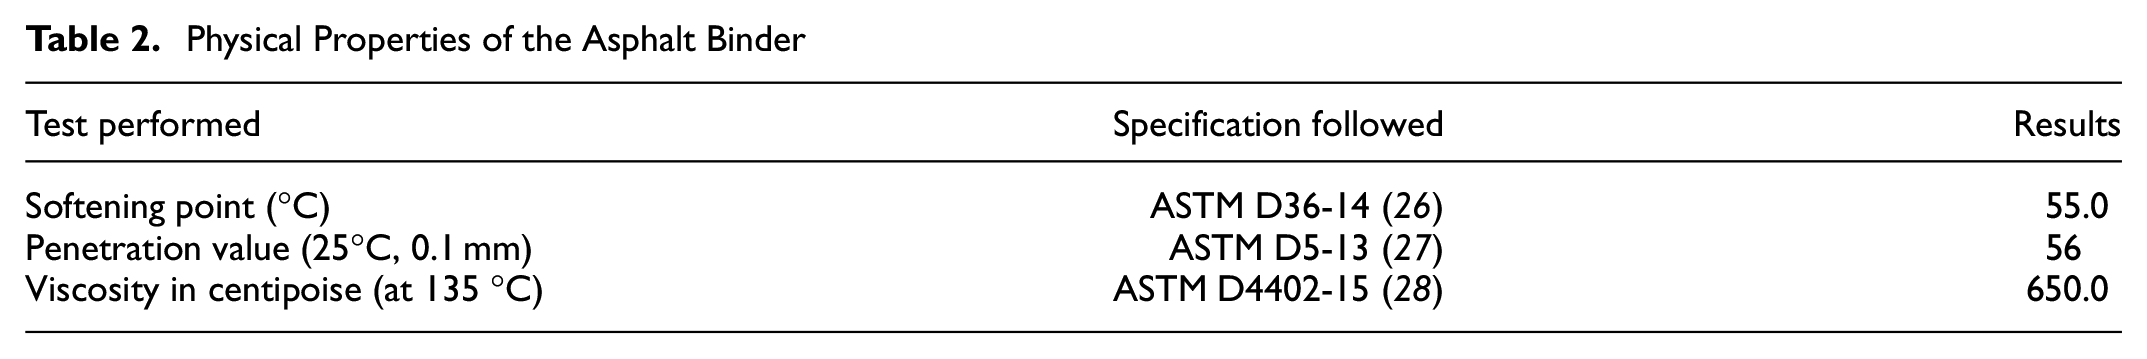
Three different types of aggregate are taken, and before classification of these into the specific types, these aggregates are named Aggregate 1, Aggregate 2, and Aggregate 3 (as shown in Figure 2). All the aggregates are within the size range of 19 mm passing and 13.2 mm retained. VG-30 grade asphalt binder, as per Indian specification, is used. The physical properties of the aggregates and asphalt binder are presented in Tables 1 and 2, respectively.
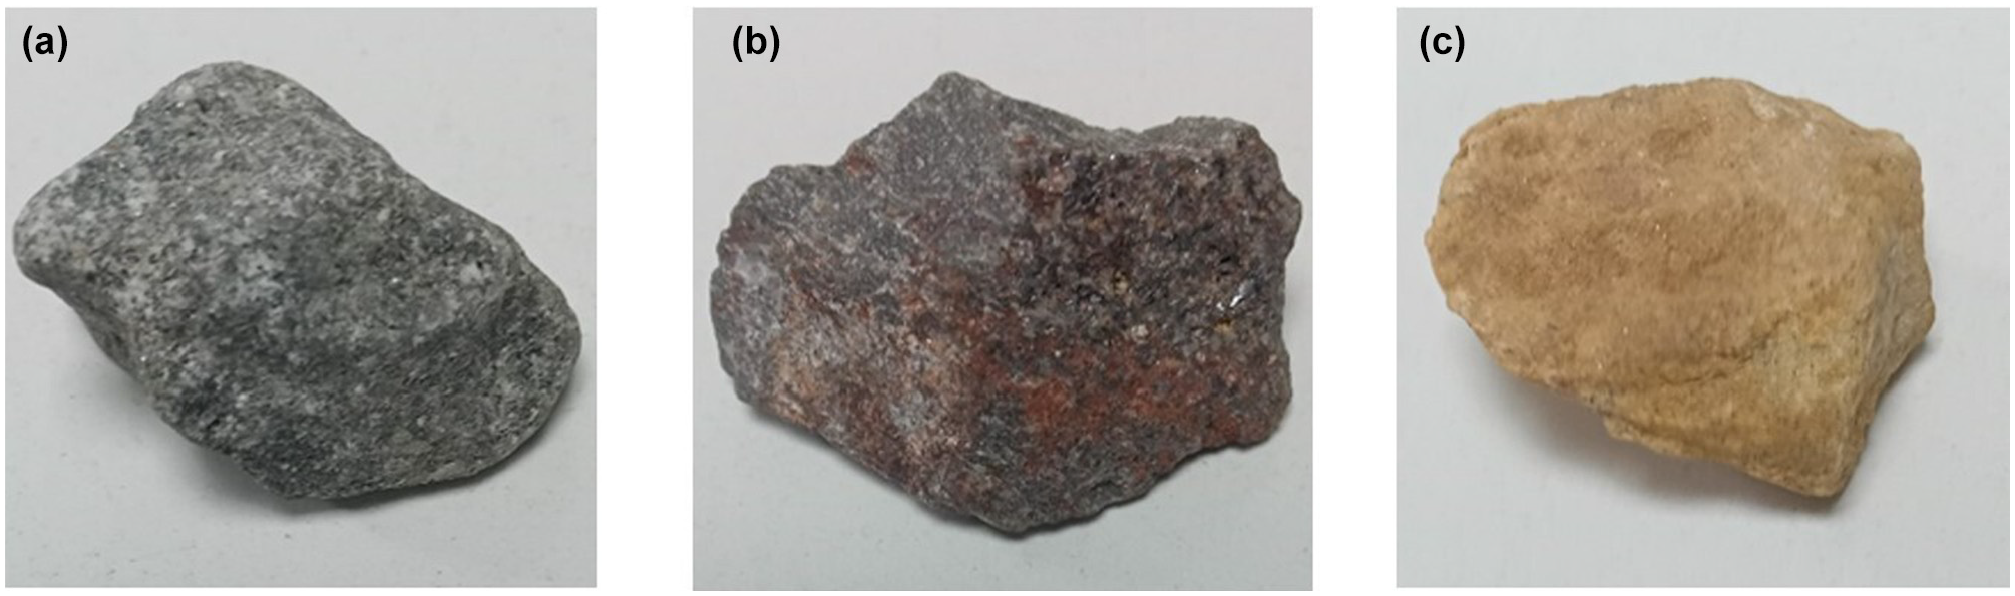
The three types of aggregate used: (a) Aggregate 1, (b) Aggregate 2, and (c) Aggregate 3.
Physical Properties of the Aggregates
Physical Properties of the Asphalt Binder
Aggregate Classification
The basic classification of aggregates (generally called “rock classification”) is performed using a magnifying lens with an image-capturing facility. These images (for Aggregates 1, 2, and 3) are presented as Figures 3, 4, and 5, respectively. From Figure 3, bands of white and black colors are found, where white color indicates presence of quartz and black color indicates feldspar, which contains minerals rich in iron or magnesium—this is characteristic of gneiss which evolves because of metamorphism of granite rock ( 29 ). Thus, Aggregate 1 is classified as “gneiss.” In Figure 4, a crystalline texture is found. Thus, Aggregate 2 may be classified as “quartzite”—a metamorphic rock arising out of metamorphism of sandstone ( 30 ). In Figure 6, granular texture of relatively larger size is found. Thus, Aggregate 3 (Figure 5) may be classified as “sandstone”—a kind of sedimentary rock ( 31 , 32 ).
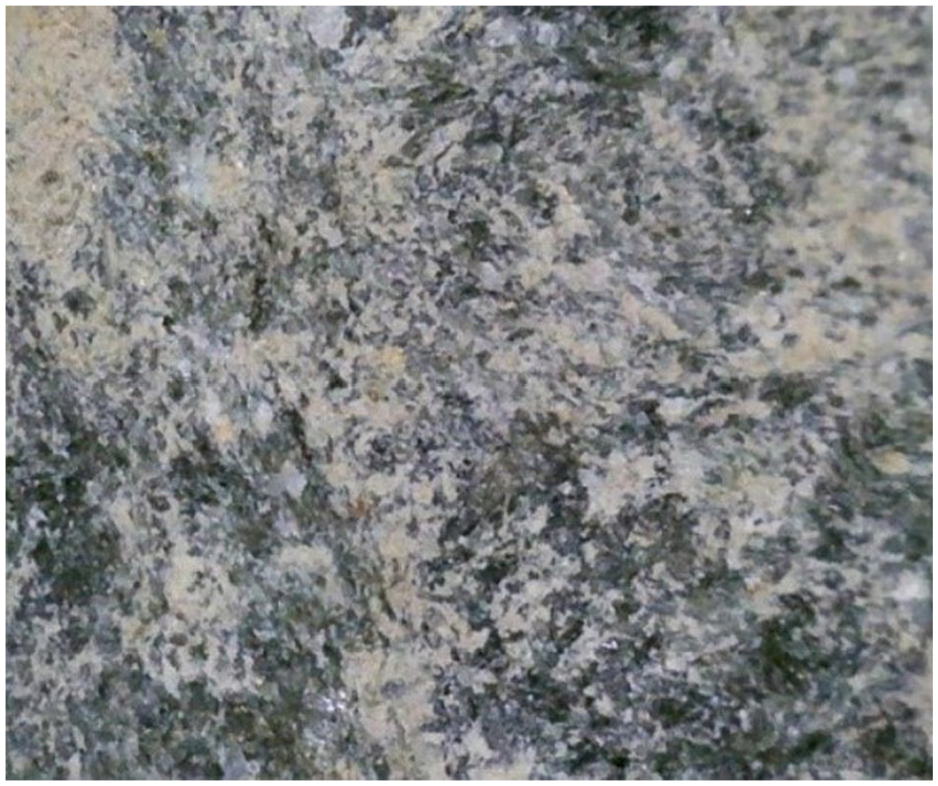
Gneiss aggregate.
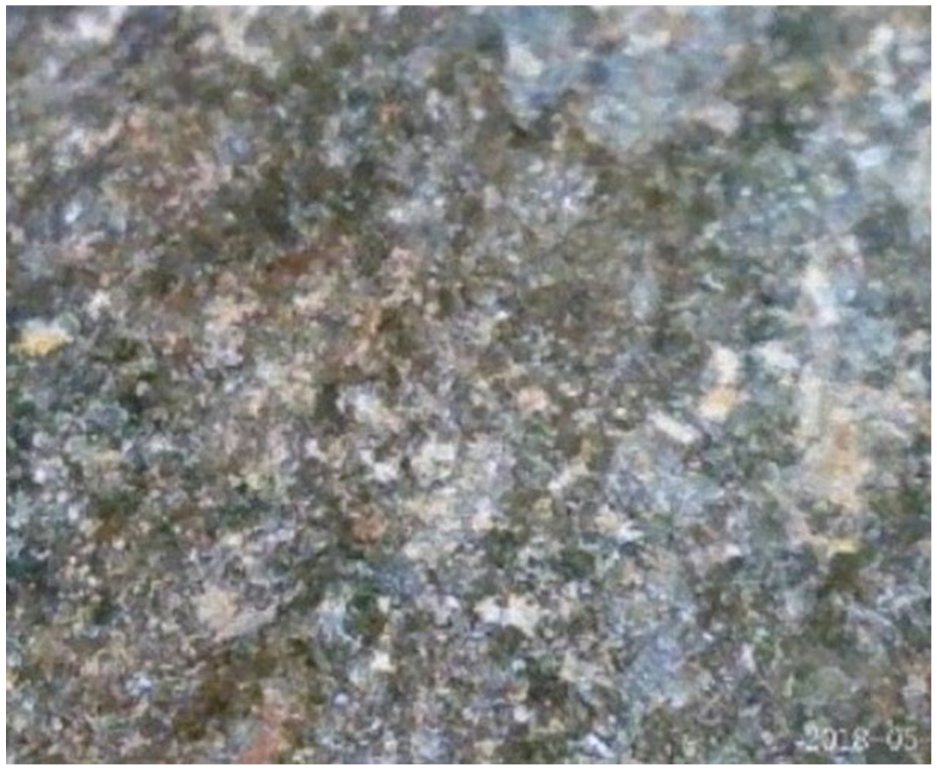
Quartzite aggregate.
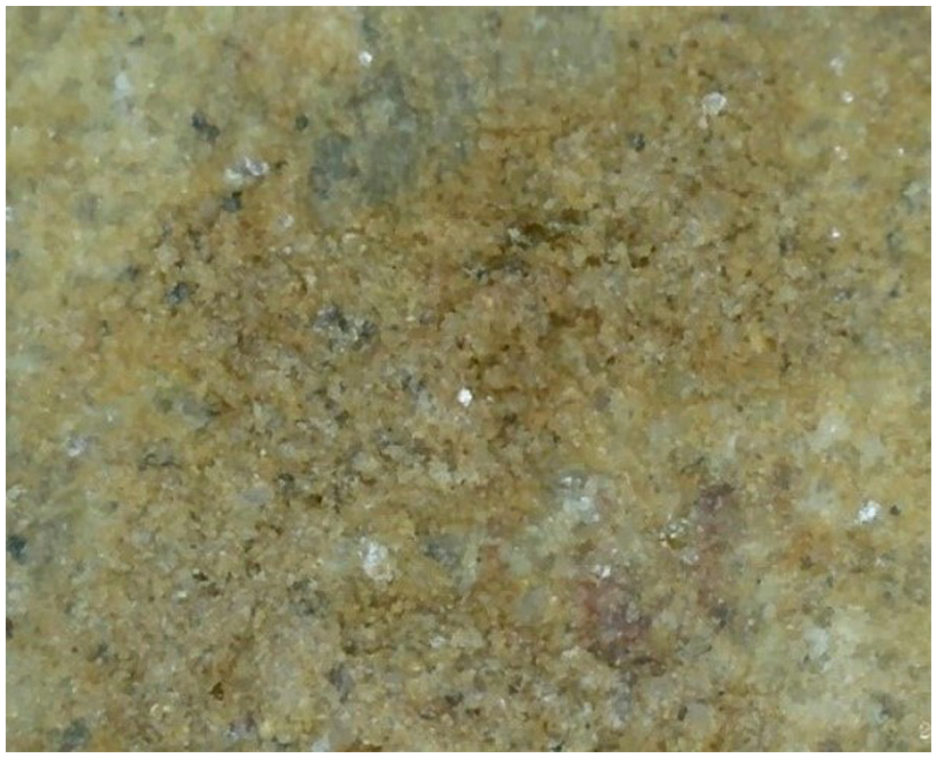
Sandstone aggregate.
Sample Preparation for SEM Study
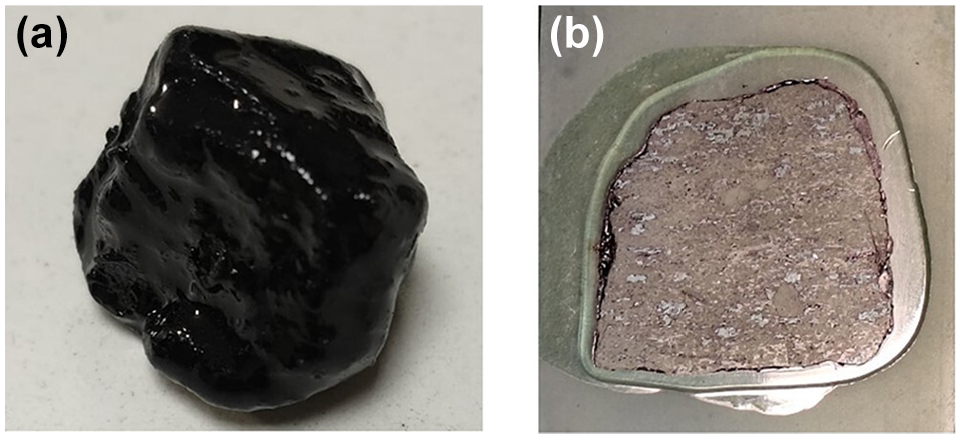
Single aggregate pieces are used for sample preparation for the SEM tests, both for aggregates with and without asphalt binder. Thin sections having a cross-section of approximately 20 × 20 mm and a thickness of 30 µm are developed on glass slides by ultramicrotomy. For this, a service provided by an external agency outside the university is utilized. Ultramicrotomy is conducted under cryogenic condition. Cryogenic condition is used to control the rise in temperature during cutting, and is also helpful for avoiding possible smudging of asphalt binder as a result of temperature rise. Representative photos of an aggregate and a thin section of an aggregate are shown in Figure 6a and b , respectively (i.e., without asphalt binder). Likewise, representative photos of an aggregate covered with binder and a thin section of such an aggregate are shown in Figure 7a and b , respectively (i.e., with asphalt binder).
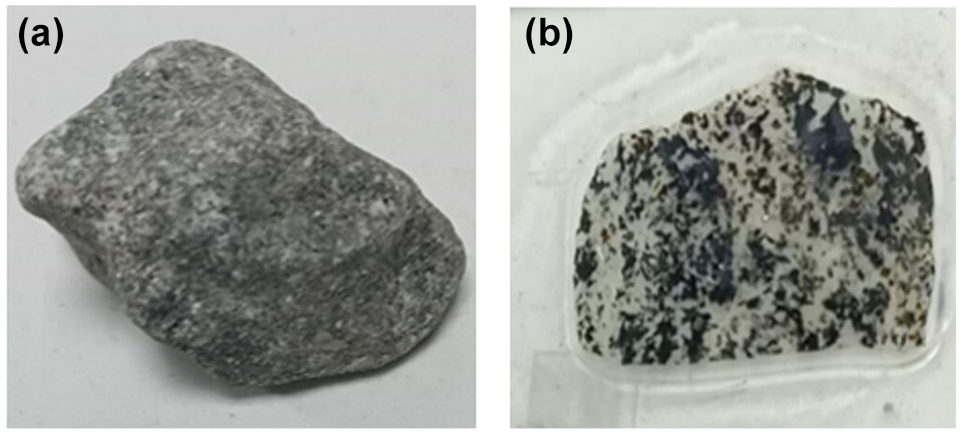
Preparation of thin section of aggregate without asphalt binder: (a) aggregate and (b) thin section of aggregate pasted on glass slide, obtained by using ultramicrotome.
Preparation of thin section of aggregate with asphalt binder: (a) aggregate with asphalt binder and (b) thin section of aggregate pasted on glass slide, obtained by using ultramicrotome.
Experimental Studies
Aggregate is a non-conductive material. Thus, a gold coating of 10 nm is applied (for the purpose of SEM imaging) on the thin section for the aggregates both with and without asphalt binder using a sputtering unit, as shown in Figure 8. The backscattered electron imaging mode is adopted, which is expected to provide a difference in contrast between the grains and free space (i.e., pores). Ten different locations (identified as Location 1, 2, and so on) are chosen for data collection, as schematically shown in Figure 9, for each type of aggregate sample, both with and without asphalt binder. These locations are chosen near the edge, so that the boundary of the aggregate can be identified. Further, to study the variation of binder absorption, as one moves from the boundary of the aggregate toward its interior, two locations are arbitrarily chosen, and the corresponding points are identified as Point A, B, C, and so forth. Further details on the experiments performed are discussed in the following.
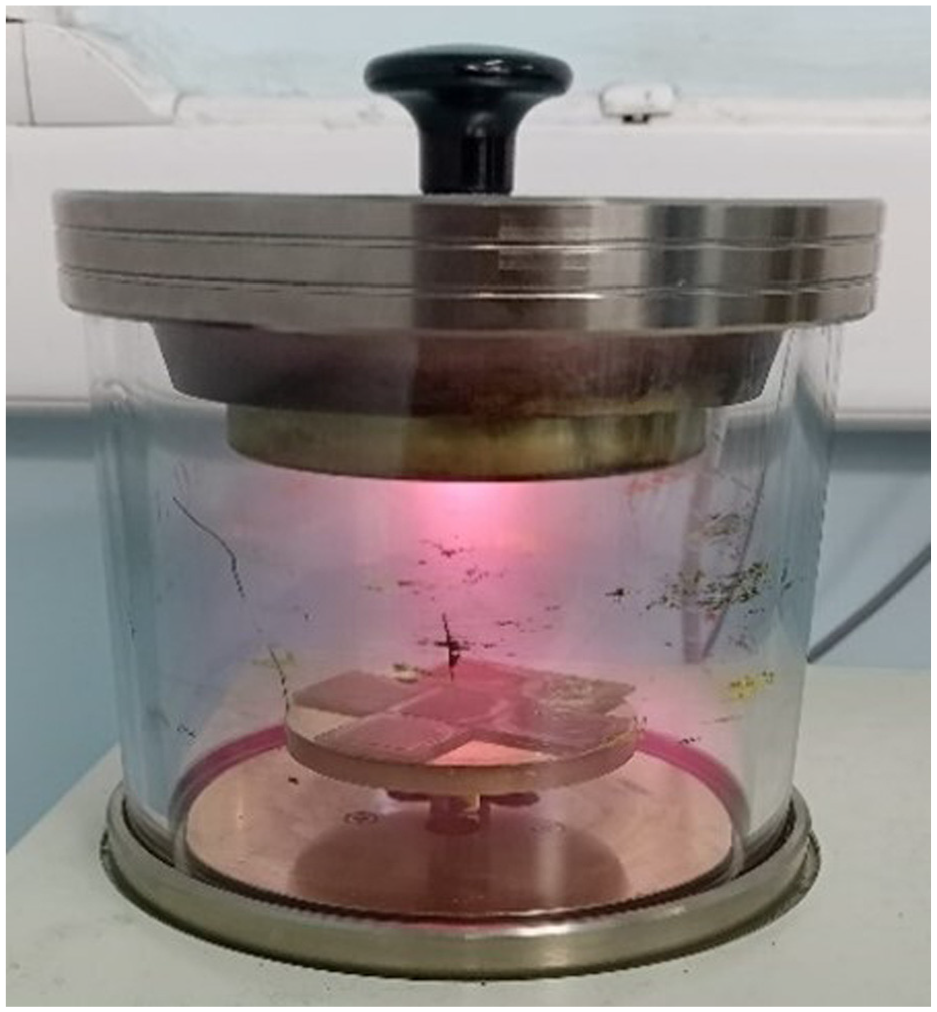
Gold coating of samples in sputtering unit.
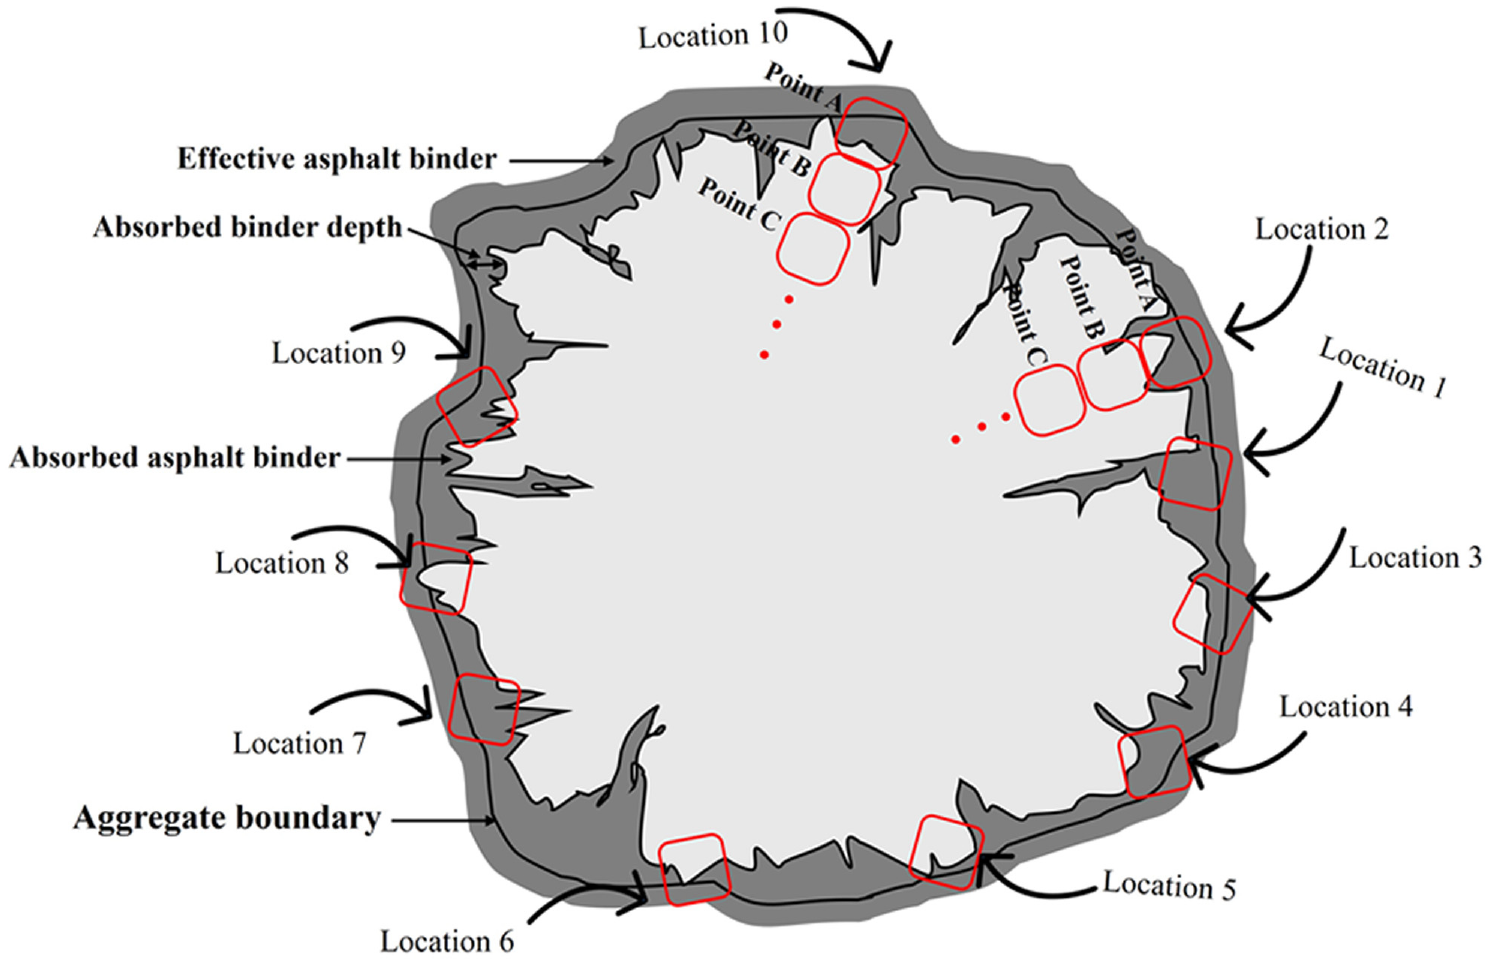
Schematic diagram explaining the probe locations.
Aggregates without Asphalt Binder
For aggregate samples without asphalt binder, images are taken at 10 different locations (see Figure 9) with three different magnification levels (i.e., 1,000
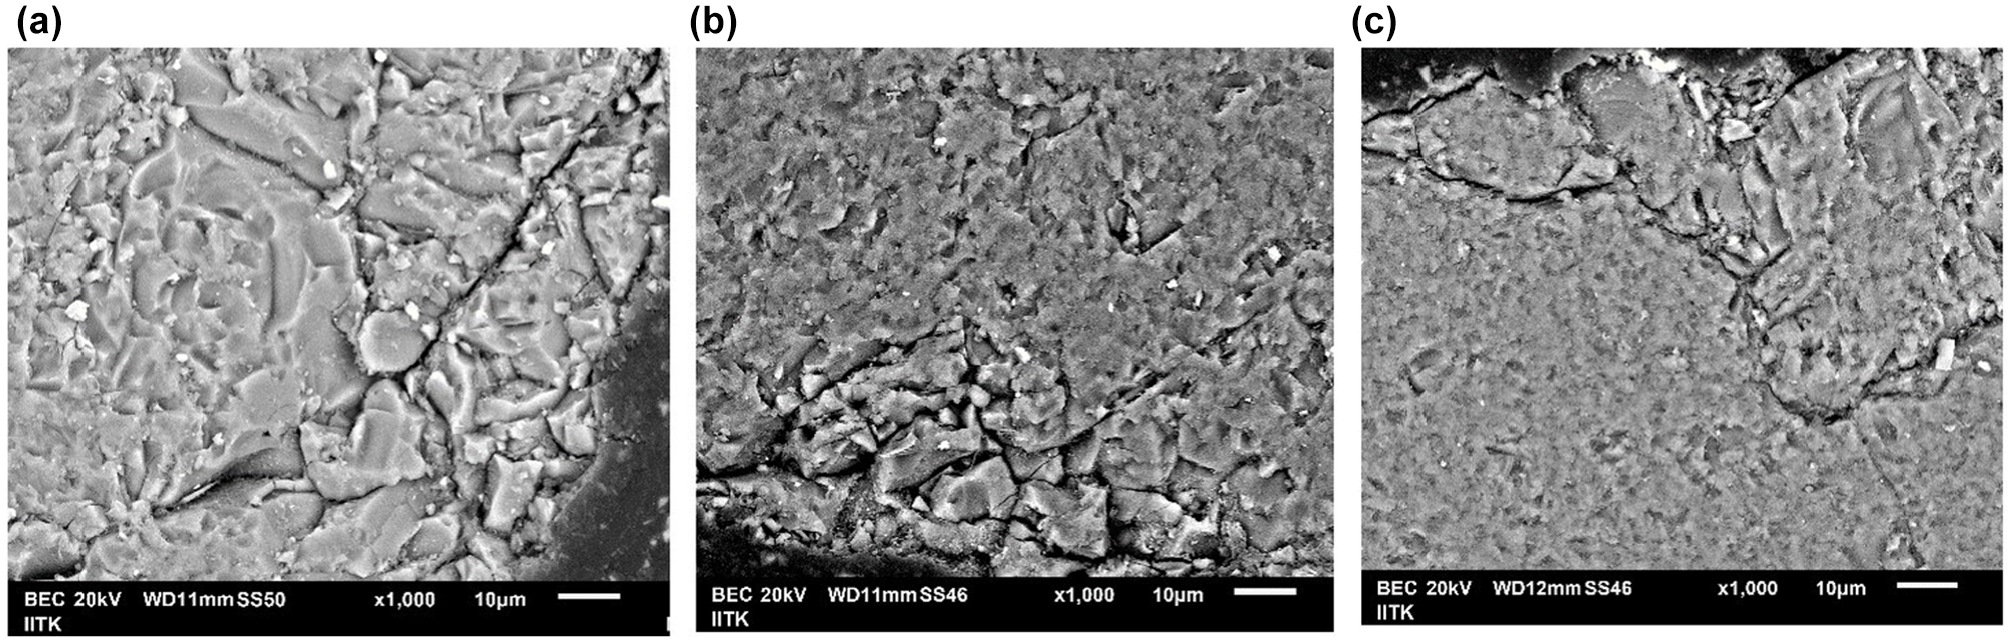
Sample scanning electron microscopy images of three aggregates without asphalt binder at 1,000
Aggregates with Asphalt Binder
For aggregates with asphalt binder, images are taken at 10 different locations (see Figure 9) with two magnification levels (i.e., 1,000× and 2,500×) for each of the three types of aggregate. As mentioned earlier, images are taken in such a way that the edge of the aggregate is visible. Binder enters through these open pores (see Figure 1) located at the edges.
On the backscattered SEM images, EDX spectroscopy mapping is performed to obtain the elemental composition of the samples. The silicon and carbon elements are chosen as markers for aggregate grains and asphalt binder, respectively. Thus, EDX spectroscopy mapping helps in visualizing the absorption of asphalt binder within the pores of the aggregates. It is found that EDX spectroscopy mapping at magnification level 2,500× does not clearly identify the absorption of binder, possibly because of the lack of identifying pixel-types within the smaller scan areas captured. Thus, images with magnification level of 2,500× are discarded in further analysis. Thus, a total of 10 images per sample are taken for image analysis. Figures 11, 12, and 13 indicate the sample backscattered images of the aggregate and their elemental distribution through EDX spectroscopy mapping (at 1,000× magnification), for gneiss, quartzite, and sandstone, respectively.
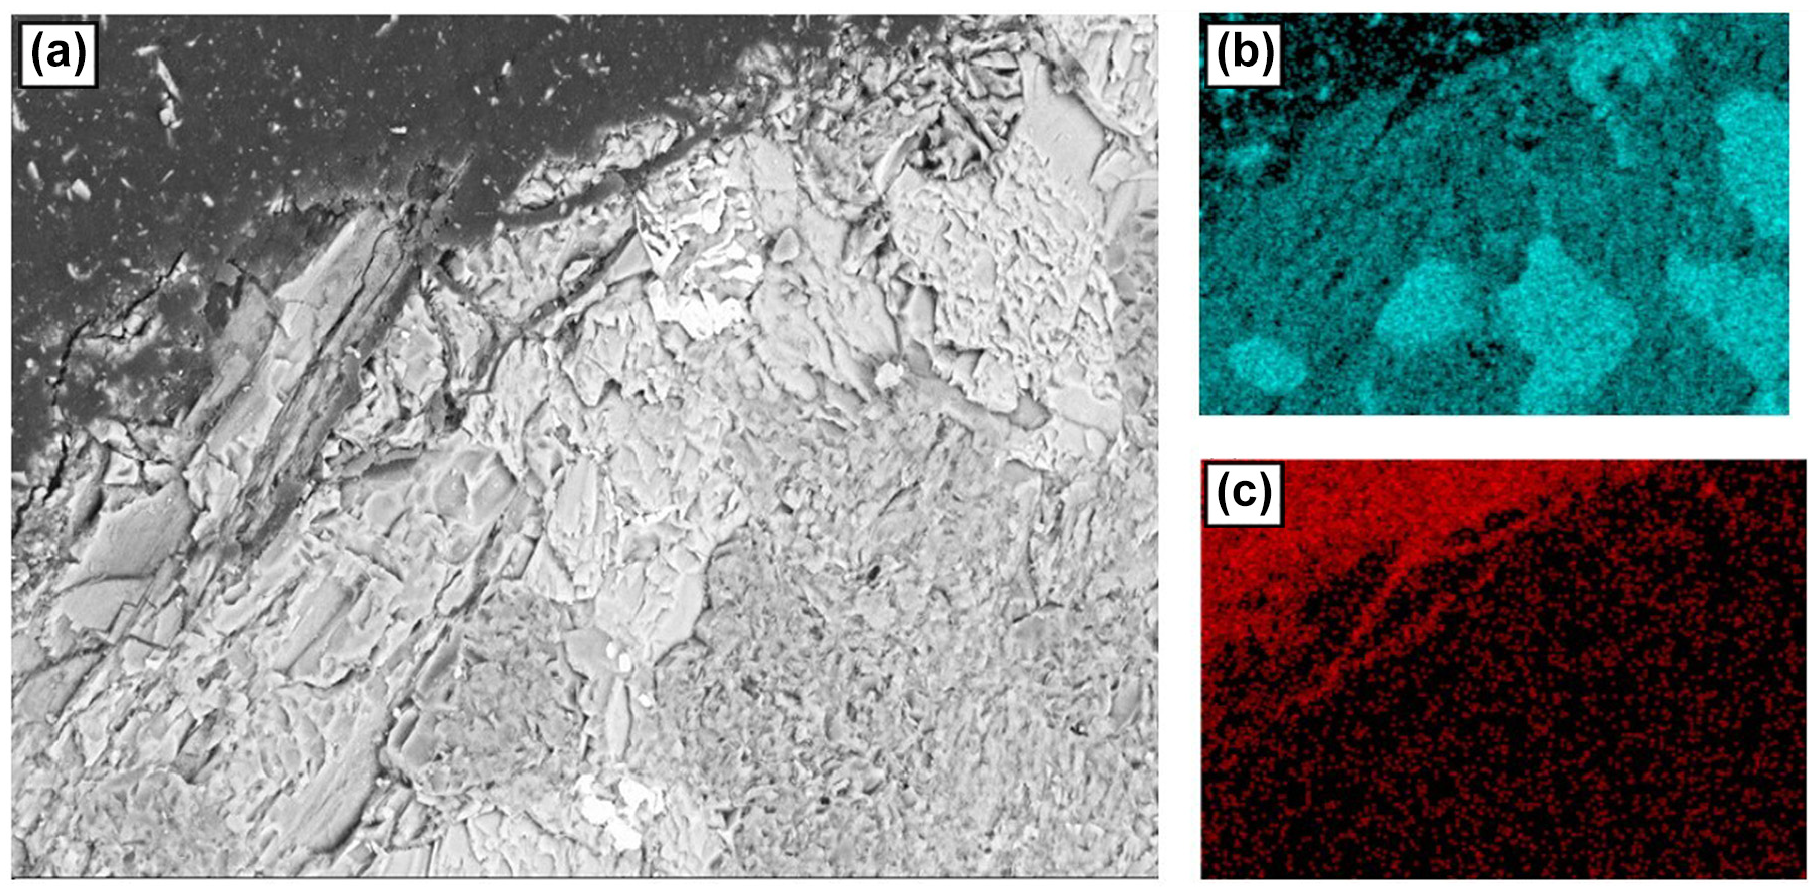
Asphalt binder absorption behavior in gneiss aggregate: (a) backscattered image of gneiss covered with asphalt binder, (b) silicon element distribution, and (c) carbon element distribution.
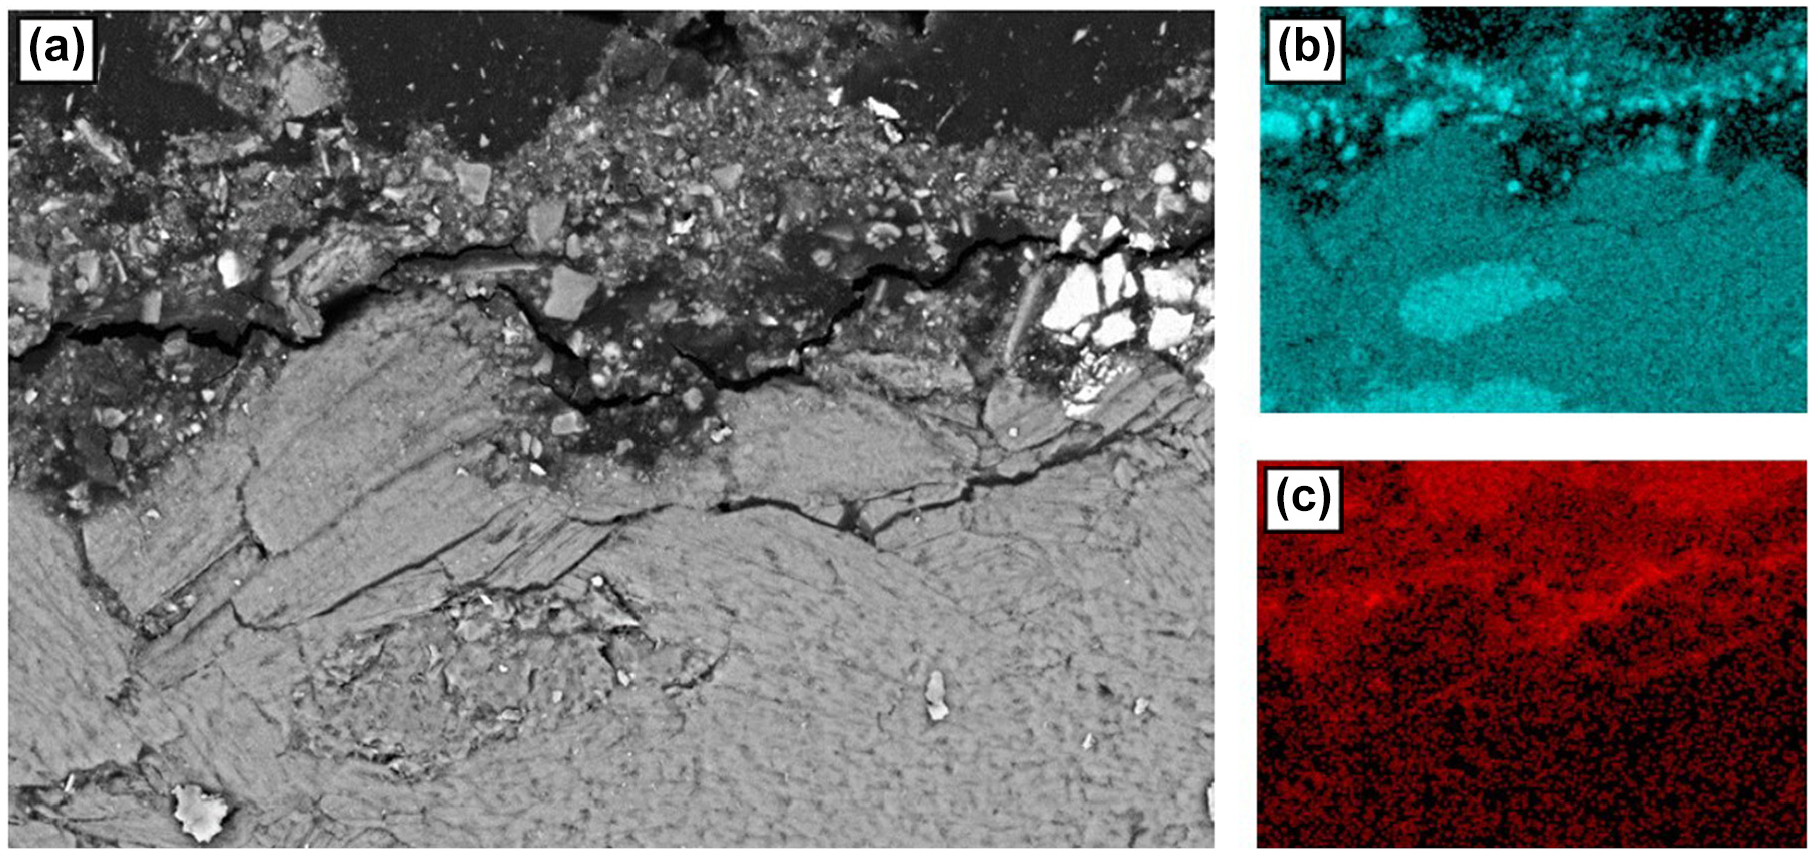
Asphalt binder absorption behavior in quartzite aggregate: (a) backscattered image of quartzite covered with asphalt binder, (b) silicon element distribution, and (c) carbon element distribution.
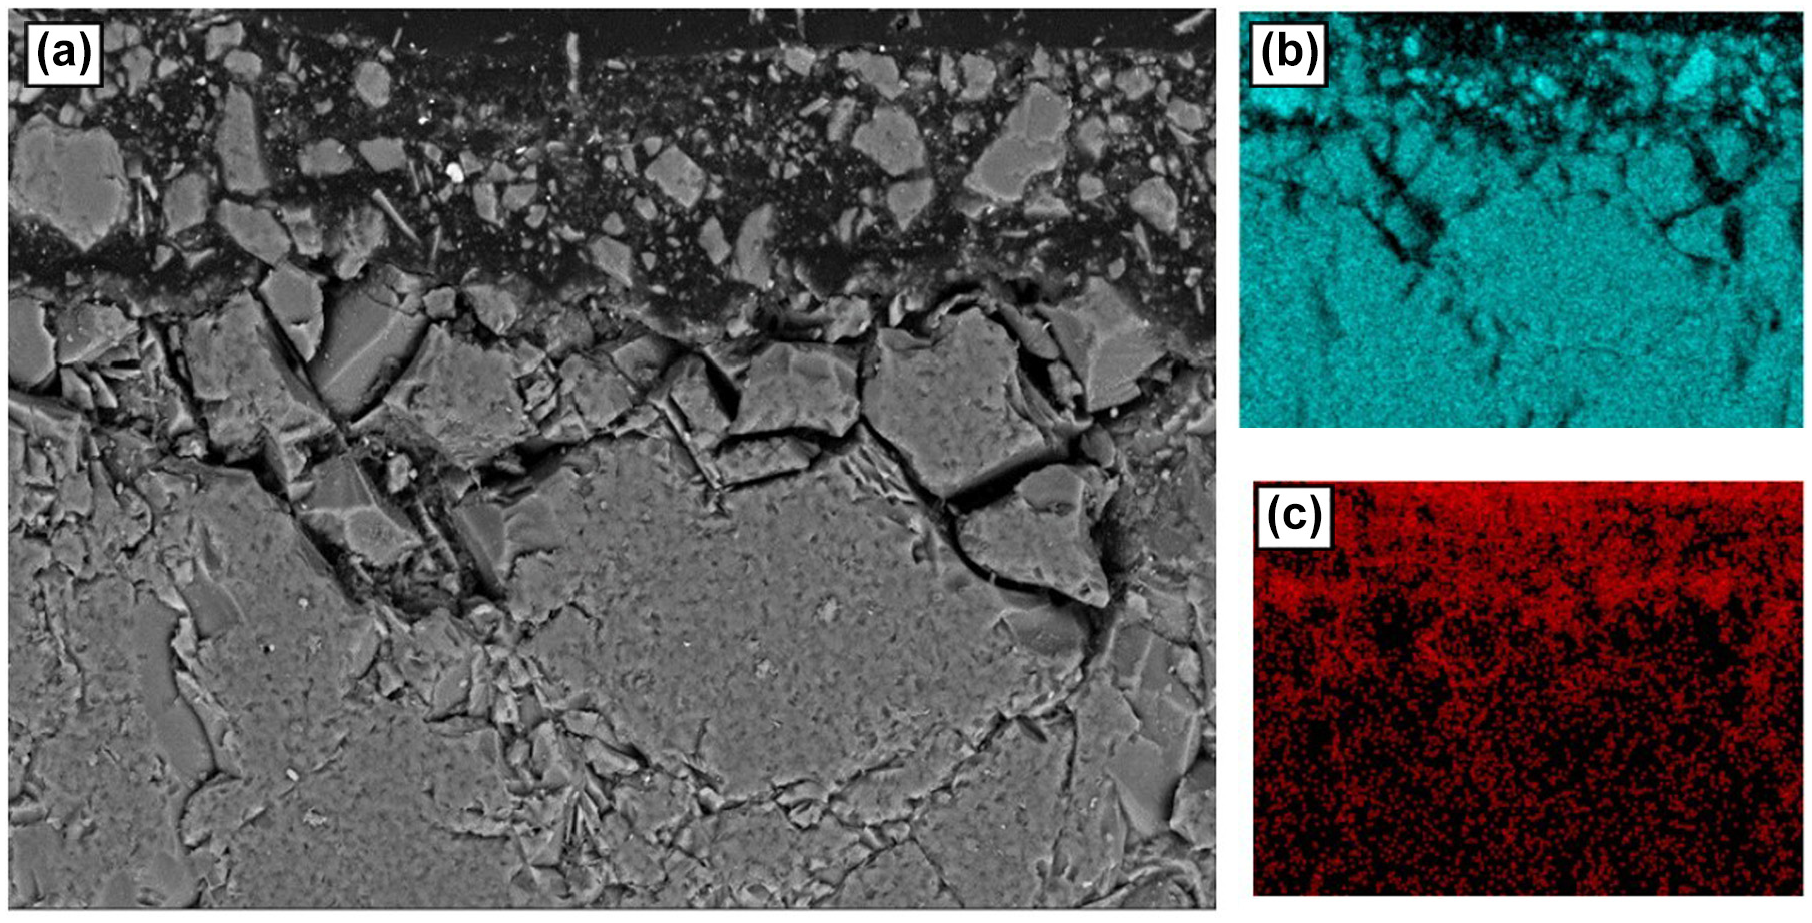
Asphalt binder absorption behavior in sandstone aggregate: (a) backscattered image of sandstone covered with asphalt binder, (b) silicon element distribution, and (c) carbon element distribution.
Analysis of Results
Analysis of results for the samples without asphalt binder and with asphalt binder are discussed in the following sections. For the image analysis, ImageJ software is used ( 33 ). It may be noted that, although this study is based on analysis of 2D images, the area proportion values can be considered equal to the respective volume proportion values, considering stereological principles, provided several replicate images are studied ( 34 ).
Aggregate without Asphalt Binder
For observing the open and connected pores, two functions—the “thresholding” and “masks” of ImageJ—are used ( 33 ). The sample outcome of these steps is illustrated in Figure 14. The images obtained after thresholding are used for estimation of pore area using the function “analyze particles” in ImageJ.
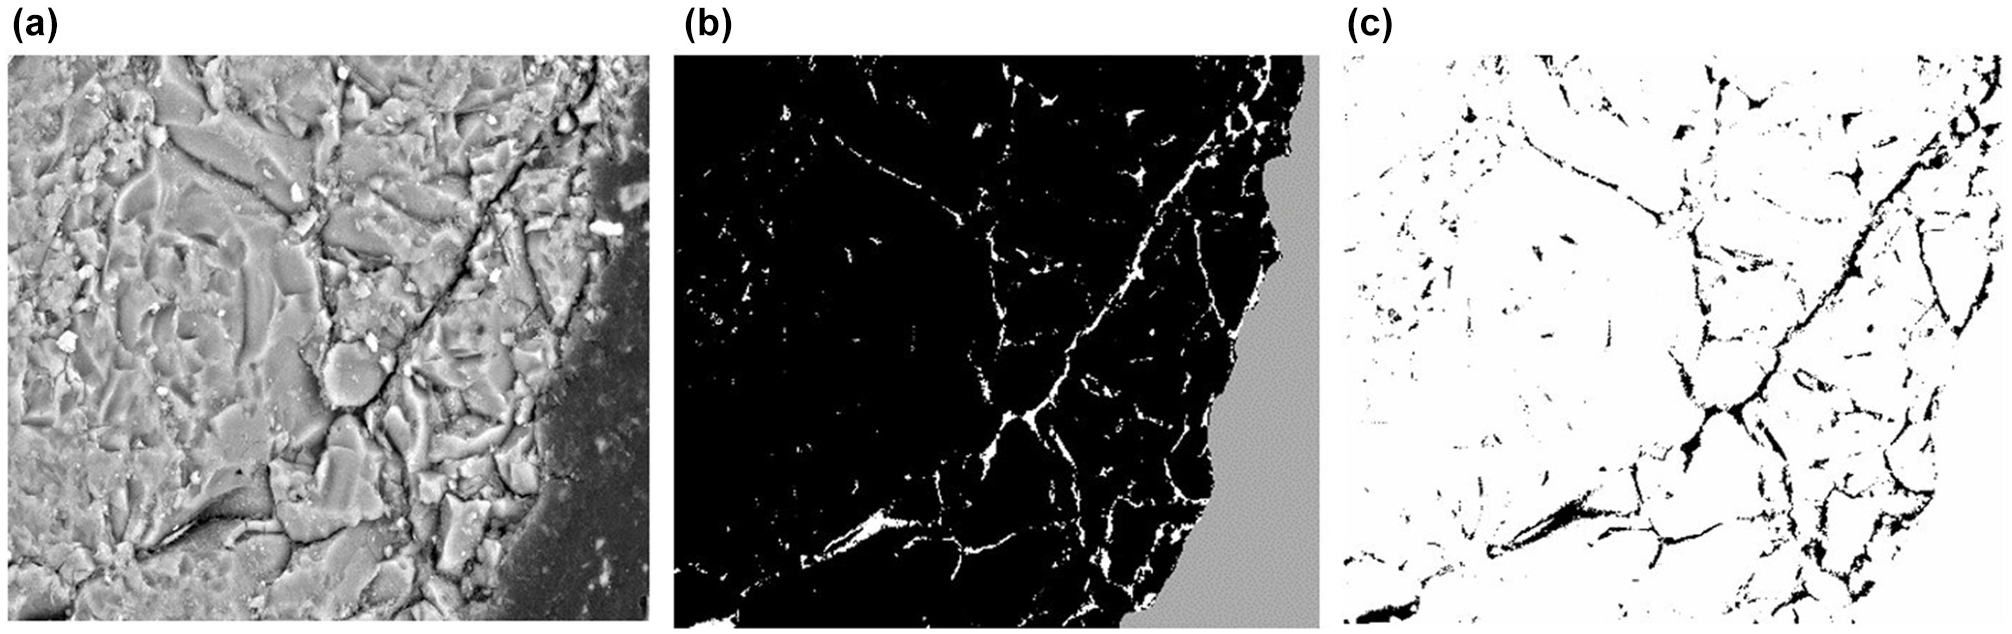
Image analysis of scanning electron microscopy (SEM) images: (a) backscattered SEM image of aggregate, (b) thresholding of aggregate, and (c) pore outline in aggregate using function “masks.”
For thresholding on SEM images, a value of 78 is used. To calculate the total pore area distribution of the aggregates, information obtained at magnification levels of 1,000×, 2,500×, and 5,000× are combined in such a way that pore areas of overlapping sizes are not counted twice. Referring to Figure 15, the contribution of pore area ≥0.0004 μm2 is not considered in 5000× images, but is considered in 2,500× images, and the contribution of pore area ≥0.0002 μm2 is not considered in 2,500× images, but is considered in 1,000× images. Subsequently, the distributions of pore areas of the aggregates (at 10 locations) are obtained, and are shown in Figures 16, 17, and 18, for gneiss, quartzite, and sandstone, respectively. The average percentage of total pore area (i.e., porosity) of gneiss, quartzite, and sandstone are found to be 5.575%, 4.156%, and 6.876%, respectively. Thus, the sandstone has maximum pores, followed by gneiss, and then quartzite. Further, considering only the pores having area >0.002 μm2., (represented in Figure 19, where percentage of pores are plotted against location numbers for the three types of aggregate), these values become 5.493%, 4.020%, and 6.737% for gneiss, quartzite, and sandstone, respectively (these values are shown as dashed lines in Figure 19). This indicates that pore area <0.002 μm2. (i.e., the information obtained from magnification level of 2,500× and 5,000×) has negligible contribution to the total pore area.
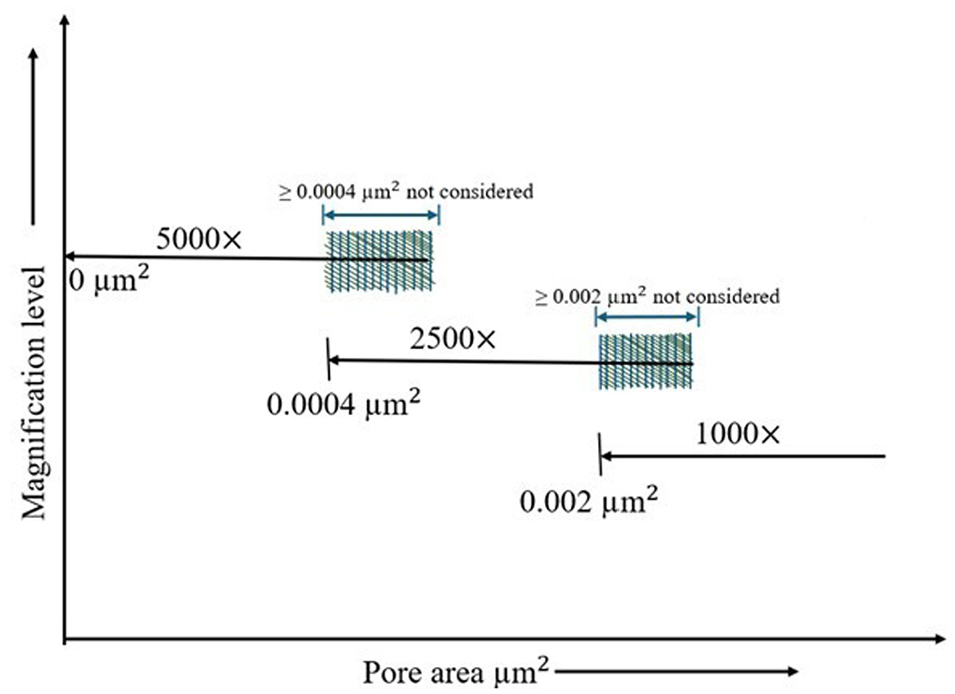
Contribution of pore areas considered from images at different magnification levels.
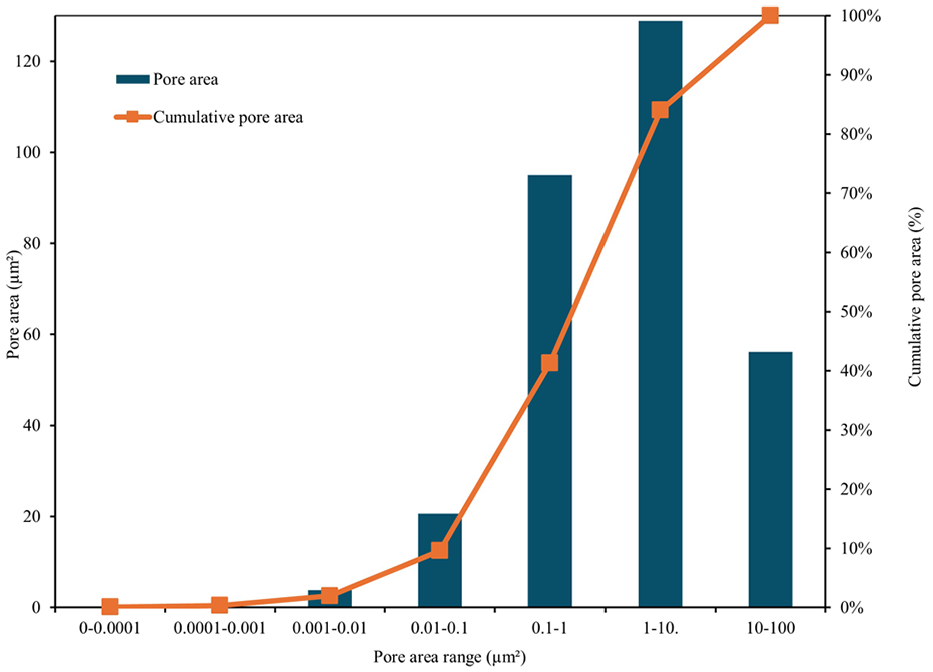
Pore area distribution of gneiss.
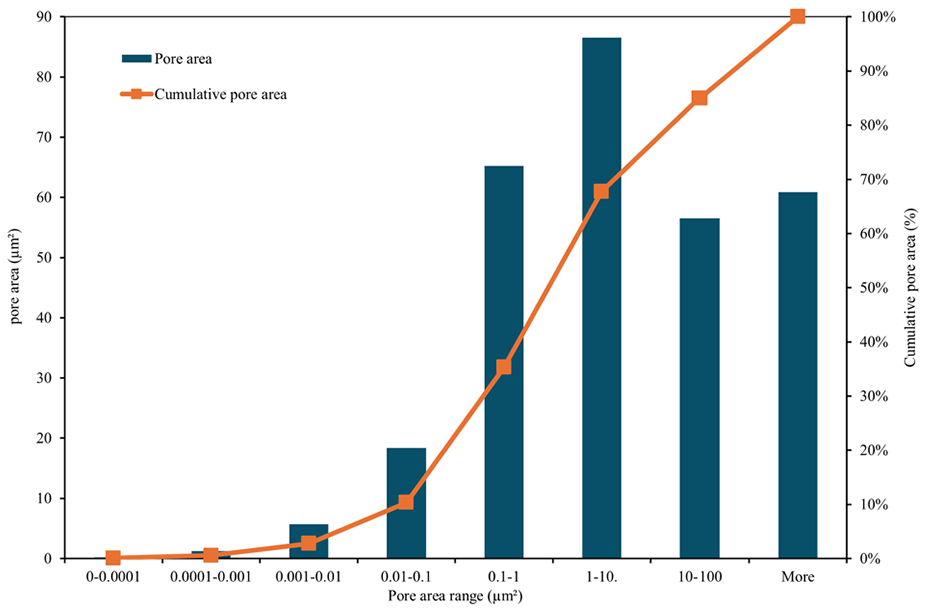
Pore area distribution of quartzite.
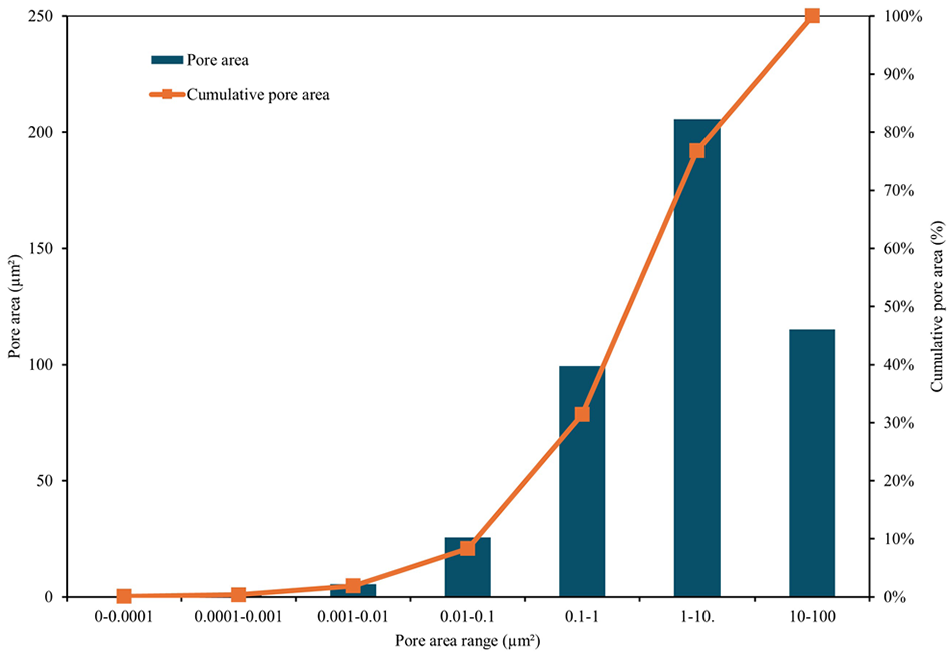
Pore area distribution of sandstone.
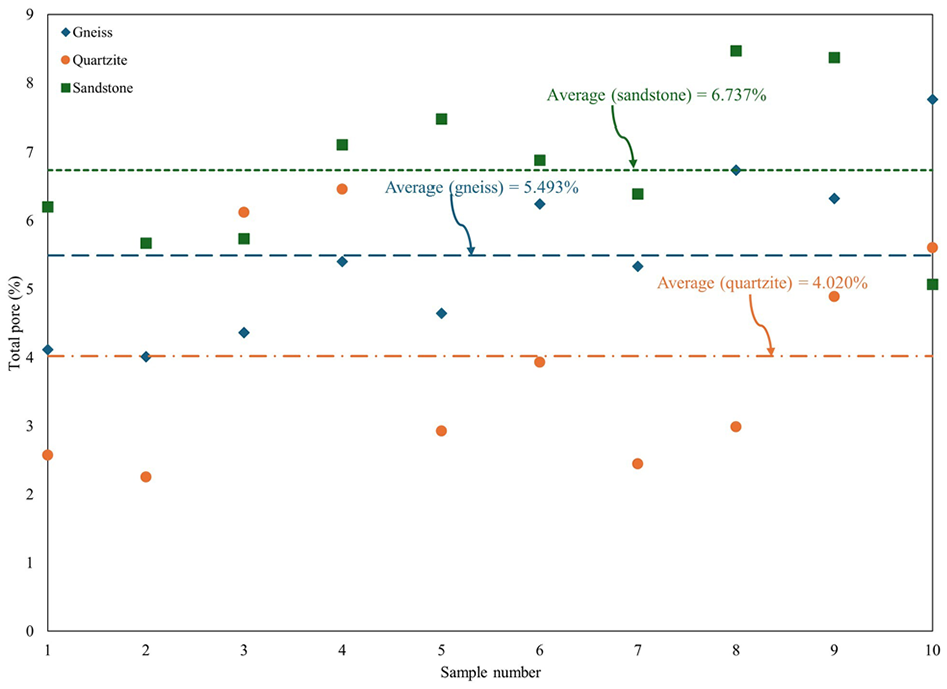
Total pore (in percentage) for different types of aggregate.
Aggregate Covered with Asphalt Binder
For this part of the analysis, SEM images in conjunction with EDX spectroscopy are utilized. The SEM image is used to extract the information on the vacant pore space, and the EDX image for the absorbed binder. For thresholding on SEM images, a value of 55 is used, and for noise reduction on EDX images a median filtering of 1.5 pixel is used. The flowchart of this process is presented in Figure 20. Further, the sum of vacant pore area

It may be noted that this exercise is performed at 1,000× magnification, because, even if other magnifications (i.e., 2,500× and 5,000×) had been taken, their contribution to
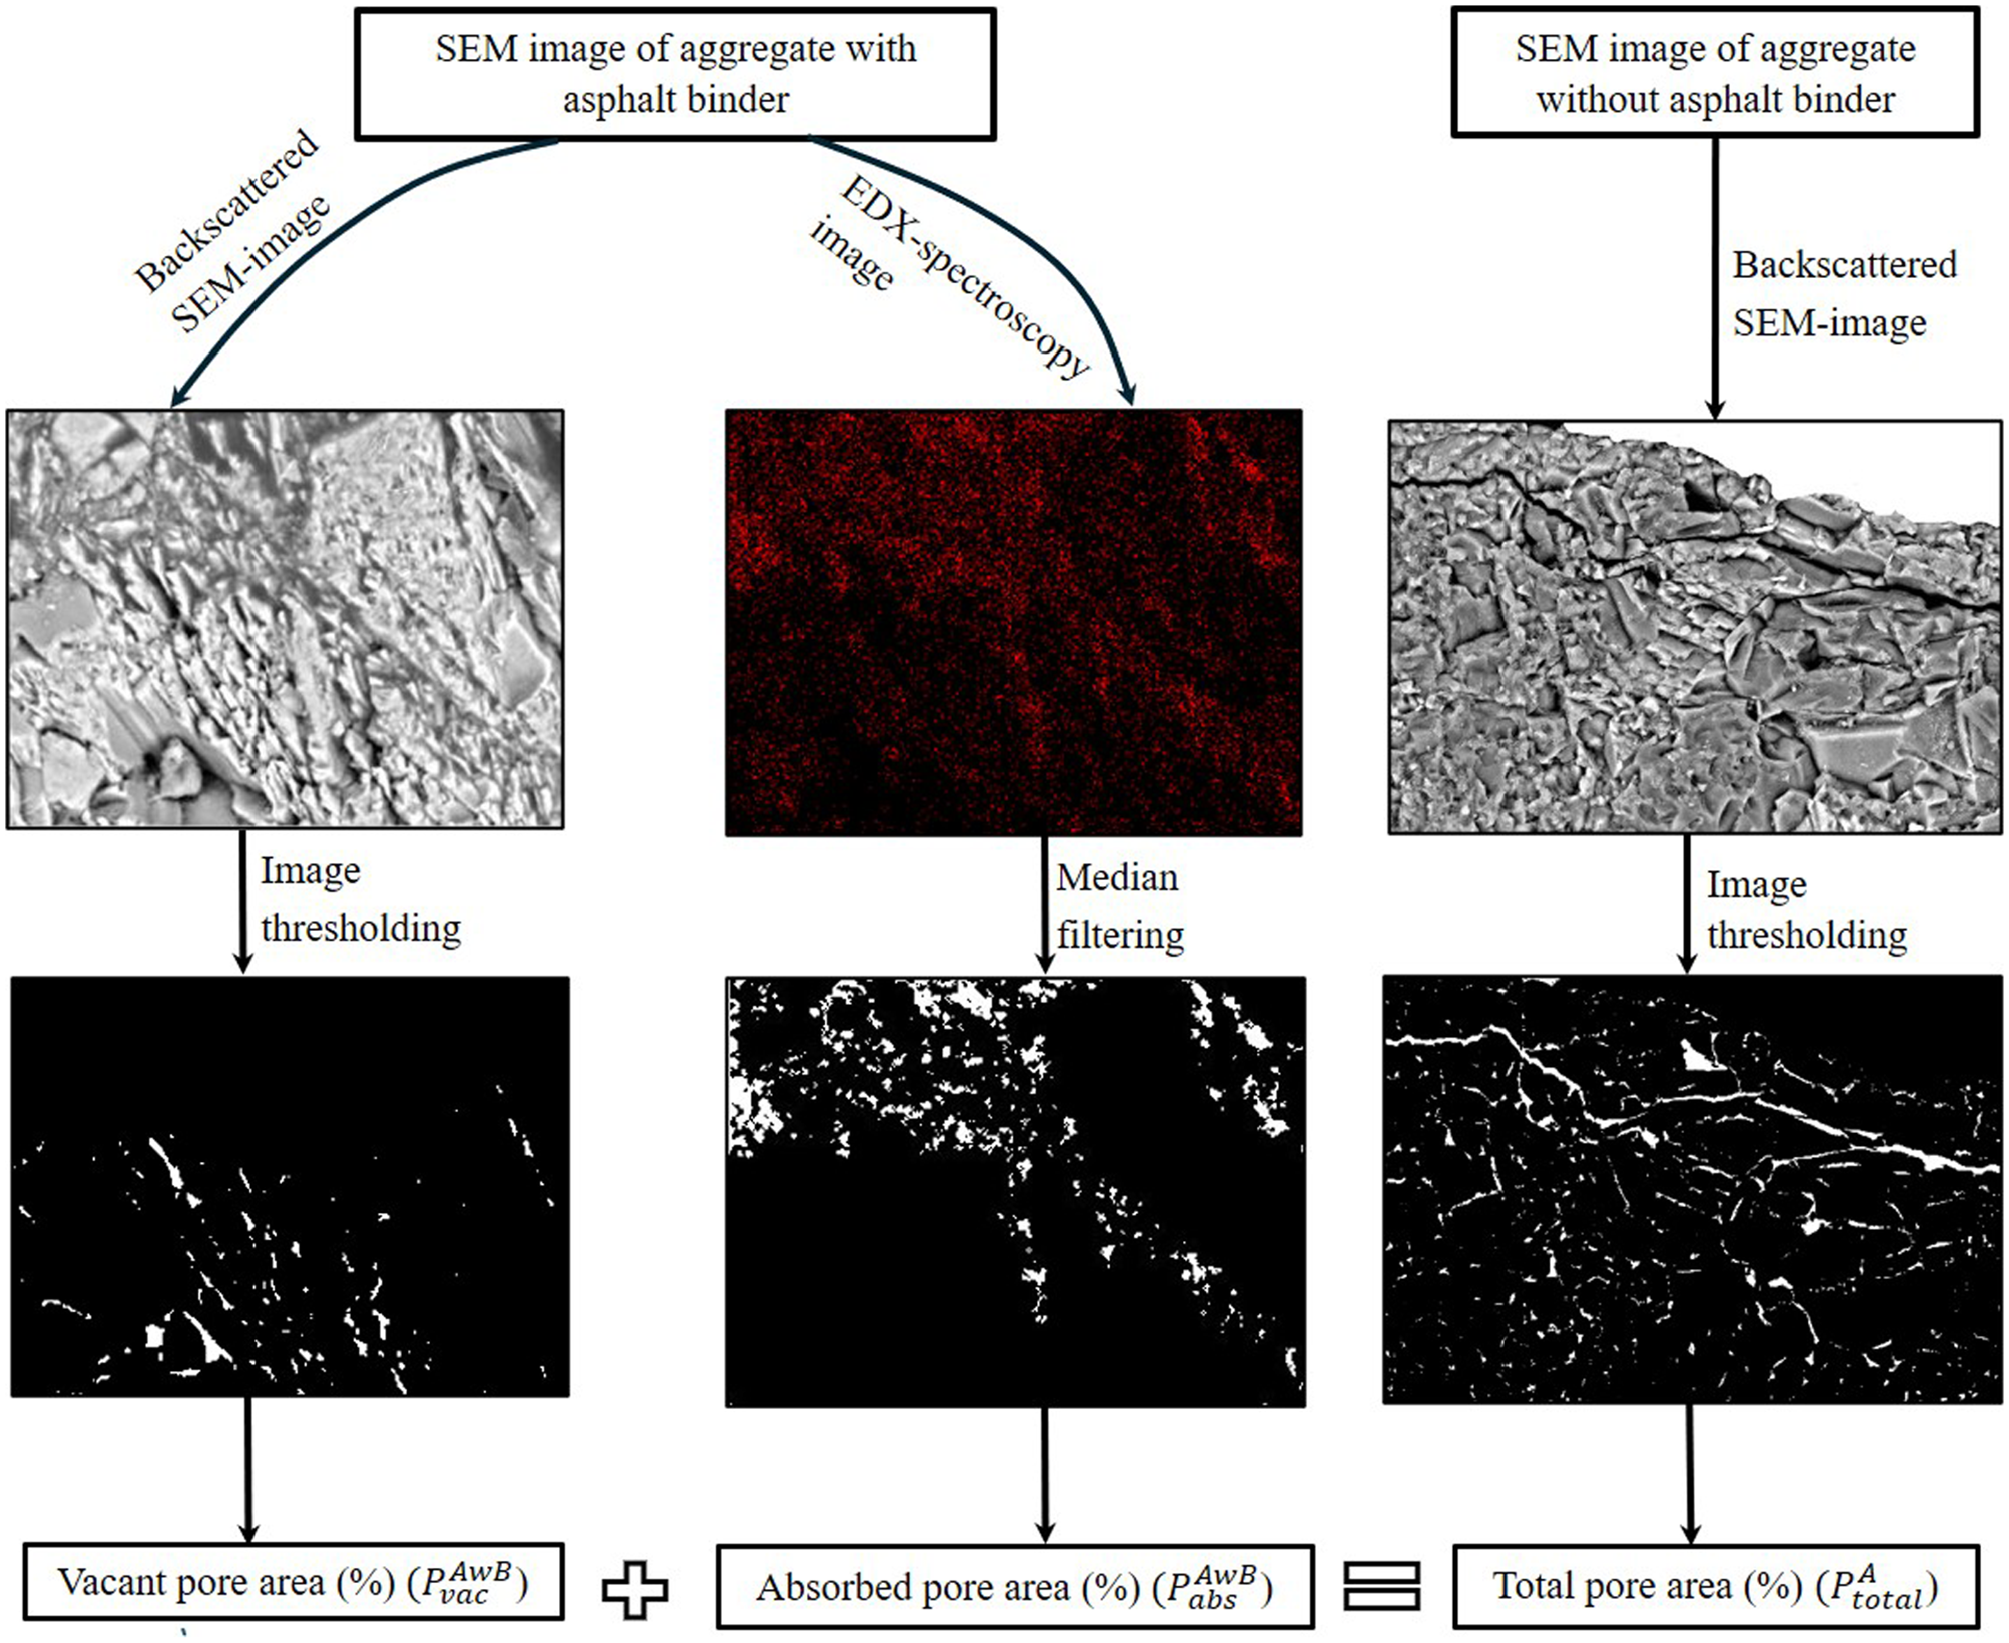
Scanning electron microscopy (SEM) image analysis workflow for pore evaluation in aggregates with and without asphalt binder.
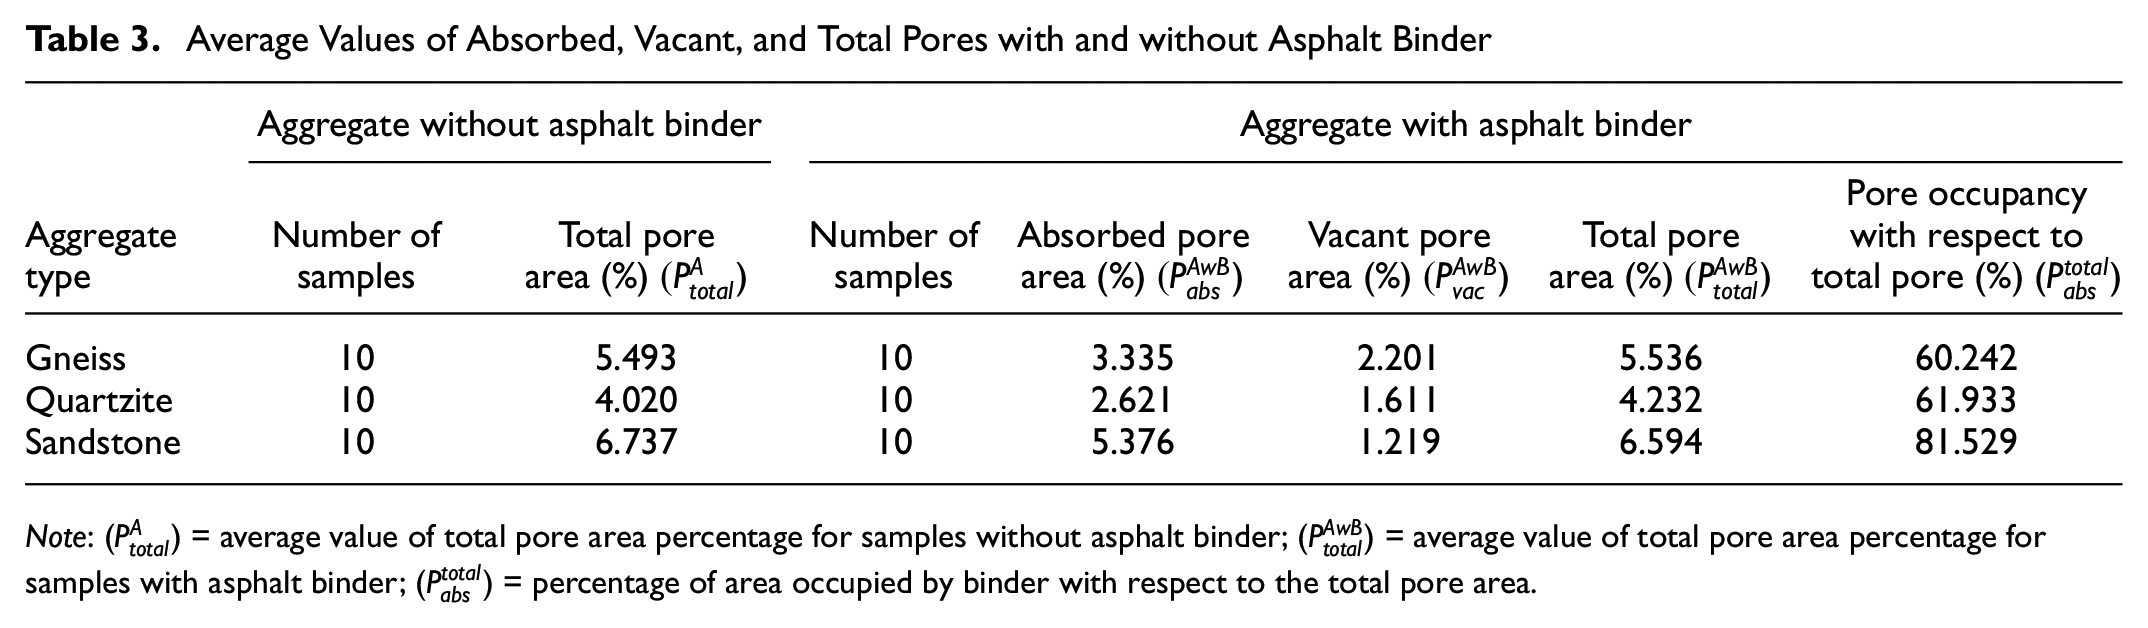
In Figures 21, 22, and 23, the absorbed pore and vacant pore area percentages are plotted against the location numbers for gneiss, quartzite, and sandstone aggregates, respectively. From these figures, it is interesting to note that absorbed pore area in sandstone is highest compared with the other two aggregates. As already shown in Figure 19, the total pore area for sandstone is found to be highest. Table 3 presents the average values of various area percentages for the samples with and without asphalt binder. In Table 3, the average values of total pore area percentage for samples with asphalt binder (
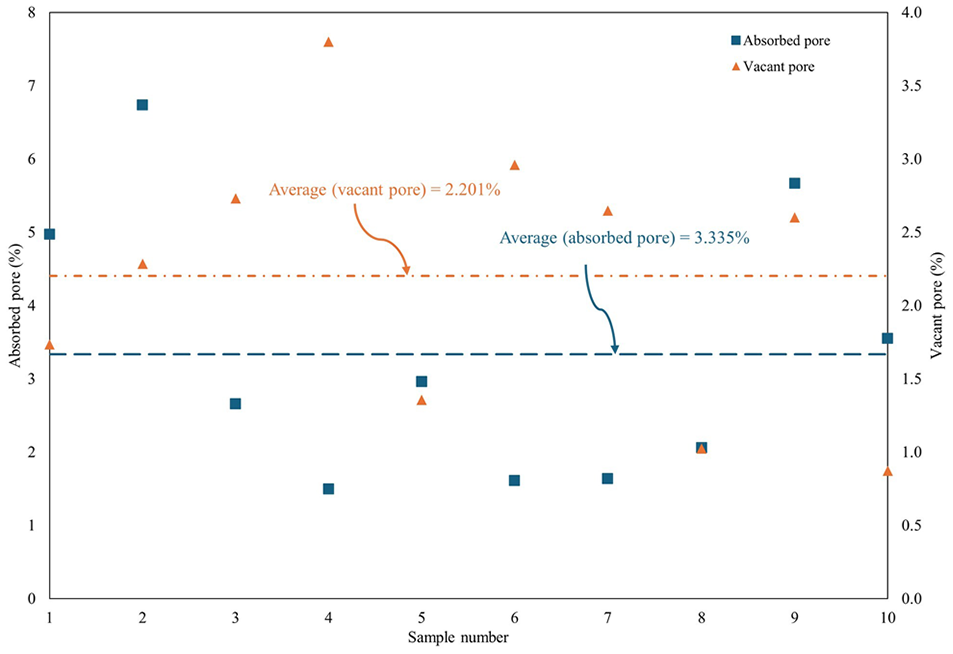
Absorption and vacant pore area (in percentages) for gneiss aggregate.
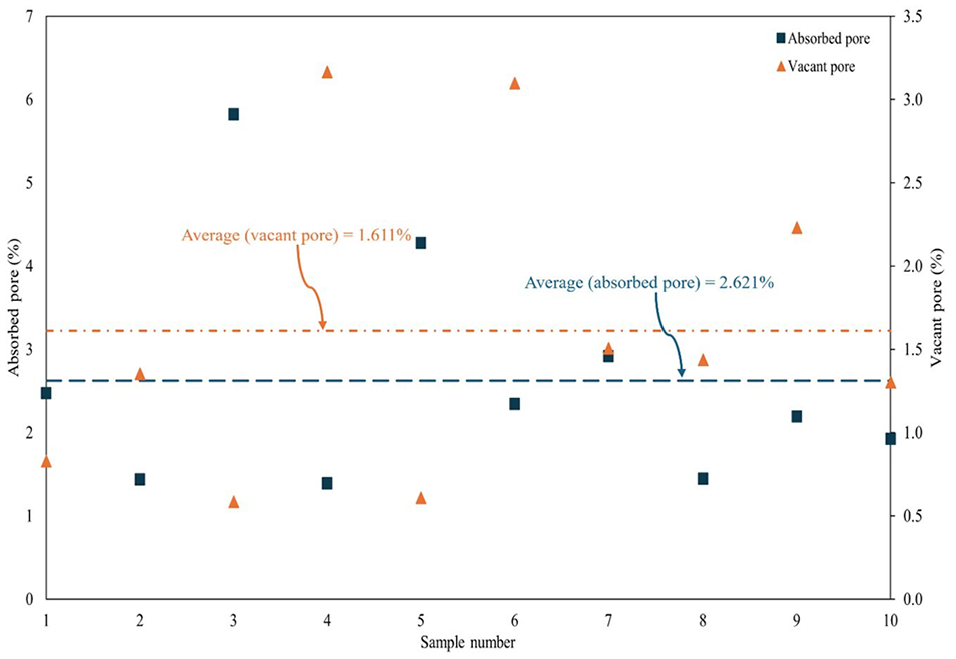
Absorption and vacant pore (in percentages) for quartzite aggregate.
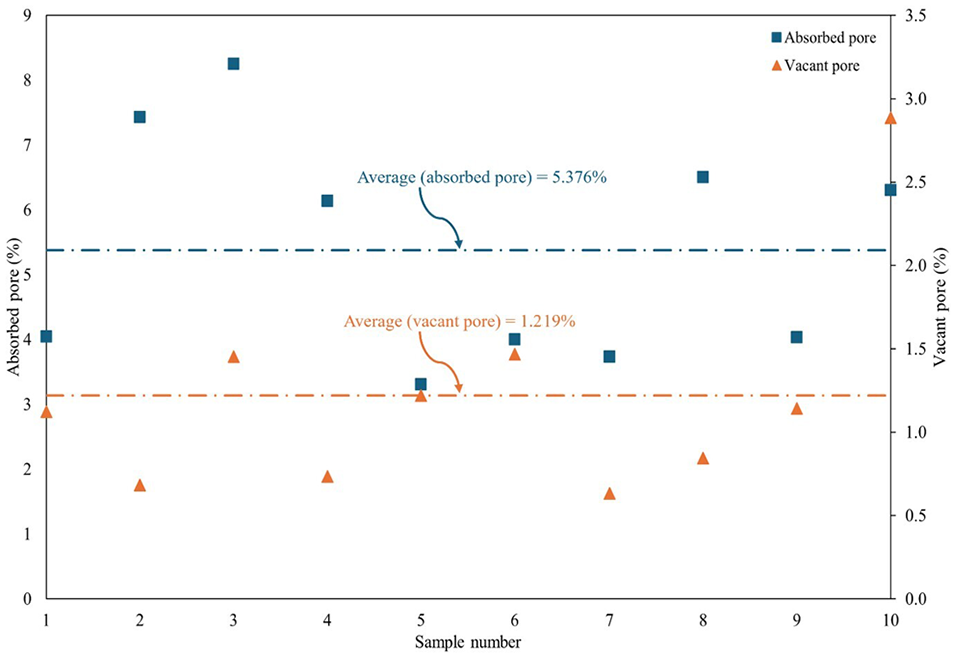
Absorption and vacant pore (in percentages) for sandstone aggregate.
Average Values of Absorbed, Vacant, and Total Pores with and without Asphalt Binder
Note: (
Further, statistical analysis (t-test) is performed on the total pore and asphalt binder absorption for the three types of aggregate. A two-tailed hypothesis test is conducted at a 5% level of significance. The null hypothesis posed is that the average value of any given parameter (say, the total pore, or asphalt binder absorption) is statistically similar between a given pair of aggregate types, while the alternative hypothesis is that a significant difference exists. From the analysis, it is found that the absorption values for gneiss and quartzite are not statistically different (possibly because both are metamorphic rocks), while the total pore areas are different from each other.
Discussion
This research provides a microscopic insight of how asphalt binder occupies the existing pores for different types of aggregate. It may be recalled that, in a traditional mix design process, binder absorption is estimated macroscopically. That is, binder absorption is quantified as a percentage of the weight of the aggregates, or a percentage of the volume of the aggregates ( 35 ). Such a quantification scheme treats asphalt absorption as a function of the size of the aggregate ( 18 ). That means, the same type of aggregate with different sizes would provide different values of binder absorption. However, the propensity of binder absorption of a given aggregate is a physical property of the aggregate, and it should have been independent of its size.
Nevertheless, it would be interesting to estimate the binder absorption through traditional volumetric method for the aggregates chosen in this study (
35
). As mentioned earlier (in the Materials and Sample Preparation section), 4.5% binder is mixed with the aggregates at 165°C for 5 min. Given that single-size aggregates are used, and more binder is used than required, some binder remain in the mixing bowl. Thus, the actual binder contents that participate to coat the aggregates are estimated by the centrifuge asphalt binder extractor method, and the average values (average of two tests) are found as 1.8%, 1.8%, and 2.7% for gneiss, quartzite, and sandstone, respectively (
36
). These values are taken as the actual binder content (
Maximum Theoretical Specific Gravity (Gmm) and Bulk Specific Gravity (Gsb) Values for Volumetric Calculations
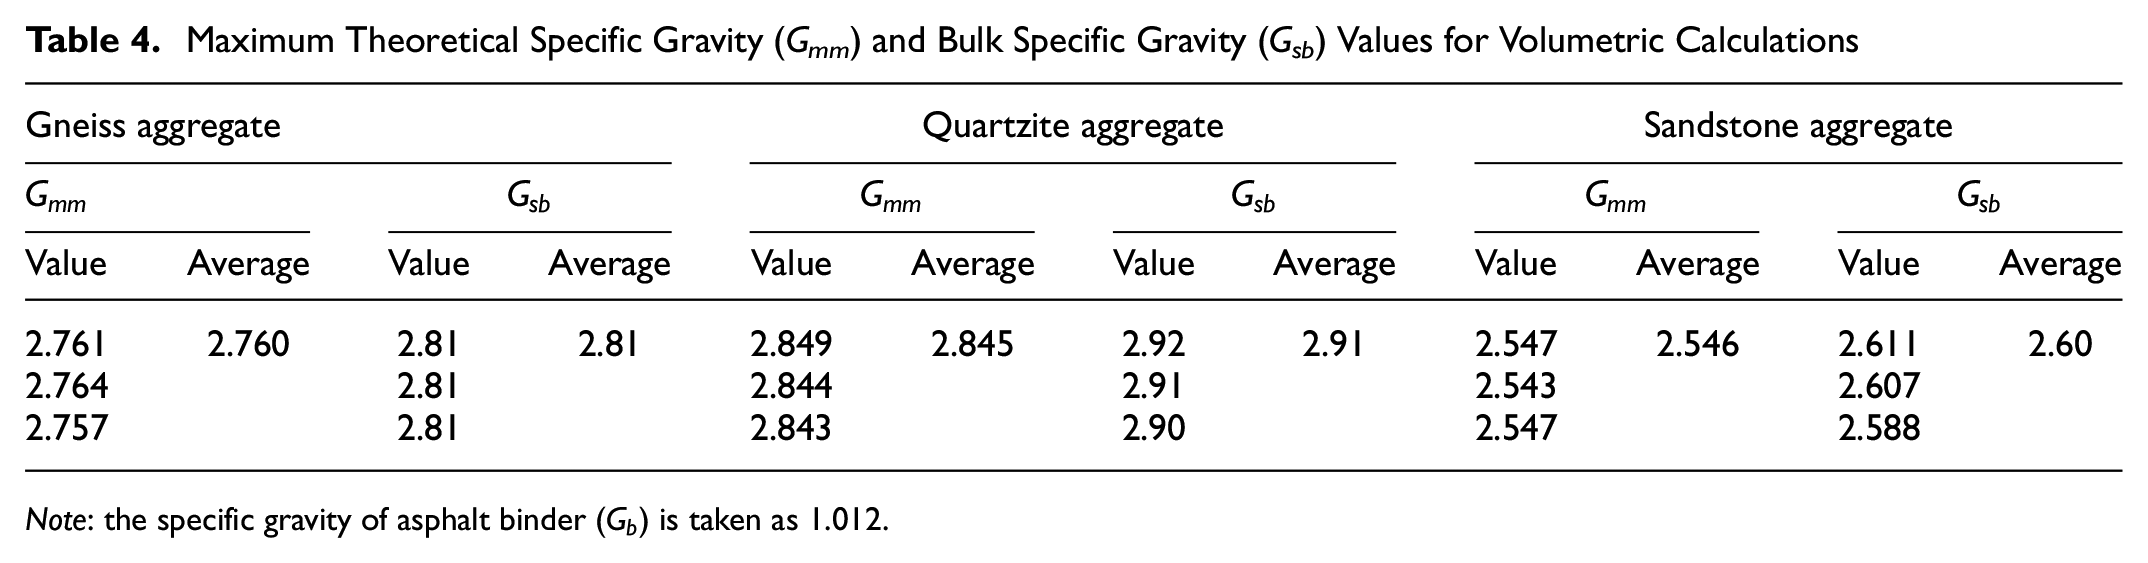
Note: the specific gravity of asphalt binder (


where
The asphalt binder absorption values obtained by volumetric and imaging methods are placed side-by-side in Table 5. For this purpose, absorption percentages by volume calculated using imaging method are converted into absorption percentages by mass by multiplying by
Binder Absorption Obtained Volumetrically and by Imaging
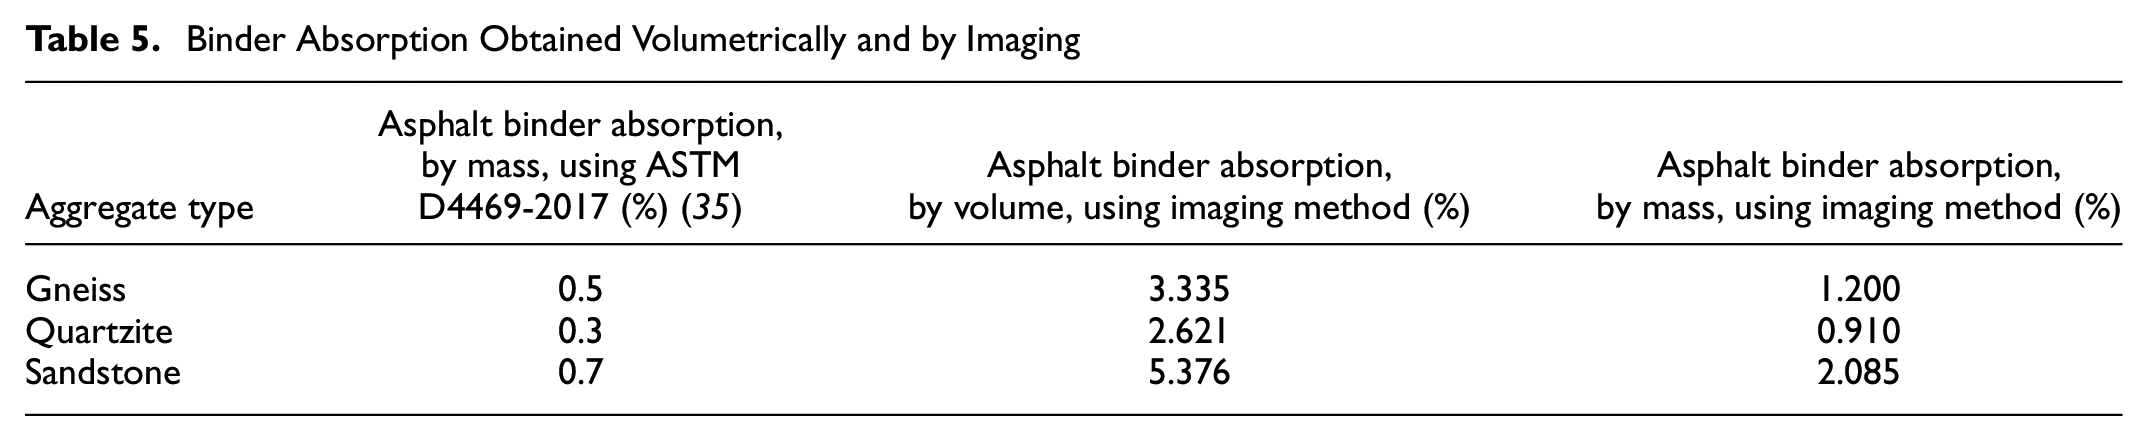
It can be noted that the values cannot be compared quantitatively (although their ranks match) because 1) the pore space decreases as one moves from the aggregate boundary to its interior and 2) volumetric calculations involve the size of the aggregate. Thus, as one includes more aggregate areas in the calculation, the binder absorption percentage decreases. This is illustrated by imaging at different locations along the interior direction (refer to Points A, B, C, etc., in Figure 9). A representative backscattered SEM image, EDX spectroscopy image, and absorbed asphalt binder portions identified by image processing are shown in Figures 24a, b , and c , respectively. The asphalt binder absorption values (average of two) along the depth of the aggregate toward its interior are presented in Figure 25. From the figure, it can be observed that asphalt binder absorption keeps on decreasing as one includes more aggregate area toward its interior. This is what is expected.
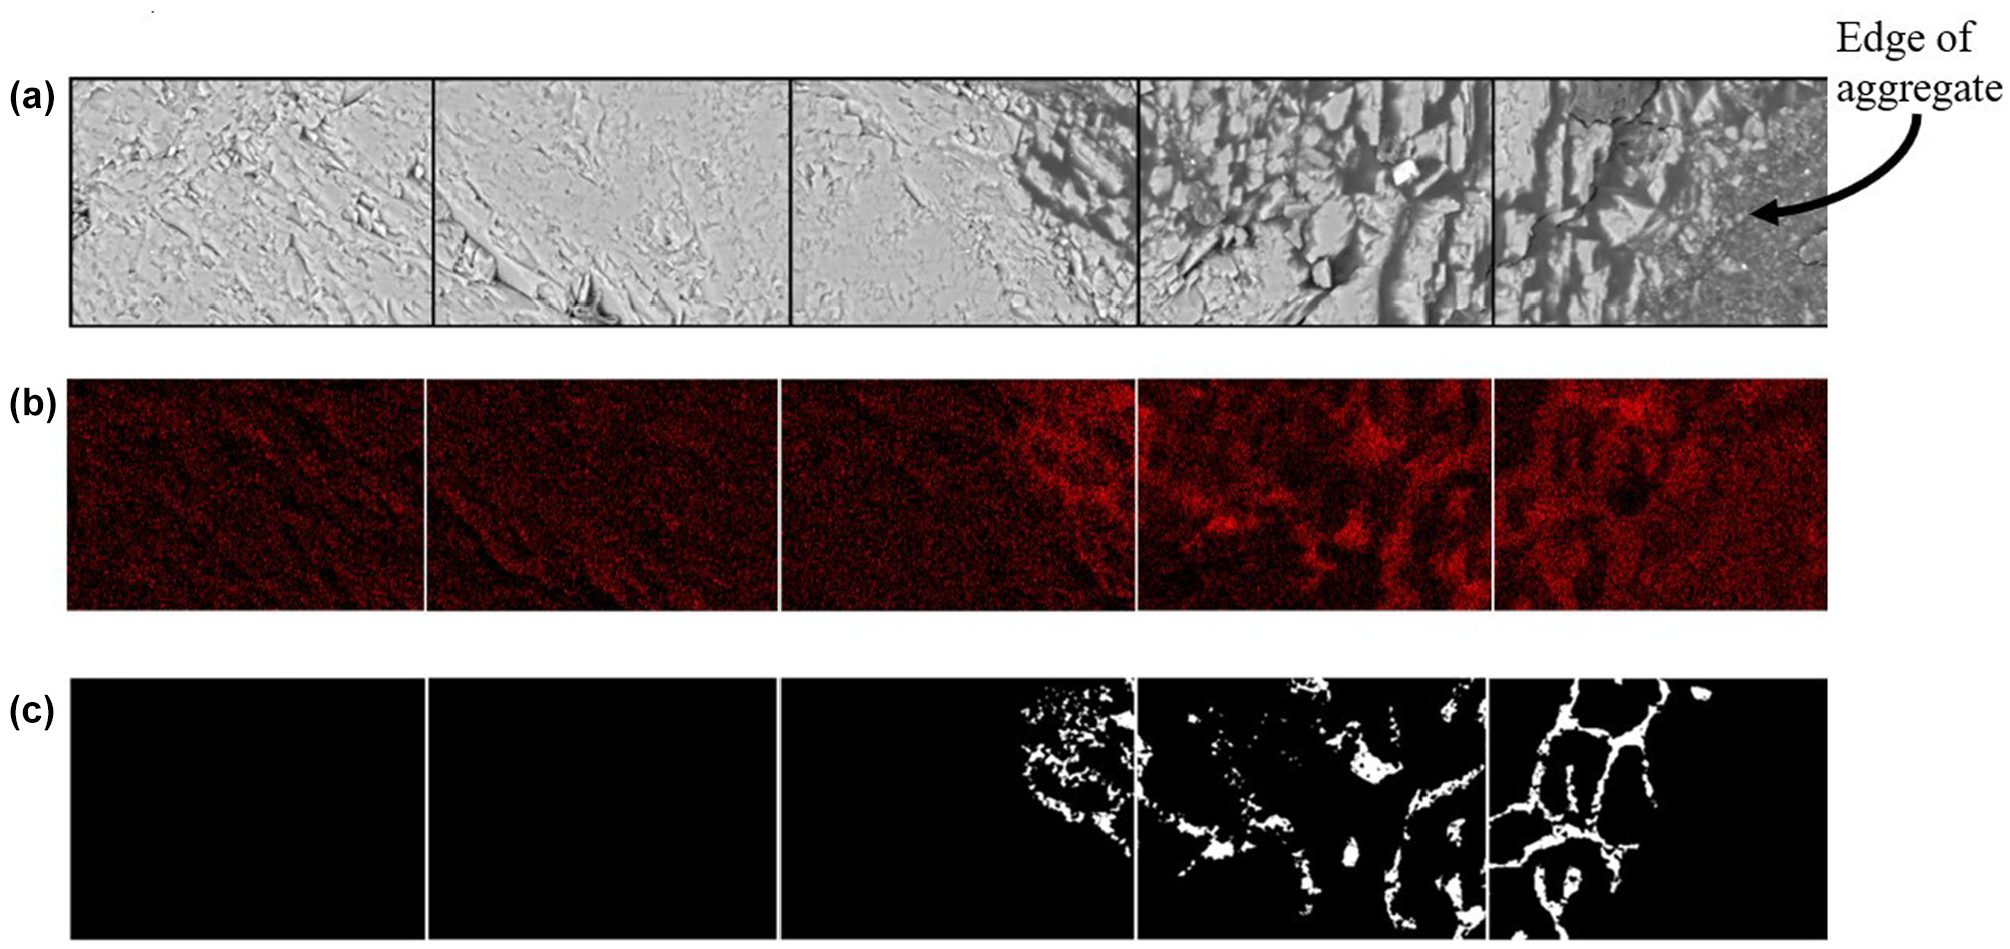
Representative images of distribution of asphalt binder absorption with distance from the edge of aggregate: (a) backscattered scanning electron microscopy (SEM) image, (b) energy dispersive X-ray (EDX) spectroscopy image, and (c) asphalt binder absorption detected through image processing.
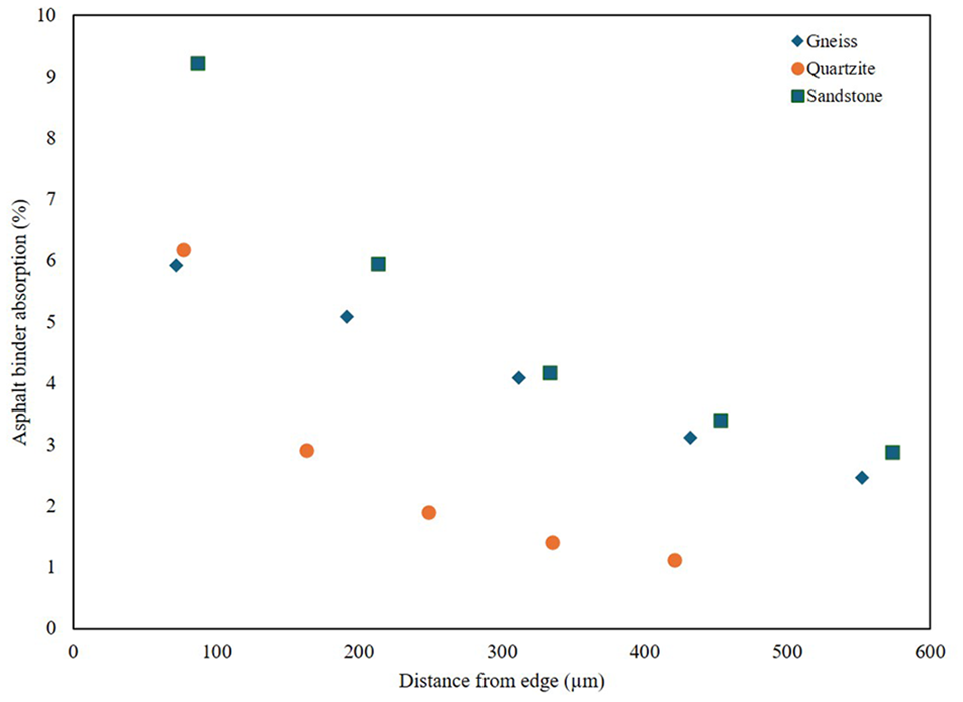
Percentage of asphalt binder absorption along distance.
Traditional volumetric method infers binder absorption based on mass differential and does not account for the variations in absorption along the depth of the aggregate. Also, volumetric estimate of binder absorption, the way it is defined, is a function of the size of the aggregate. In contrast, the imaging-based approach, as illustrated through SEM along with EDX spectroscopy, provides detailed visualization of binder penetration into the aggregates.
Summary and Conclusions
This work has microscopically studied the pores present within the aggregates and the way these get occupied when binder is added. This study, therefore, provides a microscopic scenario of binder absorption, which is otherwise not captured in volumetric studies. For this, suitable sample preparation (thin slicing) and image capturing and processing techniques are utilized for visualization of the pores before and after adding asphalt binder. The following specific conclusions can be drawn based on the results obtained in this study:
1) SEM is used as an imaging tool, with EDX for detection of elements; a scheme is developed to utilize the SEM images (along with EDX spectroscopy images) for quantitative estimation of total pore
2) Sandstone is found to exhibit the highest porosity, followed by gneiss, and then quartzite (see Table 3).
3) The pore occupancy (percentage of binder absorbed with respect to total pore area) is also found to be highest for sandstone. Thus, based on the aggregates considered, it can be concluded that higher pore area facilitates enhanced access to binder occupancy of the pores.
4) The absorption behaviour in gneiss and quartzite is statistically similar.
5) The extent of asphalt binder absorption reduces as one moves toward the interior of the aggregates (see Figure 25).
Such an understanding of the pore occupancy behavior in varieties of aggregates may eventually be helpful to suitably “engineer” the aggregate pore structure toward a favorable situation; for example, the use of secondary filler/binder to plug-in the pores of those aggregates which have high porosity value, or the enhancement of the pore-entry for reclaimed asphalt pavement material to facilitate diffusion of virgin binder, thereby enabling efficient blending.
Footnotes
Acknowledgements
Authors acknowledge the help of the Earth Science laboratory, IIT Kanpur, for the geological identification of aggregate samples; Lab Crystals, Lucknow, for preparing thin sections; and the Advanced Centre for Materials and Science, IIT Kanpur, for providing the imaging facility. The authors thank Dr. Rajiv Kumar, scientist, CSIR-CRRI, New Delhi, for his help in acquiring the aggregates used in this study.
Author Contributions
The authors confirm contribution to the paper as follows: study conception and design: S. Shukla, A. Das; data collection: S. Shukla; analysis and interpretation of results: S. Shukla, A. Das; draft manuscript preparation: S. Shukla, A. Das. All authors reviewed the results and approved the final version of the manuscript.
Declaration of Conflicting Interests
The author(s) declared the following potential conflicts of interest with respect to the research, authorship, and/or publication of this article: Animesh Das is a guest editor of Transportation Research Record. The other author, Shivani Shukla, declared no potential conflicts of interest with respect to the research, authorship, and/or publication of this article.
Funding
The author(s) received no financial support for the research, authorship, and/or publication of this article.