
Abstract
Reclaimed asphalt pavement (RAP) is abundantly used in highway paving. The asphalt paving industry has also been using warm mix asphalt (WMA) with RAP to ensure mixture workability. Conversely, the Federal Aviation Administration’s (FAA) current construction specification restricts the use of RAP in the surface layers of airfield runway and taxiway paving projects funded through the Airport Improvement Program (AIP). Therefore, the FAA’s National Airport Pavement and Materials Research Center recently embarked on an accelerated pavement study in Test Cycle 2 (TC2) to evaluate WMA–RAP for surface courses in airfield asphalt pavement. A total of six test lanes, each encompassing three different test sections, were constructed. Lane 1 paved with conventional PG76-22 hot mix asphalt (HMA) served as the control one, whereas lanes 5 and 6 were surfaced with latex-treated PG64-22 organic WMA without and with RAP, respectively. Respective test sections on the northside were trafficked with a 272.7 kN moving wheel load exerting a 1.75 MPa tire pressure using the sixth-generation heavy vehicle simulator, airfields (HVS-A). The pavement temperature 5.1 cm below the surface was controlled at 48.9°C throughout the traffic tests. Periodic rutting measurements indicated comparable performance among P-401 HMA and WMA with and without RAP. RAP may be considered for airfield surface mixes with respect to the excellent rutting resistance observed during the traffic tests. Finite element analyses on the as-built pavement structures were conducted using the newly developed PANDA-AP software. Predicted tensile strains were comparable with those recorded during the traffic tests in the corresponding test sections.
Keywords
Reclaimed asphalt pavement (RAP) has been frequently used in highway flexible pavement applications since the 1970s ( 1 ). Use of RAP for asphalt concrete (AC) paving has substantial financial benefits. For example, increased recycling can reduce the demand for ever-so-depleting natural resources like asphalt and aggregates. Replenishment of aggregate demands with RAP can decrease the energy required for quarrying, extraction, and transportation of these resources ( 2 ). However, while the hardened binder in RAP can enhance the rut resistance of AC mixes, it also increases their susceptibility to fatigue and thermal cracking ( 3 ). Increased mixture stiffness also lessens the workability of the mixes for paving ( 4 ). Therefore, the asphalt paving industry has introduced warm mix additives (WMA) to increase the workability of similar mixes with RAP. Adoption of WMA–RAP mixes can also extend the paving window. Contrary to the frequent use in highway applications, WMA–RAP has been sparsely used in airfield paving. Therefore, scientific information on long-term pavement performance is scarce.
About 80% of 3,300 airfield runways in the Federal Aviation Administration’s (FAA) national airport system are paved with AC ( 5 ). FAA’s airport improvement program (AIP) spends roughly $4 billion per year for airfield pavement applications ( 5 , 6 ). Despite the potential for enormous fiscal benefits of WMA–RAP use, FAA’s current construction specifications neither provide any guidelines for WMA applications in flexible pavement structures nor allow the use of RAP in the surface mixes ( 7 ). Aircraft gross weights and tire pressures have also been steadily increasing over the last few decades. Climatic conditions such as surface temperature have also been evolving rapidly ( 8 ). Performance of new-generation AC mixes under the aforementioned conditions has largely been understudied. Considering the knowledge gap, FAA’s Airport Technology Research and Development Branch procured a sixth-generation heavy vehicle simulator, airfields (HVS-A) in 2013 to study the performance of new-generation asphalt paving materials under the influence of high aircraft tire pressure and pavement temperatures ( 9 ).
During test cycle (TC) one, the FAA conducted a full-scale accelerated pavement testing (APT) study investigating the rutting performances of chemical-additive-based warm mixes with two different binder grades against hot mix counterparts under the influence of high tire pressures and temperatures at the National Airport Pavement and Materials Research Center (NAPMRC) ( 10 ). In a follow-up study, the FAA opted to assess the rutting and fatigue performances of three different WMA technologies and the feasibility of RAP use in the surface course during TC2. This paper provides an in-depth comparison of rutting performances between test sections with WMA–RAP mix and a control polymer-modified PG76-22 HMA.
The FAA rigid and flexible iterative elastic layered design (FAARFIELD) procedure neither accounts for the time–temperature-dependent behavior of AC nor accommodates the stress-dependency of coarse- and fine-grained materials for subsurface layers. Furthermore, new generation wide-body aircraft coupled with high temperatures can induce severe loading conditions, exacerbating the damage progression in airfield AC. Reasonable accuracy in the prediction of plastic deformation under such conditions is critical to the successful implementation of a mechanistic design framework with constitutive material models and the incorporation of cost-effective resilient pavement structures.
Numerous studies have previously shown that the AC exhibits time–temperature-dependent behavior incorporating both recoverable (viscoelastic) and nonrecoverable (viscoplastic) deformations ( 11 – 13 ). Several studies have used Schapery’s (1969) nonlinear viscoelastic theory to predict the viscoelastic responses of AC ( 14 – 16 ). Various researchers have also used classical hardening viscoelasticity to model the viscoplastic deformation of AC. Gibson et al. (2003) and Underwood et al. (2006) modeled the nonrecoverable deformation of AC using the Schapery viscoelastic damage model coupled with viscoplasticity ( 17 , 18 ). Although the viscoplastic component in these models could be successfully deployed in tensile mode, improvement was needed to accommodate multiaxial states of stress. On that note, researchers used Perzyna (1971) viscoplasticity in combination with a modified Drucker–Prager yield surface to predict the permanent deformation in AC under the influence of both compressive and tensile loads ( 19 – 21 , 15 ).
In recent years, researchers developed the pavement analysis using nonlinear damage approach (PANDA) for mechanistic analyses of AC materials. The PANDA analytical framework incorporated constitutive relationships of viscoelasticity, viscoplasticity, viscodamage, moisture-induced damage, and oxidative aging ( 22 , 23 ). Laboratory test protocols were simultaneously developed to determine the linear viscoelastic (LVE) from dynamic modulus tests. Similarly, nonlinear viscoelastic (NVE) characteristics were determined from repeated creep recovery tests at variable deviatoric stress levels (RCRT-VS) ( 24 ). A three-dimensional (3-D) finite element software named PANDA-AP is being developed for airfield AC pavements based on the same mechanistic framework. Researchers have been integrating the aforementioned constitutive models as well as the laboratory-established LVE and NVE material properties of standardized P-401 materials into the PANDA-AP software ( 23 ). Besides thorough investigation of APT rutting performances, the current version of PANDA-AP software was used in this paper as a supplementary tool for the comparative assessment of selected mixes. Corresponding mechanistic analyses with PANDA-AP focused on the evaluation of LVE responses against the measured responses from instrumented test sections.
Objective and Scope
The objectives of this paper are two-fold. The first objective is to assess the feasibility of RAP in airfield AC mixes considering the rutting potential under the influence of high tire pressure and temperature. With an aim to verify the existing restriction in the FAA construction specifications, the second objective is to evaluate the use of RAP in airfield surface mixes under extremum conditions as listed above. This paper provides a brief overview of the heavy vehicle simulator, airfields (HVS-A), design and construction of the test lanes paved with polymer modified hot and neat binder warm mixes consisting of RAP. Subsequent traffic tests, rutting measurements, and observed performances are discussed thereafter. The ensuing discussion highlights the key attributes of 3-D finite element analyses, supplementary dynamic modulus test results, and comparisons of critical pavement responses. The paper ends with concluding remarks on the feasibility of RAP in airfield AC applications considering rutting susceptibility.
Traffic/Accelerated Pavement Testing Setup
Design and Construction of Full-Scale Test Sections
During TC1, the original pavement structures were designed with the intent to limit deformation in the granular layers and subgrade such that rutting failure will occur predominantly in the asphalt surface layer. The TC1 pavement section consisted of 12.7 cm (5 in.) thick AC on top of a 30.5 cm (12 in.) thick crushed stone P-209 base course. Underneath the base course, an equally thick P-154 granular subbase was placed over a compacted sandy subgrade with a California bearing ratio (CBR) of 15. After the traffic-induced failure of the TC1 pavements, the 12.7 cm (5 in.) thick surface layer was removed, and no deformation was observed in the P-209 base.
The design thickness of the asphalt layer was increased to 22.9 cm (9 in.) for TC2 with an objective of replicating typical in-service airfield flexible pavement structures. Attributed to the thicker asphalt surface, the design thickness of the P-209 was decreased from 30.5 cm (12 in.) to 20.3 cm (8 in.). The existing P-154 subbase and the CBR 15 sandy subgrade from TC1 were left undisturbed. The cross-section of the TC2 pavement structure is shown on the right side of Figure 1. Each test lane was subdivided into three representative test sections, namely north, center, and south. The north and south sections were designated for rutting and fatigue experiments, respectively.
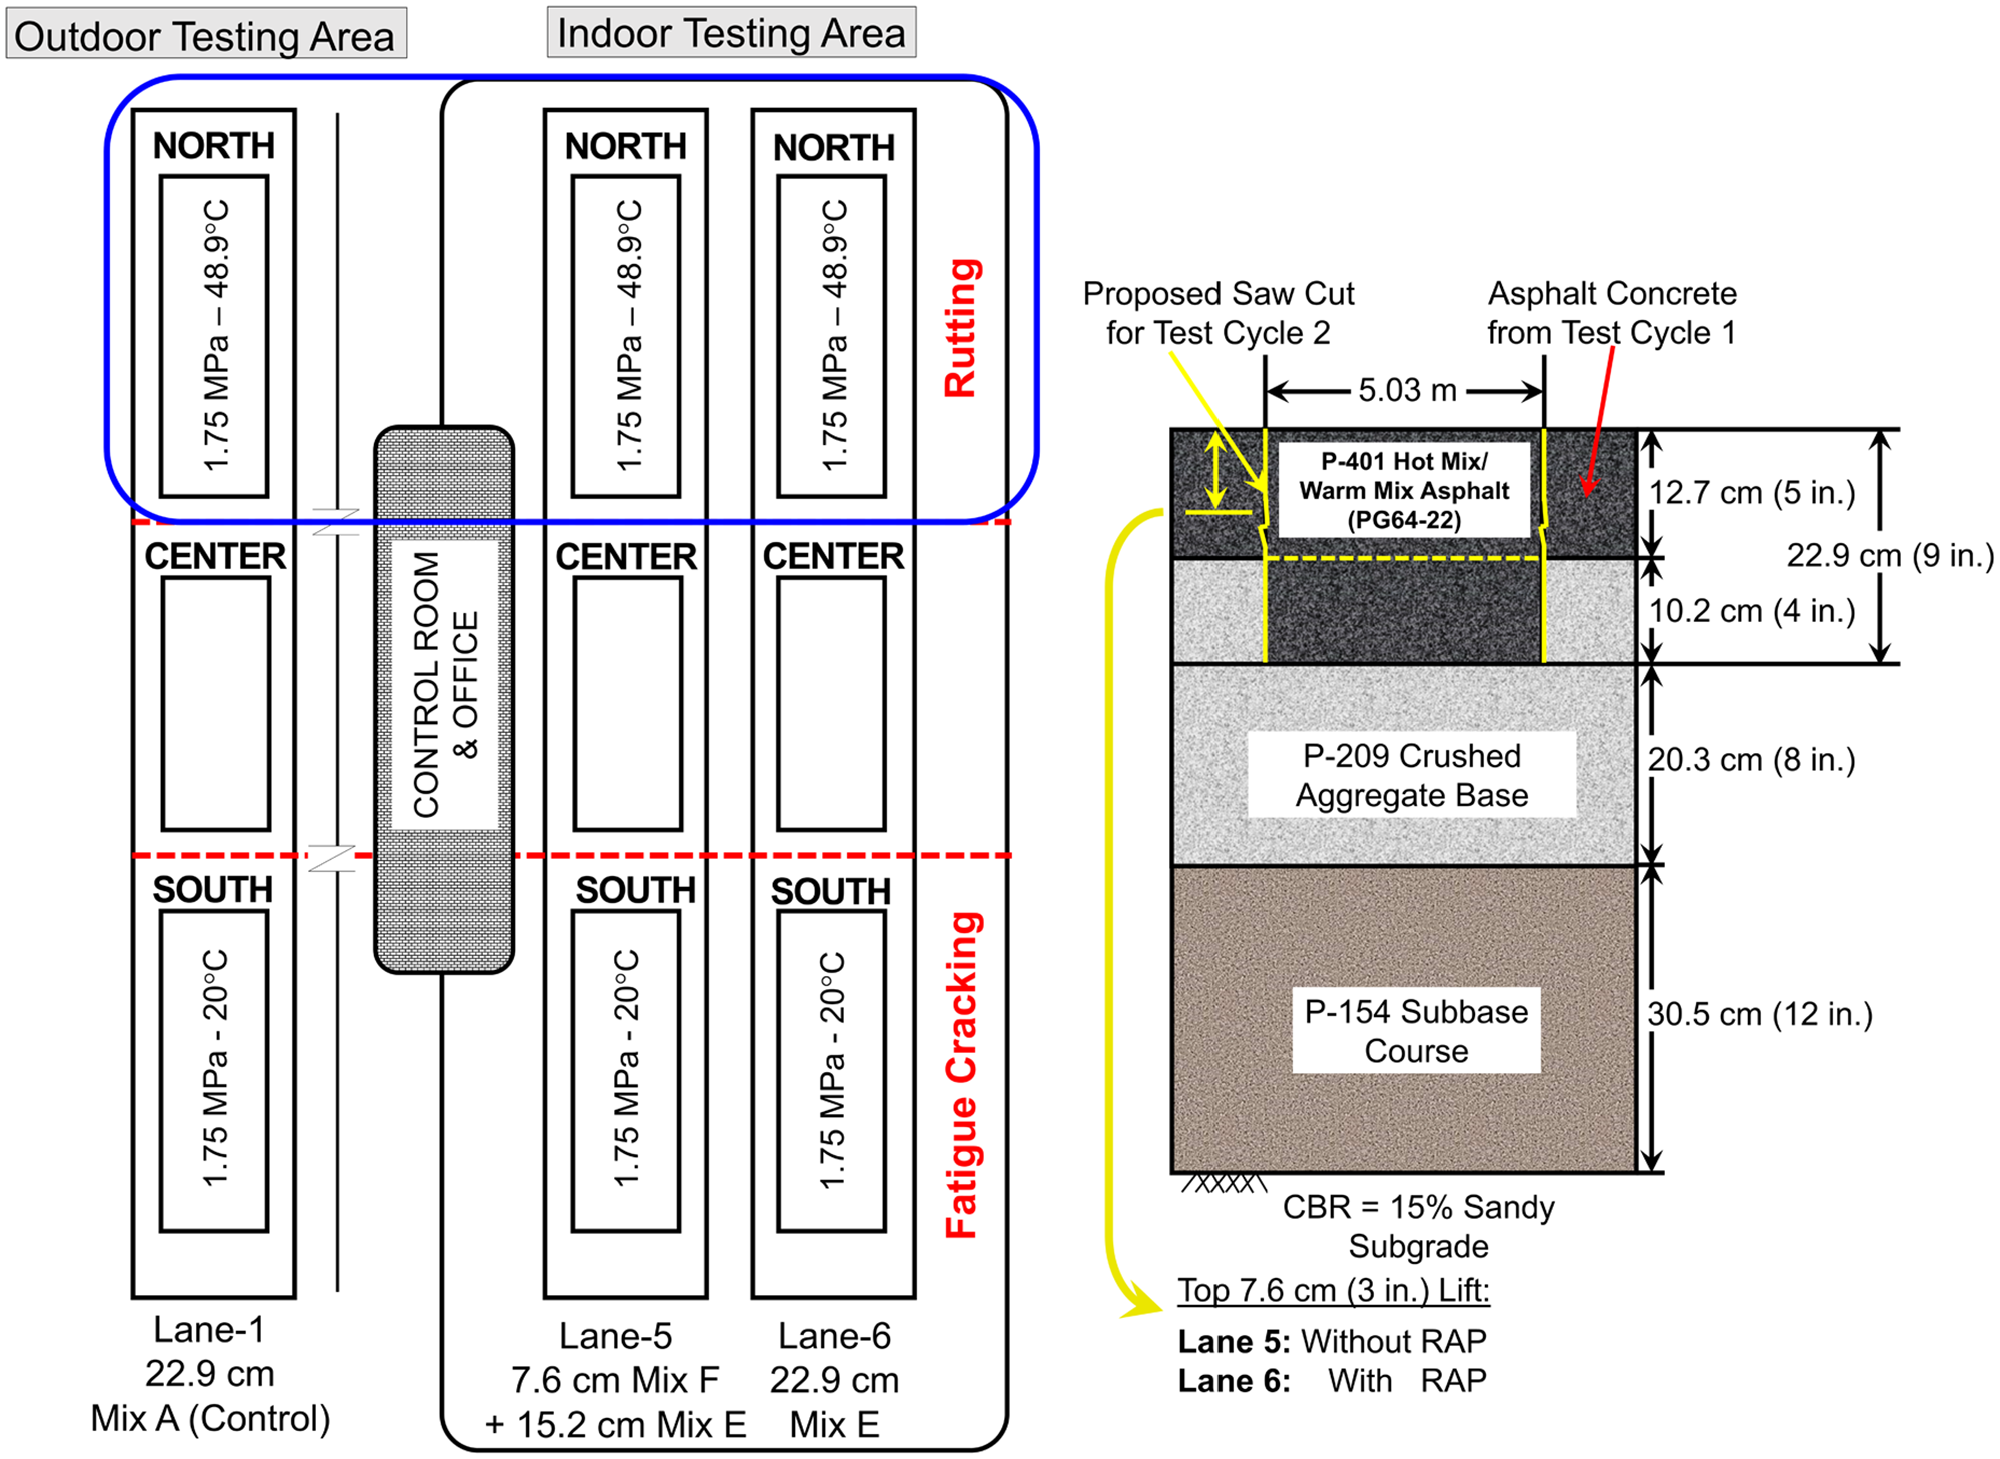
Layout and design of full-scale test sections.
Four outdoor and two indoor full-scale test lanes were paved with selected mixes and identical pavement structures during TC2 at NAPMRC. Lane 1 in the outdoor area was paved with a 22.9 cm (9 in.) thick polymer-modified PG76-22 HMA layer in three equal lifts. The bottom two lifts of indoor lanes 5 and 6 were paved with latex and organic additive-treated PG64-22 WMA consisting of 20% RAP. The same WMA without and with RAP were used to surface the top lifts of lanes 5 and 6, successively.
The control PG76-22 HMA, PG64-22 WMA–RAP, and PG64-22 WMA mixes were identified as mixes A, E, and F, respectively. Table 1 summarizes the job mix formula (JMF) of the selected mixes discussed in this paper. The optimized binder content of mixes E and F was 0.5% higher than that of the control mix. Notably, the organic warm mix additive used in this study was a paraffin wax obtained from coal gasification using the Fischer–Tropsch (FT) process. The additive beads were added to the binder in a molten state and blended with a normal paddle mixer before mixture production at the asphalt plant. Four percent latex by the weight of binder was added to both mixes E and F. The type of latex used for the WMAs was anionic, consisting of 62–66% ethynyl benzene polymer with 1,3-butadiene. 1% lime by the weight of aggregate was also introduced to the WMA–RAP mix to minimize the stripping potential.
Job Mix Formula of the Selected Test Cycle 2 (TC2) Asphalt Concrete (AC) Mixes
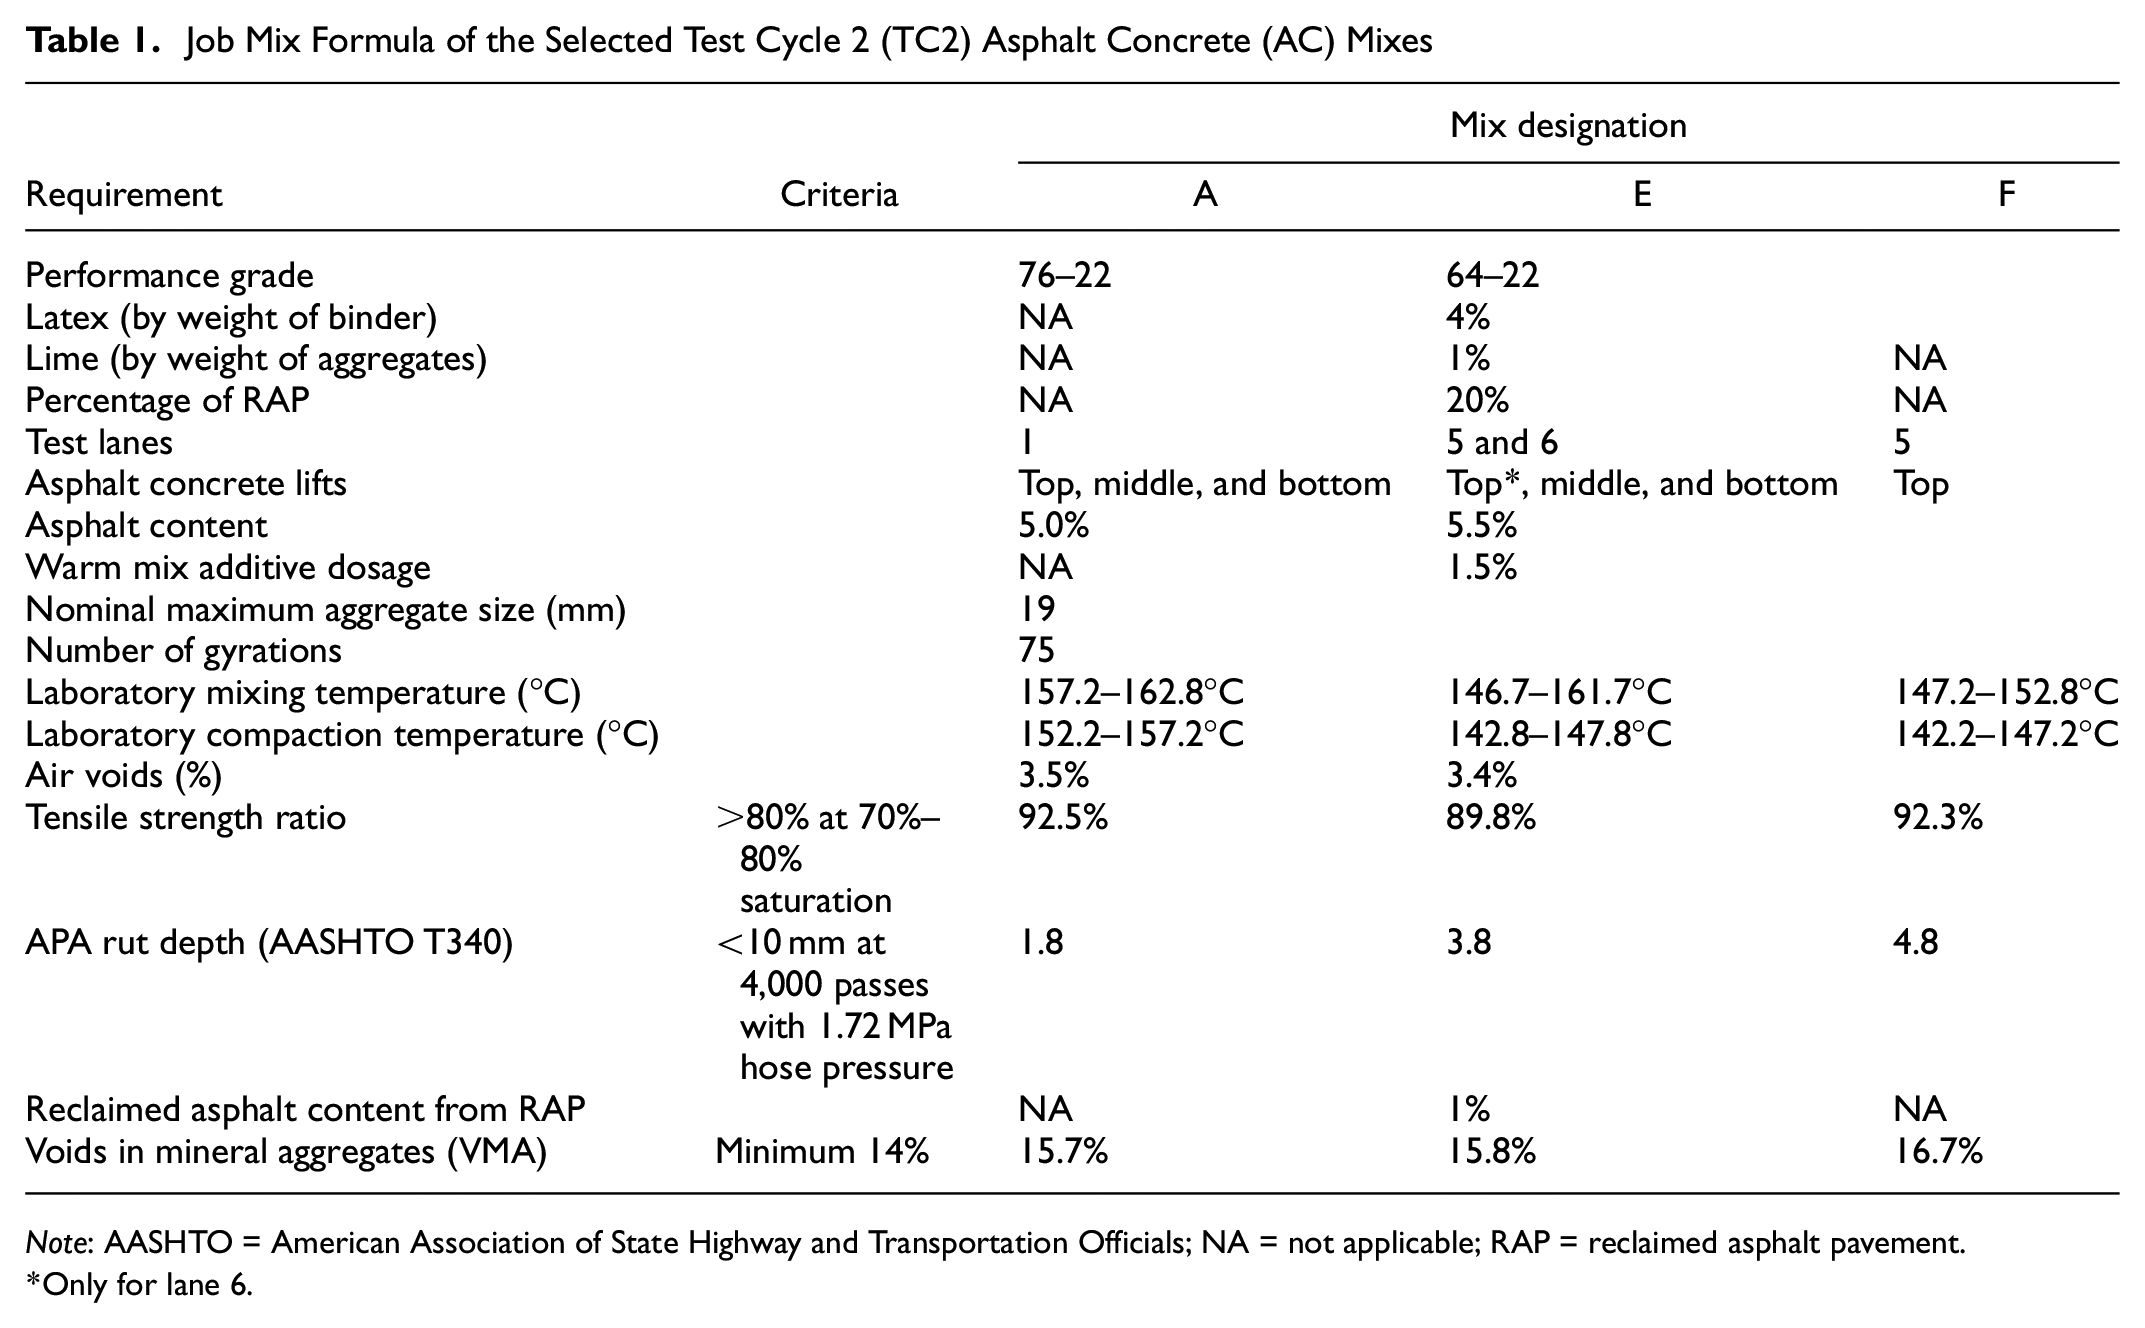
Note: AASHTO = American Association of State Highway and Transportation Officials; NA = not applicable; RAP = reclaimed asphalt pavement.
Only for lane 6.
Although the tensile strength ratios (TSR) for all the mixes were well above the designated threshold, the presence of aged binder made the RAP mix more brittle under the influence of moisture and resulted in a somewhat lower TSR value compared with those of the virgin mixes. However, the inclusion of RAP increased the rutting resistance of the PG64-22 mix with latex. Since RAP is a hydrogen-bound material, a slightly higher temperature is recommended for the production of warm mixes to avoid moisture-related damage ( 25 ). The same guideline was followed to produce the RAP mix. The PG64-22 WMA mix without RAP had slightly higher voids in mineral aggregates (VMA) than the other two mixes. All three mixes met the VMA criterion listed in the job mix formula.
In reference to the JMF design air void, the quality assurance (QA) test results during the placement of AC layers documented average air void contents of 3.9, 3.2, and 3.3% in the bottom two lifts of lanes 1, 5, and 6, respectively. The surface lifts of those lanes were reported to have average air voids of 2.5, 4.5, and 3.3%, successively.
A pilot study in Arizona documented the surface temperature of an asphalt pavement reaching 66.7°C (152°F) between 3:00 and 4:00 p.m. ( 26 ). Such an extreme temperature can push the limits of asphalt binder’s high-temperature performance grade. Mirza and Witzack (1995) developed a global aging prediction model encompassing 40 different field projects across Europe and North America ( 27 ). The model predicted stiffness gradient, accounting for aging and temperature effects. The researchers reported that the aging/stiffness gradient plateaued to a minimal level as the depth increased. Similarly, Shamborovskyy (2016) concluded that aging in airfield AC is minimal at depths greater than 2.5 cm (1 in.) ( 28 ). The experimental design of traffic tests should replicate the influence of high temperatures on rutting. On that note, TC1 rutting tests were conducted at a controlled temperature of 120°F (48.9°C), 5.1 cm (2 in.) below the surface. The TC2 north sections were trafficked at the same temperature for consistency in the evaluation of rutting susceptibility.
Layout of Instrumentation and Accelerated Pavement Testing
Unlike highways, aircraft gear geometry varies over a wide margin among different manufacturers and variants encompassing general aviation, narrow-body, and wide-body airplanes. Such wide variation in gear geometry has previously been proven to induce a normally distributed lateral loading in airfield pavements ( 29 – 31 ). Therefore, the incorporation of such laterally distributed moving wheel load is essential for the replication of in-service airfield loading conditions during the accelerated pavement tests. To this end, an approximately normal distribution of lateral wander was used to traffic the TC2 full-scale test sections, as shown in Figure 2. The designed wander pattern comprised 11 different wander tracks spaced 10.2 cm (4 in.) apart. A full wander sequence during the actual traffic tests consisted of 62 passes along those tracks. The total wander width including the tire imprint was 162.6 cm (64 in.). Track 0 is aligned with the pavement centerline, having a transverse offset of 91.4 cm (36 in.) from the extremum limit of HVS-A wander capacity (182.9 cm [72 in.]). The number of passes along a given wander track decreased with the increase in transverse distance from the wander centerline.
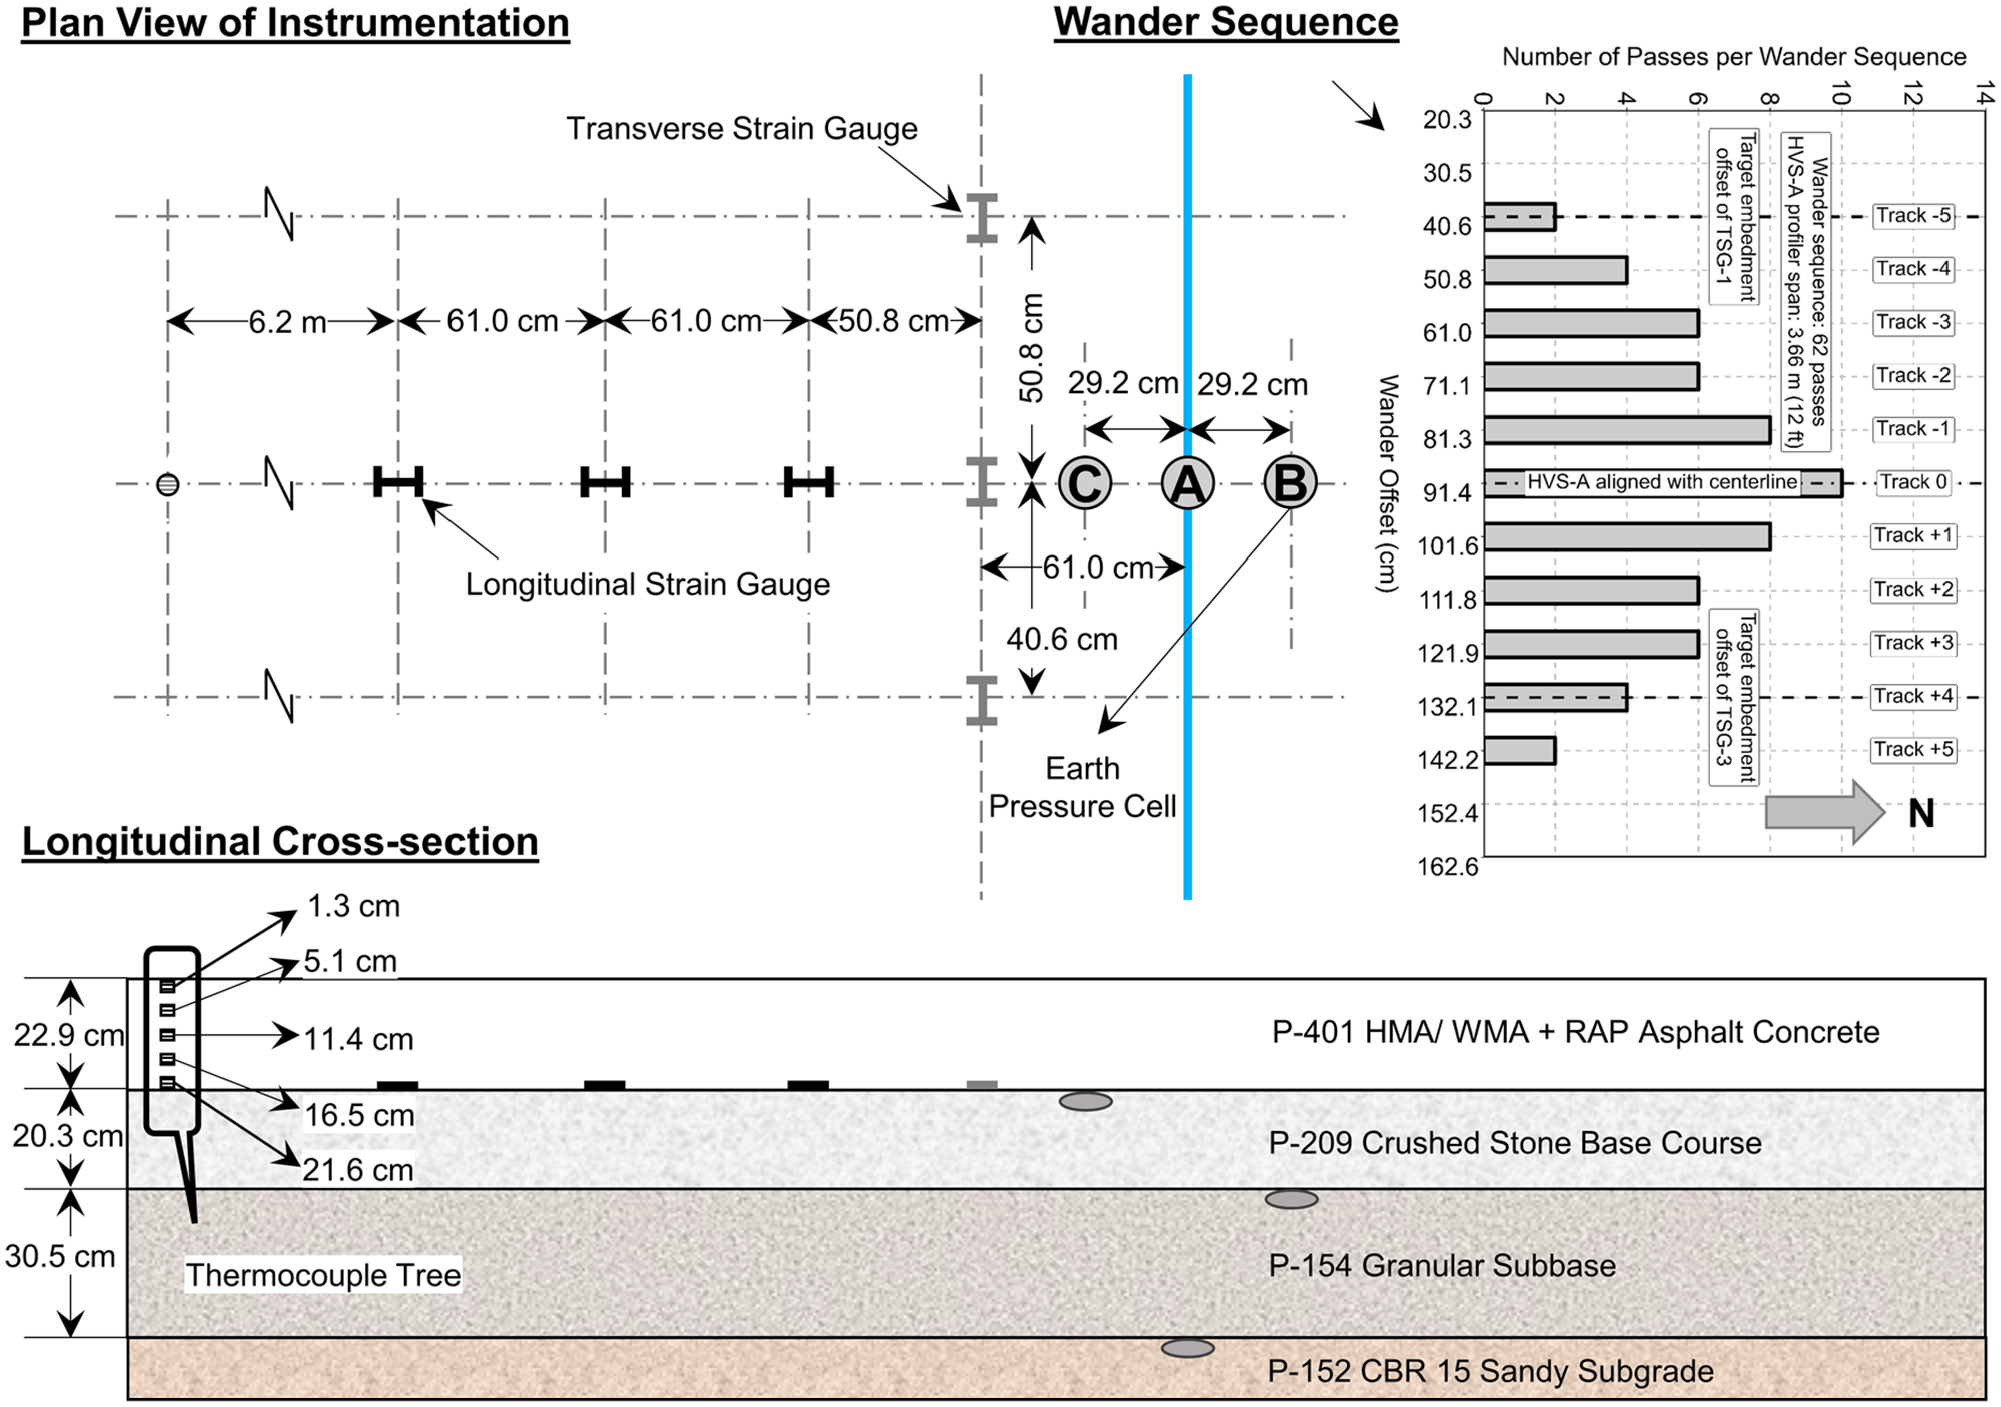
Pavement structure, layout of instrumentation and traffic wander pattern of test cycle 2 (TC2) north sections. Color online only.
Figure 2 shows the locations of the embedded sensors with respect to the wander tracks. All three longitudinal strain gauges (LSGs) and pressure cells (PCs) were installed along the transverse centerline aligned with Track 0. Transverse strain gauges TSG-1 and TSG-3 were placed beneath the AC approximately 50.8 and 40.6 cm away from the west and east sides of the centerline, while TSG-2 was installed along the centerline. The blue line intersecting PC-A identifies the transverse centerline of the test sections. Two other transverse blue lines were painted on the as-built pavement surface 3.05 m (10 ft) north and south of the transverse centerline, encompassing the area of instrumentation and rut measurement (color online only). Notably, PC-A, PC-B, and PC-C were installed on top of the subgrade, subbase, and base course at a center-to-center distance of 29.2 cm (11.5 in.). A thermocouple tree was also installed approximately 8.53 m (28 ft) away from the transverse centerline to monitor AC temperature. The thermocouple tree hosted five temperature probes at 1.3, 5.1, 11.4, 16.5, and 21.6 cm (0.5, 2.0, 4.5, 6.5, and 8.5 in.) depths from the pavement surface.
Functionality of the embedded sensors was evaluated before trafficking with response tests at three different load levels. The response tests were conducted with 22 bidirectional passes at a constant speed of 4.8 km/h (3 mph) along the 11 wander tracks at three incremental load levels of 89.0, 133.5, and 177.9 kN (20, 30, and 40 kips), respectively. The contact tire pressure was kept at 1.75 MPa (254 psi) for the three load levels. Notable observations from the response tests have already been covered in a previous publication ( 32 ). Functionality of the HVS-A wheel-mounted laser transducers was assessed via the surface elevation with three 5.1 × 5.1 cm (2 × 2 in.) wooden blocks along the three transverse blue lines described above. Relative change in elevations along those lines verified the functionality of the laser profiler and established the boundary of surface rut measurement. Surface elevations were measured before and after the response tests.
A 272.7 kN (61.3 kips) single wheel exerting 1.75 MPa (254 psi) contact pressure was used to conduct the traffic tests at the same speed as the response tests. Surface elevations were measured at designated intervals using an on-board profiler to monitor the accumulation of surface rut. Measured elevations were corrected for differential height and angle to create a 3-D surface map of the pavement. Surface elevations measured after the response tests were subtracted from those recorded after a given number of passes. Normalized deformations recorded within the designated blue boundaries were then averaged, and the maximum depression or deformation from the theoretical zero transverse profile was defined as the measured surface rut at the corresponding number of passes. Additional details on the operational procedure and surface rut estimation with the HVS-A laser profiler can be found elsewhere ( 10 ).
Comparative Performance
Rutting Observations
Surface elevations recorded after the response tests and overall rutting accumulation in the respective test sections are shown in Figure 3a and b , respectively. The north sections of indoor lanes paved with RAP mixes performed slightly better than that of the TC2 control lane with polymer-modified hot mix in the outdoor area. Current FAA construction specification does not allow RAP in the surface course. Contrary to that regulatory constraint, TC2-L6N with 20% RAP in the surface mix outperformed the other sections withstanding 684 passes before reaching the rutting failure criterion of 2.5 cm (1 in.). Considering the aging sensitivity near the AC surface area, presence of a hardened oxidized binder might have acted as a grade bump for the latex treated neat binder mix resulting in the least amount of surface rut in TC2-L6N section. Absence of RAP in the surface lift of TC2-L5N might have led to lower resistance to rutting compared with lane 6 counterpart.
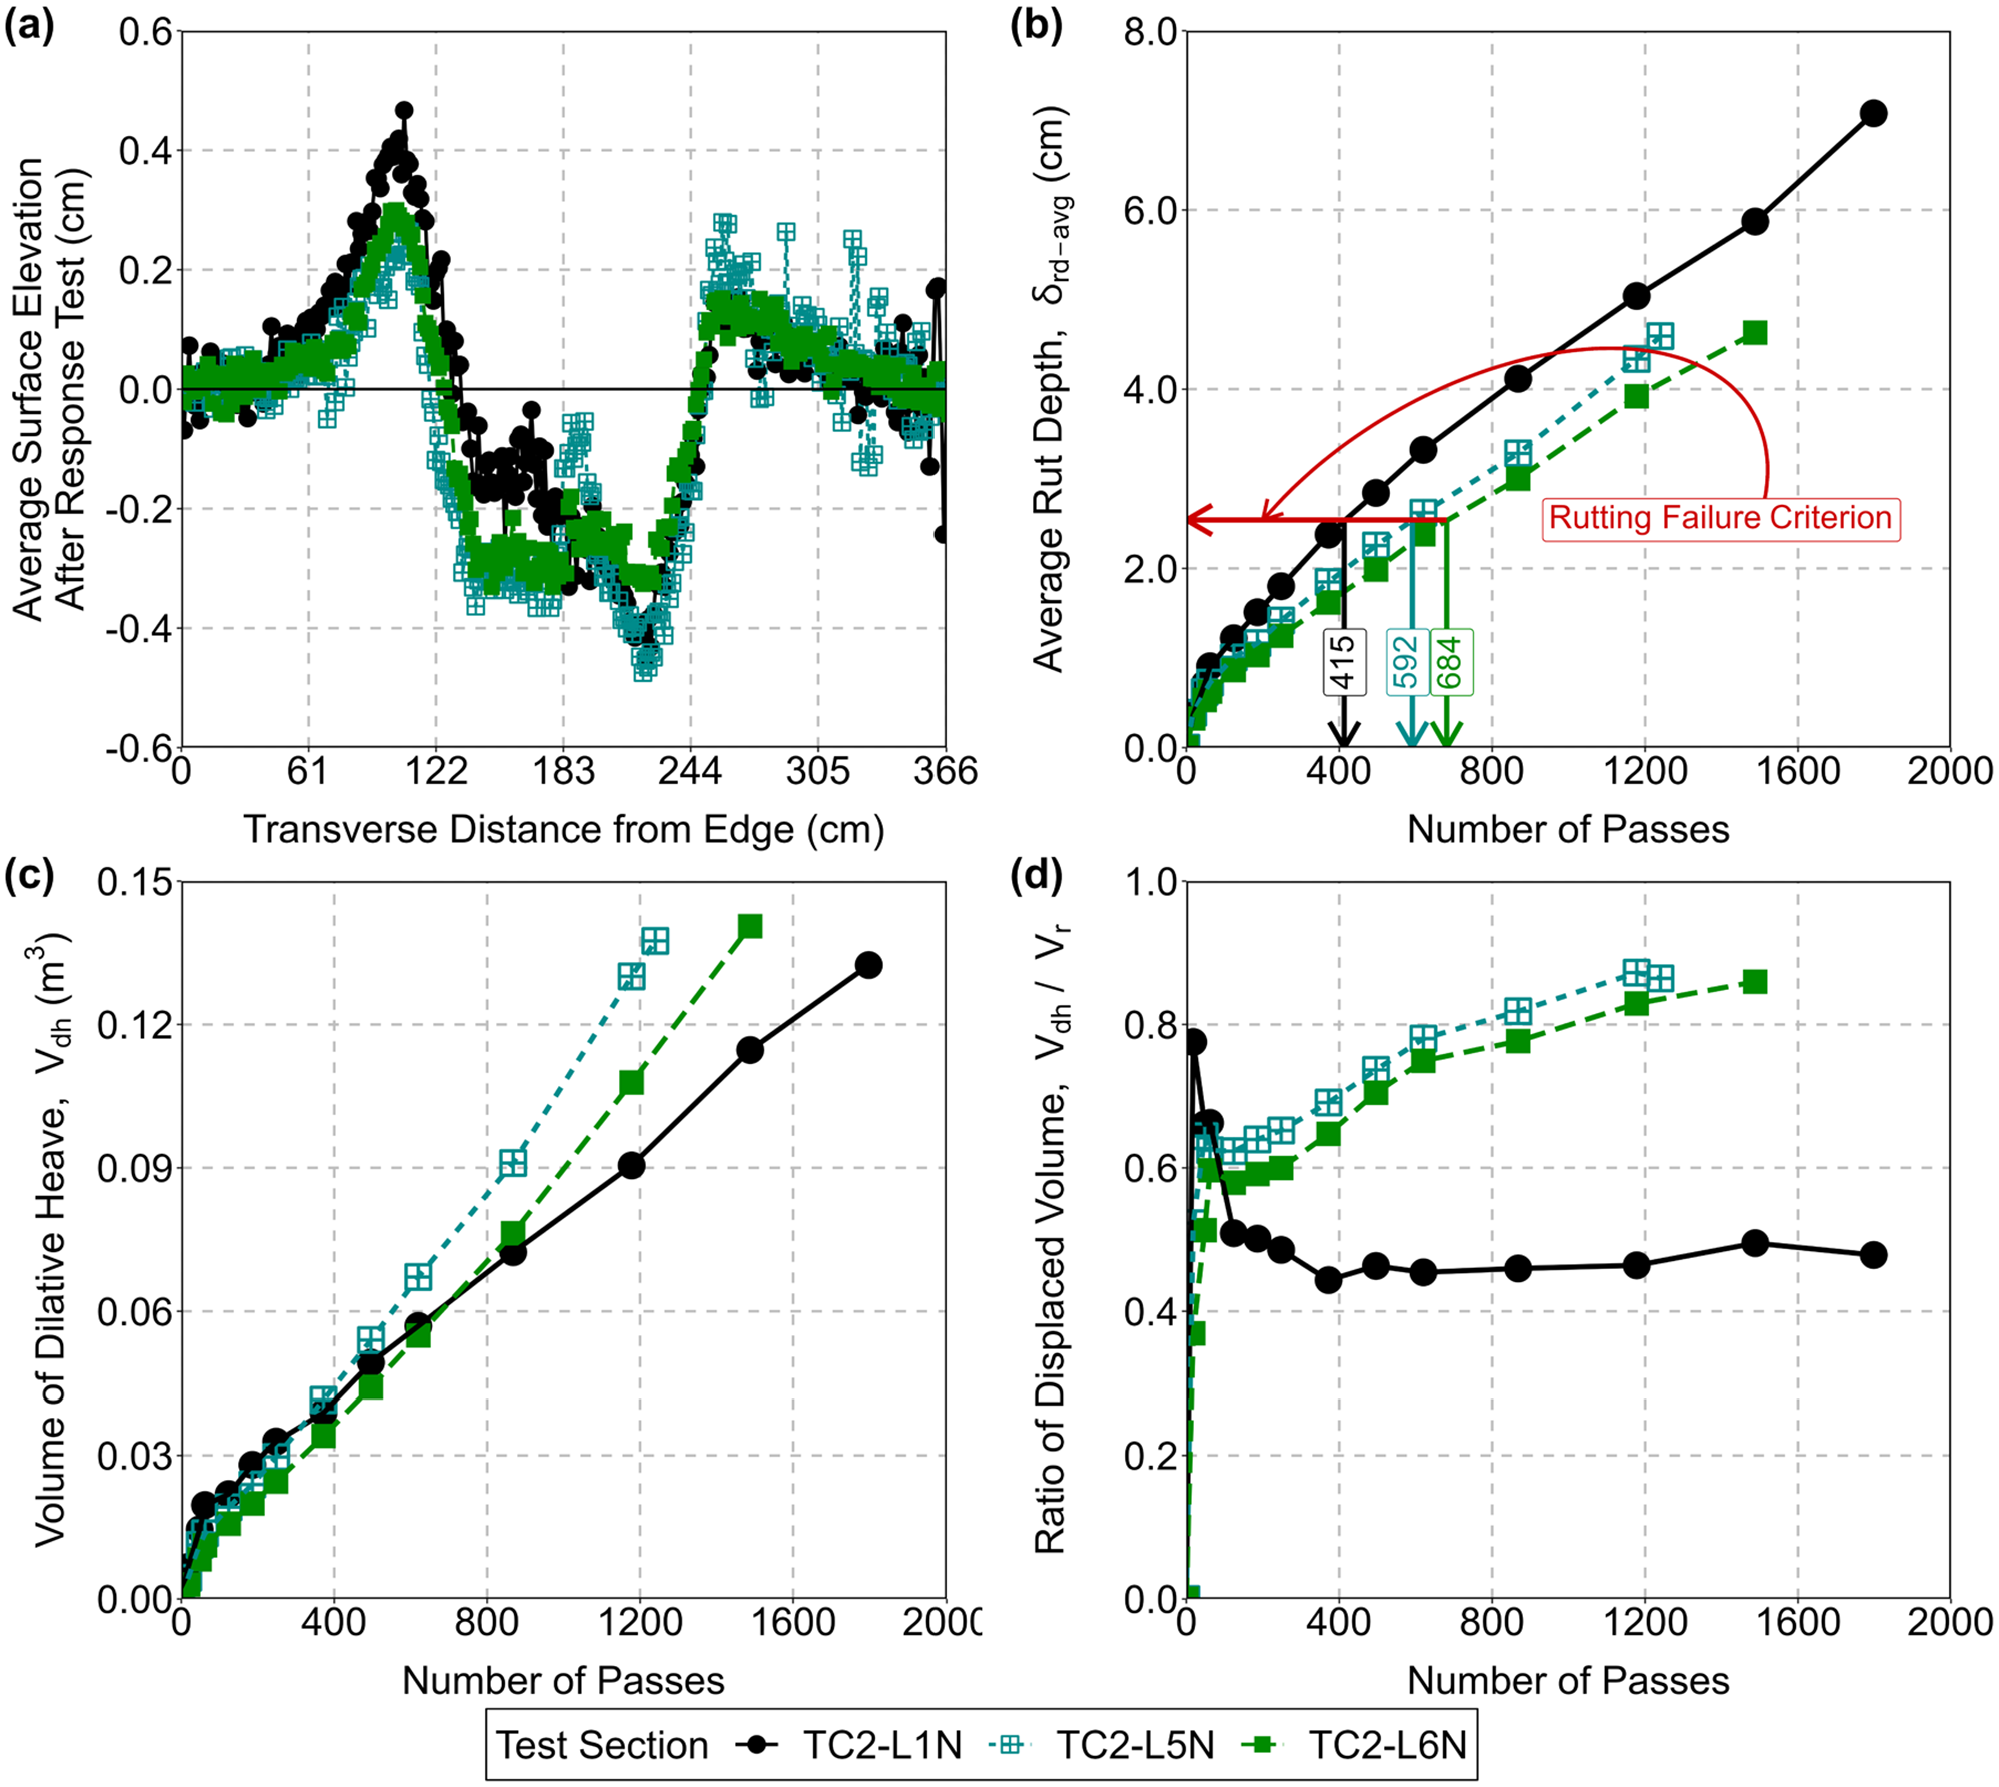
Comparison of (a) post-response test transverse profile, (b) surface rut accumulation, (c) volume of dilative heave, and (d) percentage of dilative heave among test sections TC2-L1N, TC2-L5N, and TC2-L6N.
The airfield AC layer encounters significant shearing during high-speed turning, braking and slow-rolled taxiing. Rutting in AC has previously been linked to the shear strength of respective mixes ( 33 ). Lower shear strength coupled with lateral wander can induce substantial dilative heave on the sides of the wheel path. To this end, the volume of dilative heave and ratio of displaced volumes during the traffic tests are summarized against the number of passes in Figure 3c and d , respectively. Although the RAP mixes in lanes 5 and 6 initially exhibited a lower magnitude of dilative heave, the extent of dilatancy in those two lanes increased consistently at the later stage of traffic tests.
The ratio of displaced volume is defined as the ratio between the volume of dilative heave and the volume of surface rut above and below theoretical zero transverse profile. The ratio of displaced volume exhibited a similar trend compared with the progression of the dilative heave. The ratio steadily increased with the increment in the number of traffic passes in lanes 5 and 6 north sections. Conversely, the ratio of displaced volume in TC2-L1N increased at the initial stage and quickly stabilized to a plateau value in the later stage of trafficking. The observations from dilative heave can be attributed to the thinner as-built AC layer in TC2-L5N and TC2-L6N test sections compared with that in the control section TC2-L1N. Notably, the average as-built thicknesses of AC layer in TC2-L1N, TC2-L5N and TC2-L6N within the rut measurement area were recorded to be 23.1, 22.5 and 21.2 cm (9.1, 8.9 and 8.3 in.), respectively. Polymer modification and higher production temperature in control mix could have also contributed to the lower accumulation of surface upheaval in TC2-L1N compared with the indoor north sections with PG64-22 WMA–RAP mix in the bottom two lifts.
Distribution of Traffic Test Temperature
Since the traffic tests were conducted over the span of mid-summer to late fall season of 2019, the ambient temperature differential during the traffic tests might have influenced the rutting accumulation and corresponding material properties. Considering this, measured temperatures at five different depths of the respective test sections were closely examined. Figure 4 highlights the overall distribution of pavement temperatures at five different depths among the test sections in statistical box plots. The outer edges of each box represent the 25th and 75th quartiles of the temperature distributions, whereas the black line and the red dot inside the box identify the median and mean values of the corresponding temperature distributions. Since the mean and median values of the observed temperature distributions did not always align with each other, the distributions of temperatures could be assumed to be skewed (not normally distributed). Accordingly, grouped nonparametric Wilcoxon tests were conducted to assess whether recorded temperatures at individual depths of the TC2-L1N, TC2-L5N, and TC2-L6N test sections were statistically different or not. Statistical significance, as highlighted with asterisks on the top of Figure 4, indicates that the measured temperatures at all depths among the three test sections were statistically different from one another. The four asterisks denote a p-value less than 0.0001, rejecting the null hypothesis of having no temperature difference across all depths. Overall, pavement temperature decreased with increase in depth below 5.1 cm (2 in.). Temperatures recorded in the TC2-L6N were generally higher than those recorded in the remaining sections, regardless of the depth. The temperature probe installed at 5.1 cm (2 in.) from the surface in TC2-L1N malfunctioned and could not be used for comparison in the boxplot. Temperatures recorded 16.5 and 21.6 cm (6.5 and 8.5 in.) below the surface in the TC2-L5N test section were lower than those recorded at the same depths in the other two test sections.
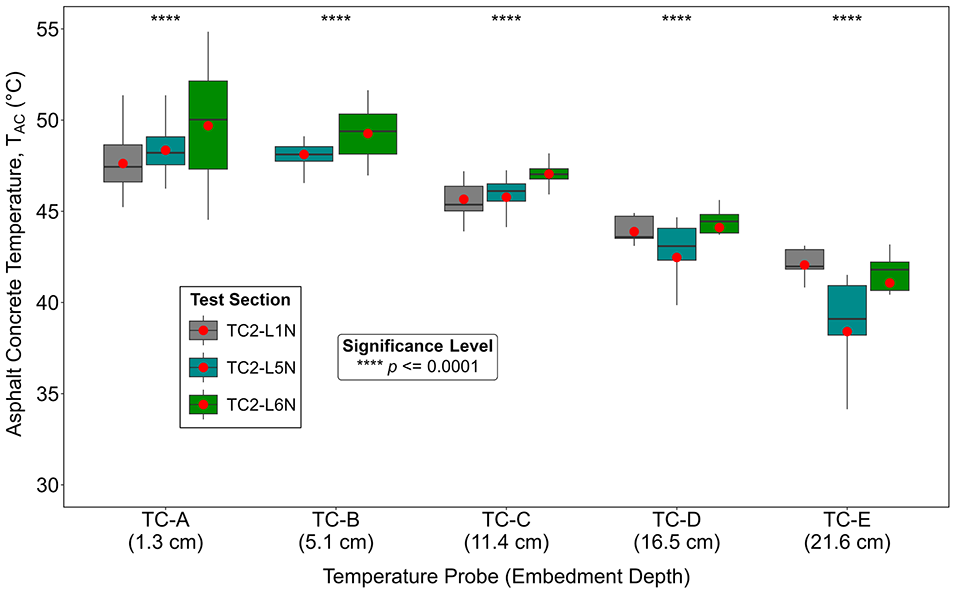
Distribution of asphalt concrete (AC) temperature in TC2-L1N, TC2-L5N, and TC2-L6N test sections.
Distress Mapping in Asphalt Concrete
All TC2 test lanes were designed to have the same pavement structure, where the temperature-induced rutting distress was anticipated to be constrained to the surface layer only. Considering this, the rutting distress in the AC layer was closely examined once trafficking was terminated in all test sections. To achieve this, a total of 15 cylindrical cores with a diameter of 22.9 cm (9 in.) were extracted along the center blue line over the transverse width of the HVS-A profiler. Notably, the HVS-A profiler measures the surface elevations over a transverse width of 365.76 cm (12 ft). The extracted field cores were sliced in equal halves. The sliced field cores were minutely examined to make a qualitative assessment of rutting in the individual lifts of AC. In addition, the split cylindrical cores were assembled chronologically and photographed for illustration. Figure 5 shows the photographs of split cores from the TC2-L1N, TC2-L5N, and TC2-L6N test sections. Rutting was more severe in the top two lifts compared with the bottom one in all test sections. The AC cores from TC2-L1N, TC2-L5N, and TC2-L6N exhibited a minimal degree of consolidation in the bottom lift. Overall, material displacement and surface upheaval stemming from internal shearing were qualitatively proportional to the number of traffic passes.
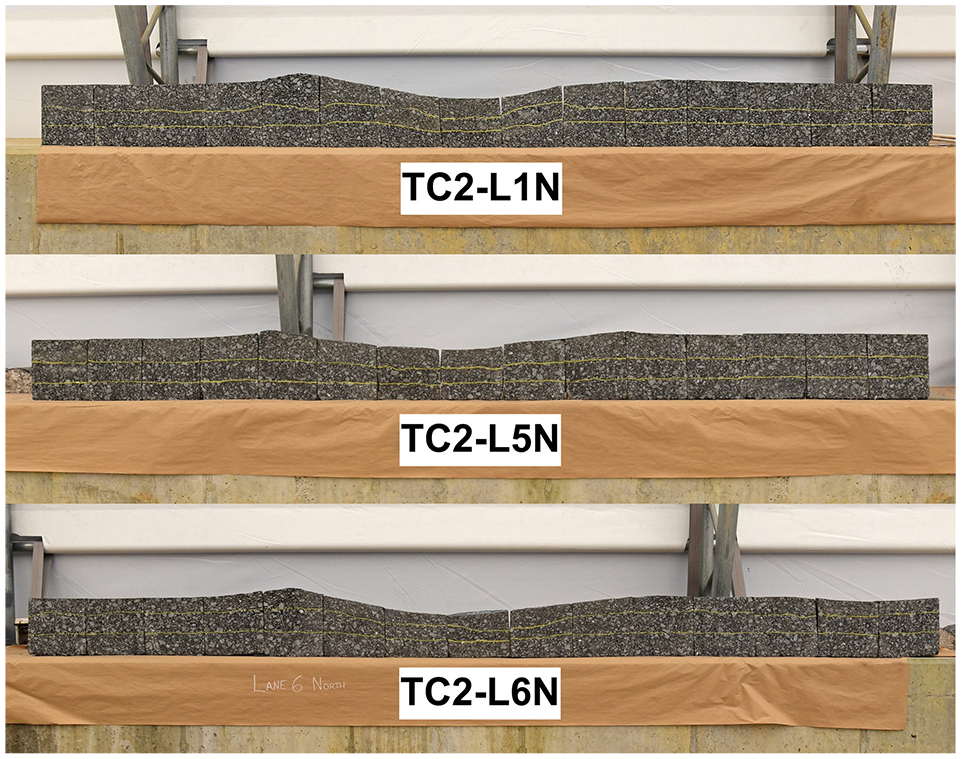
Photographs of rutting distresses in the individual lifts of asphalt concrete (AC) in TC2-L1N, TC2-L5N, and TC2-L6N test sections.
Aside from photographic records, the thicknesses of the individual cores were measured at four locations on the cut faces, evenly spaced 7.6 cm (3 in.) apart. The measured thicknesses of the post-traffic field cores were subtracted from the as-built thicknesses of the AC layer for a quantitative assessment of rutting in the individual pavement layers. The estimated thickness deviations from the three test sections are plotted with the last surface rut profiles taken before the termination of traffic tests in Figure 6. Surface rut profiles and thickness deviations from the TC2-L5N and TC2-L6N test sections were aligned with one another. However, the magnitude of the surface rut was higher than that of the thickness deviation in the control section. This indicates that the higher number of traffic passes in TC2-L1N compared with the remaining sections might have affected the underlying base course and contributed to rutting in the crushed stone base alongside the AC.
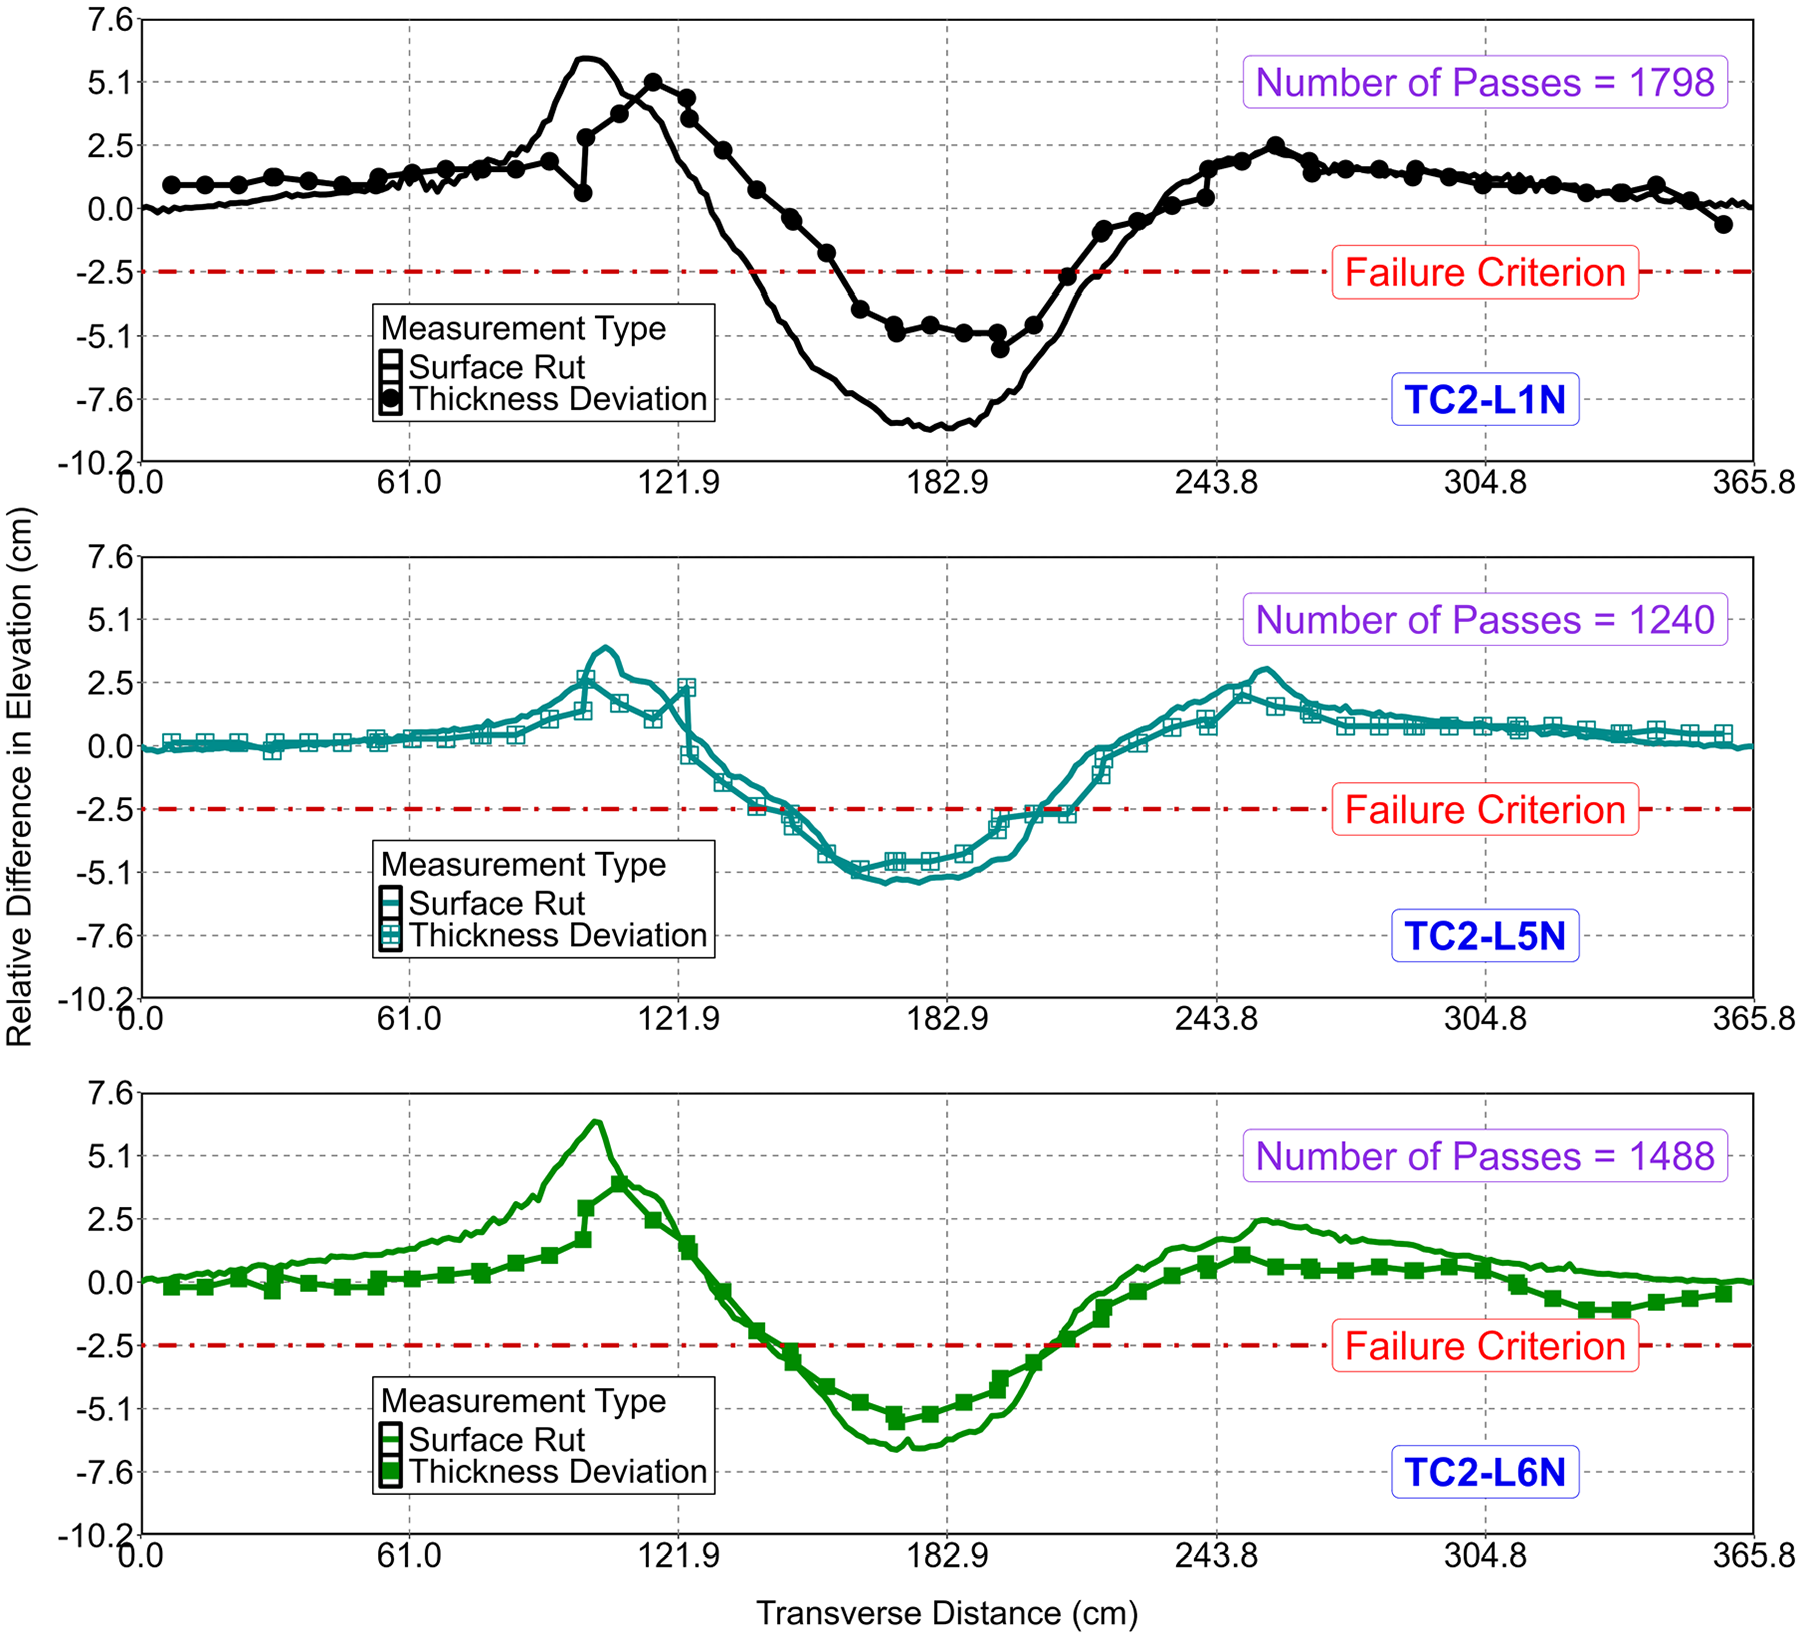
Comparison of surface rut and deviations from as-built thicknesses in TC2-L1N, TC2-L5N, and TC2-L6N.
Laboratory Characterization and Mechanistic Analyses
Dynamic Modulus Tests
Conventional uniaxial dynamic modulus tests were conducted on post-construction field cores at four different temperatures (−10, 4, 21, 37°C [14, 39.2, 69.8, 98.6°F]) and six different frequencies (25, 10, 5, 1, 0.5, 0.1 Hz) following the American Association of State Highway and Transportation Officials (AASHTO) T342 standard specifications. Note that the dynamic modulus specimens were prepared from the top two lifts of the extracted field cores. Dynamic moduli recorded at different frequencies and temperature ranges were fitted to the Hirsch model ( 34 , 35 ) using the time–temperature superposition principle to accommodate a simple interpretation of the time–temperature-dependent behavior of AC mixes used in TC2. Considering the traffic test temperature, the reference temperature was set to be 48.9°C (120°F) for time–temperature superposition. Figure 7a to c summarize the dynamic moduli, phase angle master curves, and the black space diagram (dynamic modulus versus phase angle plot) of the field cores extracted from lanes 1, 5, and 6. The air voids of the extracted field cores are listed alongside the lane and mix designations in the legend of Figure 7.
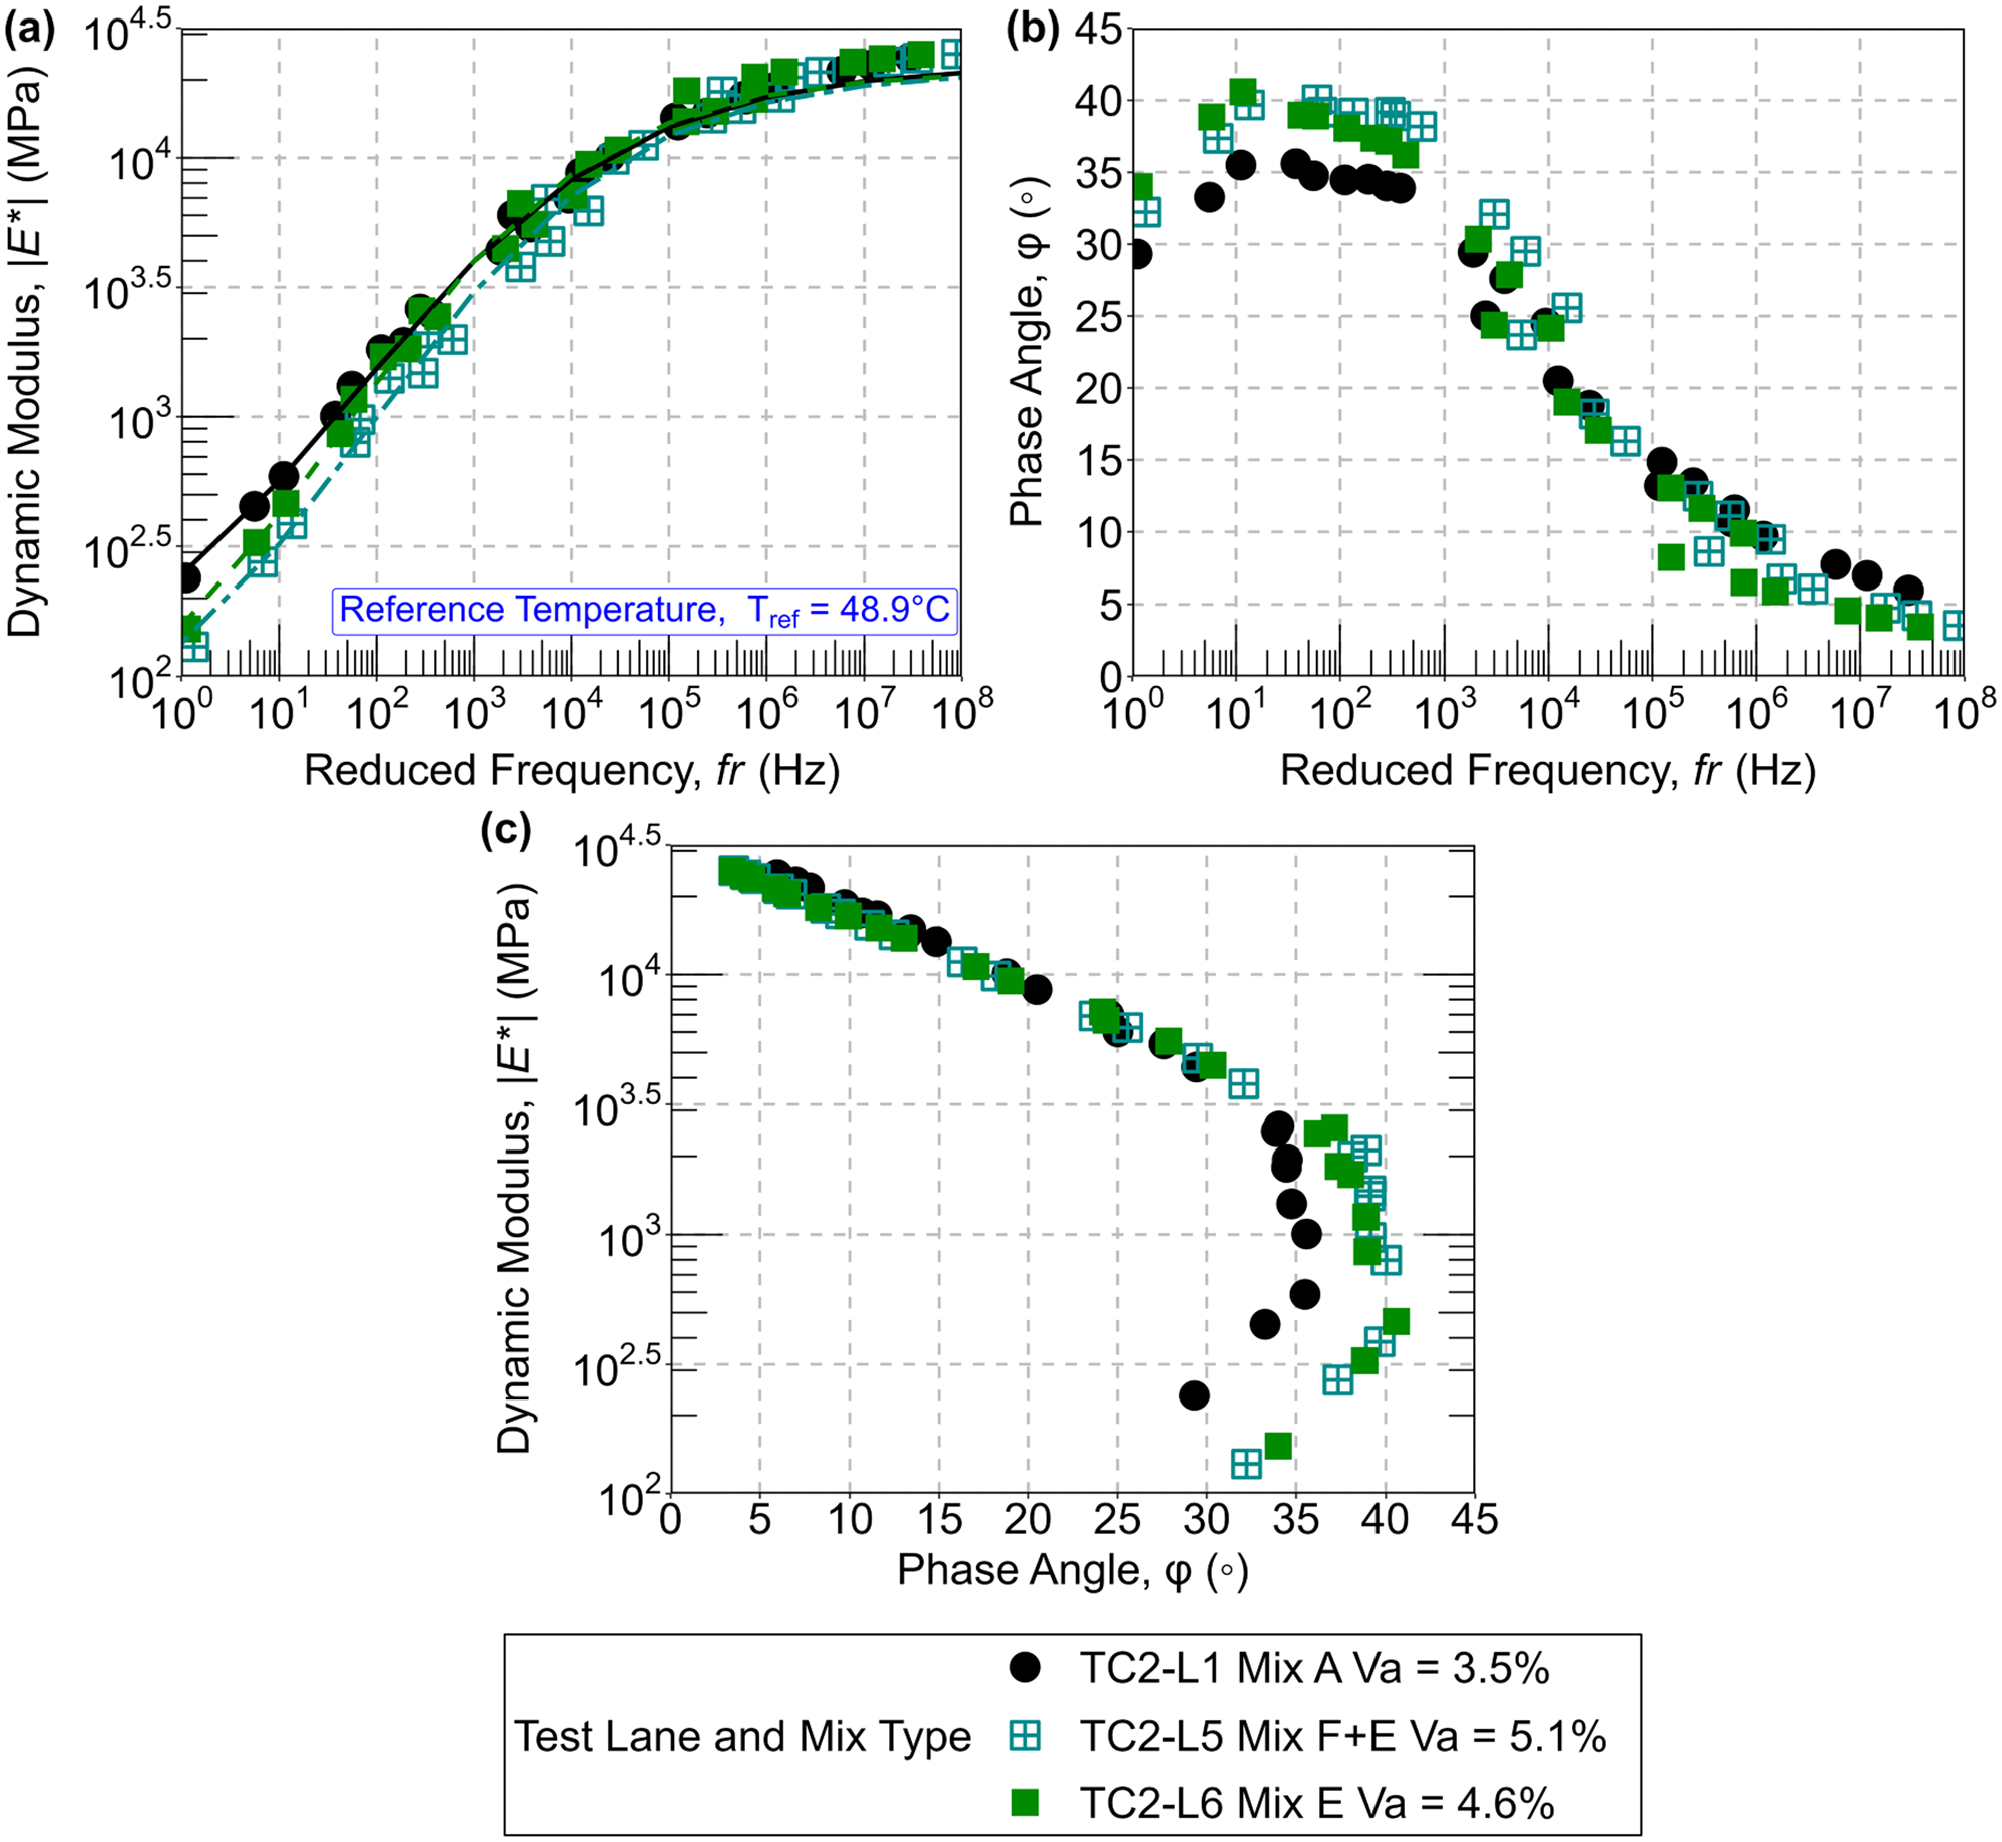
(a) Dynamic moduli, (b) Phase angle master curves, and (c) Black space diagram of extracted field cores from lanes 1, 5, and 6.
Lane 5 field cores with PG64-22 WMA in the top lift had the highest average air void, and that contributed to consistent lower dynamic moduli compared with their counterparts. Inclusion of RAP into the PG64-22 WMA resulted in slightly higher modulus values than those recorded with the polymer-modified control mix at low temperatures and high frequencies. However, the effect of polymer modification on mixture performance was evident from the lowest dynamic moduli of PG 64-22 WMA in lane 5 at intermediate and high temperatures. A higher dynamic modulus at a lower phase angle is generally indicative of cracking susceptibility. On the other hand, lower dynamic modulus at a relatively higher phase angle relates to rutting potential. Based on these indications, the PG64-22 WMA (mix F) is somewhat susceptible to rutting under the influence of high temperature and tire pressure. However, the overall impact was likely to be minimal since only the surface lift of lane 5 consisted of that mix. The bottom two-thirds of the AC had the same mix with 20% RAP. The higher modulus values of RAP mix corroborate the relative difference in number of passes to reach the threshold of rutting failure during traffic tests.
The transition from asphalt binder-dominated behavior to aggregate skeleton-governed behavior can be identified through the peak of the phase angle master curve. Oxidation-induced aging leads to a decrease in phase angle and an increase in elasticity. Thus, the binder-dominated phase can be extended over a longer range of frequencies ( 36 ). Such a phenomenon can be demonstrated via a leftward shift in the phase angle master curve and skewed left-downward mobilization of the black space diagram ( 36 ). The observed trends in Figure 5b and c did not corroborate the effect of aging associated with RAP definitively. Further, the extent of asphalt blending between the neat binder and the oxidized binder from the RAP is not known. Such disparity may be attributed to the difference in binder grade, presence of latex, as well as production and paving temperatures among selected mixes. Notably, the hot mix was plant-produced at an approximate temperature of 165.6°C (330°F), whereas the warm mixes were produced at about 140.6°C (285°F). According to the embedded thermocouple data, the maximum temperatures recorded during the placement of top lifts in lanes 1, 5, and 6 were 130.6, 111.1, and 126.1°C (267, 232, and 259°F), respectively. Higher production and paving temperatures of the control mix might have offset the influence of RAP-induced aging on the dynamic moduli of lanes 5 and 6.
Daniel et al. (2013) reported that the addition of RAP decreased the phase angle at frequencies beyond the peak phase angle and vice versa ( 35 ). As the phase angle master curves approached the peak phase angle, field cores consisting of RAP mixes from lanes 1 and 5 exhibited higher phase angles than those of the field cores from lane 1 control mix. At higher frequencies well past the peak, the control mix field cores exhibited a higher phase angle than their RAP mix counterparts, conforming to the observation documented by the aforementioned study.
The effect of polymer modification was evident from the disparity in phase angles. The phase angles of field cores with PG64-22 WMA from lanes 5 and 6 were substantially higher than those of the field cores with PG76-22 HMA from the outdoor control lane, indicating more elastic behavior. The PG64-22 WMA was anticipated to exhibit higher rutting than the control PG76-22 HMA owing to the lower dynamic moduli at high temperatures and low frequencies. However, the presence of aged binder in RAP and limited exposure to the environment might have a pseudo-stiffening effect and contributed to the comparable rutting performance of the selected mixes.
3D Finite Element Analyses with PANDA-AP
The mechanistic analysis presented in this paper focuses on the prediction of linear viscoelastic responses since no RCRT-VS test was conducted to derive the nonlinear viscoelastic parameters. Although PANDA-AP can simulate cyclic stresses similar to the traffic test loading conditions in the designated test sections, the accumulation of permanent deformation with respect to the increase in number of cycles would not have been accurate without the required viscoplastic material characteristics. The dynamic modulus properties described above were used to determine the Prony series coefficients required for the finite element analyses. The current version of PANDA-AP internally optimizes the mesh of 8-node brick elements for convergence with reasonable accuracy and computational expense. The width and length of the tire were assigned to be 406 and 383 mm (16 and 15.08 in.). Notably, the tire imprint from the HVS-A wheel indicated a width of 406 mm (16 in.). The length was estimated to maintain the contact pressure of 1.75 MPa (254 psi). Tire contact stress distribution has not yet been implemented in the current version of the software. Similarly, stress-dependent behavior of coarse- and fine-grained subsurface materials will likely be integrated into the future versions of the PANDA-AP software. Since all three sections had the same subsurface layers, the elastic moduli of the base, subbase, and subgrade were assigned to be 517, 276, and 155 MPa (75, 40, and 22.5 ksi), respectively. Individual layer thicknesses for the respective test sections were assigned based on as-built construction records. The selected moduli values fell in the median range of the measured resilient modulus of the aforementioned materials. As shown in Figure 4, the AC temperature varied with depth in all three test sections during the traffic tests. Therefore, the finite element analyses were conducted at target, average measured temperature at mid-depth, and average measured temperature at the bottom of AC layers in the designated test sections. Recording the entire spectrum of loading history for numerous loading cycles can entail a huge amount of data and be computationally expensive. Considering the implications and limited scope of the LVE responses, the finite element analyses were conducted with two cycles, and associated responses in the as-built test sections were compared.
Comparison of Critical Pavement Responses
Figure 8 shows the contour plots of predicted surface displacements for TC2-L1N, TC2-L5N, and TC2-L6N test sections. Based on the scales adjacent to the contour plots, the predicted maximum displacement in TC2-L1N was substantially lower than those recorded in the indoor north sections. Absence of polymer modification and RAP in the surface lift contributed to lower dynamic modulus at high temperatures and low frequencies in TC2-L5N field cores. That was reflected in the highest displacement among the three test sections. Contrarily, hardened binder in RAP increased the stiffness of the AC in TC2-L6N and resulted in lower displacement than that in TC2-L5N despite having the thinnest AC layer.
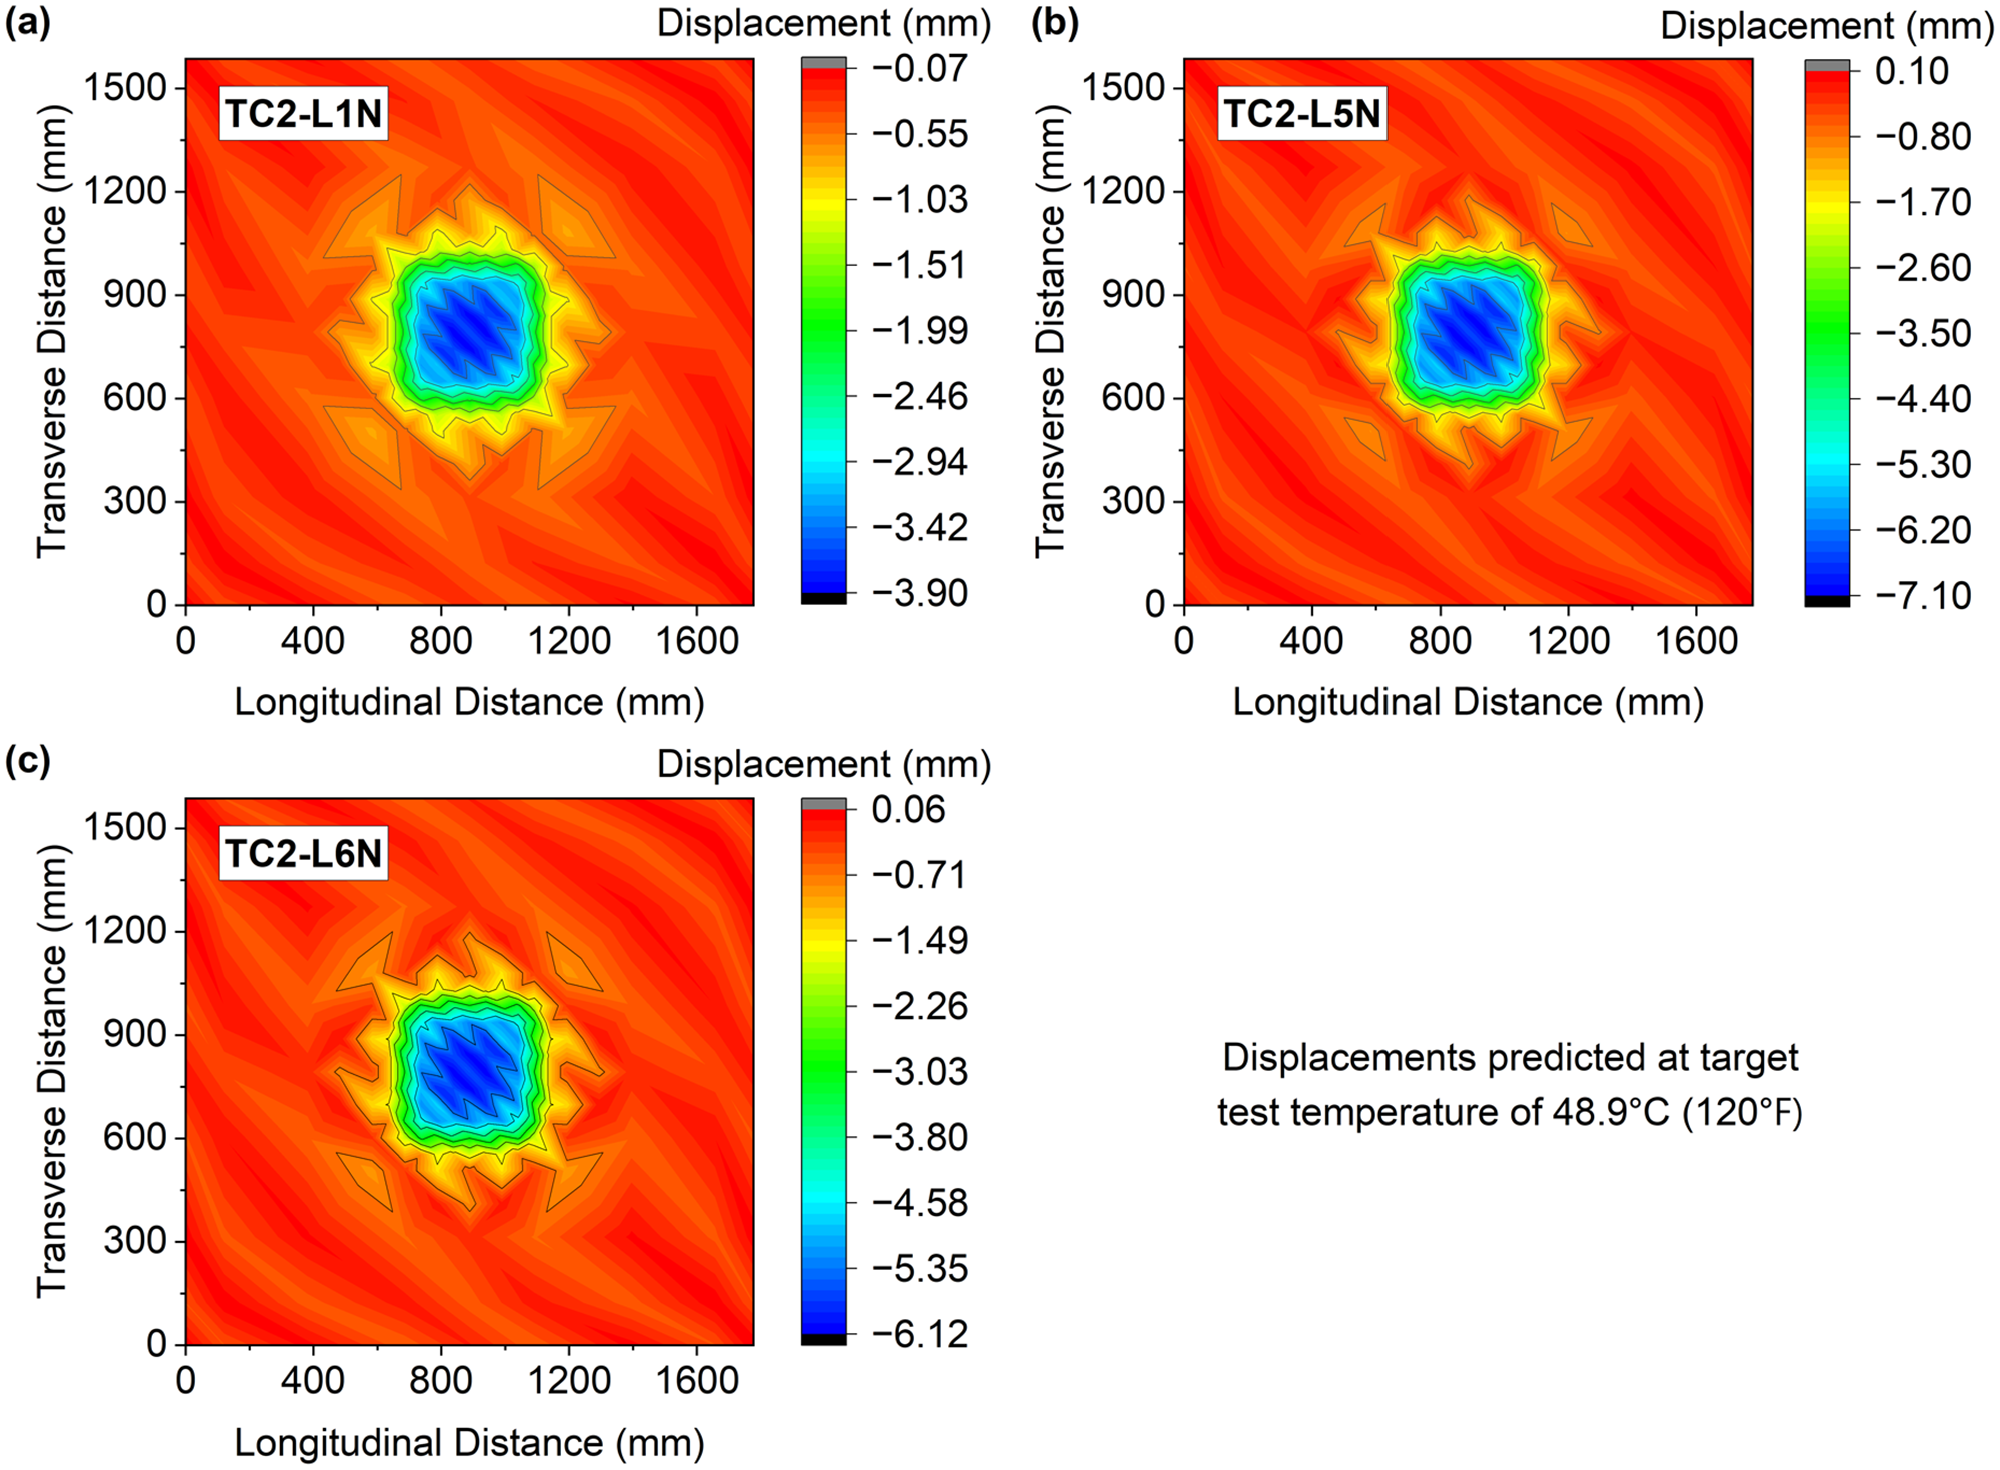
Surface displacements predicted by PANDA-AP in (a) TC2-L1N, (b) TC2-L5N, and (c) TC2-L6N test sections.
Figure 9a and b show the predicted tensile strains in the three test sections along the x- and y-axes at three temperatures. Figure 9c plots the maximum tensile strains recorded during the traffic tests against corresponding number of passes. Variation in those strains with respect to the temperature at the bottom of AC layer is shown in Figure 9d. Similar to the observations from LVE displacements, predicted strains in TC2-L5N superseded the predicted tensile strains in the other two test sections. Predicted tensile strains along the y-axis were consistently higher than those along the x-axis regardless of the test sections. Observations from the traffic tests corroborated the trends in predicted strains from PANDA-AP as the peak tensile strains in TC2-L5N exhibited higher sensitivity to temperature compared with those recorded in TC2-L1N and TC2-L6N. TC2-L1N exhibited noticeably lower predicted and measured tensile strains compared with the other two test sections. Overall, the magnitudes of predicted strains were comparable with those documented during the traffic tests.
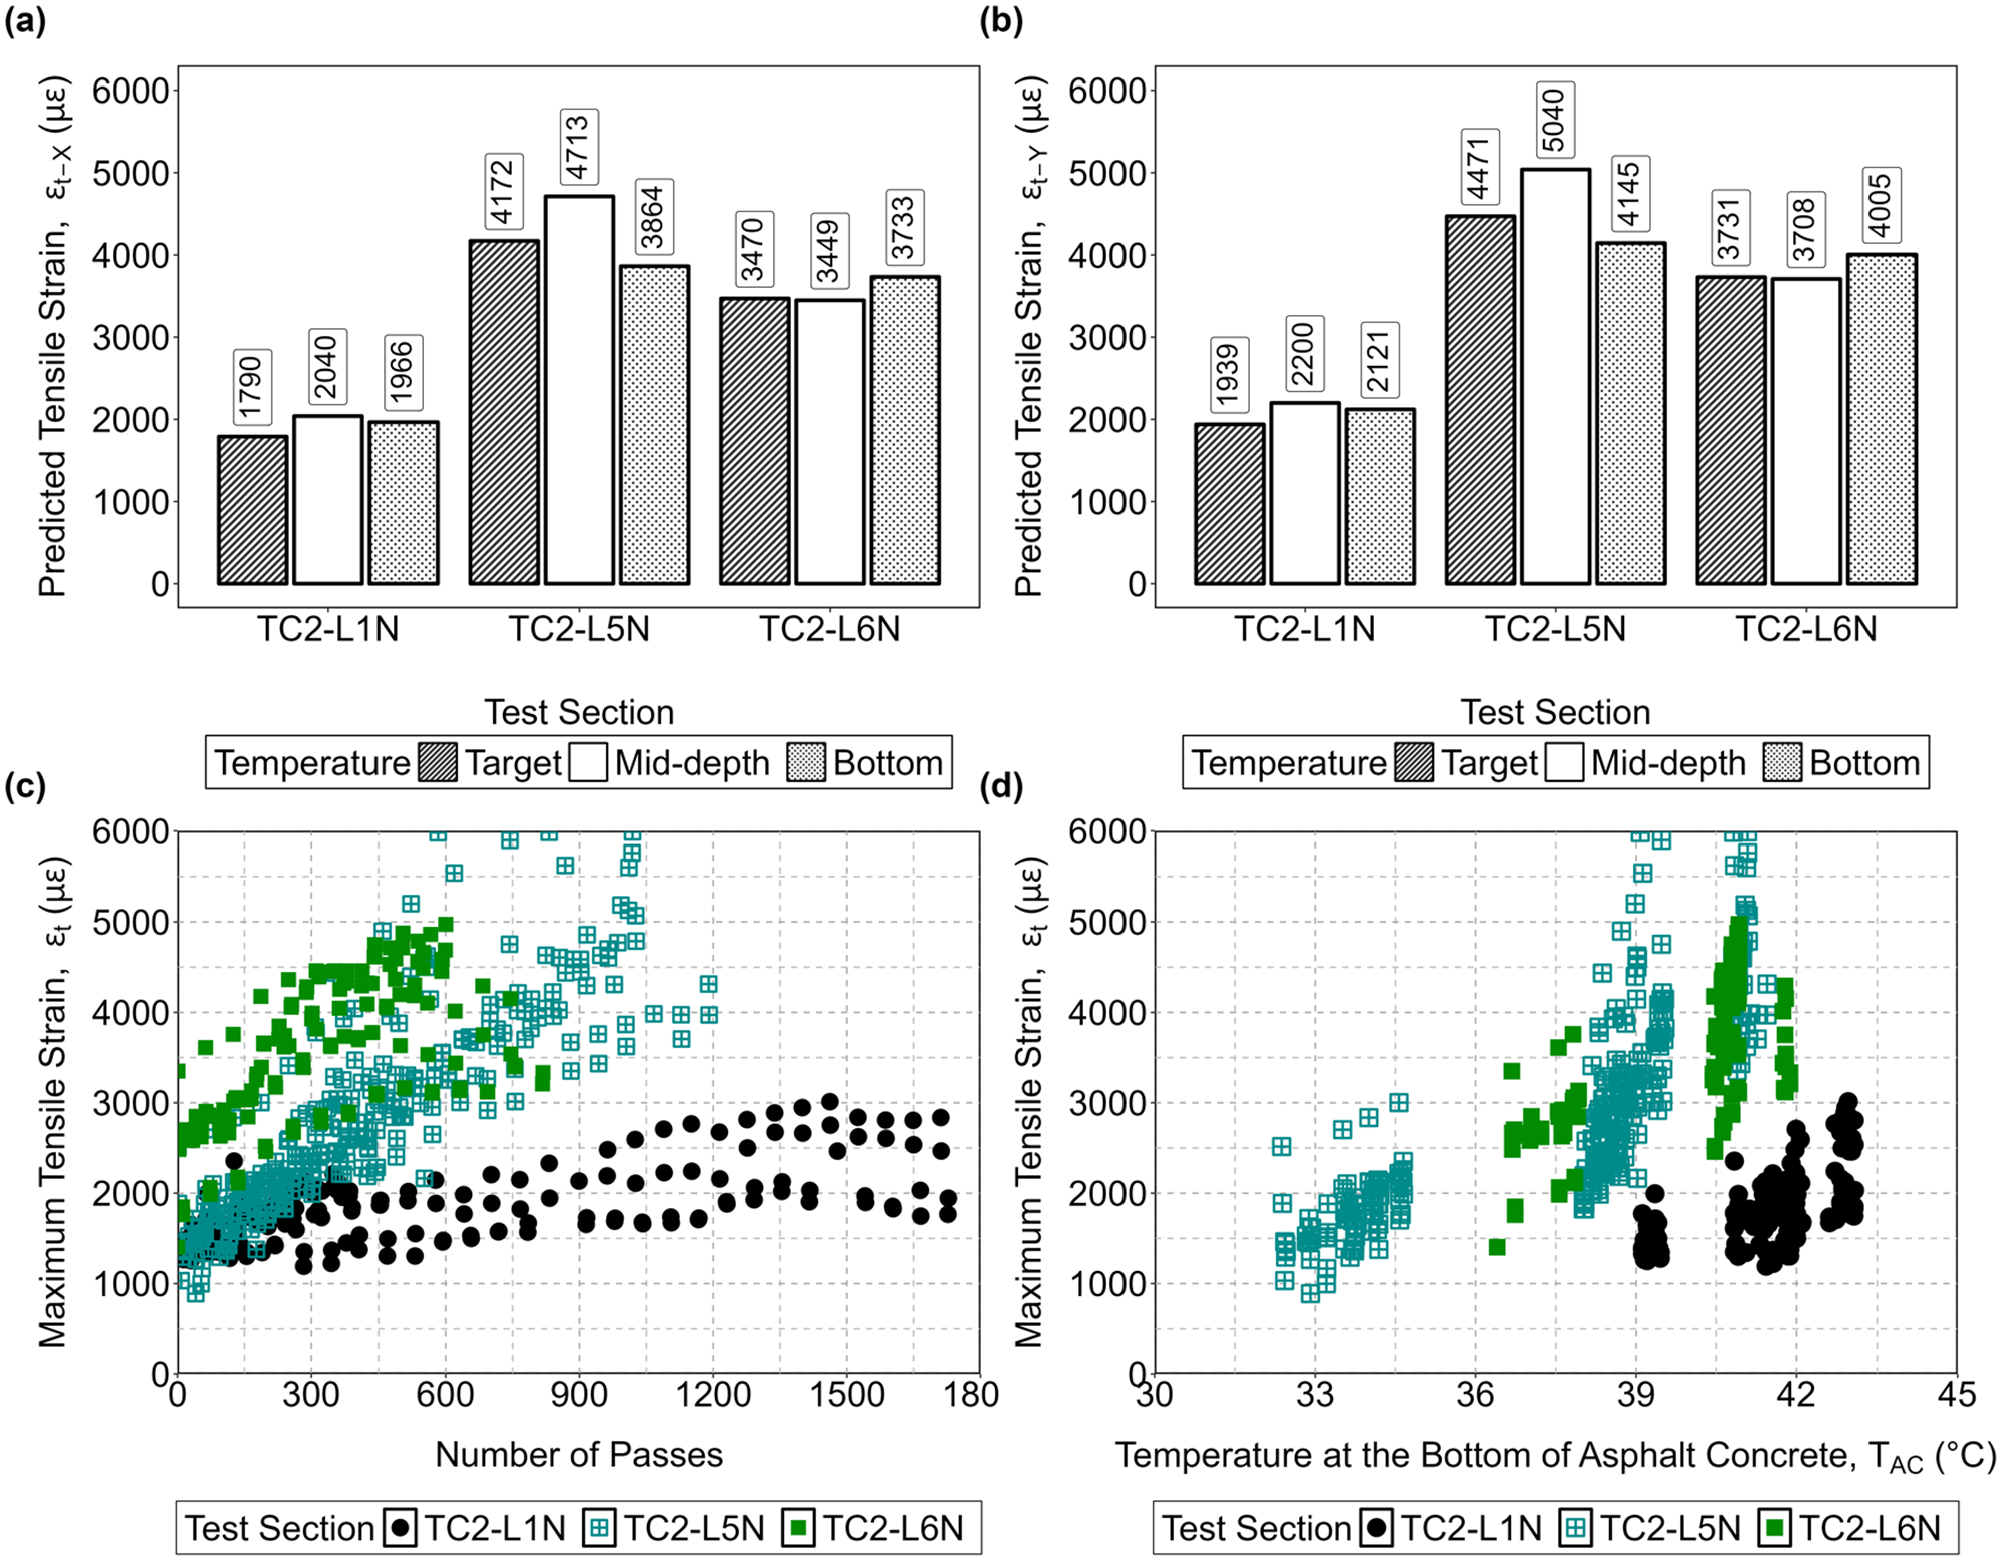
(a) Predicted tensile strains along x-axis, (b) Predicted tensile strains along y-axis, (c) Measured tensile strains with transverse strain gauges, and (d) Variation of measured strains with temperature at the bottom of asphalt concrete (AC).
As shown in Figure 4, temperatures recorded at 1.3, 5.1, 11.4, and 16.5 cm depths of AC in TC2-L6N were consistently higher than those recorded in TC2-L1N and TC2-L5N throughout the traffic tests. Higher traffic test temperatures might have surpassed the benefits of including RAP in the latex-treated WMA. As opposed to the predicted strains presented in Figure 9a and b , lower AC stiffness associated with the higher traffic test temperatures resulted in higher tensile strains in TC2-L6N compared with the remaining test sections, as shown in Figure 9c. Figure 7 showed that the polymer-modified control mix exhibited higher dynamic modulus at high temperatures and low frequencies during the dynamic modulus tests. That’s why tensile strains recorded in TC2-L1N were consistently lower than those recorded in TC2-L5N. The effect of binder modification can also be substantiated through the higher sensitivity of measured tensile strains to temperature in the AC layers of TC2-L5N and TC2-L6N than that in the PG76-22 HMA of TC2-L1N.
Figure 10a and b show the predicted compressive stresses on top of the granular subbase and sandy subgrade, respectively, for the target and mean temperatures recorded at the mid-depth and bottom of AC layers. Figure 10c and d plot the compressive stresses recorded on top of the granular subbase and subgrade, consecutively, against the corresponding number of passes. Note that stresses exerted on top of the base course repeatedly exceeded the maximum capacity of the embedded pressure cells during the traffic tests. Therefore, the measured base course stresses were not reliable enough for comparison with the PANDA-AP predicted stresses. Considering this, measured stresses on top of subbase and subgrade were considered for comparison only.
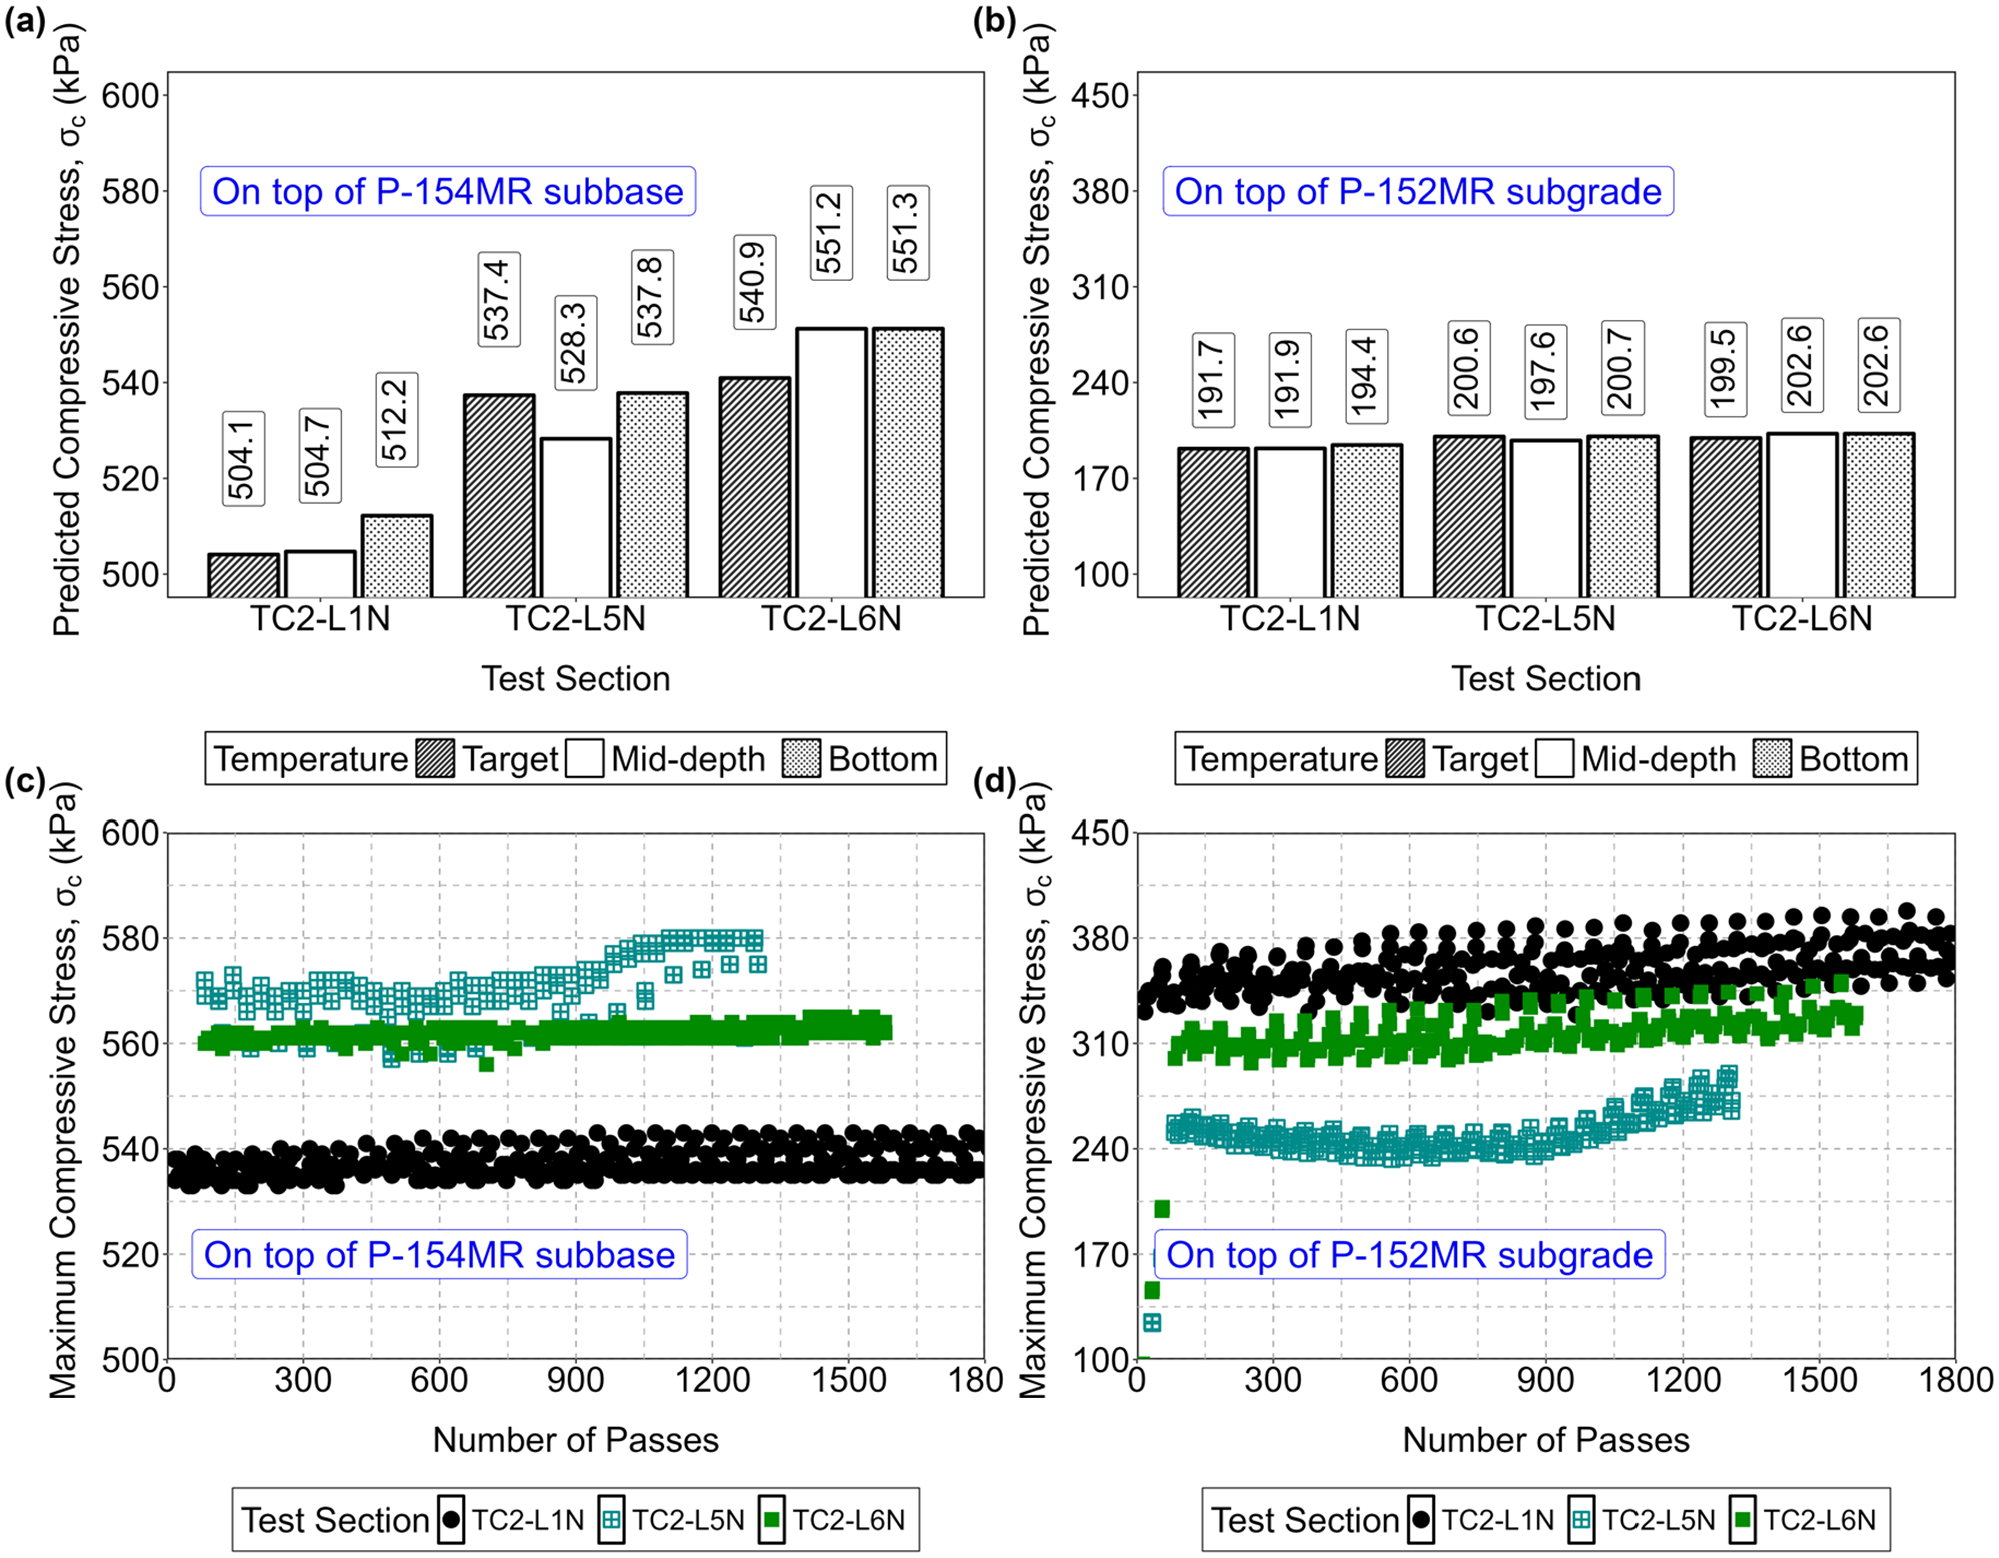
(a) Predicted compressive stresses on top of granular subbase, (b) Predicted compressive stresses on top of sandy subgrade, (c) Measured compressive stresses on top of granular subbase, and (d) Measured compressive stresses on top of sandy subgrade.
TC2-L1N paved with PG76-22 HMA consistently exhibited lower compressive stresses on top of the granular subbase compared with the other two sections with neat binder mixes. Despite having a similar binder grade, relatively higher stiffness associated with RAP contributed to somewhat lower compressive stresses in TC2-L6N compared with TC2-L5N. However, this trend was not reflected in the predicted stress responses. This could be attributed to the higher AC temperatures at mid-depth and bottom of AC from the traffic test records used during the PANDA-AP analyses. Contrary to the measured stresses in subbases, TC2-L5N consistently exhibited lower subgrade compressive stresses compared to its counterparts. The PANDA-AP predicted stresses on top of the subgrade did not manifest such disparity. Overall, the predicted compressive stresses were consistently lower than the measured stresses on top of the subsurface layers. The absence of stress-dependent constitutive models for the corresponding materials led to the discrepancy between the measured and predicted stresses.
Conclusions
This paper investigated the rutting potential of neat binder warm mix with organic additive, 20% RAP and latex under the influence of high temperature and tire pressure. The addition of latex was intended to bump up the high temperature performance grade equivalent to PG76-22 as required for aircraft gross weights over 444.8 kN (100 kips). Accordingly, three different test lanes were constructed at the NAPMRC. The control lane (lane-1) was surfaced with polymer modified P-401 hot mix. The surface lifts of indoor lanes 5 and 6 comprise mixes without and with RAP, respectively for the rutting assessment of RAP in surface mix. The north sections were trafficked with a 272.7 kN (61.3 kips) wheel load at a consistent temperature of 48.9°C controlled 5.1 cm (2 in.) below the surface. Accumulation of surface rut was periodically monitored with the increase in number of passes. 3-D finite element analyses were conducted with the newly developed PANDA-AP software, replicating the stress conditions on as-built pavement structures during the TC2 traffic tests in TC2-L1N, TC2-L5N, and TC2-L6N. The following list highlights the key observations.
Rut depth was closely monitored during the actual traffic tests in north sections of all the test lanes alongside traffic test temperature. Despite the temperature control effort at 5.1 cm (2 in.) depth, temperature distribution was non-uniform over the depth of AC for all the test lanes.
RAP mixes placed at the indoor area of NAPMRC exhibited excellent rutting performance during the traffic tests. The inclusion of RAP and latex into the neat binder mix seemed to enhance the rutting resistance of AC mixes and furnish performance equivalent to polymer modified hot and warm mixes.
Thinner AC layers in TC2-L5N and TC2-L6N contributed to higher accumulation of dilative heave.
Post-traffic distress mapping indicated rutting in the subsurface layer of TC2-L1N owing to the higher application of traffic passes compared with its counterparts.
Finite element analyses with PANDA-AP predicted LVE tensile strains comparable with those measured during the TC2 traffic tests. Temperature in the AC layer had stronger influence on both predicted and measured tensile strains in TC2-L5N compared with those in TC2-L1N and TC2-L6N.
Use of RAP in the surface mix did not increase the rutting susceptibility of latex-treated PG64-22 WMA in comparison with that of the polymer-modified control HMA. However, the presence of hardened binder in RAP may compound the adverse effects of long-term aging, leading to erosion of asphalt mastic, loss of adhesion between the aggregates and asphalt binder. Therefore, additional tests that characterize raveling and scuffing of long-term aged asphalt mixes with RAP are required before RAP is allowed in surface mixes to prevent foreign object debris (FOD) issues. Incorporation of viscoplastic, viscodamage constitutive models for AC and stress-dependent behavior of subsurface materials is integral to the successful implementation of mechanistic design of resilient pavement structures with new generation AC mixes. The features being added to the PANDA-AP software will be the essential building blocks to ensure reasonable accuracy in the performance prediction and cost-effective design optimization.
Footnotes
Acknowledgements
The work described in this paper was supported by the FAA Airport Technology Research and Development Branch. The authors would also like to acknowledge the support of Murphy Flynn, Wilfredo Villafane, Matthew Brynick (FAA), Peter Millar (Dynatest), Khaled Hamad, Dennis Bataille, and Matthew Willson (CSRA), John Gerke, Christopher Tomlinson, Maoyun Li, Russell Knieriem, Nicklas Harvey, and Seth Baer (ARA) for their support during construction and testing of pavements. Special thanks go to Professors Dallas Little (Texas A&M University) and Masoud Darabi (University of Kansas) for the ongoing development of the PANDA-AP software and considerate guidance. The contents of this paper reflect the views of the authors, who are responsible for the facts and accuracy of the data presented within. The contents do not necessarily reflect the official views and policies of the FAA. The paper does not constitute a standard, specification, or regulation.
Author Contributions
The authors confirm contribution to the paper as follows: Study conception and design: Navneet Garg; data collection: Navneet Garg, Hasan Kazmee, Dario Batioja Alvarez, and Lia Ricalde; analysis and interpretation of results: Hasan Kazmee, Navneet Garg, Dario Batioja Alvarez, and Lia Ricalde; draft manuscript preparation: Hasan Kazmee. All authors reviewed the results and approved the final version of the manuscript.
Declaration of Conflicting Interests
The authors declared no potential conflicts of interest with respect to the research, authorship, and/or publication of this article.
Funding
The authors disclosed receipt of the following financial support for the research, authorship, and/or publication of this article: This work was supported by the Federal Aviation Administration under Task Order 692M15-21-F-00215, issued for NAPMRC Support Test Cycle 2 (TC-2) Data Analysis and Reporting. The associated contract number is 692M15-21-D-00004.
Data Accessibility Statement
The data that support the findings of this paper will be available in the FAA public domain.